Buoyancy Versus Local Stress Field Control on the Velocity of Magma Propagation: Insight From Analog and Numerical Modelling
 Virginie Pinel
 Séverine Furst
 Francesco Maccaferri
 Delphine Smittarello
- 1Université Grenoble Alpes, Université Savoie Mont Blanc, CNRS, IRD, Université Gustave Eiffel, ISTerre, Grenoble, France
- 2Istituto Nazionale di Geofisica e Vulcanologia, Sezione di Napoli—Osservatorio Vesuviano, Napoli, Italy
- 3European Center for Geodynamics and Seismology, Walferdange, Luxembourg
Magmatic dykes interact with heterogeneous crustal stress. As a result, their propagation towards the surface can be tortuous and their propagation velocity may vary. While the deflection of dykes in response to the local stress field has been addressed by several studies, less has been done about the effect on their propagation velocity. Understanding under which conditions an intrusion may accelerate or decelerate due to crustal stress heterogeneities has obvious important implications in terms of forecasting the timing of the onset of the eruption. Here we analyse the velocity of fluid-filled crack propagation in a gelatin block characterized by a heterogenous stress field considering the case study of a load applied at the surface. We find that a crack deflected towards the load and its underlying compressive stress field is decelerated. By comparing experimental results with numerical solutions, we evidence the potential complementary role played by stress field variations and changes in trajectory orientation, controling the buoyancy, on the velocity of magma propagation. We also show that the energy release estimated along the crack path by simplified numerical models appears to be a good proxy for the velocity. We conclude that numerical models allowing for magma path estimations could also be used to infer magma velocity variations. In addition, 1D numerical models solving for the fluid flow along a prescribed path, provide velocity variation as a function of the surrounding stress field and the magma driving pressure.
1 Introduction
Significant progress has recently been made in forecasting eruptive vent location by applying a statistical approach and considering a magma path controlled by the local stress field, i.e. an opening of the magma intrusion perpendicular to the least compressive stress component, σ3 (Rivalta et al., 2019; Mantiloni et al., 2021). This promising approach could be further improved by considering the magma path resulting from the balance between the stress field and the magma driving pressure (Watanabe et al., 2002; Pinel et al., 2017; Maccaferri et al., 2019). It could also benefit from the recent development of three dimensional models for fluid filled fracture propagation (Zia and Lecampion, 2020; Davis et al., 2021). While possible locations for vent opening are definitely a key piece of information for assessing volcanic risk in regions of distributed volcanism, constraining the timing of the intrusion process is also fundamental. Whereas the vent location results from the magma path, information on the velocity of propagation is needed to address the timing of the vent opening. To date, limited effort has been made to understand what controls the velocity of the magmatic intrusion, its variations and, consequently, when magma will reach the surface.
Quantitative information on dyke propagation velocity comes from seismicity migration and geodetic data, with some well-documented examples of vertical propagation, particularly at Piton de la Fournaise [e.g., Aoki et al. (1999); Battaglia et al. (2005); Peltier et al. (2005); Beauducel et al. (2020)], and many detailed studies of horizontal propagation [e.g., Einarsson and Brandsdottir (1980); Toda et al. (2002); Marti et al. (2013); Sigmundsson et al. (2015); Smittarello et al. (2019); Lengliné et al. (2021)]. From these geophysical monitoring observations, it appears that lateral propagation is usually slower than vertical ascent, in particular vertical velocities at Piton de la Fournaise have been estimated to be around 2 m/s at shallow level whereas horizontal velocities range between 0.2 and 0.8 m/s (Toutain et al., 1992; Peltier et al., 2005). This difference in velocity could probably be related to the limited role of buoyancy in driving magma propagation for lateral transport. Another well-described feature is that the velocity does not remain constant during propagation. A near-surface acceleration of vertically rising magmas (Battaglia et al., 2005) and a decrease in velocity along the lateral propagation (Einarsson and Brandsdottir, 1980; Lengliné et al., 2021) have been documented. Phases of deceleration and thickening of intrusions have been described, sometimes resuming with rapid magma progression (Sigmundsson et al., 2015; Smittarello et al., 2019) or ending by an arrest of the intrusion precluding any eruption (Pedersen and Sigmundsson, 2006).
Analog experiments have led to a better understanding of the variations in propagation velocity experienced by fluid-filled cracks. The velocity of buoyant fluids rising up within a gelatin block has been described in several experimental studies (Takada, 1990; Heimpel and Olson, 1994; Rivalta et al., 2005; Rivalta and Dahm, 2006; Taisne and Tait, 2011). After the injection phase, a finite volume of fluid ascending by buoyancy in a homogenous gelatin tank characterized by an hydrostatic stress field reaches a constant velocity. The ascent rate remains constant as long as the crack is far enough from the free surface. An acceleration is observed when the crack approaches the free surface; this occurs at a depth which increases with the crack length (Rivalta et al., 2005; Rivalta and Dahm, 2006). Rivalta et al. (2005) also reported changes in velocity of air-filled cracks approaching rheological boundaries. The acceleration due to the free surface has been interpreted in terms of a depth-dependent effective fracture toughness by Rivalta and Dahm (2006). Decelerations of air- or oil-filled cracks propagating under surface loads or topographic highs were attributed to an increase in the compressive stress field inhibiting crack opening. In particular, Watanabe et al. (2002) described a velocity decrease affecting an oil-filled crack rising vertically below the center of a load applied at the surface [Figure 7 of Watanabe et al. (2002)]. Similarly, a decrease in velocity has been reported for air-filled cracks rising vertically below the centre of a caldera and being deflected towards the caldera rim (Corbi et al., 2016).
In theory, the velocity of a fluid-filled fracture is influenced by the competition of two dissipative processes: viscous flow and fracture surface creation (Rivalta et al., 2015; Lecampion et al., 2018). Fracture-dominated models neglect the fluid flow such that they give no direct information about the crack propagation velocity. However they can provide crack shapes, account for the crack interaction with heterogeneous stress fields and crustal heterogeneity, and compute the direction of crack growth. For instance, Maccaferri et al. (2019) used this modeling approach to calculate the path followed by air-filled cracks rising at some lateral distance from a load applied at the surface of a gelatin tank and compared them with the trajectories recorded in analog experiments. The external stress field induced by the load is responsible for the deflection of an intrusion toward the loaded region at the surface, which will follow a trajectory that depends on the magnitude of the loading, the fluid overpressure, and the crack length (Dahm, 2000; Watanabe et al., 2002; Bonaccorso et al., 2010; Maccaferri et al., 2011, 2019). Despite fairly good agreement between the trajectories recorded in experiments and the one derived from the numerical calculation, some discrepancies exist such that the simulated air-filled cracks appears to be more sensitive to the external stress field. The various possible causes of these differences are discussed by Maccaferri et al. (2019) and include the 2D assumption used in the numerical model. Viscous dominated models take into account the dynamics of magma flow but neglect the fracturing process, and can provide the propagation velocity of fluid-filled fractures. Therefore, these models have been used to study the velocity of magmatic dykes, and to investigate the effect of different factors, such as the connection to a feeding storage zone (Mériaux and Jaupart, 1995; Traversa et al., 2010), variations in rock densities (Taisne and Jaupart, 2009; Traversa et al., 2010) and a heterogeneous stress field. In particular, a decrease in velocity potentially leading to cessation of propagation was described for magma entering the compressive stress field beneath a surface load (Pinel and Jaupart, 2000; Pinel et al., 2017). The velocity decrease observed during lateral propagation was first approximated using a fluid flow model within a rigid rectangular dyke, with the length of the dyke increasing proportionally to the square root of time (Einarsson and Brandsdottir, 1980). More recently, a fully coupled simulation of the dyke horizontal propagation in two dimensions has favoured a growth of the dyke approximately proportional to the logarithm of time (Grossman-Ponemon et al., 2020). However, with the exception of lateral propagation, magma buoyancy is the main driving force for magma ascent and little attention has been paid to the velocity variations due to changes in buoyancy along the path. These variations are not only due to stratification of crustal rock densities and changes in magma density by gas exsolution, as considered earlier [e.g., Taisne and Jaupart (2009; 2011)], but also result from the change in the inclination of the magma path. As the magma trajectory is influenced by the local stress field and the buoyancy depends on the trajectory’s slope, we expect a strong interaction between the stress field and buoyancy effects, which is the main focus of the present study.
In this study, we analyze the combined effects of buoyancy and the local stress field on the propagation velocity of fluid intrusions in an elastic medium. To illustrate the influence of a heterogeneous stress field, we consider the perturbation induced by surface loading as a case study. Besides, the influence of topographic loads in deflecting the trajectory of magmatic intrusions has been described in various settings (Bonaccorso et al., 2010; Maccaferri et al., 2015, 2017). Here we show results from 15 analog experiments of air-filled crack propagation in a gelatin block subject to surface loading. Maccaferri et al. (2019) studied the trajectories followed by the air-filled cracks for the same set of experiments, while here we focus on the velocity variations along those trajectories. In addition, here we also make use of the data published in Watanabe et al. (2002), for analog experiments of oil-filled crack propagation rising vertically below the center of a surface load. These observations are interpreted in terms of buoyancy variations due to changes in the dip of the fluid trajectory, and in terms of the local stress field estimated by finite element modeling. The velocity variations are compared to the gravitational and strain energy released by a fluid-filled crack moving along the recorded trajectory using a two-dimensional boundary element model for inviscid fluids. Finally, we independently calculate the velocity derived from a dynamic model for viscous flow within a fracture propagating along the prescribed path.
2 Materials and Methods
2.1 Analog Experiments: Crack Velocity Estimation and Stress Field Calculation
In this study, we use the 15 experiments described in Maccaferri et al. (2019). Whereas this previous study focused on the description of the parameters influencing the crack path, we here focus on the description and interpretation of the velocity of the propagating cracks. A detailed description of the experiments is provided in Maccaferri et al. (2019), here we summarise the experimental protocol and provide new information on the velocity measurements. We performed experiments of air-filled crack propagation into a transparent brittle-elastic gelatin block, whose stress field is perturbed by a load applied at the surface (Figure 1 for the experimental setup description). A rectangular Plexiglas tank of 40 (length) × 20 (depth) × 20 (height) cm was filled with 16 L of liquid gelatin (concentration of 2% by weight) and was put in a fridge for 20 h at a temperature of 5°C, where it solidified while remaining in a fully hydrostatic state of stress. We assume that the Poisson’s ratio (ν) for gelatin is 0.5 (Kavanagh et al., 2013). The gelatin rigidity (Young’s modulus, E) was quantified for each tank by measuring the maximum vertical displacement at the surface due to the loading. This displacement is interpreted using a 3D Finite Element Model of the strain and stress induced inside the gelatin block by the rigid load, as detailed in Smittarello et al. (2021). We estimated E to be 2,150 ± 230 Pa with no significant variations between various experiments. At room temperature, we injected a controlled volume of air with a syringe from a given hole at the base of the tank (Figure 1). Several injections (up to 4) were performed successively in the same tank, using different holes and ensuring that the new paths were not affected by the previous ones. A sheet-like, air-filled crack formed and started propagating upward due to buoyancy. When the intrusion reached a chosen depth (Zs), the loading mass was put on the surface of the gelatin block, at the chosen horizontal distance from the air-filled crack (Xs). The load applied at the surface was a metal plate with rectangular base of 6 (length) × 14 (depth) cm and mass ranging between 25.4 and 262.9 g (the load applied for each experiment is given in Table 1). In order to match the experimental setting used by Watanabe et al. (2002), we tried to set the starting depth and horizontal distance at, respectively, 2.7 times and 2.8 times the half-length of the load (i.e., 8.1 and 8.4 cm). We applied the load manually based on a visual estimation of the distance. In addition, the application of the load sometimes induces vibrations inside the gelatin for a few seconds and we start the analysis after the gelatin has reached a state of equilibrium. It follows that in practice, both Zs and Xs were slightly different from the prescribed values and experimental values that are reported in Table 1. This load applied at the surface induces a heterogeneous stress field within the underlying gelatin. A compressive stress is created under the load, the magnitude of which varies with the magnitude of the applied pressure and is slightly influenced by the position of the load relative to the tank walls.
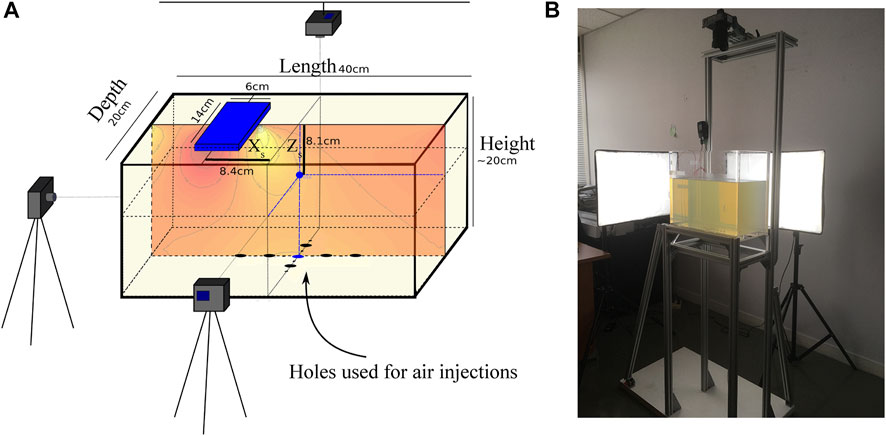
FIGURE 1. Experimental setup used to performed the air injections. (A) Sketch of the gelatin container. Air is injected through holes in the bottom of the tank, the blue dot is for the position of the air-filled crack tip when the load is applied at the surface and is characterized by its horizontal (Xs) and vertical (Zs) distances from the center of the load. A cross-section along the plane y = 0 shows the shear stress induced by the rigid load and numerically estimated with COMSOL. (B) Photograph of the experimental setup.
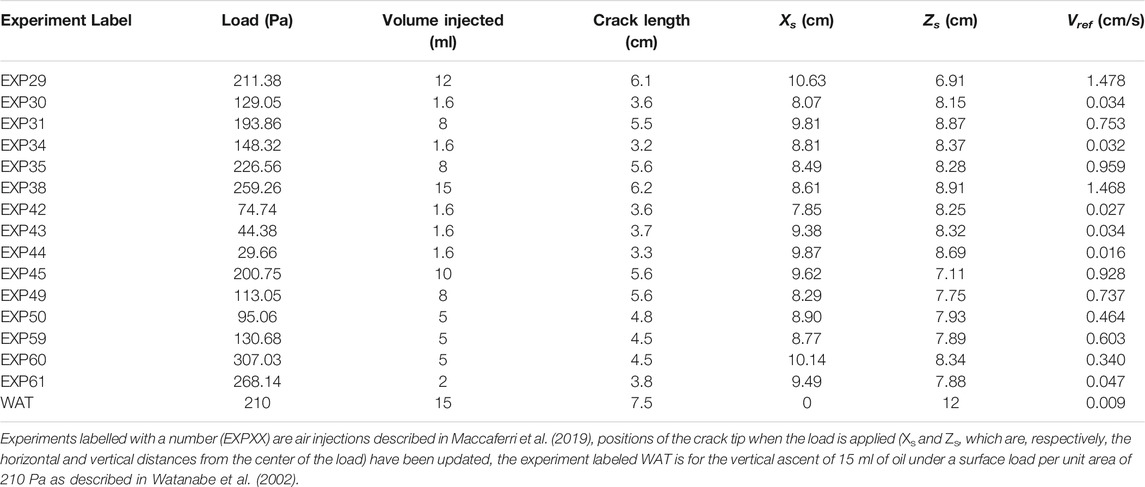
TABLE 1. Velocity of reference Vref for all experiments considered.
Three perpendicular cameras recorded the fluid-filled crack shape and path. Two spotlights illuminated the tank from the back and right sides (Figure 1). At the end of each experiment, we took several pictures of a ruler at different locations inside the gelatin block, in order to calculate the calibration factor F needed to scale the videos. The Software TRACKER is used to measure the dimensions of the air-filled cracks and to extract their velocities and trajectories. The whole propagation is monitored, from the initiation of the crack up to the surface, but we hereafter consider only the propagation after adding the load on the gelatin. The positions of the crack tip as a function of time obtained with TRACKER are analysed with MATLAB to derive both the horizontal and vertical component of the velocity along the propagation path. Outliers are removed and velocity is filtered using a one dimensional median filter. In fact, first velocity estimations may show some outliers due to perturbations induced by applying the load; however the velocity does not vary significantly in the first centimetre following this initial perturbation. We use this part of the velocity evolution (grey rectangle in Figure 2) to estimate a reference value of the velocity characterising the behaviour of the vertical crack (Figure 2).
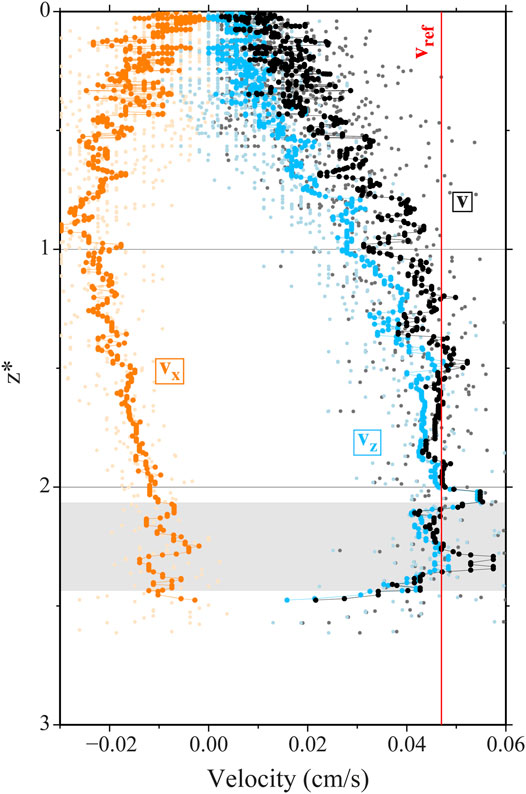
FIGURE 2. Various components of the velocity of the crack recorded during experiment 61 (EXP61). The horizontal (Vx in orange) and vertical (Vz in blue) component of the velocity are obtained by deriving the position of the crack with regards to the time. The total velocity (V represented in black) is the norm calculated from the two velocity components. Pale dots are for the points given by TRACKER while the vivid ones are for the filtered values. The first centimetre of the velocity at the bottom (grey area) is used to define a velocity of reference (Vref), expected to be close to the one observed for a vertically rising crack and represented by the red vertical line.
The three dimensional stress field inside the gelatin is calculated for each experiment using the exact position of the load with COMSOL Finite Element model in order to take into account the effect of the rigid walls of the tank (zero displacement condition applied to the lateral and bottom boundaries of the gelatin to reproduce the adherence of the gelatin to the tank walls). We use a mesh made of about 330,000 tetrahedral units, refined in a vertical plane centred below the load as well as on the upper surface around the load (maximum size of the mesh is set to 2 mm on these surfaces). The upper surface is considered as a free surface except where the load is applied. We apply a condition of zero horizontal displacement to the lateral edge of a rigid plate (rigidity of 109 Pa and thickness of 4 mm) to simulate the load [see Smittarello et al. (2021) for detailed explanations.]. In practice, performing a 2D calculation in plane strain approximation for the vertical plane centred below the load, results in a similar stress field estimation with increased resolution, such that in the following we use the 2D approximation for stress field estimations along the crack path. Comparison between 3D and 2D stress field is presented in Supplementary Figure S1 of Supplementary Material.
To complement our dataset of an air-filled crack initially rising at some lateral distance from the applied load, we also use the data published by Watanabe et al. (2002), which provide the velocity of oil-filled cracks rising just below the center of a surface load. These experiments were performed in a rectangular tank (58.5 cm in length, 26 cm in depth and 35 cm in height), the applied load had a rectangular base of 9 (length) × 20 (depth) cm and the rigidity of the gelatin is reported to be 270 Pa.
2.2 Numerical Modeling
2.2.1 2D Boundary Element Model for Inviscid Fluid-Filled Crack Propagation
Crack path inside the gelatin is modeled using the two-dimensional Boundary Element (BE) model described in Maccaferri et al. (2010, 2011). The intrusions are modeled as boundary element mixed-mode cracks in plane strain approximation and are composed of N contiguous and interacting dislocations of length ranging between 0.035 and 0.075 cm, in an elastic half-space, with N in the range 50–100. The fluid-filled crack opens and slips under normal and shear stresses constraints, which are given by the fluid overpressure and by the shear component of the external stress field, respectively. The overpressure within the crack is defined as the difference between the fluid pressure and the normal component of the external stress (σn, with respect to the orientation of each dislocation element). The fluid pressure profile is hydrostatic (linear and depth dependent), and the fluid density (density set at 0 for the air and 810 kg/m3 for the oil) and pressure account for fluid compressibility (set at 10–5 Pa−1 for the air and at 10–9 Pa−1 for the oil). The external stress is the stress acting within the gelatin and results from the superposition of an isotropic, depth-dependent, lithostatic stress (ρgel × g × z, where ρgel, is the density of the gelatin set to 1,020 kg/m3, g is the acceleration due to gravity, and z is the depth) and the elastic stress induced by loading of the surface as estimated with COMSOL FE model (section 2.1). Elastic properties of the solid medium are fixed based on gelatin physical properties. We set the cross-sectional area of the crack (2-D volume of the intrusion) in order to obtain a starting length of the fluid-filled crack equal to the one measured in the experiments, as reported in Maccaferri et al. (2019) and Watanabe et al. (2002) (values listed in Table 1). The elastic and gravitational energy release are estimated along the trajectory as detailed in Maccaferri et al. (2011). Trajectories are obtained by incremental elongations of the crack in the direction that maximises this energy release. In the present study we are using the fluid-filled crack propagation model to solve for the crack shape, and compute the energy release, along specific paths of interest. Therefore, we run new numerical simulations imposing the trajectory, instead of solving for it, following either the direction of the maximum compressive stress, σ1, or the paths followed by the air-cracks in analog experiments. In all cases, we always start from a vertical initial crack. Following Watanabe et al. (2002), along each trajectory, we can define a proxy for the buoyancy σbuoy as:
with Lz the crack vertical extension. Note that, as vertical extension controls buoyancy, the dip of the crack has a strong influence on this driving pressure. We also perform numerical simulation artificially removing the effect of the upper free surface. This is done by adding an upper medium above the gelatin with zero density and the same elastic parameters as the gelatin.
2.2.2 Cross-Correlation Analysis Between Measured Velocity and Intrusion Parameters
In order to get better insights about what causes the observed velocity variations, we extract several parameters from the numerical simulations of the experiments, such as the fluid overpressure, the normal component of the stress field, the buoyancy at the crack tip, and the energy release. We then calculate the Pearson coefficient to quantify the linear correlation between the measured velocity and each of the parameters we derived from the numerical simulations, all as function of depth. The Pearson coefficient quantifies the direction and strength of a linear correlation taking values between −1 and 1, with 0 implying no linear correlation between the two sets of variables, and values close to 1 or −1, implying a positive or negative linear correlation, respectively.
2.2.3 1D Dynamic Propagation Along a Prescribed Path
We model the propagation of a viscous fluid-filled fracture along the path followed by the crack in analog experiments using the method described in Pinel et al. (2017). Following the approach of Lister (1990a, b), this dynamic model takes into account a viscous dominated-regime by neglecting the strength of the surrounding rocks and focusing on the balance between buoyancy, viscous pressure, and elastic stresses. While these simulations may not be appropriate to describe air injections into gelatin, as the viscosity of air is very low, it is useful for understanding magma propagation in a similar context. The dyke cross section on a plane perpendicular to the trajectory is taken as an ellipse of constant half-breadth a. We solve for the opening (ellipse semi-axis, b) as a function of the time and the coordinate along the trajectory (described by the curvilinear abscissa s). The balance of the stresses perpendicular to the dyke plane can be expressed as follows:
where Δσ is the fluid overpressure, ΔPo is the fluid overpressure at the fracture bottom, corresponding to the reservoir overpressure in natural cases, σn is the component perpendicular to the fracture wall of the external stress field induced by the load as calculated using the FE model COMSOL, and p is the viscous pressure drop induced by the flow considering the fluid as Newtonian, viscous and incompressible (p being equal to zero for a static dyke). The values of σn calculated from COMSOL are interpolated along the trajectory with a rational equation of degree four in order to have an analytical expression for the function σn(s) and its first and second derivatives. When simulating the experiments of air injections, the system is characterized by two dimensionless numbers
comparing the maximum buoyancy force (for a fluid-filled crack of vertical extent Zs) with the source overpressure; and
which compares the total fluid driving pressure with the applied loading pressure.
Following Traversa et al. (2010), the timescale [t] for opening the crack over a length Zs with a uniform overpressure ΔPo can be expressed as
with μ the magma viscosity. We thus scale the velocity of propagation by
In the numerical simulations we have to set a positive “bottom overpressure” condition (the fluid-filled crack is always connected with a pressurized reservoir, in the numerical model). This does not strictly match the experimental conditions, as our air-filled cracks disconnect from their source, right after the air injection is finished. However, we can still apply the numerical model using different bottom overpressure conditions and evaluate its effect in comparison with the buoyancy force (which is the only driving force in the experiments).
3 Results
3.1 Velocity Variations in Analog Experiments
The reference velocity (Figure 2) corresponding to the vertical ascent in absence of stress field perturbation is reported in Table 1 for all the experiments considered. This velocity depends on the density contrast between the injected fluid and the gelatin, the elastic properties of the gelatin and the crack length (Takada, 1990; Heimpel and Olson, 1994). When considering the 15 experiments of air injection, characterized by the same gelatin physical properties, this velocity is proportional to the volume of fluid injected (Supplementary Figure S2 of supplementary material), which is consistent with the finding of Takada (1990), the volume being proportional to the crack length to the power of four (Smittarello et al., 2021).
Figure 3 shows the relative velocity variations with respect to the reference velocity along the path followed by cracks propagating inside the heterogeneous stress field induced by the load applied at the surface. When a load is applied with a lateral offset over a vertically ascending crack, this crack tends to be deflected towards the load. This deflection increases with the ratio between the amplitude of the applied load and fluid pressure (Watanabe et al., 2002; Maccaferri et al., 2019) and is more pronounced for shorter cracks (Maccaferri et al., 2019). On Figure 3 we can observe a significant velocity decrease along the two most deflected trajectories (experiments EXP61 and EXP34). The same velocity decrease is also seen for the crack rising vertically below the load as previously described by Watanabe et al. (2002). For the crack ascending below the load, the observed velocity decrease is explained by the crack propagation inside the compressive stress field induced by the load as modelled by Pinel et al. (2017), whereas for the deflected ones this velocity decrease occurs at a normalized depth around 1, that is to say well before the crack reaches the compressive stress field (represented in dark brown on Figure 3). A significant velocity increase is also observed close to the surface for several of the trajectories reaching the surface at some distance from the load: experiments EXP60, EXP45 and EXP31, for instance, show a clear acceleration, consistently with the free-surface effect described by Rivalta et al. (2005) and Rivalta and Dahm (2006). However, not all the experiments show this effect (cf. EXP49 in Figure 3). This may be due to the stiffening of the gelatin surface which may have occurred because of water evaporation (Kavanagh et al., 2013). This process is expected to affect only the surface of the gelatin, it does not induce any change in the Young’s modulus of the gelatin at depth (below a few mm from the surface) so that no significant change is recorded in the Young’s modulus measurements by surface loading.
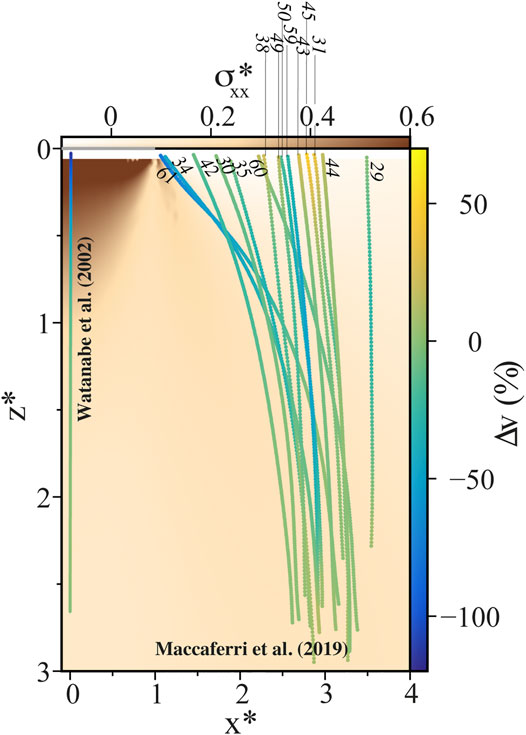
FIGURE 3. Velocity variations along the trajectory followed by the ascending fluid-filled crack recorded in analog experiments. The velocity variation is relative to the velocity of reference (Vref) defined as the mean value of the velocity estimated over 1 cm at the bottom of trajectory (Figure 2; Table 1 for values of Vref). Results from the 15 air injections described in Maccaferri et al. (2019) are represented (labels in italic are for the experiment number) together with the result provided by Watanabe et al. (2002) for a vertical ascent below a 210 Pa load [Figure 7 of Watanabe et al. (2002)]. The horizontal component
3.2 Insight From BE Model Solving for Inviscid Fluid-Filled Crack Propagation
In order to investigate the cause of the velocity decrease observed for cracks rising vertically below the load and for cracks deflected towards the load, we simulated the crack ascent for the vertically ascending crack of Watanabe et al. (2002) and for our experiment EXP61 (cf. Tab. 1, WAT and EXP61, respectively). Figure 4 shows the evolution of the buoyancy (Figure 4B) and of the normal component of the stress field induced by the load (Figure 4C) along the experimental paths (trajectories 1 and 4 in Figure 4A). Figure 4B shows that buoyancy is constant along the vertical crack trajectory, and it always decreases along the trajectory followed by experiment EXP61. This decrease is due to the dip of the trajectory, and reaches its maximum gradient at a normalized depth around 0.5. Just beneath the surface, the dip of the trajectory being close to 45°, the buoyancy is reduced by 50%. Regarding the normal component of the stress field (Figure 4C), it decreases continuously along the trajectory of experiment EXP61 due to the fact that the crack remains outside the most compressive area. This decrease is expected to favor the crack opening and its propagation. On the contrary, the normal compressive stress increases along the trajectory for the crack ascending vertically below the load. We can thus conclude that whereas the velocity decrease observed in experiment WAT is clearly due to the compressive stress field for the vertical crack, which corresponds to the effect modeled in Pinel et al. (2017), for the deflected experimental path (experiment EXP61) the velocity decrease recorded only results from the reduction of buoyancy induced by the horizontalization of the magma trajectory. In this case, the effect of the stress field is only indirect, inducing deflection of the trajectory, which leads to a reduction in buoyancy. Note that for a crack rising vertically away from the surface load, no change in buoyancy or significant change in the stress field occurs along the path, so the velocity does not change significantly (see EXP29 in Figure 3). We performed the same analysis along two additional trajectories relative to experiment EXP61: one was obtained using the BE model to compute the energetically-preferred path, and the other was obtained following the direction perpendicular to σ3 and aligned with σ1 (which is widely used as proxy for the propagation path of hydrofractures). The results are shown in Figure 4 and labeled as curves three and two, respectively. We always start with an initially vertical crack. When the BE crack follows the direction of σ1 (trajectory number two in Figure 4A), the upper tip of the crack will be subject to a very sharp deflection at the beginning of the propagation. This causes a faster decrease of the normalized buoyancy parameter with respect to the other simulations (Figure 4B). This fast decrease in σbuoy (curve number two in Figure 4B) continues until the BE crack has fully entered the curved trajectory, or—in other worlds—when the lower tip of the crack reaches the starting depth of the upper tip, Zs. After this point the buoyancy parameter starts to increase again, due to the overall verticalization of the crack orientation. Along the trajectory derived from the BE model (curve three in Figure 4B), the buoyancy decreases faster than in the experimental trajectory EXP61, and it starts to increase again before reaching the surface load (consistently with the trajectory from the BE model being deflected at deeper depth with respect to the experimental trajectory EXP61). The normal stress experienced by the crack approaching the loading (curve 3 Figure 4C) is also remarkably different from the one in experimental trajectory EXP61 (curve 4, Figure 4C): in fact, even if the BE trajectory ends approximately in the same location as the experiment EXP61, the dip angle of these two cracks are very different, hence the normal component of the stress field they experience are different. These differences are even larger when comparing the σ1 trajectory with the experimental trajectory EXP61, curves two in Figures 4A–C. Given these results, it appears to be important to use the parameters extracted along the experimental trajectory (rather that the ones obtained with the BE model or, worst, with the σ1 trajectory) in order to compare them with the velocity variations observed for the analog experiments. We will thus follow this strategy, and in the following we will always refer to the parameters extracted from the BE model results along the trajectory that was actually followed by the experimental crack.
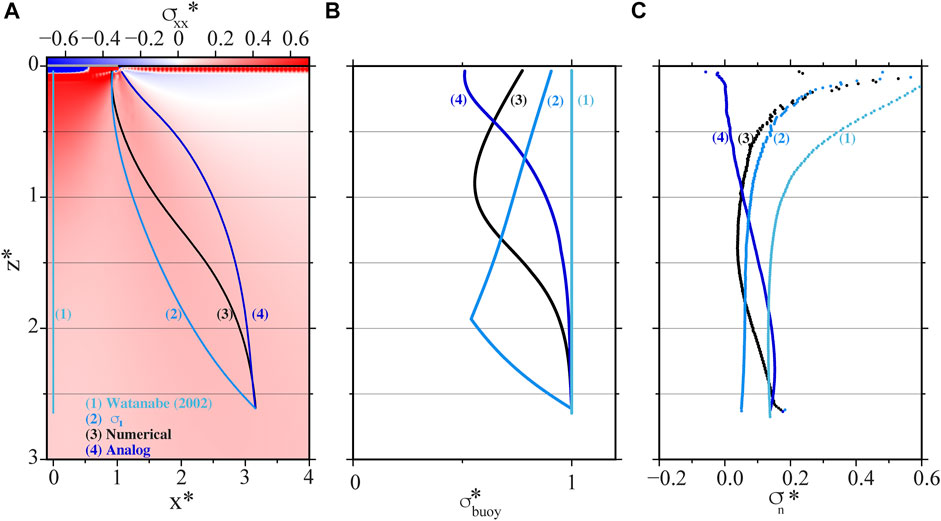
FIGURE 4. Numerical analysis of deflected air-filled crack for experiment EXP61 and for the vertical rising oil-filled crack described by Watanabe et al. (2002). (A) Various trajectories represented superimposed on the horizontal component
The BE model is based on a quasi-static approach which cannot provide any insight into the velocity of propagation. However, it provides the energy release associated with the crack propagation. The energy release represents the excess between the energy gained at a propagation-step of the BE model (crack elongation), and the energy spent to fracture the host medium at the crack tip. However, a physical process should conserve the total energy of the system, so what is the meaning of such positive energy release? What is not considered in this model are all the possible forms of energy dissipation related with the dynamic of the fluid-filled fracture propagation process (fluid viscosity, plastic effects at the crack tip, elastic wave emission, and possibly more): the energy dissipation should equal the energy release to balance the total energy budget. This implies that the larger is the energy release associated with the crack propagation, the larger should be the energy dissipated by dynamic processes (which are velocity dependent). Therefore the energy release may correlate with the velocity of crack propagation. In order to check this hypothesis, we compare both values, energy release and velocity, for experiments showing a significant velocity variation along the trajectory: the vertical crack ascending below the load as well as the most deflected path (EXP61). We also perform this analysis on a less deflected crack showing a marked acceleration at shallow depth (EXP60) and a crack rising vertically away from the surface load with no significant velocity variation (EXP29). Results are presented in Figure 5. For experiments WAT and EXP61 the energy release (red line in Figures 5C,F) decreases when the crack rises towards the surface, which appears consistent with the observed velocity decrease (Figures 5B,E). However at shallow depth, there is an increase in the energy release, which is not observed in the velocity. This increase of the energy release is due to the free surface, which causes an effective reduction of the fracture toughness (Rivalta and Dahm, 2006). However, the free surface condition may not be realistic for a crack approaching a rigid load at surface. To correct for it, we run the BE simulations removing the free surface (circles in panels c and f of Figure 5), and in fact we obtain more consistent results for the energy release when compared with the recorded velocity. For EXP60, there is a slight velocity increase due the crack inclination but this time the most important feature in the velocity evolution is the strong velocity increase at shallow depth consistent with the energy release when considering the free surface (plain line in Figure 5I). For EXP29, no significant velocity variation is observed even if a velocity increase at shallow depth seems to be observed consistently with the free surface effect. From our numerical results, the free surface effect occurs at larger depth for longer vertical cracks (Supplementary Figure S3 of Supplementary Material. We also notice that for a given crack length, the free surface influence occurs at shallower depth for inclined cracks when the angle between the trajectory and the vertical becomes larger than 40° (Supplementary Figure S4 of Supplementary Material).
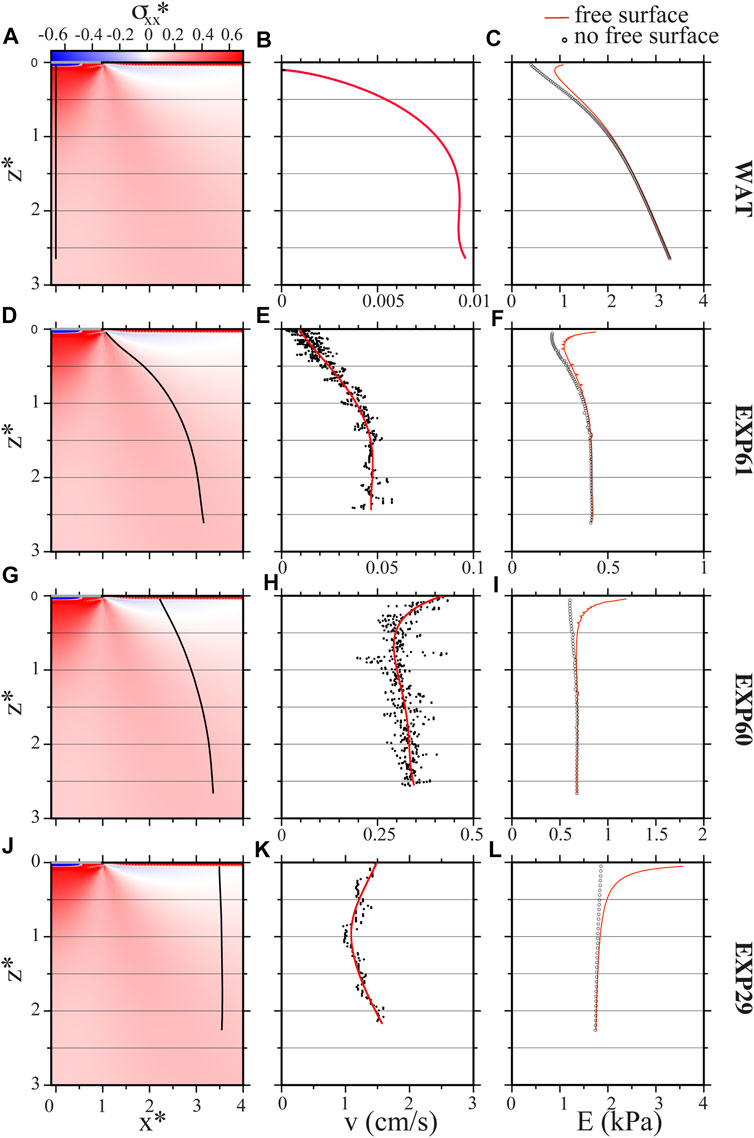
FIGURE 5. Comparison between the velocity evolution and the strain and potential energy release along the trajectory for four selected experiments: WAT from Watanabe et al. (2002) (A–C), EXP61 (D–F), EXP60 (G–I) and EXP29 (J–L) from Maccaferri et al. (2019). (A,D,G,J) Experimental path recorded represented superimposed on the horizontal component (σxx) of the stress field perturbation induced by the load applied at the surface. Stress is normalized by the pressure applied at the surface, compression is positive while tension is negative. Vertical and lateral dimensions are normalized by the half-length of the load applied at the surface. The grey line is for the position of the applied load. (B,E,H,K) Evolution of the recorded velocity as a function of depth (black dots are for the filtered velocity and the red line is an interpolation. For the experiment WAT, this interpolation was derived from values presented in Figure 7 of Watanabe et al. (2002). Note that the horizontal scale chosen is different for each experiment. (C,F,I,L) Strain and potential energy release along the trajectory derived from the BE model. Plain line in red is for the value obtained with a free surface and the circles in black are for the values obtained after the free surface was artificially removed. Note that the horizontal scale chosen is different for each experiment.
Finally, using the Pearson correlation coefficient, we were able to quantify the relation between velocity variations (Figure 6A) and energy release variations, the energy release being numerically calculated either considering the free surface or removing its effect (Figures 6B,C). Figure 6D shows correlation coefficients for all experimental trajectories, circles and inverted triangles being for energy release considering the free surface or removing it, respectively (note that the calculations performed without free surface are meant to better explain the experiments where the crack approaches the gelatin surface in correspondence of the loading plate). For most of the experiments performed, one of the Pearson coefficient is larger than 0.5, which indicates a positive linear correlation between the energy release along the trajectory and the velocity. For all cracks reaching the surface close to the load (at a distance from the load smaller than the length of the load, x* < 2), the Pearson correlation coefficient calculated is always larger when removing the free surface effect, which confirms that cracks reaching the surface below or close enough to the load experience a reduced free surface effect.
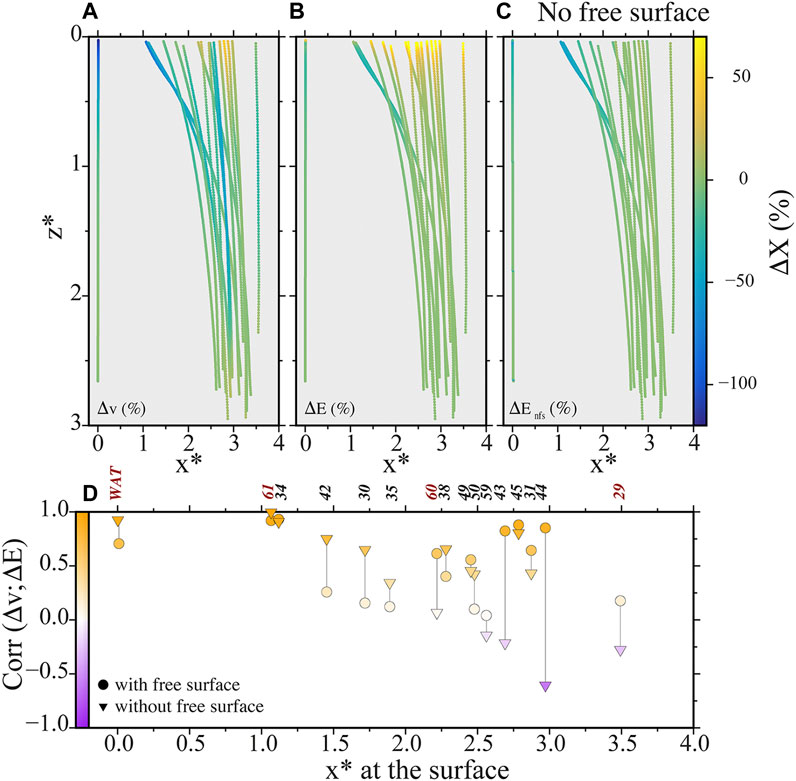
FIGURE 6. Comparison between the strain and potential energy release along the trajectory and the velocity evolution for all experimental trajectories. (A) Velocity variations as function of depth. The velocity variation is relative to the velocity of reference (Vref) as in Figure 3. (B) Strain and potential energy release variations along the trajectory derived from the BE model. Variations are relative to the mean value defined over 1 cm at bottom of the trajectory. (C) Similar to (B) when removing the effect of free surface. (D) Pearson correlation coefficient between the velocity and the energy release for all trajectories. Trajectories are labelled (in red for experiments displayed in Figure 5) and ranked as a function of the lateral position at which the crack reaches the surface. Circles and triangles are for coefficients considering the energy release obtained, respectively, with and without any free surface effect. Vertical and lateral dimensions are normalized by the half-length of the load applied at the surface.
3.3 Insight From Dynamic Model for Viscous Fluid-Filled Fracture Propagation
In addition to the BE model for inviscid fluids, we use a dynamic viscous fluid-filled fracture propagation model along the experimental trajectories (Pinel et al., 2017). This model provides velocity evolution along the trajectory based on the assumption that this velocity of the fracture tip is controlled by the Newtonian viscous fluid flow within the crack. We simulate the fracture propagation along the most deflected experimental path (EXP61) either taking into account the external stress field induced by the load or in absence of external stress field in order to separate the effect of the external stress and the trajectory inclination (solid and dotted lines in Figure 7). Based on the experimental record, we set Zs to 7.88 cm. The fracture half-breadth a is set to 1.4 cm. In experiment EXP61 the driving pressure is given by σbuoy and equal to 95 Pa while the load is 268 Pa, we accordingly set N2, which is the ratio between the driving fluid pressure and the load applied, to 0.35. We made simulations with N1 equal to 0, 1 and 3, considering no-buoyancy, buoyancy equal to the bottom overpressure, and buoyancy 3 times larger than the bottom overpressure, respectively. In Figure 7, we show the evolution of the dimensionless velocity [velocity scaled by [v] as defined in Eq. 6] along the analog path as a function of depth.
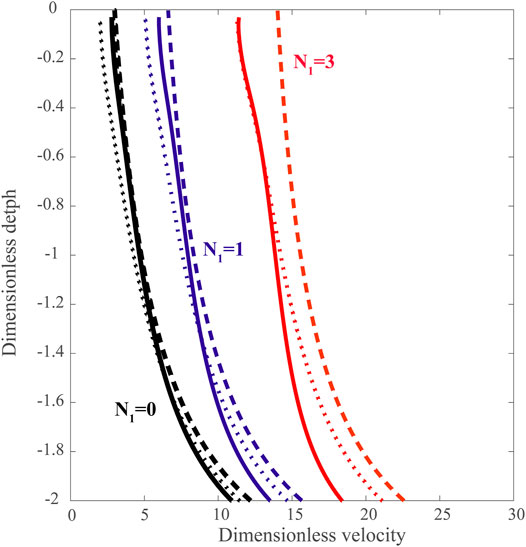
FIGURE 7. Dimensionless velocities of a fluid-fluid fracture propagating along a given trajectory as a function of depth derived from the dynamic numerical model. Depth is normalized by the half-length of the load applied at the surface. All fractures start at Xs and Zs corresponding to analog experiment EXP61 and dimensionless number N2 is set to 0.35. Black, blue and red lines are, respectively, for dimensionless number N1 equal to 0, 1 and 3. Plain lines are for velocities along the deflected path followed by the crack during experiment EXP61 considering the stress field induced by the load applied at the surface, dotted lines are for velocities in absence of external stress field along the deflected trajectory and dashed lines are for velocities along a vertical path without stress perturbation.
The curves in Figure 7 shift towards higher velocities for increasing values of N1 (from black to red in 7), consistently with larger buoyancy values producing faster fluid-filled cracks (given a constant total magma pressure). For all the simulations the velocity rapidly decreases during the first (deeper) part of the propagation path. In fact, this initial - rapid - velocity decrease is due to the bottom overpressure condition, and is not displayed in the experimental velocity measurements. Such effect is slightly smaller for larger N1 (i.e., when the contribution of buoyancy is larger), and indicates that the condition N1 = 3 is the most suitable to reproduce the velocity profiles observed in the air-filled crack experiments.
Focusing on the velocity decrease near the surface, for the simulations with N1 = 3, we get the most interesting features for our comparison with experiment EXP61: we notice that the velocities estimated without the loading stress field (red dotted line in Figure 7), overlap with the velocity obtained with the loading stress (red solid line in Figure 7). This proves that the shallow velocity decrease (also observed in the experiments) is fully due to the trajectory inclination, and is not directly due to the normal stress change along the path (which is negligible).
This is confirmed by the velocities obtained for fluid-filled fractures propagating vertically in a lithostatic stress field (dashed lines in Figure 7) which are larger than for the deflected path, the difference increasing with the buoyancy (larger differences for larger dimensionless numbers N1).
4 Discussion and Conclusion
Combined interpretation of experimental results and numerical models is extremely informative and may potentially lead to significant advances in the understanding of magma transport in the crust. While numerical models provide insight into the physics of the behavior recorded in experiments, analog work is essential to distinguish behaviours and to validate numerical models. Fracture-dominated models for fluid propagation which neglect the dynamics of fluid flow inside the fracture, are known to bring valuable information on the magma intrusion trajectory controlled by the balance between the magma buoyancy and the local stress field (Maccaferri et al., 2011, 2014, 2017; Davis et al., 2021). In this study, by comparing numerical results with experimental observations, we show that fracture-dominated models may also provide some insight into the velocity variations through the estimation of variations of the energy released along the path. In particular, we show that, associated with the velocity decrease observed when a fluid-filled crack rises vertically under a load applied at the surface [experience from Watanabe et al. (2002)], there is a decrease of the energy released along the path as the crack enters the compressive stress field induced by the load. Similarly experimental cracks deflected towards the load [experiments described in Maccaferri et al. (2019)] show a velocity decrease together with a decrease of the energy released; however this time the variation recorded is not induced directly by the stress field but by a decrease in buoyancy resulting from the crack dip. Thus, we highlight the key influence of buoyancy on propagation velocity, with a larger buoyancy resulting in higher velocities. This supports the hypothesis that the lower velocity recorded for laterally propagating dykes compared to vertically rising ones is related to the absence of buoyancy as a driving force for lateral propagation. In addition, our study clearly evidences that the velocity decrease in fluid propagation resulting from either a local compressive stress field or a reduction of buoyancy is correlated with a decrease of the energy released along the propagation path. In most experiments, where the crack reaches the surface at a certain distance from the applied load, we observe an increase in velocity just before the crack reaches the surface, which corresponds to the increase in energy released below the free surface. From the experimental velocities recorded, we could also infer that the free surface is not felt by cracks reaching the surface below or close to the applied load in our experiments. In this case the velocity evolution is consistent with the energy release calculated in absence of free surface. As recent progress have been made for 3D BE models solving for crack propagation (Davis et al., 2021), the use of energy release quantification opens new possibilities to quantify the impact of both the local stress field and the buoyancy on the velocity of finite fluid-filled cracks propagation and consequently on the timing of new volcanic vents opening.
However magma is a viscous fluid, such that part of the energy released during propagation is dissipated by the viscous flow; it follows that propagation of magmatic intrusions is expected to occur in the “viscous dominated” regime. As it is very difficult to drain a viscous fluid from a thin fissure, in the viscous dominated regime, there is limited fracture closure at the bottom and the magma rise to the surface building a tail connected to the feeding storage zone. We confirm here the efficiency of dynamic fluid flow models run along a prescribed trajectory to capture the velocity evolution depending on the local stress field and buoyancy. A direct comparison between our simulations for viscous fluid-filled cracks and the air-filled experiment EXP61 is limited by the negligible viscosity of the air that causes the air crack to pinch closed at its tail and propagate as an isolated crack. Conversely, in the numerical model the fracture remains open at the bottom and a reservoir overpressure is applied promoting the fracture propagation in addition to the buoyancy. This numerical model’s conditions are more suitable to represent oil-filled crack experiments such as those of Watanabe et al. (2002) and the velocity decrease observed in exp. WAT in Figure 3, or for modeling magmatic dykes rising from a storage zone, as in Pinel and Jaupart (2000) for a vertical dyke interacting with the load of a volcanic edifice, and in Pinel et al. (2017) for a magmatic dyke deflected by a topographic load and decelerated. The decrease in velocity observed along the dyke path in Figure 7 is consistent with the deceleration recorded for laterally propagating dykes, which are the most studied. However, this model had never been used to interpret velocities recorded in air-filled crack propagation experiments so far, and we believe this comparison is useful to understand how the dynamic model performs in the “fracture dominated” domain. Here we note that as a direct consequence of the viscous flow, our simulated velocity decreases also for the vertical propagation under lithostatic stress conditions (dashed red line in 7), contrary to the approximately constant velocity observed, for instance, in EXP 29, where the air-crack rises vertically, far from the applied load (Figure 3). This difference is due to the viscous pressure drop which increases and dissipates more and more fluid pressure as the fracture grows and its tail is lengthening (as fracture closure at the bottom is prevented). The comparison between model results and experiments proves that the viscous pressure drop is negligible for the air-cracks, or conversely, that the air-crack experiments are not able to capture the viscous flow features that are characteristic of magmatic dykes, and are well described by dynamic viscous flow models. Viscous flow models, even if not perfectly suitable to describe air-filled cracks, still confirm that the velocity decrease observed for deflected trajectories in our experiments is not caused directly by the local stress field, but results from the orientation of the trajectory which modulates the buoyancy. These dynamic fluid flow models remain limited as they cannot solve for the path, which is key to correctly infer the buoyancy and stress influence and might be influenced by the viscous flow itself. Besides they neglect the fracturation, which prevents to address, for instance, free surface effects that might influence the magma velocity at shallow level (Rivalta and Dahm, 2006). In order to fill the gap between viscous- and fracture-dominated models, the next step should be to include the effect of the viscous flow on the shape and trajectory of the crack in a BE models for fluid-filled fracture propagation, dropping the quasi-static assumption. Experiments with more viscous fluids will also be required to validate these new models.
Data Availability Statement
The datasets presented in this study can be found in online repositories. The names of the repository/repositories and accession number(s) can be found below: http://doi.org/10.5281/zenodo.5788695.
Author Contributions
VP and FM led the development of the modelling framework with the participation of all co-authors. DS carried out the experimental work with FM, DS, and VP calculated the stress field using the Finite Element model. SF and FM carried out the numerical simulations with the BE model for the static crack propagation. SF and VP carried out the numerical modeling of viscous fluid propagation. All the authors contributed to evaluation of the modelling, discussion of the results and the writing of the paper.
Funding
This work received financial support from the ANR-DFG NLE 2018 MagmaPropagator projet (ANR-18-CE92-0037), from the German Academic exchange Service (DAAD) through the Research Grants—Short- Term Grants, 2019 (57440917).
Conflict of Interest
The authors declare that the research was conducted in the absence of any commercial or financial relationships that could be construed as a potential conflict of interest.
Publisher’s Note
All claims expressed in this article are solely those of the authors and do not necessarily represent those of their affiliated organizations, or those of the publisher, the editors and the reviewers. Any product that may be evaluated in this article, or claim that may be made by its manufacturer, is not guaranteed or endorsed by the publisher.
Acknowledgments
We thank Eleonora Rivalta and all the MagmaPropagator team for inspiring discussions on gelatin experiments and dyke propagation. We thank John Browning and an reviewer for their valuable comments, which improved the manuscript. FM acknowledges the project LOVE-CF, INGV departmental strategic projects.
Supplementary Material
The Supplementary Material for this article can be found online at: https://www.frontiersin.org/articles/10.3389/feart.2022.838318/full#supplementary-material
References
Aoki, Y., Segall, P., Kato, T., Cervelli, P., and Shimada, S. (1999). Imaging Magma Transport during the 1997 Seismic Swarm off the Izu Peninsula, Japan. Science 286, 927–930. doi:10.1126/science.286.5441.927
Battaglia, J., Ferrazzini, V., Staudacher, T., Aki, K., and Cheminée, J.-L. (2005). Pre-Eruptive Migration of Earthquakes at the Piton de la Fournaise Volcano (Réunion Island). Geophys. J. Int. 161, 549–558. doi:10.1111/j.1365-246x.2005.02606.x
Beauducel, F., Peltier, A., Villié, A., and Suryanto, W. (2020). Mechanical Imaging of a Volcano Plumbing System from Gnss Unsupervised Modeling. Geophys. Res. Lett. 47, e2020GL089419. doi:10.1029/2020GL089419
Bonaccorso, A., Currenti, G., Del Negro, C., and Boschi, E. (2010). Dike Deflection Modelling for Inferring Magma Pressure and Withdrawal, with Application to Etna 2001 Case. Earth Planet. Sci. Lett. 293, 121–129. doi:10.1016/j.epsl.2010.02.030
Corbi, F., Rivalta, E., Pinel, V., Maccaferri, F., and Acocella, V. (2016). Understanding the Link between Circumferential Dikes and Eruptive Fissures Around Calderas Based on Numerical and Analog Models. Geophys. Res. Lett. 43, 6212–6219. doi:10.1002/2016gl068721
Dahm, T. (2000). Numerical Simulations of the Propagation Path and the Arrest of Fluid-Filled Fractures in the Earth. Geophys. J. Int. 141, 623–638. doi:10.1046/j.1365-246x.2000.00102.x
Davis, T., Bagnardi, M., Lundgren, P., and Rivalta, E. (2021). Extreme Curvature of Shallow Magma Pathways Controlled by Competing Stresses: Insights from the 2018 Sierra Negra Eruption. Geophys. Res. Lett. 48, e2021GL093038. doi:10.1029/2021gl093038
Einarsson, P., and Brandsdottir, B. (1980). Seismological Evidence for Lateral Magma Intrusion during the 1978 Deflation of the Krafla Volcano in NE Iceland. J. Glaciol. 47, 160–165.
Grossman-Ponemon, B. E., Heimisson, E. R., Lew, A. J., and Segall, P. (2020). Logarithmic Growth of Dikes from a Depressurizing Magma Chamber. Geophys. Res. Lett. 47, e2019GL086230. doi:10.1029/2019gl086230
Heimpel, M., and Olson, P. (1994). Chapter 10 Buoyancy-Driven Fracture and Magma Transport through the Lithosphere: Models and Experiments. Internation Geophys. 57, 223–240. doi:10.1016/s0074-6142(09)60098-x
Kavanagh, J. L., Menand, T., and Daniels, K. A. (2013). Gelatine as a Crustal Analogue: Determining Elastic Properties for Modelling Magmatic Intrusions. Tectonophysics 582, 101–111. doi:10.1016/j.tecto.2012.09.032
Lecampion, B., Bunger, A., and Zhang, X. (2018). Numerical Methods for Hydraulic Fracture Propagation: A Review of Recent Trends. J. Nat. Gas Sci. Eng. 49, 66–83. doi:10.1016/j.jngse.2017.10.012
Lengliné, O., Duputel, Z., and Okubo, P. G. (2021). Tracking dike Propagation Leading to the 2018 Kīlauea Eruption. Earth Planet. Sci. Lett. 553, 116653. doi:10.1016/j.epsl.2020.116653
Lister, J. R. (1990a). Buoyancy-driven Fluid Fracture: Similarity Solutions for the Horizontal and Vertical Propagation of Fluid-Filled Cracks. J. Fluid Mech. 217, 213–239. doi:10.1017/s0022112090000696
Lister, J. R. (1990b). Buoyancy-driven Fluid Fracture: the Effects of Material Toughness and of Low-Viscosity Precursors. J. Fluid Mech. 210, 263–280. doi:10.1017/s0022112090001288
Maccaferri, F., Bonafede, M., and Rivalta, E. (2010). A Numerical Model of Dyke Propagation in Layered Elastic media. Geophys. J. Int. 180, 1107–1123. doi:10.1111/j.1365-246x.2009.04495.x
Maccaferri, F., Bonafede, M., and Rivalta, E. (2011). A Quantitative Study of the Mechanisms Governing dike Propagation, dike Arrest and Sill Formation. J. Volcanol. Geotherm. Res. 208, 39–50. doi:10.1016/j.jvolgeores.2011.09.001
Maccaferri, F., Rivalta, E., Keir, D., and Acocella, V. (2014). Off-rift Volcanism in Rift Zones Determined by Crustal Unloading. Nat. Geosci. 7, 297–300. doi:10.1038/ngeo2110
Maccaferri, F., Acocella, V., and Rivalta, E. (2015). How the Differential Load Induced by normal Fault Scarps Controls the Distribution of Monogenic Volcanism. Geophys. Res. Lett. 42, 7507–7512. doi:10.1002/2015gl065638
Maccaferri, F., Richter, N., and Walter, T. R. (2017). The Effect of Giant Lateral Collapses on Magma Pathways and the Location of Volcanism. Nat. Commun. 8, 1097. doi:10.1038/s41467-017-01256-2
Maccaferri, F., Smittarello, D., Pinel, V., and Cayol, V. (2019). On the Propagation Path of Magma‐Filled Dikes and Hydrofractures: The Competition between External Stress, Internal Pressure, and Crack Length. Geochem. Geophys. Geosyst. 20, 2064–2081. doi:10.1029/2018GC007915
Mantiloni, L., Davis, T., Gaete Rojas, A. B., and Rivalta, E. (2021). Stress Inversion in a Gelatin Box: Testing Eruptive Vent Location Forecasts with Analog Models. Geophys. Res. Lett. 48, e2020GL090407. doi:10.1029/2020gl090407
Martí, J., Pinel, V., López, C., Geyer, A., Abella, R., Tárraga, M., et al. (2013). Causes and Mechanisms of the 2011-2012 El Hierro (Canary Islands) Submarine Eruption. J. Geophys. Res. Solid Earth 118, 823–839. doi:10.1002/jgrb.50087
Mériaux, C., and Jaupart, C. (1995). Simple Fluid Dynamic Models of Volcanic Rift Zones. Earth Planet. Sci. Lett. 136, 223–240. doi:10.1016/0012-821x(95)00170-h
Pedersen, R., and Sigmundsson, F. (2006). Temporal Development of the 1999 Intrusive Episode in the Eyjafjallajökull Volcano, Iceland, Derived from InSAR Images. Bull. Volcanol. 68, 377–393. doi:10.1007/s00445-005-0020-y
Peltier, A., Ferrazzini, V., Staudacher, T., and Bachélery, P. (2005). Imaging the dynamics of dyke propagation prior to the 2000-2003 flank eruptions at Piton de la Fournaise, Reunion Island. Geophys. Res. Lett. 32, L06315. doi:10.1029/2005GL025495
Pinel, V., and Jaupart, C. (2000). The Effect of Edifice Load on Magma Ascent beneath a Volcano. Jphil. Trans. R. Soc. Lond. A. 358, 1,515–1,532. doi:10.1098/rsta.2000.0601
Pinel, V., Carrara, A., Maccaferri, F., Rivalta, E., and Corbi, F. (2017). A Two-step Model for Dynamical dike Propagation in Two-Dimensions: Application to the July 2001 etna Eruption. J. Geophys. Res. Solid Earth 122, 1107–1125. doi:10.1002/2016jb013630
Rivalta, E., and Dahm, T. (2006). Acceleration of Buoyancy-Driven Fractures and Magmatic Dikes beneath the Free Surface. Geophys. J. Int. 166, 1424–1439. doi:10.1111/j.1365-246x.2006.02962.x
Rivalta, E., Böttinger, M., and Dahm, T. (2005). Buoyancy-driven Fracture Ascent: Experiments in Layered Gelatine. J. Volcanology Geothermal Res. 144, 273–285. doi:10.1016/j.jvolgeores.2004.11.030
Rivalta, E., Taisne, B., Bunger, A., and Katz, R. (2015). A Review of Mechanical Models of dike Propagation: Schools of Thought, Results and Future Directions. Tectonophysics 638, 1–42. doi:10.1016/j.tecto.2014.10.003
Rivalta, E., Corbi, F., Passarelli, L., Acocella, V., Davis, T., and Di Vito, M. A. (2019). Stress Inversions to Forecast Magma Pathways and Eruptive Vent Location. Sci. Adv. 5, eaau9784. doi:10.1126/sciadv.aau9784
Sigmundsson, F., Hooper, A., Hreinsdottir, S., Vogfjord, K. S., Ofeigsson, B. G., Heimisson, E. R., et al. (2015). Segmented Lateral Dyke Growth in a Rifting Event at Bardarbunga Volcanic System, Iceland. Nature 517, 191–195. doi:10.1038/nature14111
Smittarello, D., Cayol, V., Pinel, V., Peltier, A., Froger, J.-L., and Ferrazzini, V. (2019). Magma propagation at piton de la fournaise from joint inversion of insar and gnss. J. Geophys. Res. Solid Earth 124, 1361–1387. doi:10.1029/2018JB016856
Smittarello, D., Pinel, V., Maccaferri, F., Furst, S., Rivalta, E., and Cayol, V. (2021). Characterizing the Physical Properties of Gelatin, a Classic Analog for the Brittle Elastic Crust, Insight from Numerical Modeling. Tectonophysics 812, 228901. doi:10.1016/j.tecto.2021.228901
Taisne, B., and Jaupart, C. (2009). Dyke Propagation through Layered Rocks. J. Geophys. Res. Solid Earth 114, B09203. doi:10.1029/2008JB006228
Taisne, B., and Jaupart, C. (2011). Magma Expansion and Fragmentation in a Propagating Dyke. Earth Planet. Sci. Lett. 301, 146–152. doi:10.1016/j.epsl.2010.10.038
Taisne, B., and Tait, S. (2011). Effect of Solidification on a Propagating Dike. J. Geophys. Res. Solid Earth 116 (B1). doi:10.1029/2009JB007058
Takada, A. (1990). Experimental Study on Propagation of Liquid-Filled Crack in Gelatin: Shape and Velocity in Hydrostatic Stress Condition. J. Geophys. Res. 95, 8,471–8,481. doi:10.1029/jb095ib06p08471
Toda, S., Stein, R. S., and Sagiya, T. (2002). Evidence from the Ad 2000 Izu Islands Earthquake Swarm that Stressing Rate Governs Seismicity. Nature 419, 58–61. doi:10.1038/nature00997
Toutain, J.-P., Bachelery, P., Blum, P.-A., Cheminee, J.-L., Delorme, H., Fontaine, L., et al. (1992). Real time monitoring of vertical ground deformations during eruptions at Piton de la Fournaise. Geophys. Res. Lett. 19, 553–556. doi:10.1029/91gl00438
Traversa, P., Pinel, V., and Grasso, J.-R. (2010). A Constant Influx Model for dike Propagation: Implications for Magma Reservoir Dynamics. J. Geophys. Res. 115, B01201. doi:10.1029/2009JB006559
Watanabe, T., Masuyama, T., Nagaoka, K., and Tahara, T. (2002). Analog Experiments on Magma-Filled Cracks: Competition between External Stresses and Internal Pressure. Earth, Planets and Space 54, e1247–e1261. doi:10.1186/bf03352453
Keywords: magma propagation, analog experiments, numerical modelling, volcanic hazard, hydraulic fracture
Citation: Pinel V, Furst S, Maccaferri F and Smittarello D (2022) Buoyancy Versus Local Stress Field Control on the Velocity of Magma Propagation: Insight From Analog and Numerical Modelling. Front. Earth Sci. 10:838318. doi: 10.3389/feart.2022.838318
Received: 17 December 2021; Accepted: 28 February 2022;
Published: 16 March 2022.
Edited by:
Roberto Sulpizio, University of Bari Aldo Moro, ItalyReviewed by:
Mie Ichihara, The University of Tokyo, JapanJohn Browning, Pontificia Universidad Católica de Chile, Chile
Copyright © 2022 Pinel, Furst, Maccaferri and Smittarello. This is an open-access article distributed under the terms of the Creative Commons Attribution License (CC BY). The use, distribution or reproduction in other forums is permitted, provided the original author(s) and the copyright owner(s) are credited and that the original publication in this journal is cited, in accordance with accepted academic practice. No use, distribution or reproduction is permitted which does not comply with these terms.
*Correspondence: Virginie Pinel, Virginie.Pinel@univ.smb.fr