Fracture Network Localization Preceding Catastrophic Failure in Triaxial Compression Experiments on Rocks
 Jessica McBeck
 Yehuda Ben-Zion2
  François Renard
- 1The Njord Centre, Departments of Geosciences and Physics, University of Oslo, Oslo, Norway
- 2Department of Earth Sciences and Southern California Earthquake Center, University of Southern California, Los Angeles, CA, United States
- 3University Grenoble Alpes, University Savoie Mont Blanc, CNRS, IRD, ISTerre, Grenoble, France
We quantify the spatial distribution of fracture networks throughout six in situ X-ray tomography triaxial compression experiments on crystalline rocks at confining stresses of 5–35 MPa in order to quantify how fracture development controls the final macroscopic failure of the rock, a process analogous to those that control geohazards such as earthquakes and landslides. Tracking the proportion of the cumulative volume of fractures with volumes >90th percentile to the total fracture volume,
Introduction
Preexisting weaknesses control how and when rocks fail because they concentrate shear and tensile stresses that promote fracture propagation under relatively low differential stress (e.g., Griffith, 1921). These early fractures tend to propagate parallel to the maximum compression direction,
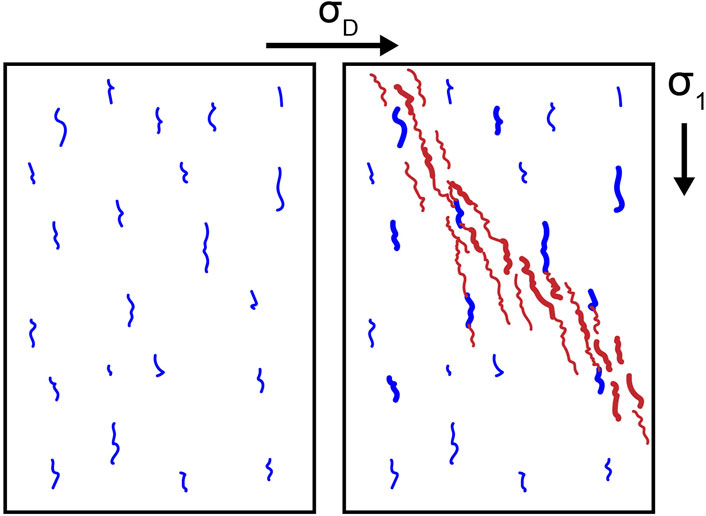
FIGURE 1. Transition from stable (left) to unstable (right) fracture network development via coalescence of fractures with increasing differential stress,
Field observations and laboratory experiments show how deformation can become more localized toward macroscopic failure in the laboratory, and with increasing total slip and slip-rate along faults in the field (e.g., Segall and Pollard, 1983; Chen and Spetzler, 1993; Bergbauer and Martel, 1999; Ben-Zion and Sammis, 2003; Schubnel et al., 2003; Kattenhorn and Marshall, 2006; De Joussineau et al., 2007; Moir et al., 2010; Zhao et al., 2018; Kandula et al., 2019; Renard et al., 2019a; Renard et al., 2019b; McBeck et al., 2020a; McBeck et al., 2020b). Locations of acoustic emissions (AEs) captured during rock deformation experiments under triaxial compression loading suggest that the AEs localize from a diffuse cloud to a narrower zone with increasing deformation (Lockner et al., 1991; Aben et al., 2019). Some experiments show that AEs can propagate across the rock sample, from a smaller cluster of AEs at one edge of the rock sample to a system-spanning, elongate cluster (Benson et al., 2007). Some clusters of AEs may include a process zone and subsequent damage zone (Lei et al., 2000). Tensile fracturing and relatively low b values with a few large events characterize deformation in the process zone, while shear fracturing and lower b values with a greater number of larger events characterize deformation in the damage zone. These laboratory observations suggest that fracture linkage is the dominant form of fracture network development following macroscopic fault formation. Additional analyses identify a link between b values and the spatial distribution of AEs in experiments on precut granite cores that contain faults with varying degrees of roughness (Goebel et al., 2017). Rougher faults have more distributed AEs and higher b values than smoother faults, which produce more localized deformation with larger rupture areas and thus lower b values.
In situ X-ray tomography experiments that capture images of three-dimensional fracture networks at different times provide additional evidence of deformation localization preceding catastrophic failure. Observations from X-ray tomography experiments indicate that fracture networks can evolve from isolated fractures that trend parallel to
These previous analyses did not systematically compare the varying expressions of fracture network localization, and did not examine why different experiments, under varying confining stresses and on different rock types, experienced varying expressions of localization. Here, we quantify and compare the evolving spatial distribution of fracture networks throughout six in situ X-ray tomography triaxial compression experiments on low porosity crystalline rocks: granite and monzonite. We assess the idea that one dominant fracture continually grows at the expense of others by tracking the proportion of the volume of the maximum fracture, vmax, to the total fracture volume, vtot, throughout each experiment. We also examine if the set of the largest fractures continually dominates deformation by tracking the sum of the volume of the fractures with volumes >90th percentile, relative to the total fracture volume,
Methods
In situ X-Ray Tomography
We use the X-ray transparent triaxial deformation apparatus Hades (Renard et al., 2016) installed at beamline ID19 at the European Synchrotron and Radiation facility to deform the rock cores. This apparatus enables acquiring X-ray tomograms of the rock core while it is inside the apparatus at the applied differential stress conditions. In these experiments, we apply a constant confining stress between 5 and 35 MPa (Table 1) using oil surrounding the jacket that contains the rock core, and then increase the axial stress in steps of 0.5–5 MPa, with smaller increases of axial stress closer to macroscopic failure (Figure 2), at ambient temperature conditions. After each stress step, we acquire 1,600 radiographs at 32 bytes gray scale resolution of X-ray absorption while the sample is rotated over 180° within 1.5 min. The final reconstructed tomogram contains 1,600 × 1600 × 1,600 voxels with 6.5 µm/voxel spatial sampling. Due to the stress-controlled loading conditions, the rocks fail in a sudden stress drop. The final scan is acquired typically within 0.5 MPa of the final failure stress. We measure the axial contraction of the rock sample using the tomograms because the shortening of the rock core is visible in the three-dimensional images.
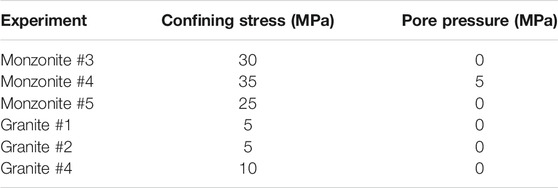
TABLE 1. Conditions of each experiment.
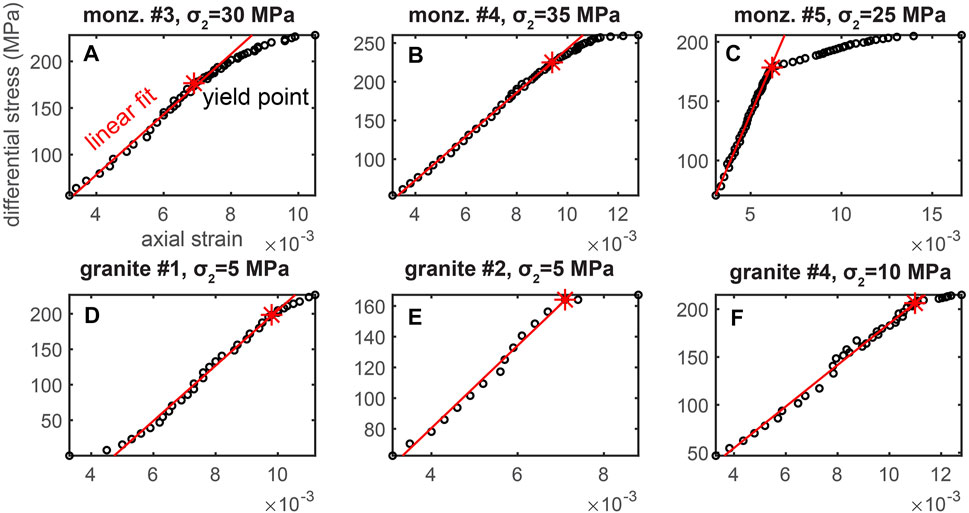
FIGURE 2. Differential stress versus axial strain relationships for the six examined experiments: (A) monzonite #3, (B) monzonite #4, (C) monzonite #5, (D) granite #1, (E) granite #2, and (F) granite #4. Black circles show the conditions when an X-ray tomogram was acquired. Red lines show the linear fit of the early portion of the data. Red stars show the identified yield point, when the data diverges from the linear fit. The title of each plot shows the experiment abbreviation (Table 1), and applied confining stress,
The rock samples are cylinders 1 cm tall and 4 mm wide. We perform three experiments on Westerly granite and three experiments on monzonite. Granite and monzonite are both low porosity crystalline rocks dominated by quartz and feldspar. The main difference between these rocks is that the mean grain size of the granite is 100–200 μm, while monzonite has a mean grain size of 300–400 μm (e.g., Aben et al., 2016). Each rock sample was deformed without fluid, except for monzonite #4, which included 5 MPa of deionized water as pore fluid pressure.
Each experiment includes the typical three stages of rock deformation in the brittle regime: (1) an early linear phase, (2) yielding, and (3) macroscopic failure (Figure 2). Due to the approximately linear relationship between the axial contraction and differential stress early in each experiment, we may fit a line through the data to identify the yield point. We identify the yield point when the data begins to diverge from the linear fit by more than 5%. Later, we compare the microscopic observations of fracture network development to the timing of the macroscopic yielding. The images of the X-ray tomograms of each experiment are publicly available (Renard, 2017, 2018, 2021).
Segmentation of Fracture Networks
During the reconstruction of the radiographs to three-dimensional volumes, we applied corrections to remove acquisition noise, including ring artefacts, and to smooth variations in the intensity of the X-ray source during the experiment. To remove noise from the reconstructed images, we preprocessed these data using the commercial image analysis software AvizoFire™, including denoising the volumes using a non-local-means filter (Buades et al., 2005).
The reconstructed tomograms are three-dimensional representations of the local density of the material. Pores and fractures may be distinguished from the solid rock because they have distinct ranges of densities. We segment the rock into solid and fractures using a standard global thresholding technique. We identify the local minimum in the histogram of the gray scale values of the tomogram, indicative of density, that separates the solid material from the fractures and pores (Supplementary Figure S1). We identify this minimum threshold by fitting two Gaussian distributions to the two portions of the histogram that correspond to the solid material and fractures. We identify the threshold between the phases at the gray scale value when the second derivative of this cumulative Gaussian distribution is closest to zero. A second derivative equal to zero indicates an inflection point between the two Gaussian distributions, which we use as the threshold to separate the solid from the voids.
Gini Coefficient
We use several metrics to quantify localization, including the Gini coefficient. The Gini coefficient uses the Lorenz curve of a distribution to measure the deviation from a uniform distribution (e.g., Gini, 1921; Ben-Zion and Zaliapin, 2020). The Lorenz curve shows the proportion of the total amount of a population, such as fracture volume, that is included in the bottom percentile of a population. The Gini coefficient is one minus twice the integral of the Lorenz curve (Supplementary Figure S2). Thus, larger Gini coefficients indicate that the total volume of the fractures in a network is dominated by a few fractures, whereas lower Gini coefficients indicate that the total volume is more equally distributed among all the fractures.
Results
Localization Toward the Largest Fractures
To gain a general understanding of fracture network localization in these experiments, we first examine the fracture networks in the final five scans before system-size failure in two experiments (Figure 3). These two experiments share some fundamental similarities in fracture network development preceding macroscopic failure. In the final stages of the monzonite #5 experiment (Figure 3A), the largest fractures appear first relatively randomly spread throughout the rock core. With increasing differential stress, the fractures grow in volume and link with each other. In the scan immediately preceding failure, the fracture network extends from the top to the bottom of the core. Similar to the monzonite #5 experiment, initially the fracture and pore network in the granite #2 experiment is relatively diffusely distributed (Figure 3B). Then, with increasing differential stress, several fractures propagate and coalesce to form elongated system-spanning fault networks.
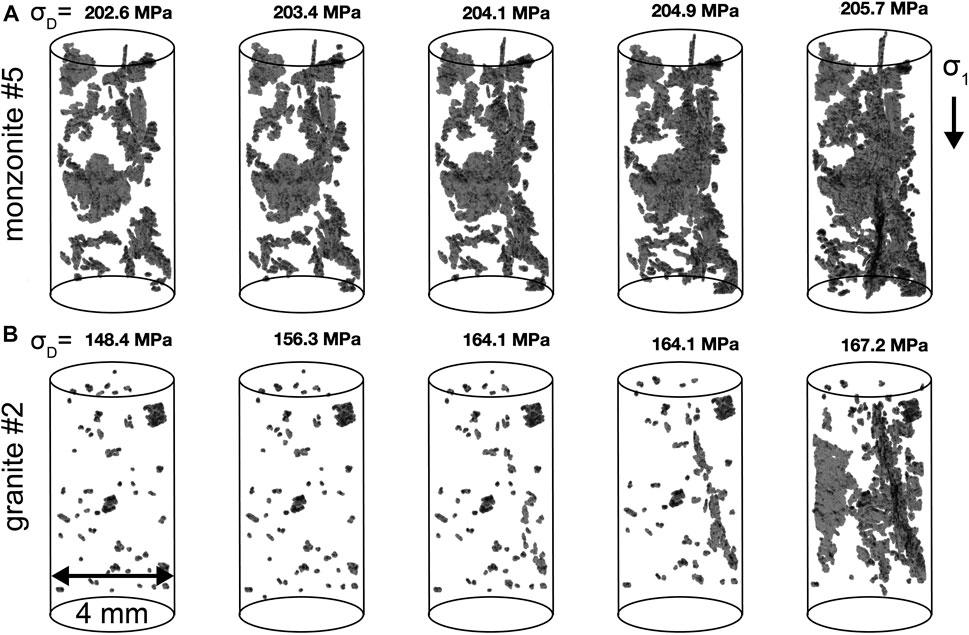
FIGURE 3. Fracture network development in the final five tomograms preceding macroscopic failure in experiment monzonite #5 (A) and granite #2 (B). Black regions show the fractures with volumes greater than the 90th percentile of the population. Numbers at the top of the cores show the differential stress applied on the sample when the scan was acquired.
The fracture networks in these experiments also suggest differences in the localization process between rock types. In the monzonite #5 experiment, the identified fracture network extends from the top to the bottom of the core, and also has a wide lateral extent, perpendicular to
To quantify the coalescence of the fracture networks throughout triaxial compression, we first track the proportion of the maximum fracture volume to the total volume of all the fractures, vmax/vtot, in each scan acquired throughout the experiments (Figure 4). High vmax/vtot indicates that the largest, most volumetric, fracture in the network dominates the network. Increasing vmax/vtot indicates that the largest fracture continually dominates an increasing proportion of the fracture network. Following the idea that the fracture networks coalesce into one dominant fracture, vmax/vtot should continually increase with differential stress. However, only two of the experiments (monzonite #3 and granite #4) show generally increasing vmax/vtot, with a few episodic decreases. Instead, the majority of the experiments experience delocalization away from the largest fracture, with prolonged phases of decreasing vmax/vtot. The granite #1 and #2 experiments host relatively constant vmax/vtot until near macroscopic failure, and then sharp drops in vmax/vtot. The monzonite #4 experiment also hosts a sharp drop in vmax/vtot near failure. These sharp drops indicate that many smaller fractures are propagating and lengthening in the final stages preceding failure, while the largest fracture is growing at a slower rate relative to the cumulative influence of all of the smaller fractures.
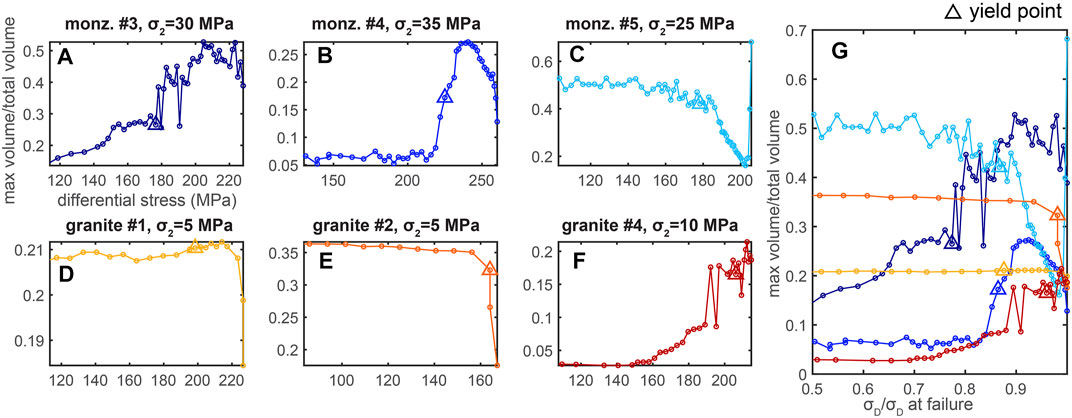
FIGURE 4. Evolution of the maximum fracture volume divided by the total volume of fractures, vmax/vtot, throughout each individual experiment (A–F), and for all the experiments (G). Color of the lines in (G) matches the colors of each experiment shown in (A–F). Triangles show the conditions of the yield point. Increasing vmax/vtot indicates that the fracture network is localizing toward the one largest fracture.
The experiments that do not host a sharp drop in vmax/vtot near failure show either sharp (monzonite #5) or more gradual (monzonite #3, granite #4) increases in vmax/vtot following yielding and preceding macroscopic failure. Thus, following yielding, the final fracture network that develops in half of the experiments is dominated by the largest fracture that grows at the expense of the other fractures, and likely coalesces with several of the preexisting large fractures. In the other set of the experiments, the final fracture network is dominated by several large fractures, and not only one.
The metric of localization, vmax/vtot, reveals that fracture network development does not always follow the idealized evolution of one fracture continually growing at the expense of others. Rather, the rocks experience phases of delocalization away from the largest fracture, as well as the localization of deformation toward it. Due to this contrasting behavior, we next examine the localization of the few largest fractures, rather than only the absolute maximum. We track the set of fractures with volumes >90th percentile of the fracture volumes in each tomogram (i.e., the cumulative volume of the top 10th percentile fractures at each stress step). We then examine the evolution of the proportion of the sum of their fracture volumes,
In all but one of the experiments (granite #1), the largest fractures host generally increasing proportions of the total fracture network throughout loading (Figure 5). The granite #1 experiment experiences only small changes in
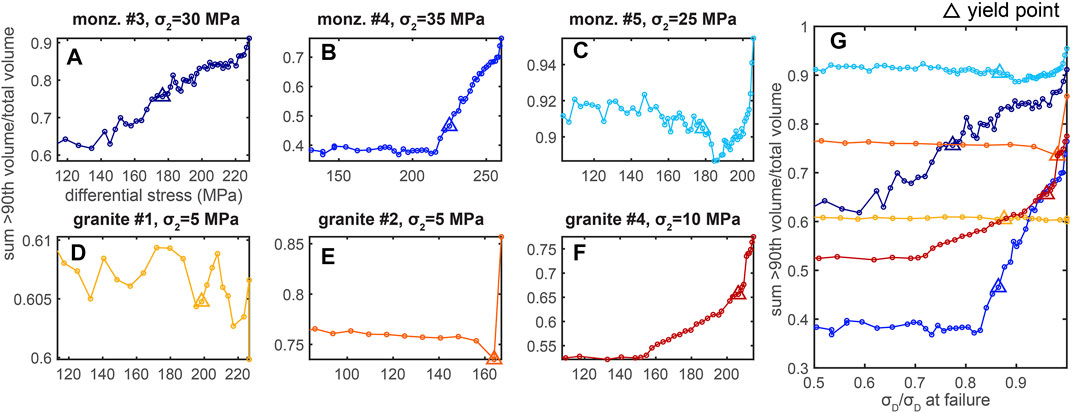
FIGURE 5. Evolution of the sum of the fracture volumes with values >90th percentile divided by the total volume of fractures,
In summary, the majority of the experiments experience increasing localization of fracture development toward the largest fractures (Figure 5, Supplementary Figure S3 and S4), and the majority of the experiments experience some phases of delocalization away from the one largest fracture (Figure 4). Thus, the fracture network that grows at the expense of the other fractures is generally comprised of several fractures, rather than only the largest fracture. Counting the number of the largest fractures throughout each experiment indicates that these fracture networks, composed of fractures with volumes >90th percentile, host hundreds of fractures between the yielding point and macroscopic failure (Supplementary Figure S5).
To more directly compare the signals of localization with the three metrics of the Gini coefficient,
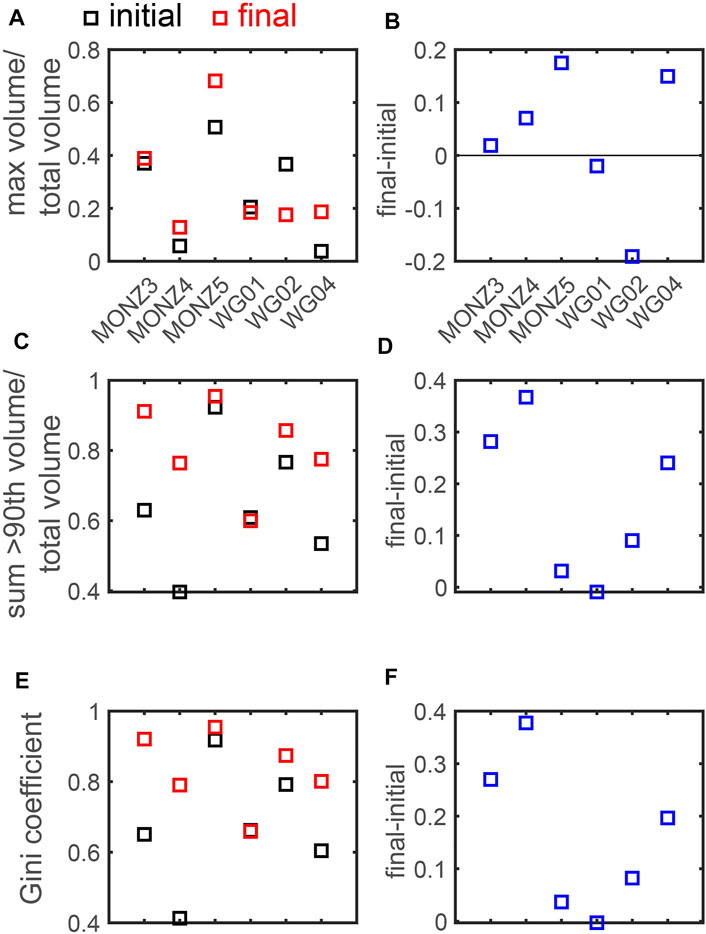
FIGURE 6. Difference in the vmax/vtot (A, B),
The monzonite #5 and granite #4 experiments produce the largest increases in vmax/vtot, whereas monzonite #3 and #4 produce the largest increases in
The granite #1 experiment experiences the smallest absolute changes in the localization metrics. The lower applied confining stress and associated shorter yielding phase of the granite #1 experiment (Figure 2) may produce the relatively constant localization. Although granite #1 and granite #2 both experience 5 MPa confining stress, granite #1 accumulates less axial strain between yielding and macroscopic failure than granite #2 (Figure 2). This shorter yielding phase suggests that the fracture networks grew relatively slowly during yielding in granite #1, producing smaller changes in the axial strain, and smaller changes in the fracture network localization compared to granite #2.
To gain further insight into the different expressions of localization in each experiment, we calculate the proportion of the accumulated differential stress (i.e., time) of the experiment in which the three metrics of localization show increasing localization (Figure 7). The differential stress that the system experiences is a proxy for time because we increase the differential stress in steps toward failure, and acquire an X-ray tomogram of the system after each increase in differential stress. Increases in the Gini coefficient,
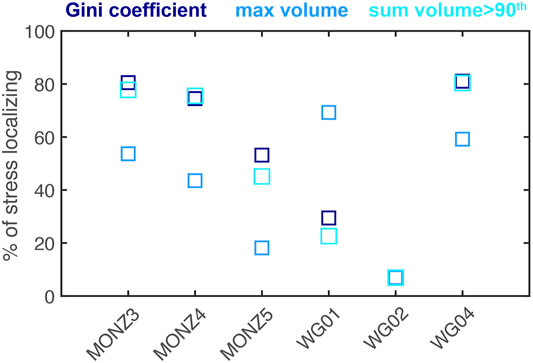
FIGURE 7. Percentage of the applied differential stress in which the Gini coefficient, vmax/vtot, and
Comparing the percentage of the differential stress in which each of these metrics are localizing indicates that the Gini coefficient or
Using the metric that produces the largest percentages of the experimental time (typically the Gini coefficient or
Localization Toward the Final Failure Plane
The analyses in the previous section indicate that the largest fractures in the network, with volumes >90th percentile, tend to localize for up to 80% of the experimental time (Figure 7). To examine the evolving spatial distribution of these largest fractures toward failure, we compare them to the plane that represents the final fracture network immediately preceding failure (e.g., Figure 8). We fit this plane to the fractures with volumes >90th percentile in the final scan acquired preceding macroscopic failure using least squares regression in two-dimensions. We fit the plane to the largest set of fractures, rather than only the largest fracture, because the fracture networks generally localize toward the largest set of fractures (Figure 5), rather than the largest fracture (Figure 4). To assess how the fracture networks coalesce toward their final geometry, we examine the r2 score of this final failure plane and the largest set of fractures throughout each experiment (Figure 9), and the mean distance between these fractures and the failure plane (Figure 10, Figure 11, Supplementary Figure S6). We calculate the mean distance by finding the closest distance between each large fracture and the failure plane, and then finding the mean of the distances in a given scan.
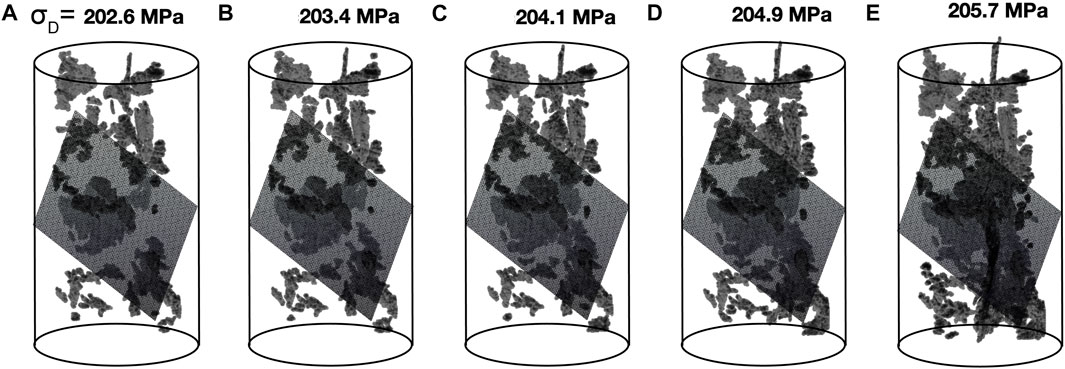
FIGURE 8. Largest fractures, with volumes >90th percentile, in the five scans acquired before failure in the monzonite #5 experiment, and best fit plane of the final fault geometry. The final failure plane is built from the scan acquired immediately preceding failure. Numbers at the top of the cores show the differential stress when the scan was acquired.
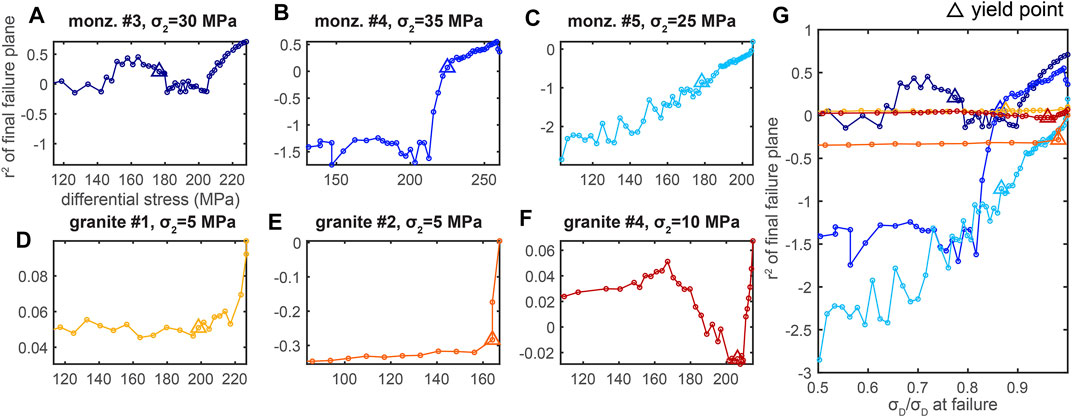
FIGURE 9. Evolution of the r2 of the largest fractures and the final failure plane throughout each individual experiment (A–F), and for all the experiments (G). Color of the lines in (G) matches the colors of each experiment shown in (A–F). Triangles show the conditions of the yield point.
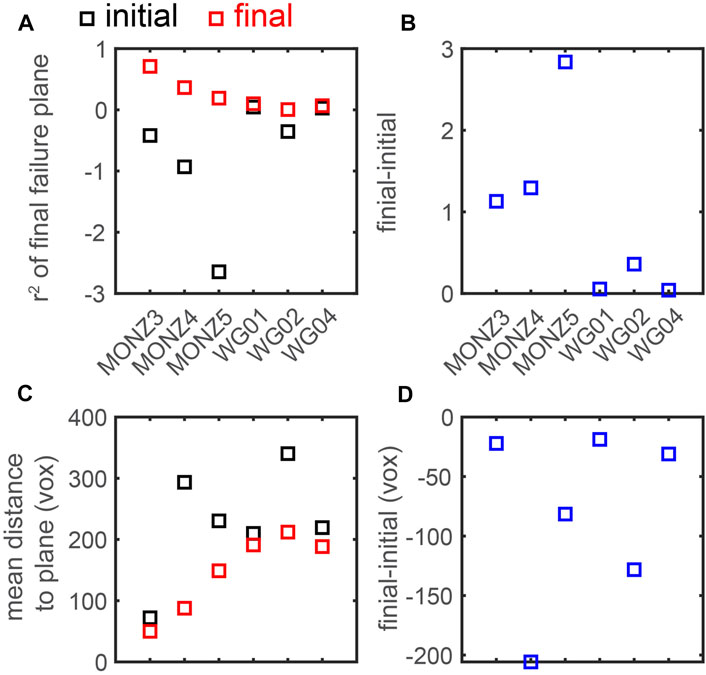
FIGURE 10. Difference in the r2 score (A, B), and mean distance between the 10% largest fractures and the failure plane (C, D) from the initial and final tomogram acquired in each experiment. Positive and negative changes from the initial to final scan indicate increasing localization for the r2 score and mean distance, respectively.
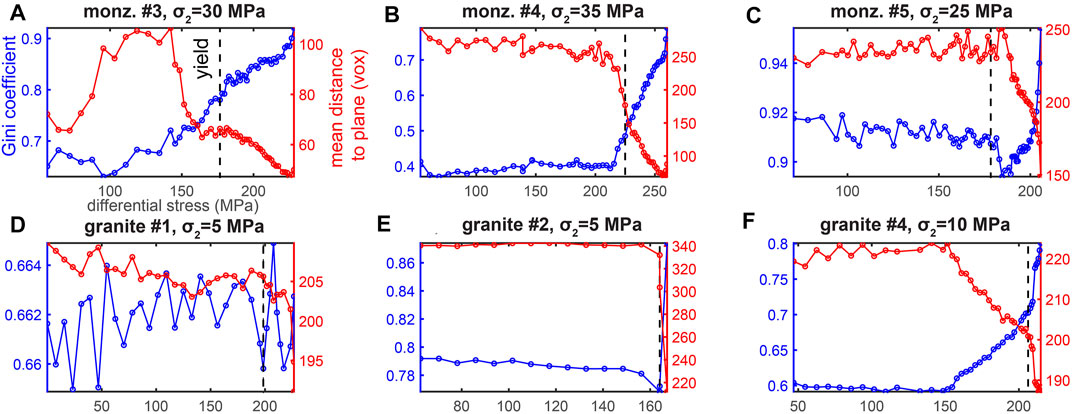
FIGURE 11. Evolution of the Gini coefficient and mean distance to the final failure plane in each experiment. Increasing Gini coefficient indicates increasing localization, while decreasing distance indicates increasing localization. Vertical black dashed lines indicate the macroscopic yield point.
The fit between the final failure plane and the largest fractures (r2 score) generally increases toward failure (Figure 9). This trend is expected because we calculate the final failure plane using the largest fractures identified in the final scan. However, the fit does not increase monotonically, and instead shows some phases of delocalization away from the plane. The granite #4 experiment hosts the most significant of these drops, in terms of the difference relative to the maximum achieved r2 score (Figure 9F). The monzonite #3 experiment also shows a phase of delocalization, and then stagnating r2 scores following the macroscopic yield point. Monzonite #3 is also the experiment with the fracture network that most closely fits a plane in the final scan, producing the highest r2 score (Figure 9G).
The granite experiments all show sharp increases in the r2 score in the final few scans preceding failure. These increases coincide in time with the macroscopic yield point. In contrast, the monzonite experiments show more continuous increases over longer intervals of differential stress. Two of the monzonite experiments reveal changes in the r2 score near the yield point: decreasing in monzonite #3 and slowing in monzonite #4. The general trends observed in the r2 score match the trends in the mean distance between each fracture and the plane (Supplementary Figure S6, Figure 11).
To further examine the evolving spatial distribution of the largest fractures relative to the final failure plane, we compare the r2 score and mean distance between the fractures and the plane in the initial and final scans acquired in each experiment (Figure 10). The monzonite experiments experience larger r2 scores in the final scan, and larger increases in the r2 score than the granite experiments. Thus, the top 10th percentile largest fractures in the final scan more closely match the geometry of a plane in the monzonite experiments than those in the granite experiments. In addition, at the onset of loading, the largest fractures in the monzonite experiments deviate more significantly from a plane than those in the granite experiments. The higher confining stress applied to the monzonite experiments may contribute to the greater localization of the largest fractures toward a plane in this suite of experiments.
Consistent with the trend in the r2 scores, the monzonite experiments also host lower mean distances between the largest fractures and the failure plane in the final scan compared to the granite experiments (Figure 10C). The final mean distance is relatively consistent, near 200 voxels, for the granite experiments. Thus, the largest fractures are more tightly clustered around the final failure plane in the monzonite experiments than the granite experiments. The monzonite experiments also tend to host the largest changes in the mean distance. However, granite #2 also produces a significant change, while monzonite #3 produces a smaller change. These changes occur at least in part because the mean distance in the initial scan is larger (monzonite #3) and smaller (granite #2) than the other experiments.
The mean distance to the final failure plane and the Gini coefficient may correlate with each other. If the largest fractures coalesce from a diffuse to localized distribution, the mean distance should decrease while the Gini coefficient increases. This inverse relationship generally applies to these experiments (Figure 11). Following yielding, the Gini coefficient increases while the mean distance decreases toward failure, in all but the granite #1 experiment (Figure 11D). Thus, the fracture networks coalesce from many small distributed fractures to larger well-connected fractures that increasingly localize toward the largest set of fractures, and their approximate failure plane.
Discussion
Fracture Network Domination
Fracture networks develop through the linkage and coalescence of fractures. In an idealized system without significant mechanical heterogeneities or interaction between neighboring fractures, the localization process should be monotonic (e.g., Lyakhovsky et al., 2011). The relationship between the fracture length and stress intensity factor (e.g., Isida, 1971) suggests that the largest fracture in a network should grow at the expense of the others (e.g., Figure 12A). If fracture networks under triaxial compression follow this evolution, then the proportion of the maximum fracture volume of the total fracture volume, vmax/vtot, should increase continuously toward macroscopic failure. However, the experiments show that vmax/vtot does not increase monotonically, but instead experiences phases of delocalization of the fracture network away from the largest fracture (Figure 4). In some experiments, vmax/vtot is smaller at the end of the experiment, immediately preceding failure, than at the beginning of the experiment (Figure 6). Only one experiment (granite #4) experiences a systematic increase in vmax/vtot with only small perturbations. Thus, the fracture network in this experiment is dominated by one large fracture that grows and perhaps coalesces relatively faster than the other largest fractures. In general, however, the fracture networks are not dominated by the one largest fracture. The proportion of the experimental time (differential stress) in which the fracture networks experience localization toward the one largest fracture generally ranges from 40–70%, with two experiments hosting <20% (Figure 8).
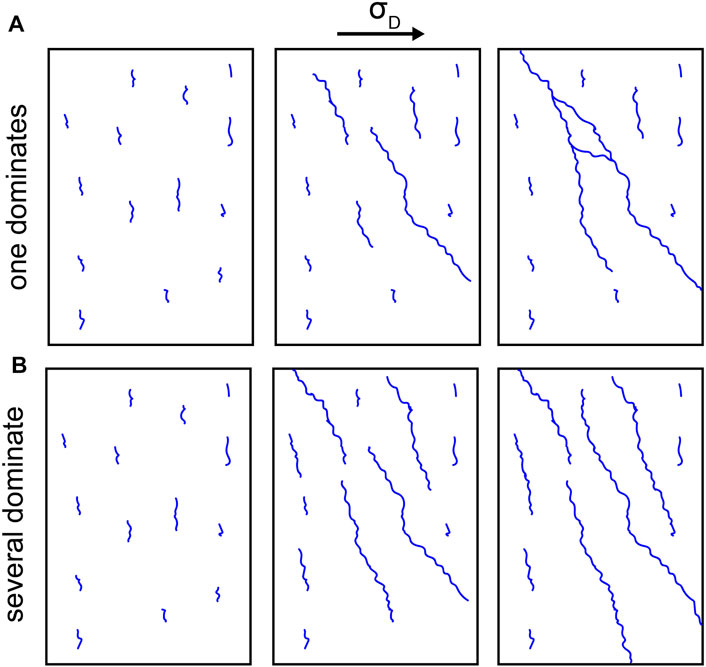
FIGURE 12. Fracture network development in a rock in which the one largest fracture dominates development (A) and in which several of the largest fractures dominate (B). The localization observed in experiments monzonite #3 and granite #4 most closely match (A), while the other experiments most closely match (B) (e.g., Figure 4).
In contrast, the experiments experience localization toward the largest set of fractures (with volumes >90th percentile) for a longer period of time than toward the one largest fracture, up to 80% of the applied differential stress (Figure 8). Tracking the proportion of the sum of the volumes >90th percentile to the total fracture volume,
Using the localization metric that produces longest periods of increasing localization, the experiments tend to host localization for only up to 80% of the time (Figure 8). Thus, the fracture network does not continually localize toward the largest set of fractures, but also experiences phases with only minor changes in localization and short periods of delocalization. This evolution matches observations of low magnitude seismicity in southern and Baja California preceding several M > 7 earthquakes (Ben-Zion and Zaliapin, 2020). These results indicate that episodes of delocalization do not necessarily imply a reduced seismic hazard.
The evolving fracture geometry and how it interacts with fractures and other heterogeneities likely triggers these episodes of delocalization. For example, a fracture may begin to grow and coalesce in one portion of the rock core, but then become impeded when it propagates into the stress shadow of another fracture or a mechanical heterogeneity. When this first fracture arrests its growth, other large fractures may propagate and coalesce faster. Whether one fault propagates or not, and thus how fault networks develop, depend on the local tensile and shear stresses that develop at the fault tips (e.g., Paterson and Wong, 2005). These local stress concentrations influence the global mechanical efficiency of the system, suggesting that the efficiency of a system can predict whether a fault will propagate, and fault network development in general (e.g., Cooke and Madden, 2014). Numerical models suggest that fracture propagation will only occur when the energetic cost of propagation is lower than the gain in efficiency produced by that propagation (Del Castello and Cooke, 2007). Following this energy budget formulation, fracture propagation and subsequent slip can reduce the total internal work expended in diffuse host rock deformation while increasing the frictional work done against slip (e.g., Madden et al., 2017; McBeck et al., 2018; McBeck et al., 2019). Thus, faults may propagate and slip only when the efficiency gained by reducing off-fault deformation (the decrease in internal work) is greater than the energy consumed in fracture growth and slip (the increase in frictional work and work of fault propagation).
The precise geometry of a fracture network, and whether it is dominated by one large fracture or several large fractures, has significant implications for fluid flow in the network, and the relationship between porosity and permeability. If the porosity of a rock volume arises from one dominant fracture, then the resulting permeability may be at the higher end of estimates. Instead, if the porosity arises from several large unconnected fractures, then the permeability may be lower than expected. The evolving and varying dominance of the largest fracture in these experiments underscore the importance of fluid flow simulations and experimental measurements when constraining permeability (e.g., Dardis and McCloskey, 1998; Bernabé et al., 2003; Costa, 2006; Watanabe et al., 2009).
Fracture Network Planarity
Tracking the similarity of the largest set of fractures to a plane with the r2 score indicates that this set of fractures does not systematically localize toward the final failure plane throughout the experiment. Instead, each experiment hosts short phases of delocalization in which the r2 score temporarily decreases or remains at similar values (Figure 9). If fracture networks develop from one dominant fracture that continually grows at the expense of others (Figure 12), then the r2 score may tend to increase monotonically. However, because one fracture does not tend to dominate the full fracture network throughout all of the experiments, the evolving geometry of the largest set of fractures does not systematically increase toward planarity.
The planarity immediately preceding failure of the largest set of fractures, with volumes >90th percentile, differs in the experiments on granite and monzonite (Figure 10). The r2 score is generally higher for the monzonite experiments than for the granite experiments. Similarly, the mean distance of the largest fractures to the failure plane is generally smaller for the monzonite experiments than for the granite experiments. Thus, the fracture network that develops immediately preceding failure in the monzonite experiments more closely matches a plane than the network that develops in the granite experiments. This difference may arise from the higher confining stress applied to the monzonite experiments (25–35 MPa) compared to the granite experiments (5–10 MPa). The higher confining stress could promote greater localization of the fracture network to a plane in the monzonite experiments. However, due to the potential influence of variability between rock cores, additional experiments are required to confirm this idea. Previous laboratory experiments demonstrate that higher confining stress can produce localized shear failure planes, while rocks under lower confinement fail via more distributed axial splitting (e.g., Amann et al., 2012). These laboratory results are also consistent with observations that indicate that earthquake-induced rock damage in southern California is more localized and continuous at greater depth than near the surface (Ben-Zion and Zaliapin, 2019).
The larger mean grain size of the monzonite compared to the granite could also contribute to this difference in localization. Grain boundaries in crystalline rocks can influence where fractures nucleate because the constitutive minerals have varying stiffness (e.g., Tapponnier and Brace, 1976; Moore and Lockner, 1995). The material contrast produces differential compaction that leads to stress concentrations. The smaller grain size in the granite could lead to more sites of fracture nucleation and termination at the edges of minerals of different stiffnesses than the monzonite. The resulting greater number of sites of nucleation and termination could then produce more delocalized fracture networks in the granite than the monzonite.
In most experiments, the Gini coefficient and the mean distance to the failure plane are relatively constant, and then accelerate and decelerate close to macroscopic failure, respectively (Figure 11). The timing of this change in rate occurs near or slightly before the macroscopic yield point (within 10 MPa of differential stress) in some of the experiments (e.g., granite #2, monzonite #4 and #5), while in others this change occurs at least 20 MPa of differential stress before the yield point (e.g., granite #4). Thus, the reorganization of the fracture network that includes accelerating localization toward the largest set of fractures often precedes the macroscopic yield point. The acceleration of fracture network localization produces increasingly larger changes in the axial contraction for equal increments of differential stress. Fracture network localization may coincide in time with a transition from slower to faster fracture growth (e.g., Thompson et al., 2006). Because we load the rock core with differential stress steps, and stop increasing the differential stress to acquire a tomogram, the fracture growth that we capture in the tomograms is stable, and does not occur with an accelerating, unstable rate. Thus, in our experiments, the acceleration of fracture network localization may coincide in time with the transition from slower to faster fracture growth. Under more continuous differential stress or axial strain loading conditions, the localization of the fracture network may coincide with the transition from stable to unstable fracture growth. Previous work has also inferred a link between unstable fracture growth and fracture coalescence (e.g., Nicksiar and Martin, 2012). Other work has linked the transition from quasi-static to unstable fracture growth to a critical crack length (e.g., Ohnaka and Kuwahara, 1990).
Conclusion
We quantify the spatial distribution of fracture networks throughout six in situ X-ray tomography triaxial compression experiments as they are loaded toward system-size failure under confining stress conditions of the upper crust. We assess the idea that one dominant fracture monotonically grows at the expense of others by tracking the ratio vmax/vtot of the largest fracture volume relative to the total fracture volume throughout each experiment. The ratio vmax/vtot does not systematically increase in the experiments. Following this result, we test if a set of the largest fractures continually dominates deformation by tracking the sum of the volume of the fractures with volumes >90th percentile relative to the total fracture volume,
Comparing the geometry of the set of the largest fractures to a plane with the r2 score indicates that it is more similar to a plane in the monzonite experiments than the granite experiments immediately preceding failure. In addition, the mean distance between the plane and the set of fractures is smaller in the monzonite experiments than the granite experiments immediately preceding failure. The smaller mean grain size in the granite may produce more sites of fracture nucleation and termination, leading to more delocalized fracture networks that deviate further from a plane. The higher applied confining stress of the monzonite experiments (25–35 MPa) relative to the granite experiments (5–10 MPa) may also contribute to the more localized fracture networks in the monzonite experiments. Tracking these metrics of localization reveals a close association between the macroscopic yielding of the rock and the acceleration of the localization of the fracture network. Near yielding,
Data Availability Statement
The datasets presented in this study can be found in online repositories. The names of the repository/repositories and accession number(s) can be found below: Renard, F. (2017). Critical evolution of damage towards system size failure in a crystalline rock [Data set]. Norstore. doi: 10.11582/2017.00025. Renard, F. (2018). Volumetric and shear processes in crystalline rock during the approach to faulting [Data set]. Norstore. doi: 10.11582/2018.00023. Renard, F. (2021). X-ray tomography data of Westerley granite [Data set]. Norstore. doi: 10.11582/2021.00002.
Author Contributions
JM designed the analysis and wrote the paper. YB-Z refined the analysis and helped write the paper. FR performed the experiments and helped write the paper.
Funding
The Research Council of Norway (Grant 300435 to JAM) and U.S. Department of Energy (Award DE-SC0016520 to YBZ) funded this work. Sigma2-NIRD provided data storage (Grant NS9073K). Beamtime was allocated at the European Synchrotron Radiation Facility (Long Term Proposal ES-295).
Conflict of Interest
The authors declare that the research was conducted in the absence of any commercial or financial relationships that could be construed as a potential conflict of interest.
Acknowledgments
We thank Elodie Boller, Paul Tafforeau, and Alexander Rack for advice about the design of the tomography setup, Benoît Cordonnier for the help with experiments, and Sanchez Technology for building the deformation apparatus. The Research Council of Norway (Grant 300435 to JAM) and U.S. Department of Energy (award DE-SC0016520 to YBZ) funded this work. Sigma2-NIRD provided data storage (Grant NS9073K). Beamtime was allocated at the European Synchrotron Radiation Facility (Long Term Proposal ES-295). The experimental data of time series of X-ray tomograms are available on Norstore: including the three monzonite samples (Renard, 2017, 2018), and the three Westerly granite samples (Renard, 2021). We thank Guest Editor Ernie Rutter, and Reviewers Alexis Cartwright-Taylor and Joern Lauterjung for suggestions that improved this manuscript.
Supplementary Material
The Supplementary Material for this article can be found online at: https://www.frontiersin.org/articles/10.3389/feart.2021.778811/full#supplementary-material
References
Aben, F. M., Brantut, N., Mitchell, T. M., and David, E. C. (2019). Rupture Energetics in Crustal Rock from Laboratory‐Scale Seismic Tomography. Geophys. Res. Lett. 46 (13), 7337–7344. doi:10.1029/2019gl083040
Aben, F. M., Doan, M.-L., Mitchell, T. M., Toussaint, R., Reuschlé, T., Fondriest, M., et al. (2016). Dynamic Fracturing by Successive Coseismic Loadings Leads to Pulverization in Active Fault Zones. J. Geophys. Res. Solid Earth 121 (4), 2338–2360. doi:10.1002/2015jb012542
Amann, F., Kaiser, P., and Button, E. A. (2012). Experimental Study of Brittle Behavior of clay Shale in Rapid Triaxial Compression. Rock Mech. Rock Eng. 45 (1), 21–33. doi:10.1007/s00603-011-0195-9
Benson, P. M., Thompson, B. D., Meredith, P. G., Vinciguerra, S., and Young, R. P. (2007). Imaging Slow Failure in Triaxially Deformed Etna Basalt Using 3D Acoustic-emission Location and X-ray Computed Tomography. Geophys. Res. Lett. 34 (3)
Ben-Zion, Y., and Sammis, C. G. (2003). Characterization of Fault Zones. Pure Appl. Geophys. 160 (3), 677–715. doi:10.1007/pl00012554
Ben-Zion, Y., and Zaliapin, I. (2020). Localization and Coalescence of Seismicity before Large Earthquakes. Geophys. J. Int. 223 (1), 561–583. doi:10.1093/gji/ggaa315
Ben-Zion, Y., and Zaliapin, I. (2019). Spatial Variations of Rock Damage Production by Earthquakes in Southern California. Earth Planet. Sci. Lett. 512, 184–193. doi:10.1016/j.epsl.2019.02.006
Bergbauer, S., and Martel, S. J. (1999). Formation of Joints in Cooling Plutons. J. Struct. Geology. 21 (7), 821–835. doi:10.1016/s0191-8141(99)00082-6
Bernabé, Y., Mok, U., and Evans, B. (2003). Permeability-porosity Relationships in Rocks Subjected to Various Evolution Processes. Pure Appl. Geophys. 160 (5), 937–960. doi:10.1007/978-3-0348-8083-1_9
Brace, W. F., Paulding, B. W., and Scholz, C. (1966). Dilatancy in the Fracture of Crystalline Rocks. J. Geophys. Res. 71 (16), 3939–3953. doi:10.1029/jz071i016p03939
Buades, A., Coll, B., and Morel, J. M. (20052005). “June). A Non-local Algorithm for Image Denoising,” in IEEE Computer Society Conference on Computer Vision and Pattern Recognition (CVPR'05) (IEEE), 60–65.Vol. 2
Chen, G., and Spetzler, H. (1993). Complexities of Rock Fracture and Rock Friction from Deformation of Westerly Granite. Pageoph 140 (1), 95–121. doi:10.1007/bf00876873
Cooke, M. L., and Madden, E. H. (2014). Is the Earth Lazy? A Review of Work Minimization in Fault Evolution. J. Struct. Geology. 66, 334–346. doi:10.1016/j.jsg.2014.05.004
Costa, A. (2006). Permeability‐porosity Relationship: A Reexamination of the Kozeny‐Carman Equation Based on a Fractal Pore‐space Geometry assumption. Geophys. Res. Lett. 33 (2). doi:10.1029/2005gl025134
Crider, J. G. (2015). The Initiation of Brittle Faults in Crystalline Rock. J. Struct. Geology. 77, 159–174. doi:10.1016/j.jsg.2015.05.001
Dardis, O., and McCloskey, J. (1998). Permeability Porosity Relationships from Numerical Simulations of Fluid Flow. Geophys. Res. Lett. 25 (9), 1471–1474. doi:10.1029/98gl01061
Del Castello, M., and Cooke, M. L. (2007). Underthrusting‐accretion Cycle: Work Budget as Revealed by the Boundary Element Method. J. Geophys. Res. Solid Earth 112 (B12). doi:10.1029/2007jb004997
Gini, C. (1921). Measurement of Inequality of Incomes. Econ. J. 31 (121), 124–126. doi:10.2307/2223319
Goebel, T. H. W., Kwiatek, G., Becker, T. W., Brodsky, E. E., and Dresen, G. (2017). What Allows Seismic Events to Grow Big? Insights from B-Value and Fault Roughness Analysis in Laboratory Stick-Slip Experiments. Geology 45 (9), 815–818. doi:10.1130/g39147.1
Griffith, A. A. (1921). VI. The Phenomena of Rupture and Flow in Solids. Philosophical Trans. R. Soc. Lond. Ser. A, containing Pap. a Math. or Phys. character 221 (582-593), 163–198.
Horii, H., and Nemat-Nasser, S. (1986). Brittle Failure in Compression: Splitting Faulting and Brittle-Ductile Transition. Phil. Trans. R. Soc. Lond. Ser. A, Math. Phys. Sci. 319 (1549), 337–374. doi:10.1098/rsta.1986.0101
Isida, M. (1971). Effect of Width and Length on Stress Intensity Factors of Internally Cracked Plates under Various Boundary Conditions. Int. J. Fract 7 (3), 301–316. doi:10.1007/bf00184306
Joussineau, G. d., Mutlu, O., Aydin, A., and Pollard, D. D. (2007). Characterization of Strike-Slip Fault-Splay Relationships in sandstone. J. Struct. Geology. 29 (11), 1831–1842. doi:10.1016/j.jsg.2007.08.006
Kandula, N., Cordonnier, B., Boller, E., Weiss, J., Dysthe, D. K., and Renard, F. (2019). Dynamics of Microscale Precursors during Brittle Compressive Failure in Carrara marble. J. Geophys. Res. Solid Earth 124 (6), 6121–6139. doi:10.1029/2019jb017381
Kattenhorn, S. A., and Marshall, S. T. (2006). Fault-induced Perturbed Stress fields and Associated Tensile and Compressive Deformation at Fault Tips in the Ice Shell of Europa: Implications for Fault Mechanics. J. Struct. Geology. 28 (12), 2204–2221. doi:10.1016/j.jsg.2005.11.010
Kemeny, J. M., and Cook, N. G. W. (1991). “Micromechanics of Deformation in Rocks,” in Toughening Mechanisms in Quasi-Brittle Materials (Dordrecht: Springer), 155–188. doi:10.1007/978-94-011-3388-3_10
Kranz, R. L. (1983). Microcracks in Rocks: a Review. Tectonophysics 100 (1-3), 449–480. doi:10.1016/0040-1951(83)90198-1
Lei, X., Kusunose, K., Rao, M. V. M. S., Nishizawa, O., and Satoh, T. (2000). Quasi-static Fault Growth and Cracking in Homogeneous Brittle Rock under Triaxial Compression Using Acoustic Emission Monitoring. J. Geophys. Res. 105 (B3), 6127–6139. doi:10.1029/1999jb900385
Lockner, D., Byerlee, J. D., Kuksenko, V., Ponomarev, A., and Sidorin, A. (1991). Quasi-static Fault Growth and Shear Fracture Energy in Granite. Nature 350 (6313), 39–42
Lyakhovsky, V., Hamiel, Y., and Ben-Zion, Y. (2011). A Non-local Visco-Elastic Damage Model and Dynamic Fracturing. J. Mech. Phys. Sol. 59 (9), 1752–1776. doi:10.1016/j.jmps.2011.05.016
Madden, E. H., Cooke, M. L., and McBeck, J. (2017). Energy Budget and Propagation of Faults via Shearing and Opening Using Work Optimization. J. Geophys. Res. Solid Earth 122 (8), 6757–6772. doi:10.1002/2017jb014237
McBeck, J. A., Aiken, J. M., Mathiesen, J., Ben‐Zion, Y., and Renard, F. (2020a). Deformation Precursors to Catastrophic Failure in Rocks. Geophys. Res. Lett. 47 (24), e2020GL090255. doi:10.1029/2020gl090255
McBeck, J., Aiken, J. M., Ben-Zion, Y., and Renard, F. (2020b). Predicting the Proximity to Macroscopic Failure Using Local Strain Populations from Dynamic In Situ X-ray Tomography Triaxial Compression Experiments on Rocks. Earth Planet. Sci. Lett. 543, 116344. doi:10.1016/j.epsl.2020.116344
McBeck, J. A., Zhu, W., and Renard, F. (2021). The Competition between Fracture Nucleation, Propagation, and Coalescence in Dry and Water-Saturated Crystalline Rock. Solid Earth 12 (2), 375–387. doi:10.5194/se-12-375-2021
McBeck, J., Cooke, M., Souloumiac, P., Maillot, B., and Mary, B. (2018). The Influence of Detachment Strength on the Evolving Deformational Energy Budget of Physical Accretionary Prisms. Solid Earth 9 (6), 1421–1436. doi:10.5194/se-9-1421-2018
McBeck, J., Cordonnier, B., Mair, K., and Renard, F. (2019). The Evolving Energy Budget of Experimental Faults within continental Crust: Insights from In Situ Dynamic X-ray Microtomography. J. Struct. Geology. 123, 42–53. doi:10.1016/j.jsg.2019.03.005
Miao, S., Pan, P.-Z., Zhao, X., Shao, C., and Yu, P. (2021). Experimental Study on Damage and Fracture Characteristics of Beishan Granite Subjected to High-Temperature Treatment with DIC and AE Techniques. Rock Mech. Rock Eng. 54 (2), 721–743. doi:10.1007/s00603-020-02271-4
Moir, H., Lunn, R. J., Shipton, Z. K., and Kirkpatrick, J. D. (2010). Simulating Brittle Fault Evolution from Networks of Pre-existing Joints within Crystalline Rock. J. Struct. Geology. 32 (11), 1742–1753. doi:10.1016/j.jsg.2009.08.016
Moore, D. E., and Lockner, D. A. (1995). The Role of Microcracking in Shear-Fracture Propagation in Granite. J. Struct. Geology. 17 (1), 95–114. doi:10.1016/0191-8141(94)e0018-t
Nicksiar, M., and Martin, C. D. (2012). Evaluation of Methods for Determining Crack Initiation in Compression Tests on Low-Porosity Rocks. Rock Mech. Rock Eng. 45 (4), 607–617. doi:10.1007/s00603-012-0221-6
Ohnaka, M., and Kuwahara, Y. (1990). Characteristic Features of Local Breakdown Near a Crack-Tip in the Transition Zone from Nucleation to Unstable Rupture during Stick-Slip Shear Failure. Tectonophysics 175 (1-3), 197–220. doi:10.1016/0040-1951(90)90138-x
Paterson, M. S., and Wong, T. F. (2005). Experimental Rock Deformation-The Brittle Field. Springer Science & Business Media.
Peng, S., and Johnson, A. M. (1972). Crack Growth and Faulting in Cylindrical Specimens of chelmsford Granite. Int. J. Rock Mech. Mining Sci. Geomechanics AbstractsPergamon 9 (1), 37–86. doi:10.1016/0148-9062(72)90050-2
Rawling, G. C., Baud, P., and Wong, T. F. (2002). Dilatancy, Brittle Strength, and Anisotropy of Foliated Rocks: Experimental Deformation and Micromechanical Modeling. J. Geophys. Res. Solid Earth 107 (B10), ETG.8. doi:10.1029/2001jb000472
Renard, F., Cordonnier, B., Dysthe, D. K., Boller, E., Tafforeau, P., and Rack, A. (2016). A Deformation Rig for Synchrotron Microtomography Studies of Geomaterials under Conditions Down to 10 Km Depth in the Earth. J. Synchrotron Radiat. 23 (4), 1030–1034. doi:10.1107/s1600577516008730
Renard, F., Cordonnier, B., Kobchenko, M., Kandula, N., Weiss, J., and Zhu, W. (2017). Microscale Characterization of Rupture Nucleation Unravels Precursors to Faulting in Rocks. Earth Planet. Sci. Lett. 476, 69–78. doi:10.1016/j.epsl.2017.08.002
Renard, F. (2017). Critical Evolution of Damage towards System Size Failure in a Crystalline Rock [Data Set]. Norstore. doi:10.11582/2017.00025
Renard, F., McBeck, J., Cordonnier, B., Zheng, X., Kandula, N., Sanchez, J. R., et al. (2019a). Dynamic In Situ Three-Dimensional Imaging and Digital Volume Correlation Analysis to Quantify Strain Localization and Fracture Coalescence in sandstone. Pure Appl. Geophys. 176 (3), 1083–1115. doi:10.1007/s00024-018-2003-x
Renard, F., McBeck, J., Kandula, N., Cordonnier, B., Meakin, P., and Ben-Zion, Y. (2019b). Volumetric and Shear Processes in Crystalline Rock Approaching Faulting. Proc. Natl. Acad. Sci. USA 116 (33), 16234–16239. doi:10.1073/pnas.1902994116
Renard, F. (2018). Volumetric and Shear Processes in Crystalline Rock during the Approach to Faulting [Data Set]. Norstore. doi:10.11582/2018.00023
Renard, F., Weiss, J., Mathiesen, J., Ben-Zion, Y., Kandula, N., and Cordonnier, B. (2018). Critical Evolution of Damage toward System-Size Failure in Crystalline Rock. J. Geophys. Res. Solid Earth 123, 1969–1986. doi:10.1002/2017jb014964
Renard, F. (2021). X-ray Tomography Data of Westerley Granite [Data Set]. Norstore. doi:10.11582/2021.00002
Sammis, C. G., and Ashby, M. F. (1986). The Failure of Brittle Porous Solids under Compressive Stress States. Acta Metallurgica 34 (3), 511–526. doi:10.1016/0001-6160(86)90087-8
Schubnel, A., Nishizawa, O., Masuda, K., Lei, X. J., Xue, Z., and Guéguen, Y. (2003). Thermo-Hydro-Mechanical Coupling in Fractured Rock. Basel: Birkhäuser, 869–887. doi:10.1007/978-3-0348-8083-1_5Velocity Measurements and Crack Density Determination during Wet Triaxial Experiments on Oshima and Toki Granites
Segall, P., and Pollard, D. D. (1983). Nucleation and Growth of Strike Slip Faults in Granite. J. Geophys. Res. 88 (B1), 555–568. doi:10.1029/jb088ib01p00555
Tapponnier, P., and Brace, W. F. (1976). Development of Stress-Induced Microcracks in Westerly Granite. Int. J. Rock Mech. Mining Sci. Geomechanics AbstractsPergamon 13 (4), 103–112. doi:10.1016/0148-9062(76)91937-9
Thompson, B. D., Young, R. P., and Lockner, D. A. (2006). Fracture in Westerly Granite under AE Feedback and Constant Strain Rate Loading: Nucleation, Quasi-Static Propagation, and the Transition to Unstable Fracture Propagation. Pure Appl. Geophys. 163 (5), 995–1019. doi:10.1007/s00024-006-0054-x
Watanabe, N., Hirano, N., and Tsuchiya, N. (2009). Diversity of Channeling Flow in Heterogeneous Aperture Distribution Inferred from Integrated Experimental‐numerical Analysis on Flow through Shear Fracture in Granite. J. Geophys. Res. 114 (B4), B04208. doi:10.1029/2008jb005959
Wong, T.-F. (1982). Micromechanics of Faulting in Westerly Granite. Int. J. Rock Mech. Mining Sci. Geomechanics AbstractsPergamon 19 (2), 49–64. doi:10.1016/0148-9062(82)91631-x
Wu, X. Y., Baud, P., and Wong, T. F. (2000). Micromechanics of Compressive Failure and Spatial Evolution of Anisotropic Damage in Darley Dale sandstone. Int. J. Rock Mech. Mining Sci. 37 (1-2), 143–160. doi:10.1016/s1365-1609(99)00093-3
Zabler, S., Rack, A., Manke, I., Thermann, K., Tiedemann, J., Harthill, N., et al. (2008). High-resolution Tomography of Cracks, Voids and Micro-structure in Greywacke and limestone. J. Struct. Geology. 30 (7), 876–887. doi:10.1016/j.jsg.2008.03.002
Keywords: fractures, localization, X-ray tomography, crystalline rock, triaxial compression
Citation: McBeck J, Ben-Zion Y and Renard F (2021) Fracture Network Localization Preceding Catastrophic Failure in Triaxial Compression Experiments on Rocks. Front. Earth Sci. 9:778811. doi: 10.3389/feart.2021.778811
Received: 17 September 2021; Accepted: 05 November 2021;
Published: 29 November 2021.
Edited by:
Ernest Henry Rutter, The University of Manchester, United KingdomReviewed by:
Alexis Cartwright-Taylor, University of Edinburgh, United KingdomJoern Lauterjung, Helmholtz Centre Potsdam, Germany
Copyright © 2021 McBeck, Ben-Zion and Renard. This is an open-access article distributed under the terms of the Creative Commons Attribution License (CC BY). The use, distribution or reproduction in other forums is permitted, provided the original author(s) and the copyright owner(s) are credited and that the original publication in this journal is cited, in accordance with accepted academic practice. No use, distribution or reproduction is permitted which does not comply with these terms.
*Correspondence: Jessica McBeck, j.a.mcbeck@geo.uio.no