
Abstract
The bulk properties of elementary metals and copper based binary alloys have been investigated using automated first-principles simulations to evaluate their potential to replace copper and tungsten as interconnecting wires in the coming CMOS technology nodes. The intrinsic properties of the screened candidates based on their cohesive energy and on their electronic properties have been used as a metrics to reflect their resistivity and their sensitivity to electromigration. Using these values, the 'performances' of the alloys have been benchmarked with respect to the Cu and W ones. It turns out that for some systems, alloying Cu with another element leads to a reduced tendency to electromigration. This is however done at the expense of a decrease of the conductivity of the alloy with respect to the bulk metal.
Export citation and abstract BibTeX RIS
Ever since the realization of the first central processing unit, the development of low cost, high density, low resistance interconnect has been a challenge faced by the microelectronics industry. The issue is to develop scaled interconnects that operate with an ever increasing switching speed, while minimizing the growing contribution of the resistance-capacitance (RC) of the metal. The later impacts on the timing of the operation of the logic gate and leads to a decrease in the switching speed of the gate, as the recovery delays keep on increasing. A solution to limit these effects has been introduced by the use of low resistance metals and low dielectric constant materials (low-κ).1 The aluminum wiring that was utilized in the pre-250 nm technology nodes has consequently been replaced by copper and tungsten ones,2,3 which drove to significant RC and reliability improvements.4–7
At present, the use of Cu interconnects requires depositing thin TaN and Ta barriers to limit the diffusion of copper into the low-κ. Cu interconnects start suffering from a major increase of the resistivity compared to its bulk counterpart due to aggressive downscaling of the interconnect line dimensions.8–11 The International Technology Roadmap for Semiconductors (ITRS) forecasts that a barrierless approach or self-forming barriers will be needed to unlock the interconnect technology as from the 22 nm node or below. In these dimensions, both the diffusion barriers and the adhesion layers will occupy a substantial fraction of the interconnect width (i.e. going from 2 to 3 nm), which reduces the section available for the current transport. Due to the confinement of the dimensions, the current density in the Cu layer becomes even more sensitive to scattering events such as the ones induced by impurities, grain boundaries and the surface roughness. This resistivity increases and the difficulty of filling (closing) the interconnecting vias during the film deposition can ultimately obstruct the downscaling of the physical dimensions of the interconnect technology. As an additional difficulty, copper has been reported to display an enhanced field induced atomic drift in narrow interconnecting lines (also referred to as an electromigration process), which leads to local thinning of the interconnects and to reliability issues.
In this context, the identification of low resistive metal, alternative to Cu and W (for memory applications), being either elemental or alloy based metals could help alleviating some of these problems, namely by suppressing the need of using seed and adhesion layers. A step forward to this direction has been done by the evaluation of the potential of amorphous/polycrystalline silicides and germanides based alloys12,13 as substitute to Cu and W.14 Unfortunately, although these materials have been used to minimize the resistance source/drain contacts in transistors, their electrical performances in physical dimensions below the 10 nm have been reported to be disappointing,13,14 leaving so far, an unmet challenge for interconnects. Interestingly for specific stoichiometries and upon application of a proper thermal treatment, some metallic alloys undergo a crystallization process in a cubic phase whose intrinsic resistivity has been reported to be in the same order of magnitude as the Cu one,15 i.e., well below its corresponding amorphous phase value. Such a process opens virtually the door to the engineering of relatively low resistivity alloys, with potentially improved electromigration properties/deposition conditions.
Though binary systems have extensively been studied by the metallurgic community, identifying the proper stoichiometry that leads to thermodynamic stable crystalline phases with the expected intrinsic electronic and electromigration properties remains a daunting task. This one is even made more complex by the absence of systematic report on their electromigration properties.
With that respect, the use of automated first-principles simulations can provide some guidance in the identification of materials with tailored properties.16,17 This approach consists in evaluating the enthalpy of formation, at a given stoichiometry, of a set of unique crystal structures representative of the metals and oxides found in nature. These are identified by data-mining crystallographic databases.18–21 Prototypes of the alloys are then built by substituting the atomic sites in the models by the metals considered. The structures are then ranked based on their enthalpy of formation, with the lowest ones corresponding to the thermodynamically most stable phases. They correspond to the apex of the thermodynamic diagrams measured experimentally. For these points, bulk properties related to the electromigration and to the electrical conductivity are then evaluated to establish the potential of the alloys for an interconnect application.
Although this technique is limited to the investigation of perfect bulk phase, it allows sketching a qualitative direction for the material selection process of the most relevant metallic alloys. Obviously, any alloy that display both deteriorated electronic and electromigration related properties has a low probability of having these properties being improved in a thin film or upon amorphization. While on the contrary, the ones that have properties close to Cu or W could be potential candidates.
In this paper, we report the ranking computed for elementary metals and for Cu based alloys with respect to the metals used in the current interconnects. We also show that the electrical resistivity, together with the electromigration, can be described in a first order approximation based on the electronic and cohesive properties of the crystals.
Methodology
The thermodynamic stability of the different binary alloys has been assessed following the technique proposed by Sluiter.16,17 The computational algorithm consists in evaluating the enthalpy of formation, at a given stoichiometry, of all the likely unique crystalline prototypes that have been observed to occur naturally. These unique crystal prototypes (about 400) have been identified by data-mining different crystallographic databases.18–21 At a given stoichiometry, the relevance of each prototype was then determined based on their statistical occurrences within the 290000 crystal structures reported in the open crystallography database.19
The phase diagram of a given alloy is then established by building a set of candidate crystal prototypes accounting for the different stoichiometries by substituting the atomic sites of the prototypes by the metal considered. Each model is then structurally relaxed and its enthalpy of formation is evaluated. The obtained prototypes are then ranked based on their enthalpy of formation, with the lowest ones corresponding to the thermodynamically most stable phases. They correspond to the apex observed for the phase stability diagrams measured experimentally. In case of the presence of magnetic elements, the polarization of the spin has been taken into account, accounting for all the possible accessible magnetic moments. The resulting energetic stabilization that arises in an anti/ferromagnetic alignment of the spins is hence captured. Despite the simplicity of the approach and the intrinsic limitation of DFT, this technique has been reported to provide qualitative/quantitative description of the enthalpy of formation of the crystal phases (and hence of its corresponding phase diagrams).16,17
The structural optimizations and the computation of the enthalpy of formation have been performed with the Quantum Espresso22 package using the projector augmented wave23 with a cut-off energy of about 500 eV and a minimum density of k points of about 35 k-points per Å−1. The geometry relaxation, cohesive energy and the enthalpy of formation have been evaluated within the Perdew-Burke-Ernzerhof (PBE)24 exchange-correlation functional. The resulting enthalpy of formation is then used to identify the most stable phase(s) at each stoichiometry. Once these latter are established, the phases with the most negative enthalpies of formation are selected to compute the electronic and cohesive properties. Because we cannot exclude generating metastable structures based on total energy calculation (or basically any phases that do not occur experimentally due to the limitations in the kinetics of formation), we selected all the structures lying within an energetic window of 0.1 eV, starting from the most negative enthalpy of formation.
Aside from the bulk intrinsic contributions, the evaluation of the transport and electromigration properties requires accounting for extrinsic effects such as the grain size, surface roughness and impurities present in the connecting wires. Although these are getting prominent in nano-scaled dimensions, we remained focus in the material selection process, on bulk intrinsic properties. In that context, we used the model developed by Drude25 to gain some insights into the properties defining the electronic conductivity of metallic alloys. This model states that in the direct current regime, the conductivity (σ) of a system can be captured based on the evaluation of the intrinsic scattering time (τ), the charge carrier density (ne2) and the corresponding averaged effective mass (m*):
![Equation ([1])](https://content.cld.iop.org/journals/2162-8777/4/1/N3127/revision1/jss_4_1_N3127eqn1.jpg)
The electronic contributions to Drude's formalism (namely ne2 and m*) have been evaluated using a smoothed Fourier interpolation of the band structure as developed by Madsen et al. in the BoltzTrap code.26 The analytical expression obtained from this transformation is then used to calculate the derivatives necessary for the transport distribution. The information based on the electronic structure provides indicators of the perturbations introduced by the alloying in the electronic structure and can be used as a first-order quantity to rank qualitatively the metals based on their conductivity. The scattering time is formally needed to quantify the conductivity/resistivity of the metals. The scattering term reflects the contributions of the scattering events induced by the interaction of the electron with i) other electron, ii) impurities, iii) grains and phonons as illustrated in Matthiessen's rule.27 Given that the focus is on modeling bulk intrinsic properties, the contribution of both impurities and grain boundaries have been neglected. Further, at room temperature, only the electronic states lying around the Fermi energy can contribute to the scattering process. The scattering can then be approximated by its dominant contribution, the electron-phonon coupling.28 It is also assumed that the electrons follow the equilibrium Fermi-Dirac distribution in the presence of a small temperature gradient. Within this approximation, the scattering rate of the electrons due to the electron-phonon coupling can be obtained using the standard first-order many-body perturbation theory, developed by P. B. Allen.29 The expression of the electron-phonon scattering time τ− 1e − p29 takes the form:  , where ν, is the phonon frequency and α2F(ω) is electron-phonon spectral function. The electron-phonon spectral function expression weights the differences in the Fermi velocity between different points on the Fermi surface. The weight function value has been fixed to 1, as it appears in the Midgal-Eliashberg theory of superconductivity.29 For further details, interested readers can also refer to literature.27–29 The spectral functions have been evaluated using density perturbation theory coupled with the maximally localized Wannier functions as is implemented in the pwscf package.30 The computation of the density of states has been carried out using a dense Monkhorst-Pack grid of minimum 32 × 32 × 32 grid of k points for the elemental metals and their phonon density of states has been computed a regular 8 × 8 × 8 q point meshes.
The combination of the resulting electron-phonon scattering time with the charge carrier density and the effective mass averaged at the Fermi level at room temperature provides some qualitative evolution of the intrinsic conductivity of the metals (see below). However, the evaluation of the scattering time being a computationally very demanding task, it is practically not feasible to apply this formalism to systems containing more than a few atoms in their unit cells. The evaluation of the scattering time has hence mainly been limited to the case of elemental systems. Fortunately, the electronic contributions (ne2 and m*) present in Drude's model (Eq. 1) already provide some useful information on the bulk resistivity that can be used to rank the alloys (see below).
The electromigration process results from a combination of different extrinsic and intrinsic factors such as grain boundaries, impurities, defect, and atomic binding strength, which makes the modeling of the process complex. It translates the easiness of atoms to diffuse upon the presence of an electric field, which also reflects, in a first order approximation, the strength of the metallic bonds. The latter is fortunately a quantity easily accessible in first-principles simulations since it is correlated with the binding (cohesive) energy of a substance.31 In the following, we hence use the cohesive energy of perfect crystalline material as a first-order indicator of the tendency of the metal to drift.
Results
In this section, we benchmark the computed values with the experimental ones reported in literature25–29 (see Figure 1). Consistently with previous reports, the computed energies of cohesion correlates linearly with their experimental counterparts (Figure 1a).28 This illustrates that first principles simulations are accurate enough to reproduce the experimental measurements. The binding energies are also found to be proportional to the melting temperatures (Figure 1b), to the activation energy of thermally induced diffusion process and to the vacancy formation energy in metallic alloys.32 Given that the cohesive energy captures numerous atomistic events that are active in the electromigration degradation of the interconnects, we argue that it reflects the intrinsic performances of the chosen metal. For Cu the cohesive energy is found to be 4 eV (see Figure 1b). Based on the considerations here-above mentioned, any serious challenger to Cu should display a larger value. This implies stronger metallic bonds, which is in turn, translated by a reduction of the likeliness of forming atomic vacancies and by an increase of their diffusion barrier. The combination of these factors are expected to lead to a reduced electromigration. Consistently with this picture, the cohesive energy of W is found to have the highest value amongst all the pure metals (8.5 eV), suggesting that W is less sensitive to electromigration issues. This is in agreement with the current use of W in word and bit lines in volatile and non-volatile memories. Similarly, Al has a smaller cohesive energy (about 3.4 eV), implying that it suffers from more pronounced electromigration problems than Cu, as observed experimentally.5–7 Interestingly, Figure 1a shows that Ni, Co, Cr, Pd, Ti, V, Rh, Pt, Zr, Hf, Ru, Mo, Tc, Nb, Ru, Ta, Re, Os have cohesive energies larger than the Cu one and hence should have less intrinsic electromigration issues.
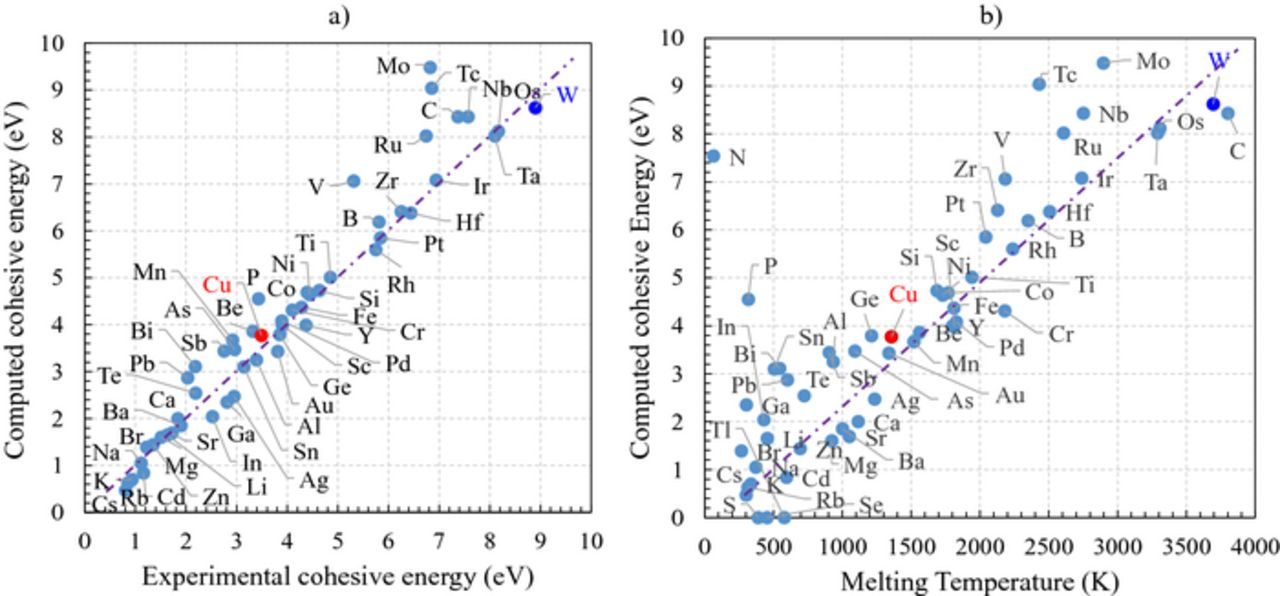
Figure 1. a) Computed cohesive energy as a function of the experimental cohesive energy.32 b) Computed cohesive energy as a function of the experimental melting temperature.32 Reference metals such as Cu and W are colored in red and blue, respectively. Stripped lines represents the proportionality between the cohesive energy and the melting temperature for the sake of visual guidance.
Next, we assess the accuracy of the computed ingredients used to evaluate the bulk intrinsic electrical resistivity: the charge carrier density (ne2), the averaged effective masses (m*) and the scattering time (τ) used in Eq. 1. As a reference, we review the values computed for the case of Al, Cu and Au in Table I.
Table I. Comparison of the computed electronic contribution (ne2 τ/m*), the scattering relaxation time (τ) and of the corresponding bulk resistivity (ρ) to literature values25 for bulk Al, Cu and Au. The temperature used in the calculations is 270 K.
| ne2 τ/m* (μΩ.cm.s)−1 | τ (s) | ρ (= 1/σ) (μΩ.cm) | ||||
|---|---|---|---|---|---|---|
| This work | Ref. 25 | This work | Ref. 25 | This work | Ref. 25 | |
| Al | 3.16E + 13 | 5.10E + 13 | 9.03E-15 | 8.00E-15 | 2.82E + 00 | 2.45E + 00 |
| Cu | 1.52E + 13 | 2.37E + 13 | 2.17E-14 | 2.70E-14 | 1.68E + 00 | 1.56E + 00 |
| Au | 1.66E + 13 | 1.63E + 13 | 1.69E-14 | 3.00E-14 | 2.44E + 00 | 2.04E + 00 |
The agreement obtained between the simulated and the experimental values is good for both the electronic and the relaxation time contributions. Indeed, DFT captures properly the increase in relaxation time whenever going from Al to Cu and Au. Also, the value computed for Cu is found to be close to the Au one. Similarly, the order of magnitude of  is similar to the reference values,25 although their actual number is slightly underestimated. Note however that these have been evaluated using an indirect procedure based on the ratio between the experimental resistivity and the theoretical relaxation time reported in literature.25 Therefore, there is a certain degree of uncertainty on the estimation. As a result, it is more realistic to compare the computed values of the resistivity to the experimental ones. In this case, the simulated resistivity have deviations that range within 10 to 20% of the experimental values.
Finally, the temperature dependency of the resistivity is properly captured by Eq. 1, as illustrated for the case of Ta and Cu in Figure 2. Note that the computed resistivity of Cu is slightly overestimated with respect to the experimental measurements due to the approximation of the weight function of the Fermi velocity used.29
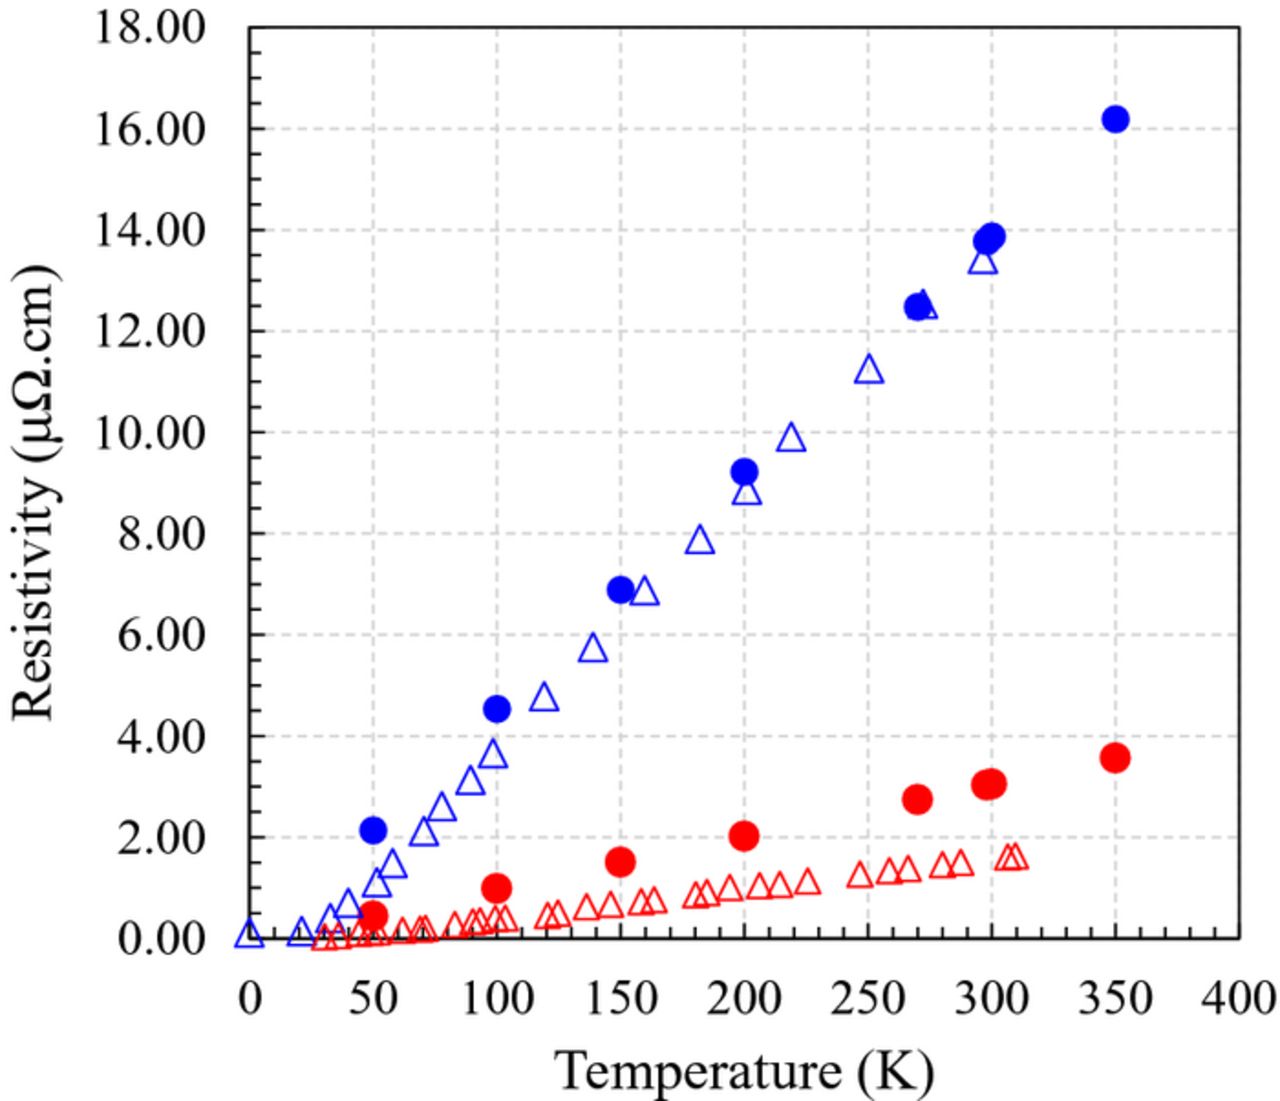
Figure 2. Comparison of the temperature dependence of the computed (closed circles) bulk resistivity (ρ) of Cu (red) and Ta (blue) with the experimental measurements (open triangles).29
It is interesting to extend this exercise to other metals and to separate the evolution of the electronic contribution (Figure 3a) from that of the relaxation time (Figure 3b). Indeed, the examination of the electronic contribution shows that Cu, Ru, Ta, Nb, Sn, Zn and Fe are similar, while Au, Bi, Ag, Al, In, Rh, and Ir have larger electronic contributions. Compared to W, Cu has a larger charge carrier density and a slightly reduced density of states effective mass. The combination of these two contributions is at the origin of its low resistivity. The examination of the distribution of the scattering relaxation term (τ) (Figure 3b) also shows that, after Ca, Cu has the largest relaxation time of all the metals. Given that the reactivity of Ca makes it incompatible with any industrial CMOS process flow, Cu is scoring as being the most performant candidate among all the metals considered. Interestingly, Pd, Mg, Pt, Ag, Rh, Ni, Co Al, and Au have a relaxation time larger or equal to the W one.
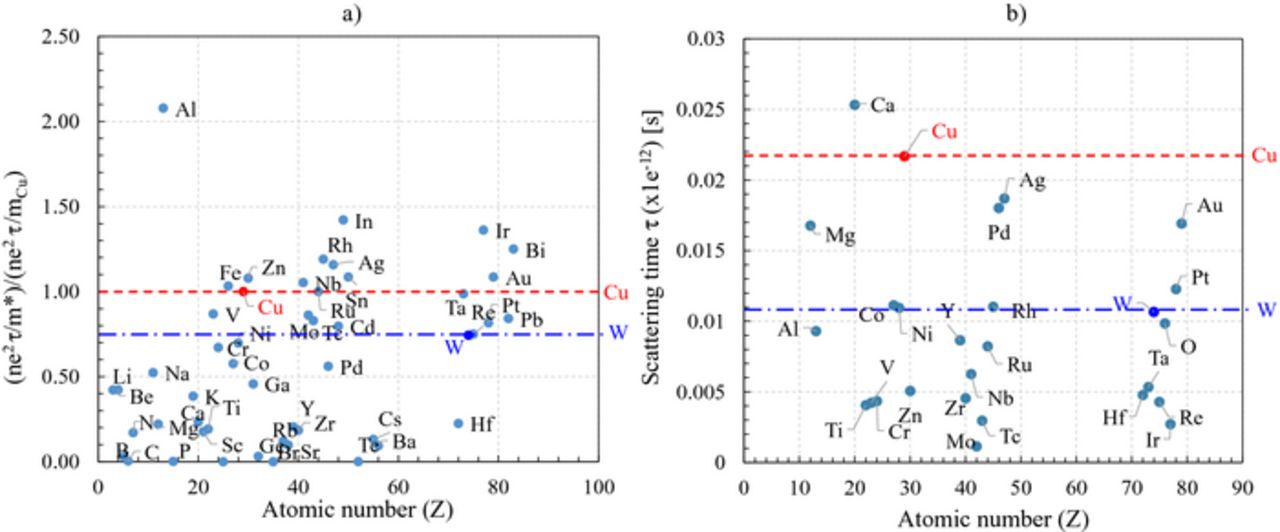
Figure 3. a) Evolution of the electronic contributions (included in  ) and b) of the scattering time of the metals present in the periodic table with respect to those of Cu (red dotted line) and W (blue stripped line) as a function of the atomic mass (Z). Note that the values of the electronic contributions have been normalized with respect to that of Cu.
At this stage, it is educative to establish a figure of merit to gauge the sensitivity that a metal has toward electromigration and resistance. This aspect is captured by plotting the evolution of the cohesive energy versus the bulk intrinsic resistivity (Figure 4). To outperform Cu, the candidate should ideally have a cohesive energy larger than 4 eV and an intrinsic resistivity lower than ∼3 μOhm.cm. This sets the lower boundary of the figure of merit (as set by the section surrounded by a red line in Figure 4). Unfortunately, there is no elementary metals scoring in this area. Another edge of the figure of merit is defined by the position of W (stripped blue line), with both a larger resistivity (about 9 μOhm.cm) and cohesive energy (8.5 eV). Any metal located between the boundaries defined by Cu and W could hence potentially replace W. It is important to realize that a too high cohesive energy is also detrimental since it also correlates with a high crystallization temperature and therefore potentially with the creation of a high density of grain boundaries. These are contributing to an increase of the resistivity in nanoscaled interconnects. This is currently one of the issues met with the integration of W. In this case, selecting a metal with a slightly lower cohesive energy than 8.5 eV (but still larger than the Cu one) could help reducing this issue.33 With that respect, metals such as Os, Pt and Rh could meet the requirements. However, their natural abundance is weak, which makes their usage economically not viable.
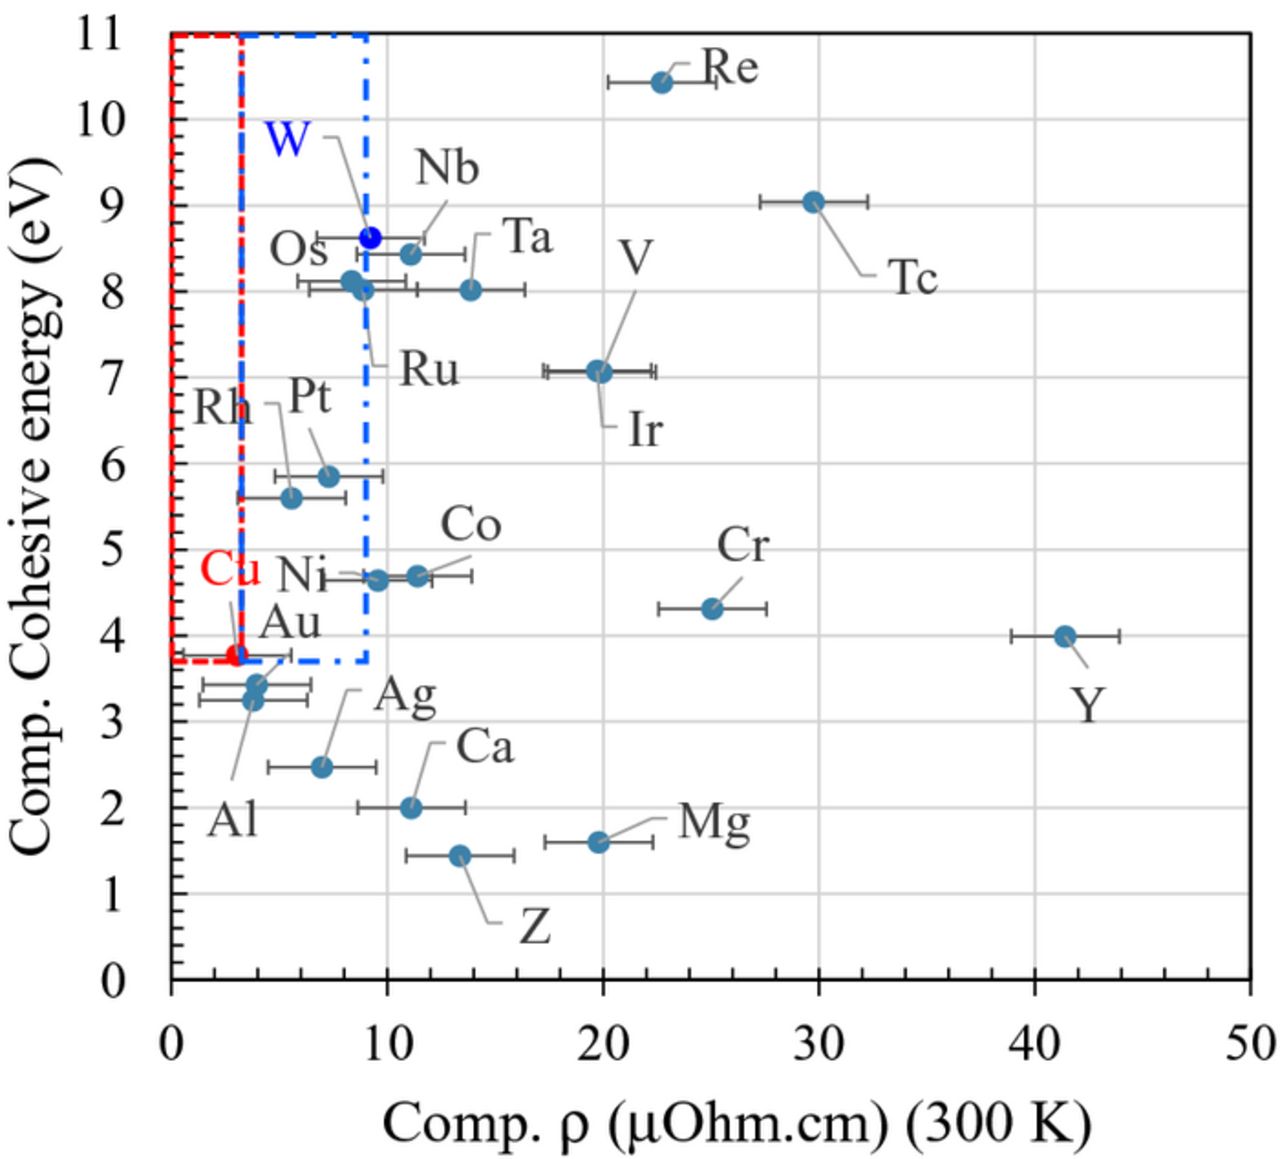
Figure 4. Evolution of the computed cohesive energy as a function of the computed bulk resistivity of elementary metals. The sections colored in red and blue indicate the areas where metals with improved properties with respect to Cu (red) and W (blue) are expected to be found. The resistivity values are computed at 300 K. The values computed for Hf, Zr, Ti and Y are found to be larger than 30 μOhm.cm and are not reported. The error bar corresponds to the deviations expected (10%) for the computed values with respect to the corresponding experimental ones.
Given the lack of cost-effective simple solutions, it is interesting to investigate whether metal alloying could open some engineering alternative. In their amorphous state, most of the binary alloys display an increase in resistivity with respect to their constituting counterparts. However, at a given stoichiometry and upon the application of proper thermal treatments, certain alloys crystallize in a low resistivity ordered phase.15 For instance, in its amorphous phase Cu0.5Au0.5 has been reported to have a resistivity that goes up to 14.2 μOhm.cm. While upon the application of a thermal annealing treatment, the resistivity of the alloy goes down to 3.65 μOhm.cm.15 Naturally, alloying Cu with Au is an expensive solution. It however opens the perspective of being able to tailor the properties of Cu and constitutes a system of choice to evaluate the screening methodology that we implemented.
As mentioned in the methodology section, the calculation of the formation enthalpy has been used to identify the phase diagram of the Cu based alloys. Although the formation of some phases have negative enthalpy of formation, only the ones present at the apex of the distribution are relevant (see Figure 5). In some instances (for instance at 0.33), the energy difference between the different crystal prototypes is so small that they lie within the numerical accuracy of the method. To circumvent this problem, we computed the properties of all the prototypes lying within an energetic interval of 0.1 eV close to the border of the distribution. The energetic proximity implies that during a crystallization or an annealing process in a confined pattern, there is a risk that these different phases intermix, which can potentially leads to an enhanced resistivity.15
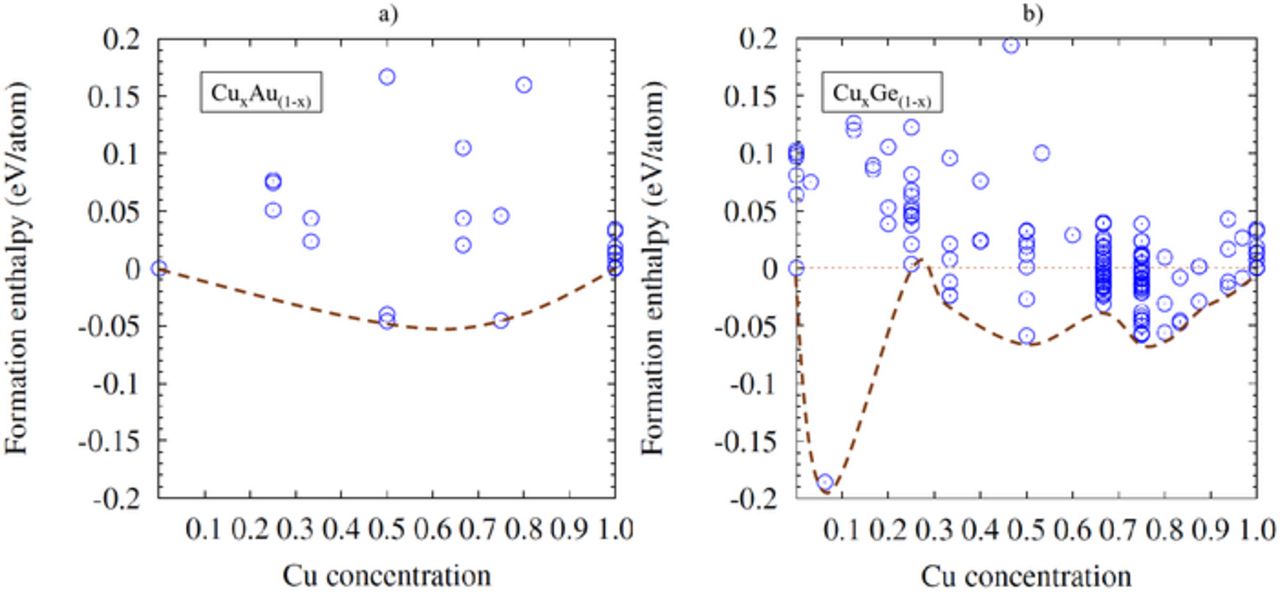
Figure 5. Computed formation enthalpies of CuxAu(1-x) and CuxGe(1-x) alloys as a function of the Cu concentration shown in a and b, respectively. The most stable phases are shown by the apex of the distribution (illustrated by the connecting line). Note that only the phases that have a negative enthalpy of formation and that are within 0.1 eV from the edge of the distribution are displayed.
In most of the cases (see below), we found that Cu does not easily intermix with other elements. This is translated by the positive formation enthalpies for most of the prototypes and stoichiometry tested. For instance, in the case of CuxAu(1-x), the alloying process leads to the formation of thermodynamically unstable phases for most of the stoichiometries. Indeed, at the exception of Cu0.75Au0.25 and Cu0.5Au0.5, all the formation enthalpies computed for the prototypes are found to be positive, which indicates that the system has a tendency to segregate. For the stable phases, Cu0.75Au0.25 and Cu0.5Au0.5 are predicted to be in the Pm3m and P4/mmm space groups, which is consistent with the experimental report of Okamoto et al.34 Note that for Cu0.5Au0.5, two different phases can exist (Cu0.5Au0.5-I, the most stable) and (Cu0.5Au0.5-II), depending on the thermal treatment applied,35 consistently with the computed phase diagram reported in (Figure 5a). Since the stability of a phase is proportional to its enthalpy of formation, structures with a weak exothermic enthalpy of formation (as illustrated for CuxGe(1-x) in Figure 5b) face the risks of becoming unstable upon the application of thermal treatments such as the ones typically used in the integration of a CMOS transistor back end of line.
Next, we review the corresponding electronic and cohesive properties for the most relevant (stable) phases of CuxAu(1-x) and CuxGe(1-x). The relaxation time of the alloys has only been computed for CuxAu(1-x) due to the computational cost aspect of the technique. For the other metals, the  ratio already offers some useful insights on the resistance that can be expected compared to that of Cu.
The resulting electronic properties are distributed in Figures 6a and 6b. The coloring used reflects the value of  normalized to the Cu one. Dark hues imply a larger electronic contribution to the electrical conductivity than the Cu one. None of the computed stoichiometry outperform Cu for the two systems. The two alloys have
  ratio ranging within 20 to 80% of the Cu value. While this degradation of the electronic properties could intuitively be expected for the CuxGe(1-x) case due to the alien character of the intermixed element, the ones observed for CuxAu(1-x) is somewhat surprising. Indeed, the similar occupation of the valence shell electrons (d10 s1) for Cu and Au was expected to preserve the topology of the band structure and of the Fermi level. This is obviously not the case since the intermixing leads to an increase of the effective mass and to a slight reduction of the charge carrier density. As a result, their contribution to the 'electronic' part of the conductivity is slightly lessened. Finally, although the relaxation times computed for bulk Cu (1.95E-14 s) and Au (1.52E-14 s) are found to be relatively close to each other, the relaxation time obtained for different intermixing depends on the phase. For instance for Cu0.75Au0.25 and Cu0.5Au0.5 (phase I), the obtained value is found to be close to the Au and Cu one (∼2E-14 s), while for Cu0.5Au0.5 (Phase II) their intermixing leads to a decrease of the relaxation time to 7.24E-15 s. The combination of these two aspects is detrimental for the conductivity of the CuxAu(1-x) alloys and leads to resistivity about 1.5 to 4 times larger than the Cu ones with values ranging from 19.1 μOhm.cm (Cu0.5Au0.5 – phase II) to 4.4 μOhm.cm (Cu0.75Au0.25-Cu0.5Au0.5 – phase I).
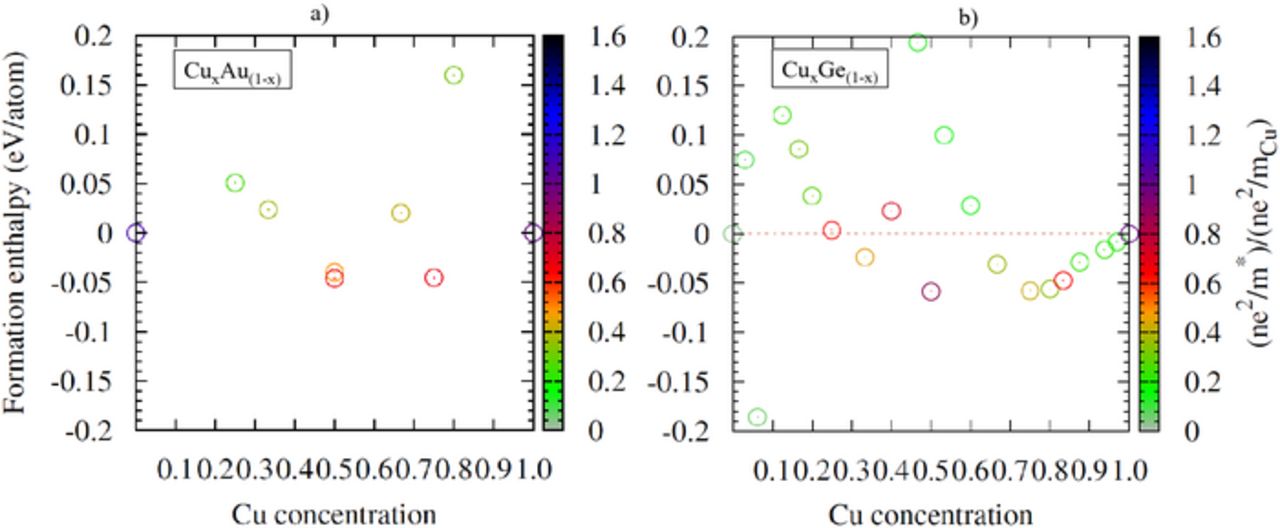
Figure 6. Distribution of the enthalpy of formation computed for the most stable phases found for the CuxAu(1-x) (left) and CuxGe(1-x) (right) alloys as a function of the concentration of Cu. The coloring of the dots depicts the value of the electronic properties contribution ( ) normalized to the Cu one. The dark hues correspond to improved electronic properties with respect to Cu.
Intermixing Cu and Au or Cu and Ge has little impact on the cohesive energy of the different stoichiometry (Figure 7). Indeed, in their bulk phases, Cu, Ge and Au have very similar bond strengths. Intermixing them therefore does not lead to any improvement. However, when the elements have very different binding energies, as it is the case for instance for Cu and Rh, the resulting cohesive energy of the alloys reflects an approximated weighted average of the stoichiometry. However, this is systematically done at the expense of the contribution of the electronic properties to the conductivity.
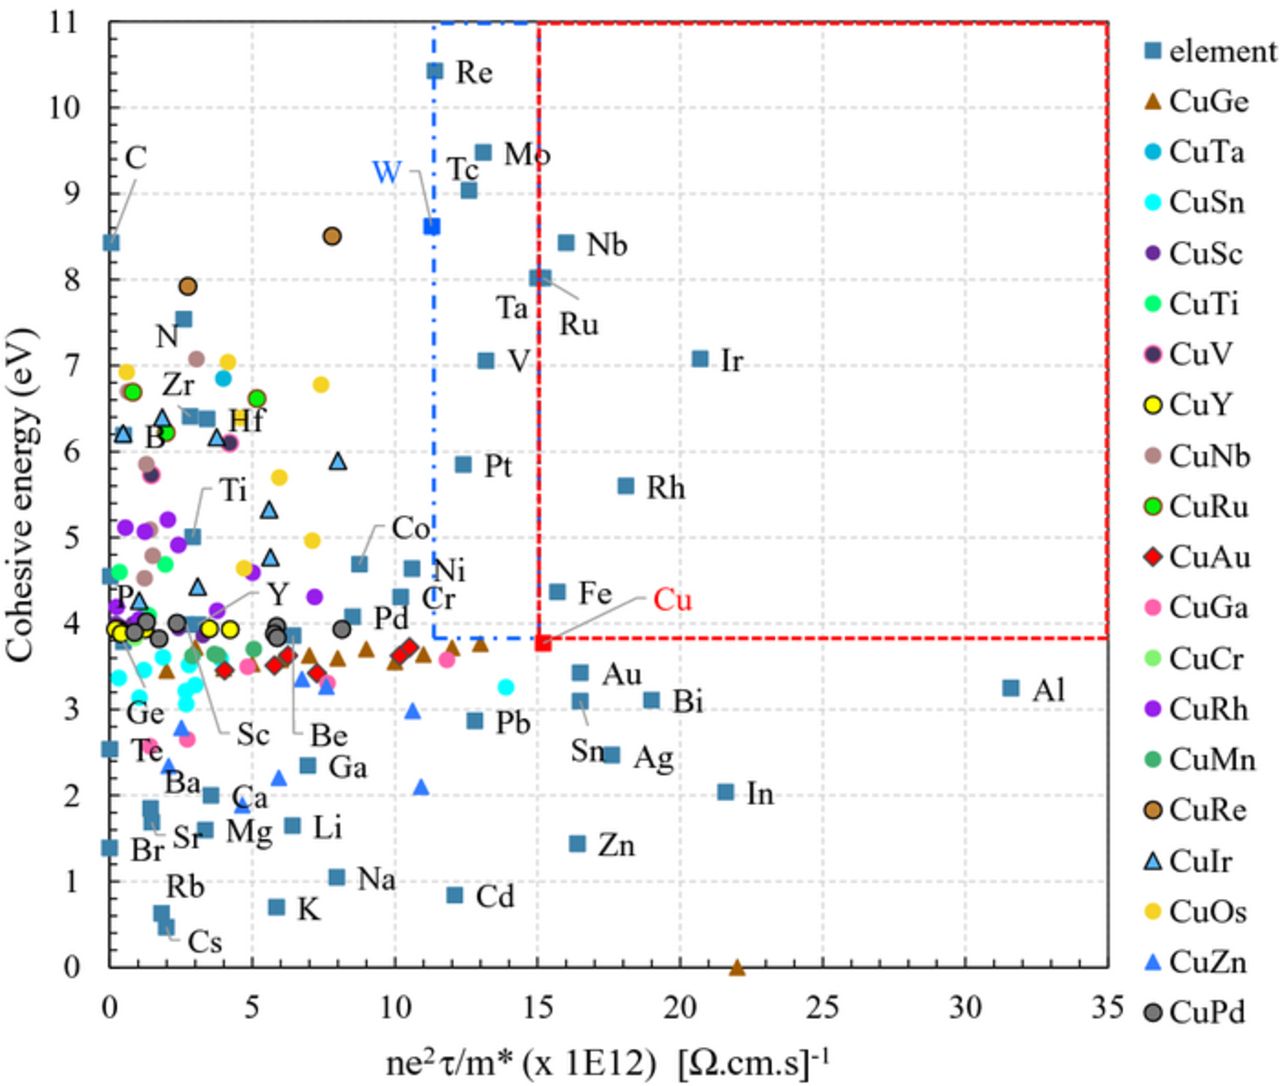
Figure 7. Computed cohesive energy as a function of the electronic properties contribution ( ) for several metallic binary alloys (see the text for details). For visual guidance, color areas are used for metals with improved properties with respect to Cu (red) and W (blue).
We expanded the study to the examination of other Cu based alloys, namely CuxTa(1-x), CuxSn(1-x), CuxTa(1-x), CuxTi(1-x), CuxNb(1-x), CuxRu(1-x), CuxGa(1-x), CuxRh(1-x), CuxIr(1-x), CuxZn(1-x), CuxBi(1-x), CuxSc(1-x), CuxV(1-x), CuxY(1-x), CuxCr(1-x), CuxRe(1-x), CuxOs(1-x), CuxPd(1-x) (Figure 7). The trend observed is similar to the one reported here-above for CuxAu(1-x) and CuxGe(1-x): alloying Cu with another metallic element leads to a reduction of the  term with respect to the Cu case, while the cohesive energy is improved. This suggests that the engineering of the electromigration properties of Cu using alloying is possible at the expense of its electrical resistivity.
At this point, it is interesting to underline the fact that these results can be exploited in a different perspective. Indeed, it is well known that the electromigration process in copper interconnect can be minimized by the selection of a proper capping layer. For instance the use of CoWP has been reported to improve the electromigration.36 The origin of the enhancement has been reported to be related to the alloying of Co with Cu37 and to its diffusion at the grain boundaries. The latter significantly alters the adhesion at the grain boundary interfaces. In other words, it tunes the binding (cohesive) energies between the capping layer and Cu. This leads to a minimization of the void growth rate, which in turn, reduces the electromigration process.37 The interface cohesive energy is a local effect that reflects the binding strength, which is, in a first order approximation, captured by the bulk cohesive energies of the corresponding alloys.
Therefore, our results can be also be used as guidelines to identify new capping layers for interconnect to minimize the electromigration process. Note however, that depending on the concentration, the alloying/metal diffusion will also contribute to a degradation of the electronic properties at the grain boundaries and hence to an increase of the resistivity.
Conclusions
The properties of bulk metal and Cu based alloys have been investigated using automated first-principles simulations to evaluate their potential to replace Cu and W, as a metal source used in the interconnect wiring for the sub-10 nm CMOS technology node. A figure of merit has been established using the computed cohesive energy and the intrinsic bulk resistivity to reflect the electromigration and the conductivity of pure metals and binary alloys. It turns out that within this metrics, Cu remains an uncontested reference. Indeed, while it is possible to reduce the sensitivity of Cu to the electromigration by alloying it with another metal, this improvement is done at the expense of a reduction of the bulk intrinsic conductivity of the alloy compared to the Cu case. The alloys studied have, so far, been limited to most of the Cu based ones and does not constitute a sampling representative enough of all the possible combinations of the periodic table. It is therefore crucial to pursue the exploration of alternative alloys to evaluate their potential.