

Abstract
We grow BaHfO3 (BHO) nanorods in REBa2Cu3O7−x (REBCO, RE: Gd or Y) thin films on metal tapes coated with the inclined substrate deposited (ISD)-MgO template by both electron beam physical vapour deposition and pulsed laser deposition. In both cases the nanorods are inclined by an angle of 21°–29° with respect to the sample surface normal as a consequence of the tilted growth of the REBCO film resulting from the ISD-MgO layer. We present angular critical current density (Jc) anisotropy as well as field- and temperature-dependant Jc data of the BHO nanorod-containing GdBCO films demonstrating an increase in Jc over a wide range of temperatures between 30 and 77 K and magnetic fields up to 8 T. In addition, we show that the angle of the peak in the Jc anisotropy curve resulting from the nanorods is dependent both on temperature and magnetic field. The largest Jc enhancement from the addition of the nanorods was found to occur at 30 K, 3 T, resulting in a Jc of 3.0 MA cm−2.
Export citation and abstract BibTeX RIS
1. Introduction
Nano-sized perovskite inclusions have gained much attention as effective artificial pinning centres due to their ease of incorporation into REBa2Cu3O7−x (REBCO, RE = Y, Gd, Sm, ...) and self-assembly into nanocolumns [1, 2]. Such oxide heterostructures with controllable size and regularity are desirable for engineering the pinning landscape of coated conductors [3, 4] in order to meet the needs of a growing range of applications [5–10]. BaHfO3 (BHO) has become heavily investigated in recent years as one such inclusion material as it has been repeatedly shown to form long, columnar inclusions within REBCO films and provide considerable pinning enhancement in high magnetic fields [11–15]. In this paper, we utilise inclined substrate deposited (ISD)-MgO as a template for the study of incorporation of BHO into tilted REBCO films. ISD-MgO is one of the approaches used as a template layer in coated conductors for achieving good biaxial texturing of the superconducting layer [16], allowing the manufacture of long tapes, with current production lengths of 600 m at THEVA Dünnschichttechnik GmbH. A unique feature of the ISD template is that the MgO [100] direction is offset by 30° with respect to the sample surface normal and thus produces a REBCO crystal structure with an identical tilt. This allows for the growth of very thick films due to a non-zero growth component in the REBCO ab-direction, increasing the stability of c-axis oriented growth over a-axis misoriented grains [17]. Recently it was observed that growth of c-axis-correlated BHO nanocolumns is suppressed within REBCO grown on ISD-MgO in favour of Hf- and RE-containing platelets aligned parallel to the REBCO ab-plane [18], the regularity and size of which can be controlled [15]. We subsequently showed that this is due to tilting of the REBCO principle axes with respect to the incident angle of the incoming growth species [19]. These ab-aligned platelets can increase the anisotropy of the critical current density (Jc) at 77 K and provide only a small increase in Jc at 30 K [18]. Thus, greater control over the pinning landscape in BHO-containing REBCO films on ISD templates is desirable.
Here we show that formation of BHO nanostructures providing considerable in-field Jc-enhancement is indeed possible on ISD-MgO coated conductor templates, allowing for a much broader range of applications.
2. Experimental details
Substrates consisting of 12 mm wide Hastelloy tapes coated with an ISD-MgO layer, an MgO cap layer and a GdBCO seed layer were prepared in a dynamic process at 30 m h−1 by electron beam physical vapour deposition (EB-PVD). Details of the deposition processes have been published previously [16]. BHO-containing GdBCO films with a thickness of over 1 μm were deposited via EB-PVD of a GdBCO and HfO2 granulate mixture, also as previously published [18]. BHO-containing YBCO films were deposited from a pre-mixed target on identical substrates by pulsed laser deposition (PLD) using a Coherent LPX305Pro KrF excimer laser (λ = 248 nm) having an energy density of 1.6 J cm−2 at the target surface and a pulse frequency of 30 Hz.
Specimens for transmission electron microscopy (TEM) were prepared by focused ion beam. Annular dark field scanning transmission electron microscopy (ADF-STEM), selected area electron diffraction (SAED) and energy dispersive x-ray spectroscopy (EDX) were performed on a FEI Titan 'cubed' aberration-corrected electron microscope operated at an acceleration voltage of 300 kV. SAED patterns were indexed according to [20]. For EDX mapping a 'Super-X' wide solid angle EDX detector was used.
Film texture values were determined from x-ray diffraction pole figures of the GdBCO (103) reflection collected via two-axis measurements (in-plane φ = 0°–360°, out-of-plane ψ = 0°–80°) using a Philips X'Pert x-ray diffractometer with Cu-Kα radiation.
For resistive measurement of the Jc and critical temperature (Tc) of the GdBCO samples, bridges of 1.75 mm width and 10 mm length were prepared by photolithography and chemical etching. In-field Jc measurements were carried out in the maximum Lorentz force configuration via four-point probe in a cryogen-free cryostat equipped with a rotating sample holder and conduction-cooled 8 T superconducting magnet [21]. For Jc anisotropy measurements a step width of 5° was used, with a smaller step width of 3° close to the ab-plane-correlated pinning peak. The angle between the applied magnetic field (μ0H) and the sample was recorded during the measurement to account for twisting of the sample rod. The pinning force Fp = Jc × B was fit using the Dew-Hughes model [22] and Jc anisotropy peak positions were determined using the vortex path model [23]. For the YBCO sample Jc anisotropy was measured in a quantum design physical property measurement system on a bridge of 0.5 mm width and 0.8 mm length patterned by laser cutting [24].
The BHO content of each film was determined by Hf measurement via inductively coupled plasma atomic emission spectroscopy.
3. Results
3.1. Structural analysis
ADF-STEM images of GdBCO films containing no BHO and 9.0 mol% BHO can be seen in figure 1. An analysis of 12–30 grain boundaries per sample reveals the mean of the angle with the sample surface normal (θGB) to be 11° with a standard deviation (σ) of 6° for the BHO-free sample and θGB = 59°, σ = 4° for the 9.0 mol% BHO sample. The latter also has a smaller number of grain boundaries at θGB = –18°, σ = 1°. For both samples the GdBCO ab-planes are at a tilt angle of 60°.

Figure 1. ADF-STEM cross-sectional images of (a) BHO-free and (b) 9.0 mol% BHO-containing GdBCO samples. Grain boundaries are marked with black arrows.
Download figure:
Standard image High-resolution imageFurther ADF-STEM images of three EB-PVD-GdBCO films and one PLD-YBCO film with BHO-contents of 0 mol%, 2.1 mol%, 4.0 mol% and 5.0 mol%, respectively, are displayed in figures 2(a)–(d). The positions of grain boundaries, CuO double-chain intergrowths (REBa2Cu4Oy), Gd2O3/BHO stacked platelets and BHO nanorods are marked. In the case of the platelets, EDX elemental maps show some overlap between Gd- and Hf-containing phases and thus the presence of a third, Gd- and Hf-containing phase such as Ba2GdHfO5.5 is also possible but unconfirmed due to its almost identical lattice constant to that of BHO. Tilted nanorods are identified through Moiré fringes, present due to the epitaxial relationship between BHO and GdBCO described below [13], and through Hf-rich areas identified in EDX elemental maps, neither of which are observed in BHO-free films. The distributions of the angles the nanorods make with the surface normal (θ) and their length (l) are shown in figures 2(e)–(g). The 2.1 mol% BHO-containing film (figure 2(b)) shows a fine distribution of nanorods 5 nm ± 1 nm in diameter and, most notably, aligned at a mean tilt angle θ = 29° with σ = 6°. The 4.0 mol% BHO film (figure 2(c)) exhibits shorter, wider nanorods 6 nm ± 1 nm in diameter at θ = 21° with σ = 13°. This sample, however, also displays the presence of nanorods aligned perpendicular to the latter at −74° with σ = 4°. Some Gd2O3/BHO platelets aligned parallel to the GdBCO ab-planes are also visible. The 5.0 mol% BHO-containing PLD-YBCO sample in figure 2(d) contains even wider nanorods, 7 nm ± 1 nm in diameter, however, with a broader distribution of nanoparticle lengths and a mean tilt angle of θ = 27° with σ = 16°.
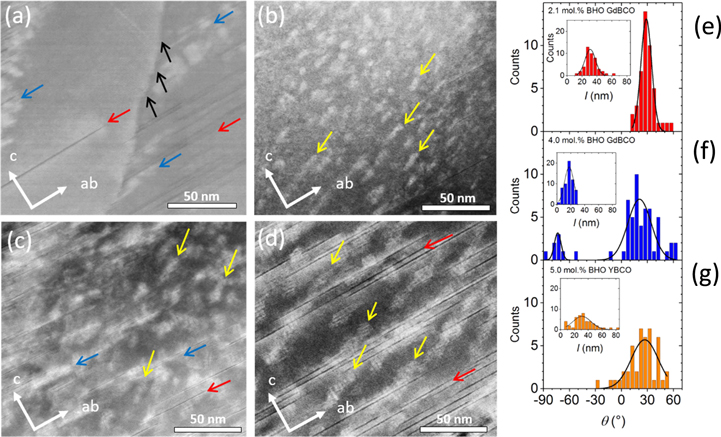
Figure 2. ADF-STEM images of (a) a BHO-free EB-PVD-GdBCO film, (b) a 2.1 mol% BHO-containing EB-PVD-GdBCO film, (c) a 4.0 mol% BHO-containing EB-PVD-GdBCO film and (d) a 5 mol% BHO-containing PLD-YBCO film. Grain boundaries are highlighted with black arrows, CuO double-chain intergrowths (REBa2Cu4Oy) with red arrows, Gd2O3/BHO ab-aligned platelets with blue arrows, and BHO nanorods with yellow arrows. White arrows indicate the GdBCO and YBCO c-axis and ab-plane directions. (e)–(g) Show distributions of the angle θ of the nanorods with the surface normal and length distributions (inset) for (b)–(d), respectively.
Download figure:
Standard image High-resolution imagePreviously we found that the addition of ≥8.6 mol% BHO to GdBCO films grown on ISD results in the formation of epitaxially incorporated Hf- and Gd-containing platelets aligned parallel to the GdBCO ab-planes [18]. In order to determine whether the nanorods present here are BHO or a phase containing both Hf and Gd the composition of the nanorods in the 2.1 mol% BHO film was analysed via EDX. From figure 3 it is clear that the nanorods are Hf-rich and exhibit no higher concentration of Gd than in the surrounding matrix, in contrast to the platelets. An SAED pattern (figure 4) acquired from the 4.0 mol% BHO film close to the region shown in figure 2(b) confirms the presence of the BHO phase. The positions of the diffraction peaks also reflect the epitaxial growth of BHO in the GdBCO matrix with a [110]GdBCO//[110]BHO and [001]GdBCO//[001]BHO orientation relationship. A similar epitaxial growth relation is also observed for the for the 2.1 mol% BHO-containing sample.
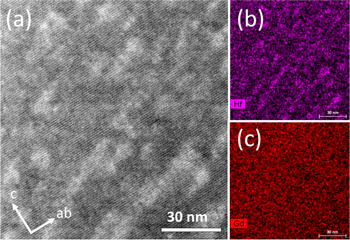
Figure 3. ADF-STEM image of the 2.1 mol% BHO-containing sample with the corresponding EDX maps for (b) Hf and (c) Gd.
Download figure:
Standard image High-resolution image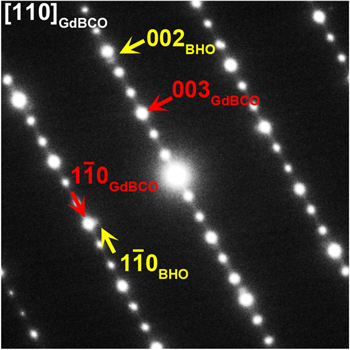
Figure 4. SAED pattern acquired from the 4.0 mol% BHO sample close to the region shown in figure 2(b). The BHO  and (1
 0) and GdBCO
  and (10) diffraction peaks are indicated.
Download figure:
Standard image High-resolution imageThe in-plane texture for the GdBCO films, given by the full width at half maximum (FWHM) values of the GdBCO (103) reflection are presented in table 1. The 0 mol%, 2.1 mol% and 4.0 mol% BHO samples show similar FWHM values of between 6.5° and 7.1° The 9.0 mol% BHO film, being the only film with a significant quantity of ab-plane aligned platelets, displays a lower texture quality with a FWHM of 8.5°.
Table 1. In-plane FWHM of the GdBCO (103) reflection, and resistively measured electrical properties of the GdBCO/ISD-MgO films.
| BHO (mol%) | In-plane FWHM (°) | Jc (77 K, sf) (MA cm−2) | Tc (K) | ΔTc (K) |
|---|---|---|---|---|
| 0 | 6.7 | 0.9 | 91.1 | 0.2 |
| 2.1 | 7.1 | 0.9 | 90.5 | 0.2 |
| 4 | 6.5 | 0.8 | 91.8 | 0.2 |
| 9 | 8.5 | 0.8 | 91.2 | 0.4 |
3.2. Critical current and pinning properties
Jc at 77 K, self-field, Tc, taken from the midpoint of the transition and the transition width (ΔTc) are also shown in table 1. Jc (77 K, sf) is seen to decrease with increasing BHO content. The 0 mol%, 4.0 mol% BHO and the 9.0 mol% BHO films all show similar Tc values of between 91 and 92 K, despite the lower texture quality of the 9.0 mol% film. Only the nanorod-containing 2.1 mol% BHO film displays a slightly reduced Tc of 90.5 K.
Jc normalised to its maximum value, with H aligned parallel to the ab-plane Jc (H∣∣ab), as a function of the angle θ made between H and the surface normal at 77 K, 1 T is shown for all four GdBCO films and the YBCO film in figure 5(a). Jc (H∣∣ab) values are displayed in the graph legend. The BHO-free sample shows pinning from grain boundaries with a local maximum at θ = 15°. This corresponds, within the measurement step size of 5°, to the grain boundary tilt angle of 11° for this sample, as measured via TEM (see figure 1(a)).

Figure 5. (a) Jc normalised to Jc with H aligned parallel to the GdBCO ab-planes as a function of θ at 77 K and 1 T. Jc (H∣∣ab) values are given in the legend. (b) Jc as a function of θ at 30 K, 3 T, (c) Jc and Fp (inset) as a function of applied magnetic field at 77 K with H aligned at θ = 15° and (d) Jc and Fp (inset) as a function of applied magnetic field at 30 K with H aligned at θ = 15°. θ = 15° is the direction closest to both the grain boundaries and nanorods. Fp data was fit using the Dew-Hughes formula.
Download figure:
Standard image High-resolution imageThe 9.0 mol% BHO sample contains an excess of BHO and thus exhibits Gd2O3/BHO platelets aligned parallel to the GdBCO ab-planes. This sample displays no grain boundary pinning around θ = 15° as in this case the grain boundaries are primarily aligned parallel to the ab-planes at θ = 60° (see figure 1(b)). This is due to the large ab-aligned platelets preventing the grain boundaries from continuing across separate phases during growth and instead causing the latter to align parallel to the ab-plane.
The 4.0 mol% BHO sample shows a very broad peak between −100° and 40° with a maximum at 10°. The broadness of the peak can be attributed to a contribution from the smaller number of BHO nanorods aligned perpendicular to majority at θ = −74°. For this sample θGB = 44° with σ = 4°, as observed via TEM. This is intermediate between the BHO-free sample and the 9.0 mol% BHO sample due to the presence of a limited number of ab-aligned platelets. Interestingly, the 5.0 mol% BHO PLD-YBCO sample shows a similar broad pinning contribution between −60° and 40°; however, with a smaller value.
The 2.1 mol% BHO film shows a much stronger secondary peak than the other films, with its maximum at θ = 21°. Jc (θ) at 30 K, 3 T in figure 5(b) also shows the presence of this secondary peak, however, in this case the maximum of the secondary peak of the 2.1 mol% film has shifted towards the ab-plane-correlated pinning peak. This misalignment of the peak maximum for the 2.1 mol% BHO film at both 77 K, 1 T and 30 K, 3 T with the direction of the nanorods at θNR = 29° is discussed below. For this sample θGB = 18° with σ = 8°.
For the BHO-free film the grain platelets preventing the grain boundaries from continuing across separate phases during growth and instead causing the latter to a boundary peak is no longer present at 30 K, 3 T.
To more thoroughly determine whether the secondary peak is a result of the BHO nanorods or a contribution from grain boundary pinning, Jc as a function of H was measured for all GdBCO films at 77 and 30 K with H aligned as close as possible to the average direction of both the grain boundaries and BHO nanorods (figures 5(c) and (d)). An angle of θ = 15° was chosen, being parallel, within the measurement step size, to the average grain boundary angle in both the BHO-free and 2.1 mol% samples. Figure 5(c) shows that at 77 K the 2.1 mol% and 4.0 mol% BHO-containing samples have a slightly reduced Jc compared to the BHO-free sample below 1.0 T and 1.5 T, respectively, with the 9.0 mol% BHO sample having a comparable Jc to that of the BHO-free sample in low fields up to 1 T. The 2.1 mol% BHO film displays the largest enhancement in Jc above 1 T compared to the BHO-free film, with other BHO-containing films also having an enhanced, but lower, Jc at high fields. For the BHO-free sample the maximum pinning force (Fp,max) is 1.7 GN m−3 at 1.7 T (inset in figure 5(c)). This is larger than previously published for a similar sample [18], due to subsequent optimisation of deposition parameters and precursor composition. For the 2.1 mol% BHO-containing sample Fp,max is increased to 2.7 GN m−3 at 3.3 T. At 30 K (figure 5(d)) the 4.0 mol% BHO and 9.0 mol% BHO films both show a decrease in Jc between 0 and 8 T compared to the BHO-free film. The 2.1 mol% BHO film, however, shows no reduction in Jc in low fields up to 0.5 T and an enhancement in Jc between 0.5 and 8 T. At 30 K, 3 T, this sample exhibits Jc = 2.8 MA cm−2 at θ = 15° compared to 2.0 MA cm−2 for the BHO-free sample. The largest measured value of Fp, at 8 T for both the BHO-free and 2.1 mol% BHO samples, is increased from 93.5 to 146.2 GN m−3 for the 2.1 mol% BHO sample.
This increase in Fp at 77 and 30 K and the shift of Fp,max at 77 K to higher H makes it clear that the 2.1 mol% BHO sample exhibits an additional, distinct pinning contribution to that of the BHO-free sample at the same magnetic field angle. The high-field pinning at work in the 2.1 mol% BHO sample can therefore be attributed to the densely-packed arrangement of tilted nanorods.
In order to further understand the pinning properties of the nanorods, particularly for the interest of applications such as superconducting motors and generators, it is also necessary to examine the overall Jc anisotropy of the films in a wider range of magnetic field and temperature and not only the Jc behaviour at one fixed angle. In figures 6(a) and (b) the normalised Jc anisotropy at 30 K as a function of μ0H is compared for the BHO-free and 2.1 mol% BHO samples. Jc (H∣∣ab) is identical for both films to within 0.1 MA cm−2 and ranges from 6.8 MA cm−2 at 0.2 T to 3.2 MA cm−2 at 8.0 T. While only the ab-plane-correlated pinning peaks are evident in the BHO-free sample under these conditions, a significant pinning contribution arising from the nanorods is visible for the 2.1 mol% BHO sample. The maximum of the nanorod peak is at 29° between 4 and 8 T. At fields lower than 4 T, however, the peak gradually shifts towards the ab-plane-correlated pinning peak. This is also the case towards high temperatures and fields. A full dependence of the angle of the nanorod peak (θNR) on T and μ0H is presented in figure 7. This was determined by fitting the anisotropy curves using two angular Gaussian components and an isotropic component as per the method applied by Knibbe et al [25]. Notably, at intermediate temperatures and fields the peak shifts in the opposite direction towards the sample surface normal, with the smallest angle of 12° occurring at 70 K, 2 T. This shift is most likely a result of misalignment between the internal magnetic field (B) and H, which arises for REBCO films with tilted correlated pinning centres, as described by Maiorov et al [26]. Additional work is required, however, for this relationship to be more fully understood.
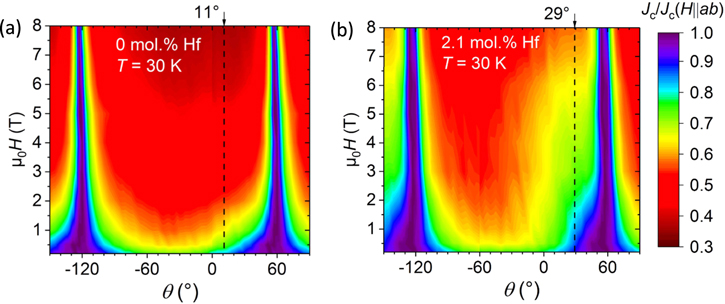
Figure 6. Normalised Jc at 30 K as a function of H for (a) the BHO-free sample and (b) the 2.1 mol% BHO sample. The mean angle of the grain boundaries (11°) is indicated for the BHO-free samples and the mean angle of the nanorods (29°) for the 2.1 mol% BHO sample.
Download figure:
Standard image High-resolution image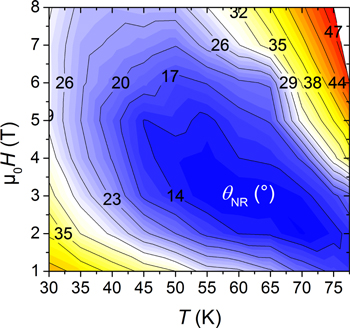
Figure 7. The angle of the nanorod pinning peak as a function of temperature and magnetic field for the 2.1 mol% BHO-containing film.
Download figure:
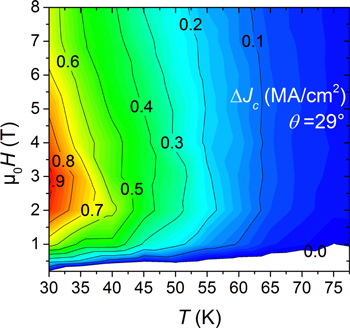
Standard image High-resolution imageIn figure 8 the difference in Jc (ΔJc) at θ = 29° between the 2.1 mol% BHO sample and the BHO-free sample is shown as a function of T and μ0H and depicts the increase in Jc upon introduction of the nanorods. The maximum measured Jc enhancement of 0.9 MA cm−2 is observed at 30 K, 3 T. Jc for the 2.1 mol% BHO sample is 3.0 MA cm−2, compared to 2.1 MA cm−2 for the BHO-free sample.
Figure 8. Enhancement in Jc at θ = 29° for the 2.1 mol% BHO film in comparison to the BHO-free film.
Download figure:
Standard image High-resolution image
It is important to note that, as the above Jc anisotropy data are measured with the magnetic field rotated through the plane perpendicular to the tape direction, the size and tilt of the nanorods are also characterised with the assumption that they lie parallel to this plane (as in the cross-sectional TEM images in figure 2). If the nanorods are in addition tilted out of this plane, the possibility exists that the maximum Jc of the nanorod pinning peak (and thus the Fp,max) also lies with the magnetic field aligned out of this plane. A far more extensive Jc anisotropy characterisation in the variable Lorentz force configuration would be required to clarify this matter.
4. Conclusions
BHO nanorods have been successfully incorporated into both GdBCO and YBCO deposited via EB-PVD and PLD, respectively, on ISD-MgO templates. Both methods showed the presence of BHO nanorods 10–60 nm in length at lower BHO contents (≤5.0 mol% BHO). In both cases the majority of nanorods were tilted by 21°–29° with respect to the sample surface normal. This angular range, being almost halfway between the ab-plane and c-axis directions, indicates that the formation of BHO nanorods within the REBCO matrix was not solely influenced by the most energetically favourable, strain-minimising lattice match between the two phases but also the incident angle of the growth species with respect to the principle axes of the REBCO phase.
The nanorods acted as effective correlated pinning centres, enhancing Jc at 77 K between 1 and 8 T and at 30 K between 0.5 and 8 T. The angle of the nanorod pinning contributions, however, was found to be not necessarily parallel to the angle of the nanorods but also heavily influenced by the measurement temperature and applied magnetic field. The maximum measured enhancement in Jc from the addition of the nanorods was found to occur at 30 K, 3 T, resulting in a Jc of 3.0 MA cm−2, making them interesting for application in superconducting motors and generators.
Acknowledgments
The authors would like to thank Anh Tu Bohn and other colleagues at THEVA Dünnschichtechnik GmbH for technical assistance and helpful discussion and R Nast for assistance with sample patterning. We also acknowledge partial support from EUROTAPES, a collaborative project funded by the European Commission's Seventh Framework Program (FP7/2007–2013) under Grant Agreement n.280432.