the Creative Commons Attribution 4.0 License.
the Creative Commons Attribution 4.0 License.
 | 31 Jan 2019
Application of a laser-based spectrometer for continuous in situ measurements of stable isotopes of soil CO2 in calcareous and acidic soils
Jobin Joseph
Christoph Külls
Matthias Arend
Marcus Schaub
Frank Hagedorn
Arthur Gessler
Markus Weiler
The short-term dynamics of carbon and water fluxes across the soil–plant–atmosphere continuum are still not fully understood. One important constraint is the lack of methodologies that enable simultaneous measurements of soil CO2 concentration and respective isotopic composition at a high temporal resolution for longer periods of time. δ13C of soil CO2 can be used to derive information on the origin and physiological history of carbon, and δ18O in soil CO2 aids in inferring the interaction between CO2 and soil water. We established a real-time method for measuring soil CO2 concentration, δ13C and δ18O values across a soil profile at higher temporal resolutions (0.05–0.1 Hz) using an off-axis integrated cavity output spectroscopy (OA-ICOS). We also developed a calibration method correcting for the sensitivity of the device against concentration-dependent shifts in δ13C and δ18O values under highly varying CO2 concentration. The deviations of measured data were modelled, and a mathematical correction model was developed and applied for correcting the shift. By coupling an OA-ICOS with hydrophobic but gas-permeable membranes placed at different depths in acidic and calcareous soils, we investigated the contribution of abiotic and biotic components to total soil CO2 release. We found that in the calcareous Gleysol, CO2 originating from carbonate dissolution contributed to the total soil CO2 concentration at detectable degrees, potentially due to CO2 evasion from groundwater. The 13C-CO2 of topsoil at the calcareous soil site was found reflect δ13C values of atmospheric CO2, and the δ13C of topsoil CO2 at the acidic soil site was representative of the biological respiratory processes. δ18O values of CO2 in both sites reflected the δ18O of soil water across most of the depth profile, except for the 80 cm depth at the calcareous site where a relative enrichment in 18O was observed.
- Article
(4686 KB) - Full-text XML
-
Supplement
(920 KB) - BibTeX
- EndNote


Global fluxes of CO2 and H2O are two major driving forces controlling earth's climatic systems. To understand the prevailing climatic conditions and predict climate change, accurate monitoring and modelling of these fluxes are essential (Barthel et al., 2014; Harwood et al., 1999; Schär et al., 2004). Soil respiration, the CO2 flux released from the soil surface to the atmosphere as a result of microbial and root respiration (heterotrophic and autotrophic), is the second largest terrestrial carbon flux (Bond-Lamberty and Thomson, 2010). The long-term dynamics of CO2 release on a seasonal scale are reasonably well understood (Satakhun et al., 2013), whereas less information on CO2 dynamics and isotopic composition is available for short-term variations on a diurnal scale (Werner and Gessler, 2011). The lack of a proper understanding of the diurnal fluctuations in soil CO2 release might introduce uncertainty in estimating the soil carbon budget and the CO2 fluxes to the atmosphere. The isotopic composition of soil CO2 and its diel fluctuation can be a critical parameter for the partitioning of ecosystem gas exchange into its components (Bowling et al., 2003; Mortazavi et al., 2004) and for disentangling plant and ecosystem processes (Werner and Gessler, 2011). By assessing the δ13C of soil CO2, it is possible to identify the source for CO2 (Kuzyakov, 2006) and the coupling between photosynthesis and soil respiration when taking into account post-photosynthetic isotope fractionation (Werner et al., 2012; Wingate et al., 2010). δ13C soil CO2 reflects, however, not only microbial and root respiration but also abiotic sources from carbonate weathering (Schindlbacher et al., 2015).
Soil water imprints its δ18O signature on soil CO2 as a result of isotope exchange between H2O and CO2 (aqueous). The oxygen isotopic exchange between CO2 and soil water is catalysed by microbial carbonic anhydrase (Sperber et al., 2015; Wingate et al., 2009). Thus, soil CO2 can give information on the isotopic composition of both soil water resources and carbon sources. The oxygen isotope composition of plant-derived CO2 is both a tracer of photosynthetic and respiratory CO2 and gives additional quantitative information on the water cycle in terrestrial ecosystems (Francey and Tans, 1987). To better interpret the δ13C and δ18O signals of atmospheric CO2, the isotopic composition and its variability in the different sources need to be better understood (Werner et al., 2012; Wingate et al., 2010).
The conventional method for estimating the δ13C and δ18O of soil CO2 efflux is by using two end-member mixing models of atmospheric CO2 and CO2 produced in the soil (Keeling, 1958). The conventional methods for sampling soil produced CO2 are chamber-based (Bertolini et al., 2006; Torn et al., 2003), “mini-tower” (Kayler et al., 2010; Mortazavi et al., 2004), and soil-gas-well-based (Breecker and Sharp, 2008; Oerter and Amundson, 2016) methods. In conventional methods, air sampling is done at specific time intervals, and δ13C and δ18O are analysed using isotope ratio mass spectrometry (IRMS; Ohlsson et al., 2005). Such offline methods have several disadvantages, like high sampling costs, excessive time consumption for sampling and analysis, and increased sampling error and low temporal resolution. Kammer et al. (2011), showed how error prone the conventional methods could be while calculating δ13C and δ18O (up to several per mil when using chamber and mini-tower-based methods; Kammer et al., 2011). In chamber-based systems, non-steady-state conditions may arise within the chamber due to increased CO2 concentrations, which in turn hinders the diffusion of 12CO2 more strongly than that of heavier 13CO2 (Risk and Kellman, 2008). Moreover, it has been found that δ18O of the CO2 inside a chamber is significantly influenced by the δ18O of the surface soil water, as an equilibrium isotopic exchange happens during the upward diffusive movement of soil CO2 (Mortazavi et al., 2004). The advent of laser-based isotope spectroscopy has enabled cost-effective, simple, and high precision real-time measurements of δ13C and δ18O in CO2 (Kammer et al., 2011; Kerstel and Gianfrani, 2008). This technique opened up new possibilities for faster and reliable measurements of stable isotopes in situ, based on the principle of light absorption, using laser beams of distinct wavelengths in the near- and mid-infrared range (Bowling et al., 2003). Recently, several high-frequency online measurements of δ13C and δ18O, of soil CO2 and 2H, and of the 18O of soil water vapour across soil depth profiles were reported by coupling either hydrophobic but gas-permeable membranes (installed at different depths in soil) or automated chamber systems with laser spectrometers (Bowling et al., 2015; Jochheim et al., 2018; Stumpp et al., 2018). Such approaches enable detection of vertical concentration profiles, temporal dynamics of soil CO2 concentration, and the isotopic signature of soil CO2 across different soil layers, thus aiding in identifying and quantifying various sources of CO2 across the depth profile.
In 1988, O'Keefe and Decon introduced cavity ring-down spectroscopy (CRDS) for measuring the isotopic ratio of different gaseous species based on laser spectrometry (O'Keefe and Deacon, 1988). With the laser-based spectrometry techniques, measuring sensitivities up to parts per trillion (ppt) concentrations is achieved (von Basum et al., 2004; Peltola et al., 2012). In CRDS, the rate of change in the absorbed radiation of the laser light that is temporarily “trapped” within a highly reflective optical cavity is determined. This is achieved using resonant coupling of a laser beam to the optical cavity and active locking of laser frequency to cavity length (Parameswaran et al., 2009). Another well-established technique similar to CRDS is off-axis integrated cavity output spectroscopy (OA-ICOS). It is based on directing narrowband and continuous-wave lasers in an off-axis configuration to the optical cavity (Baer et al., 2002).
Even though OA-ICOS can measure concentration and isotope signature of various gaseous species at a high temporal resolution, we found pronounced deviations in δ13C and δ18O measurements from the absolute values when measured under changing CO2 concentrations. So far, to our knowledge, no study detailing the calibration process of OA-ICOS CO2 analysers correcting for fluctuations of both δ13C and δ18O values under varying CO2 concentrations has been made available. Most of the OA-ICOS CO2 analysers are built for working under stable CO2 concentrations, so periodical calibration against in-house gas standards at a particular concentration is sufficient. However, as there are pronounced gradients in CO2 levels in soils (Maier and Schack-Kirchner, 2014), CO2-concentration-dependent shifts in measured isotopic values have to be addressed and corrected. Such calibration is, however, also relevant for any other OA-ICOS application with varying levels of CO2 (e.g. in chamber measurements). Hence the first part of this work comprises the establishment of a calibration method for OA-ICOS. The second part describes a method for online measurement of CO2 concentrations and stable carbon and oxygen isotope composition of CO2 in different soil depths by coupling OA-ICOS with gas-permeable hydrophobic tubes (membrane tubes, Accurel®). The use of these tubes for measuring soil CO2 concentration (Gut et al., 1998) and the δ13C of soil CO2 (Parent et al., 2013) has already been established, but the coupling to an OA-ICOS system has not been performed, yet.
We evaluated our measurement system by assessing and comparing the concentration of the δ13C and δ18O of soil CO2 for a calcareous and an acidic soil system. The primary foci of this study are to (1) introduce OA-ICOS in online soil CO2 concentration and isotopic measurements, (2) calibrate the OA-ICOS to render it usable for isotopic analysis carried out under varying CO2 concentrations, and (3) analyse the dynamics of δ13C and δ18O of soil CO2 at different soil depths in different soil types at a higher temporal resolution.
2.1 Instrumentation
The concentration of δ13C and δ18O values of CO2 were measured with an OA-ICOS, as described in detail by Baer et al. (2002) and Jost et al. (2006). In this study, we used an OA-ICOS, (LGR CCIA 36-d) manufactured by Los Gatos Research Ltd in San Francisco, USA. The LGR CCIA 36-d measures CO2 concentration and δ13C and δ18O values at a frequency up to 1 Hz. The operational CO2 concentration range was 400 to 25 000 ppm. The operating temperature range was +10–+35 ∘C, and the sample temperature range (gas temperature) was between −20 and 50 ∘C. The recommended inlet pressure was < 0.0689 MPa. The multiport inlet unit (MIU), an optional design that comes along with LGR CCIA 36-d, had a manifold of eight digitally controlled inlet ports and one outlet port. It presented the user with an option of measuring eight different CO2 samples at the desired time interval. Three standard gases with distinct δ13C and δ18O values were used for calibration in this study (see Table S1 in the Supplement). The standard gases used in this study were analysed for absolute concentration and respective δ13C and δ18O values. δ values are expressed based on Vienna Pee Dee Belemnite (VPDB) CO2 scale and were determined by high precision IRMS analysis.
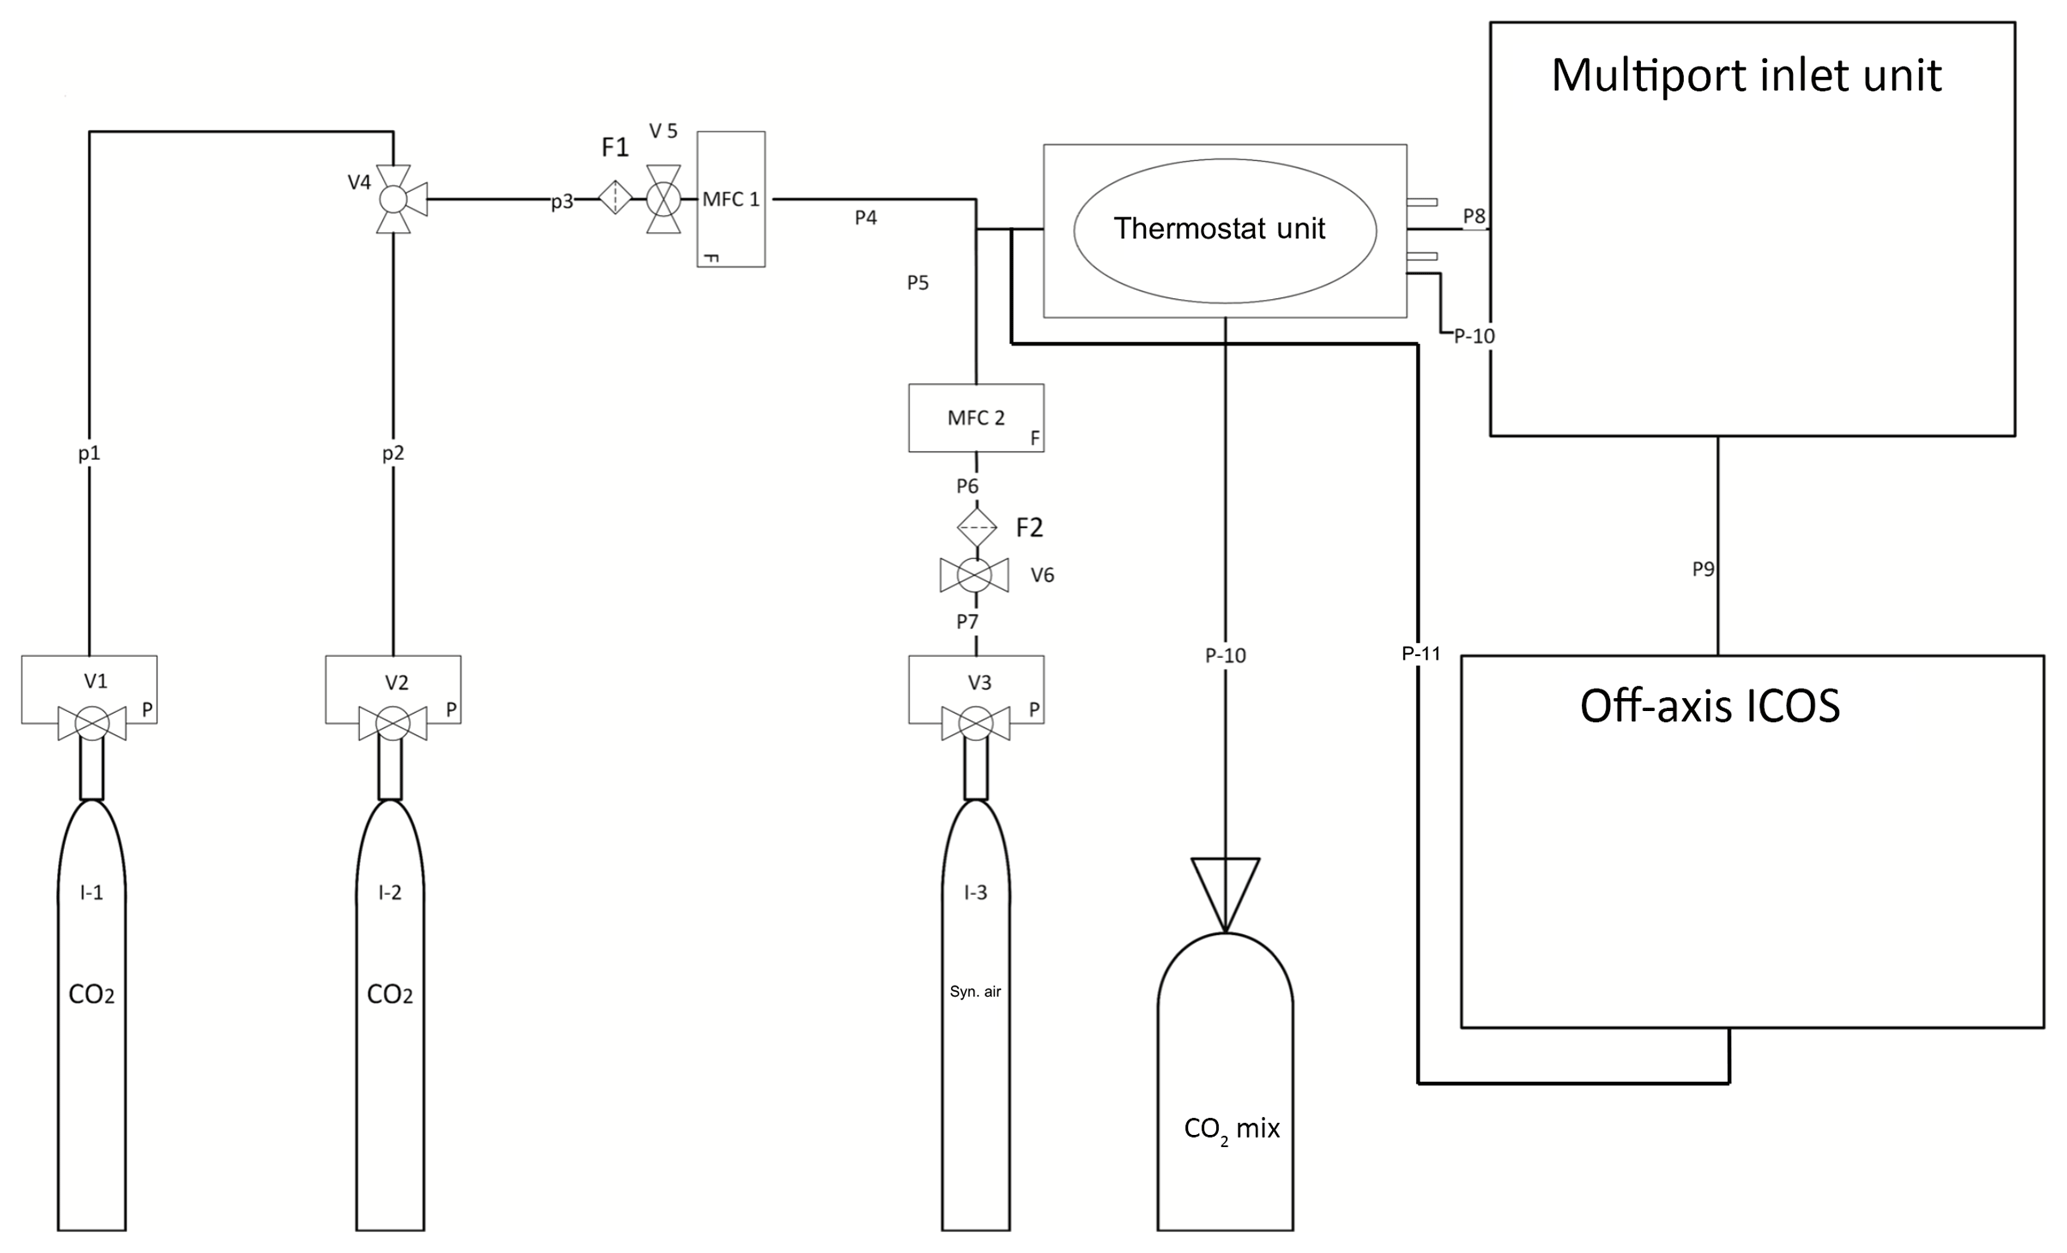
Figure 1Set-up made for calibration of OA-ICOS (LGR CCIA 36-d). I (1, 2) represents CO2 standards, CO2 mix denotes gas standards mixed in equal molar proportion, I3 represents synthetic air, MFC (1, 2) denotes mass flow controller, F (1, 2) represents PTFE filter, V (1, 2, 3) denotes pressure-reducing valves, V4 shows three-way ball valve, V (5, 6) stands for pressure controller valve with safety bypass, P (1–7) denotes steel pipes, and P (8–11) represents Teflon tubing.
2.2 Calibration set-up and protocol
We developed a two-step calibration procedure to (a) correct for concentration-dependent errors in isotopic data measurements and (b) correct for deviations in measured δ values from absolute values due to the offset (other than concentration-dependent error) introduced by the laser spectrometer. Also, we used Allan variance curves for determining the time interval to average the data (Nelson et al., 2008) in order to achieve the highest precision that can be offered by the LGR CCIA 36-d (Allan et al., 1997).
The first part of our calibration methodology was developed to correct for the concentration-dependent error observed in preliminary studies for δ13C and δ18O values measured using OA-ICOS. Such a calibration protocol was used in addition to the routine three-point calibration performed with in-house CO2 gas standards of known δ13C and δ18O values. We developed a CO2 dilution set-up (see Fig. 1) in which each of the three CO2 standard gases was diluted with synthetic CO2-free air (synthetic air) to different CO2 concentrations. By applying a dilution series, we identified the deviation of the measured (OA-ICOS) from the absolute (IRMS) δ13C and δ18O values depending on CO2 concentration (see Fig. 4). The δ13C and δ18O values of our in-house calibration gas standards were measured via cryoextraction and dual-inlet IRMS. δ13C and δ18O of the standard gases (see Table S1) across a wide range of CO2 concentrations are measured using OA-ICOS. The deviation of the measured δ13C, and δ18O from absolute values with respect to changing CO2 concentrations was mathematically modelled and later used for data correction (see Fig. 5). A standard three-point calibration was then applied to correcting for concentration-dependent errors (see Fig. 7). The standards used covered a wide range of δ13C and δ18O values, including the values observed in the field of application.
Standard gases were released to a mass flow controller (ANALYT-MTC, series 358, MFC1) after passing through a pressure controller valve (see Fig. 1) with safety bypass (TESCOM, D43376-AR-00-X1-S, version 5). A Swagelok filter, (Stainless Steel All-Welded In-Line Filter; Swagelok, SS-4FWS-05, F1) was installed at the inlet of the flow controller (ANALYT-MTC, series 358, MFC1). Synthetic air was released and passed to another flow controller (ANALYT-MTC, series 358, MFC2) through a Swagelok filter (F2 in Fig. 1). CO2 and synthetic air leaving the flow controllers (MFC1 and MFC2 respectively) were then mixed and drawn through a Teflon tube (P8) with a 6.35 mm outer diameter (OD), which was kept in a gas thermostat unit (see Fig. 1). The thermostat unit contained (a) a thermostat-controlled water bath (Kottermann, 3082) and (b) an Isotherm flask containing liquid nitrogen. The water bath was used to raise the temperature above room temperature and also to bring the temperature down to +5 ∘C by placing ice packs in the water bath. To reach low temperatures (−20 ∘C), we immersed the tubes in the isotherm flask filled with liquid N2. Leaving the thermostat unit, the gas was directed to the multiport inlet unit of the OA-ICOS. By using the thermostat unit, we introduced a shift in the reference gas temperature, and the aim was to test the temperature sensitivity of the OA-ICOS in measuring δ13C and δ18O values. The third CO2 standard gas (which is used for validation) was produced by mixing the other two gas standards in equal molar proportions in a 10 L volume plastic bag with an inner aluminum foil coating and welded seams (CO2 mix: Linde PLASTIGAS®) under 0.03 MPa pressure by diluting to the required concentration using synthetic air. The mixture was then temperature adjusted and delivered to the MIU by using a 6.35 mm (OD) Teflon tube (P10). From the multiport inlet unit, calibration gases were delivered into the OA-ICOS for measurement using a 6.35 mm OD Teflon tube (P9) at a pressure <0.0689 MPa, with a flow rate of 500 mL min−1. The gas leaving the OA-ICOS through the exhaust was fed back to the 6.35 mm (OD) Teflon tube (P8) by using a Swagelok pipe tee (Stainless Steel Pipe Fitting, Male Tee, 6.35 mm OD, Male NPT), intersecting the P8 line before entering the thermostat unit. Thus, the gas fed was looped in the system until steady values were reported by the OA-ICOS based on CO2 (ppm), δ13C, and δ18O measurements. CO2 gas standards were measured at 27 different CO2 concentration levels ranging between 400 and 25 000 ppm. Every hour before sampling, synthetic air gas was flushed through the system to remove CO2 to avoid memory effects. The calibration gases were measured in a sequence, one after the other, four times. During each round of measurement, every calibration gas was diluted to different concentrations of CO2 (400–25 000 ppm), and the respective isotopic signature and concentration were determined. For each measurement of δ13C and δ18O at a given concentration, the first 50 readings were omitted to avoid possible memory effects of the laser spectrometer, and the subsequent readings for the next 256 s were taken and averaged to get maximum precision for δ13C and δ18O measurements. When switching between different calibration gases at the multiport inlet unit, synthetic air was purged through the systems for 30 s to avoid cross contamination.
2.3 Experimental sites
In situ experiments were conducted to measure δ13C, δ18O, and concentrations of soil CO2 in two different soil types (calcareous and acidic soil). The measurements in a calcareous soil were conducted during June 2014 in cropland cultivated with wheat (Triticum aestivum) in Neuried, a small village in the upper Rhine Valley in Germany, situated at 48∘26′55.5 N, 7∘47′20.7 E, 150 m a.s.l. The soil type described as calcareous Fluvic Gleysol IUSS Working Group WRB (2015) developed on gravel deposits in the upper Rhine Valley. Soil depth was medium to deep, with high contents of coarse material (>2 mm) up to 30 %–50 %. Mean soil organic carbon (SOC) content was 1.2 %–2 %, and SOC stock ranged between 50 and 90 t ha−1. The average pH was found to be 8.6. The study site receives an annual rainfall of 810 mm and has a mean annual temperature of 12.1 ∘C.
In situ measurements in an acidic soil were conducted by the end of July 2014 in the model ecosystem facility (MODOEK) of the Swiss Federal Research Institute WSL in Birmensdorf, Switzerland (47∘21′48 N, 8∘27′23 E; 545 m a.s.l.). The MODOEK facility comprises 16 model ecosystems, split below ground into two lysimeters with an area of 3 m2 and a depth of 150 cm. The lysimeters used for the present study were filled with acidic (Haplic Alisol) forest soil IUSS (2014) and planted with young beech trees (Arend et al., 2016). The soil pH was 4.0, with a total SOC content of 0.8 % (Kuster et al., 2013).
2.4 Experimental set-up
The OA-ICOS was connected to gas-permeable, hydrophobic membrane tubes (Accurel® tubing, 8 mm outer diameter) of 2 m length, placed horizontally in the soil at different depths. Tubes were laid in six different depths (4, 8, 12, 17, 35, and 80 cm) for calcareous soil and three depths (10, 30, and 60 cm) for acidic soil.
Technical details of the measurement set-up are shown in Fig. 2. Both ends of the membrane tubes were extended vertically upwards, reaching the soil top by connecting them to gas impermeable Synflex® tubing (8 mm OD) using Swagelok tube fitting union (Swagelok: SS-8M0-6, 8 mm tube OD). One end of the tubing system was connected to a solenoid switching valve (Bibus: MX-758.8E3C3KK), by using a stainless-steel reducing union (Swagelok: SS-8M0-6-6M), to the outlet of the LGR CCIA 36-d by using 6.35 mm (OD) Teflon tubing. The other end was connected via the multiport inlet unit to the gas inlet of the LGR CCIA 36-d.
This way, a loop was created in which the soil CO2 drawn into the OA-ICOS was circulated back through the tubes and in and out of the OA-ICOS and measured until a steady state was reached. We experienced no drop in cavity pressure while maintaining a closed loop (see Fig. S2). Each depth was selected and continuously measured for 6 min at specified time intervals by switching to defined depths at the multiport inlet unit and also at the solenoid valve.
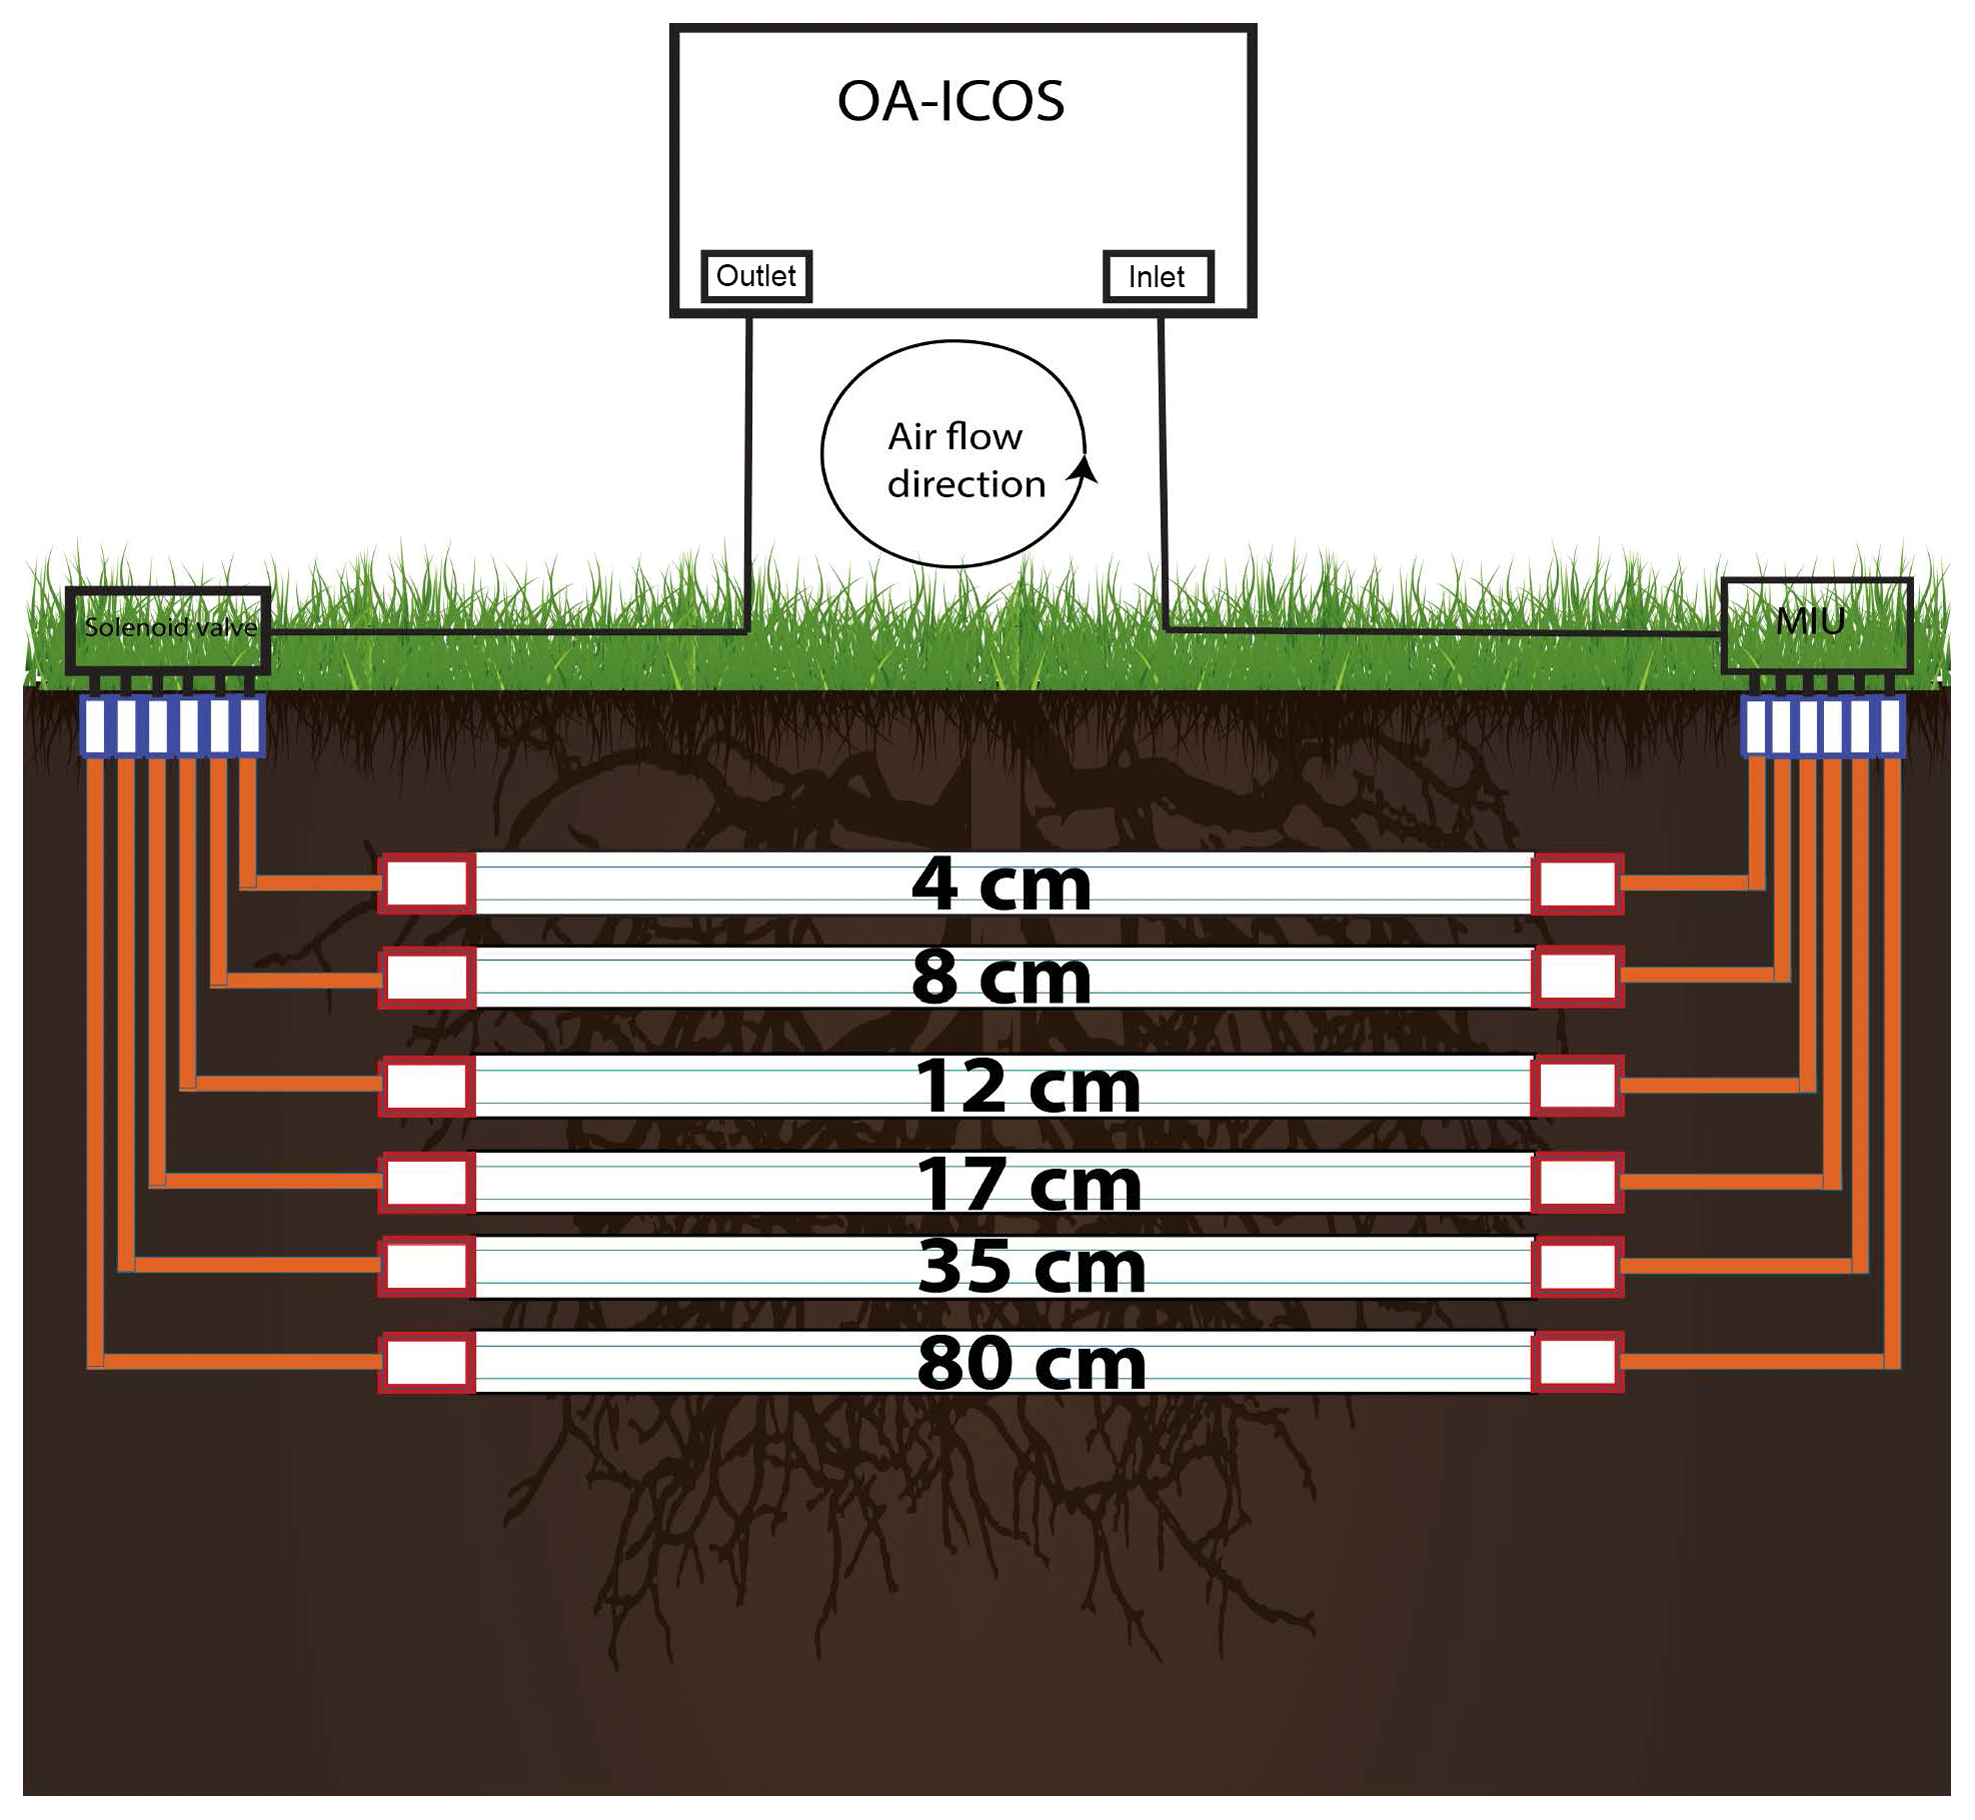
Figure 2Installation made for soil air CO2 (ppm), δ13C-CO2 and δ18O−CO2 measurements using off-axis integrated cavity output spectrometer (OA-ICOS). Hydrophobic membrane tubing was installed horizontally in soil at different depths. MIU: multiport inlet unit.
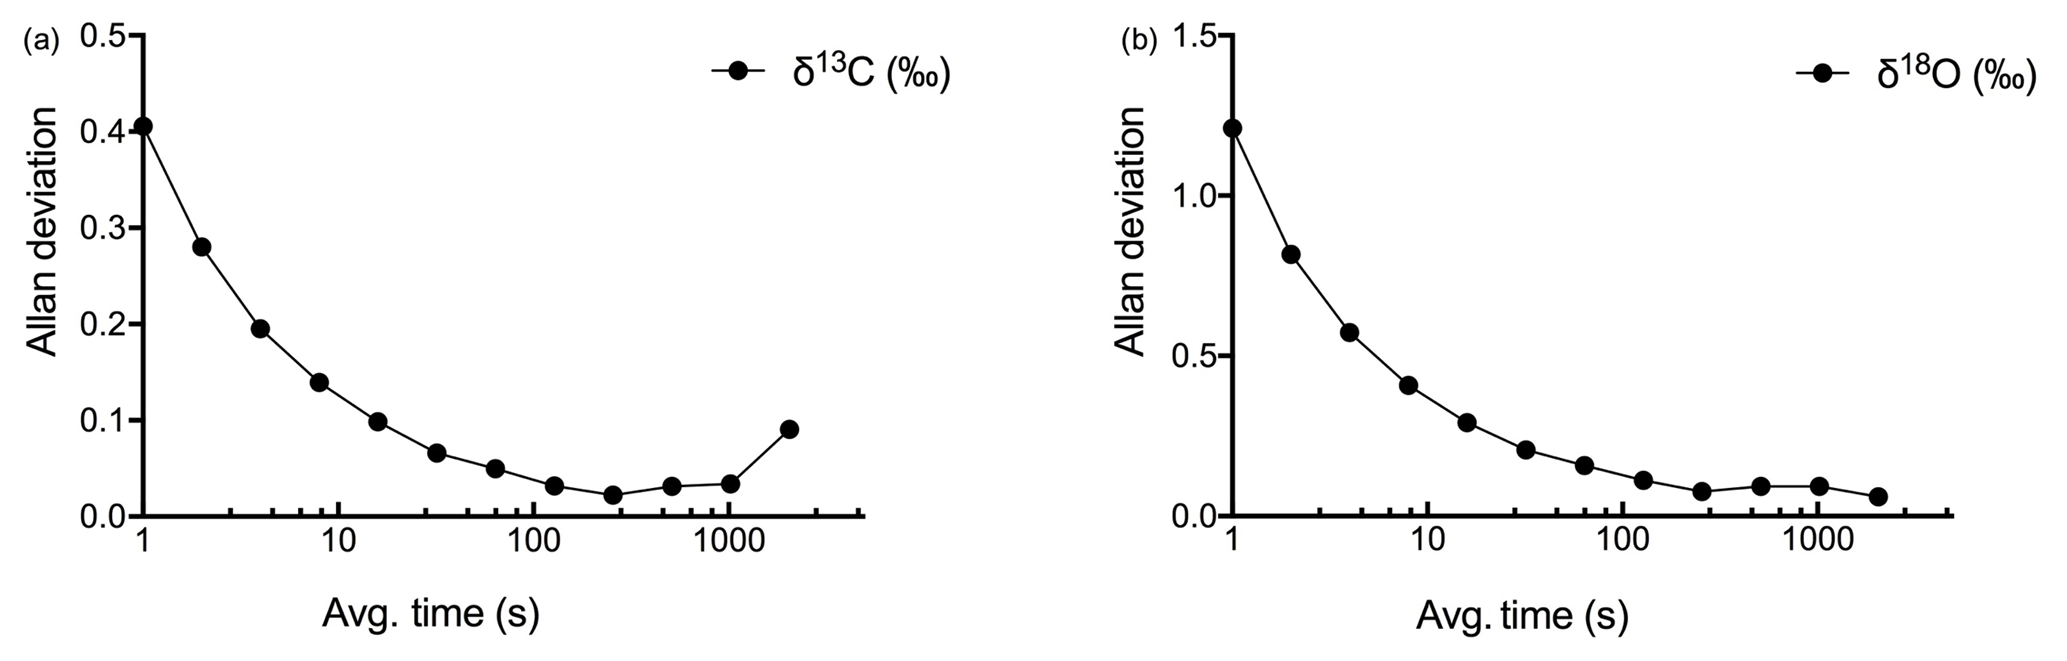
Figure 3Allan deviation curve for δ13C (a) and δ18O (b) measurements by OA-ICOS CO2 carbon isotope analyser (LGR CCIA-36d).
3.1 Instrument calibration and correction
The highest level of precision obtained for δ13C and δ18O measurements at the maximum measuring frequency (1 Hz) was determined by using Allan deviation curves (see Fig. 3). The maximum precision of 0.022 ‰ for δ13C was obtained when the data were averaged over 256 s, and the maximum for δ18O, 0.077 ‰, was obtained for the same averaging interval as for δ13C.
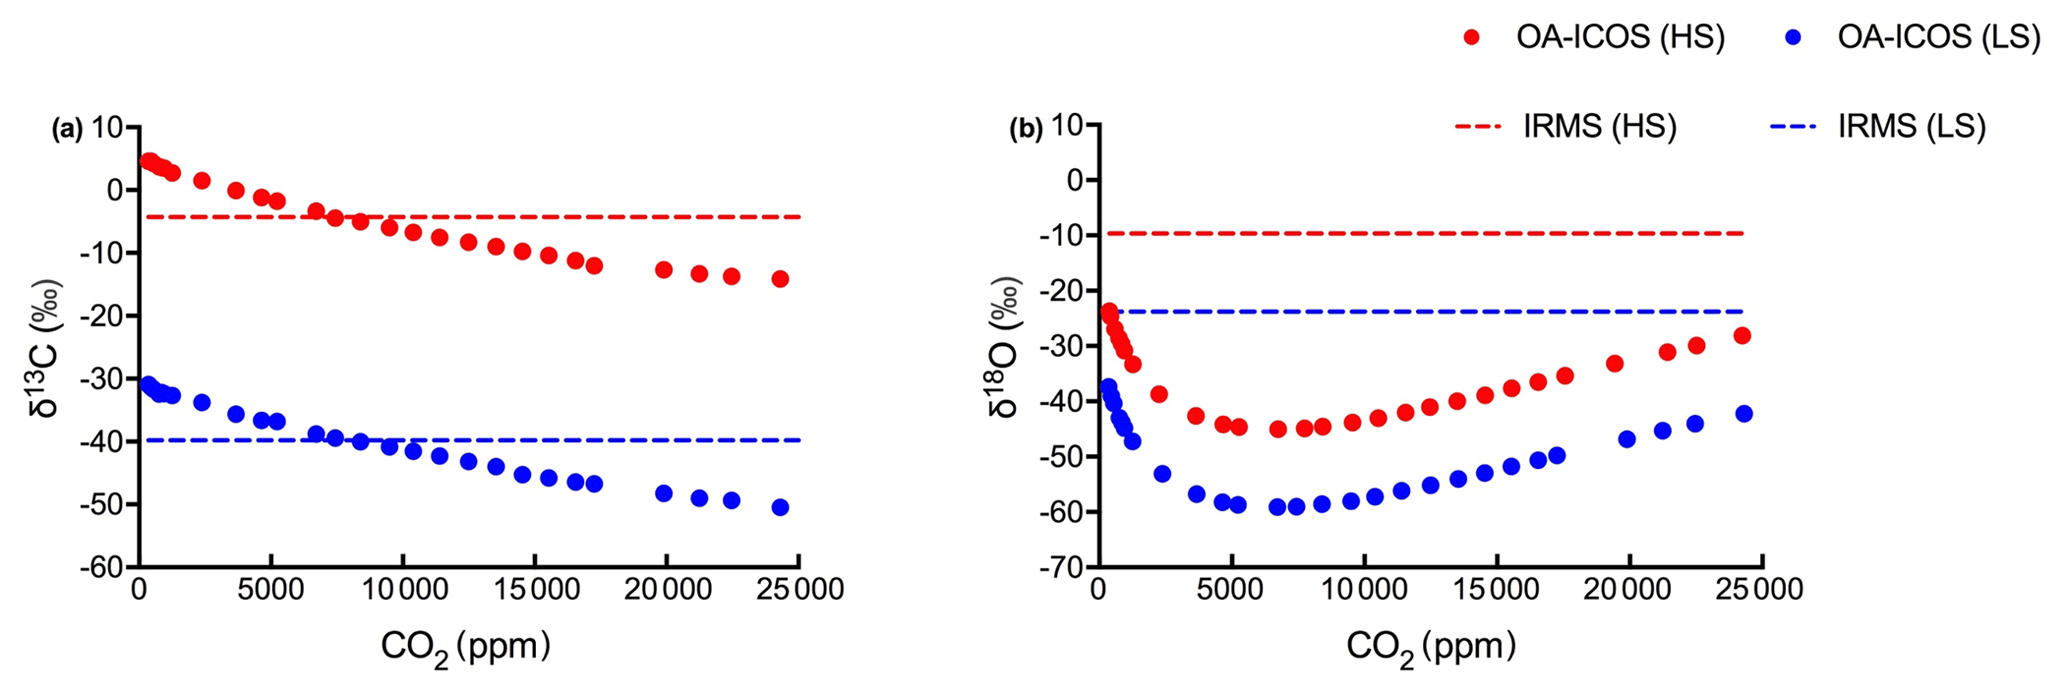
Figure 4Variability observed in (a) δ13C and (b) δ18O measurements using OA-ICOS before calibration. δ13C and δ18O measured using OA-ICOS for heavy standard and light standard are shown as red and blue circles respectively. Actual δ13C and δ18O values reported after measuring by IRMS for heavy standard and light standard are shown as red and blue dashed lines respectively.
To correct for CO2 concentration-dependent errors in raw δ13C and δ18O data, we analysed data obtained from the OA-ICOS to determine the sensitivity of δ13C and δ18O measurements against changing concentrations of CO2. We observed a specific pattern of deviance in the measured isotopic data from the absolute values (both for δ13C and δ18O) across CO2 concentration ranging from 25 000 to 400 ppm (see Fig. 4). Uncalibrated δ13C and δ18O measurements showed a standard deviation of 6.44 ‰ and 6.80 ‰ respectively, when measured under changing CO2 concentrations.
Table 1Correction factor models are fitted for Diff-δ13C, DF (degrees of freedom), AICC (Akaike information criterion), and [CO2] CO2 concentration in ppm.
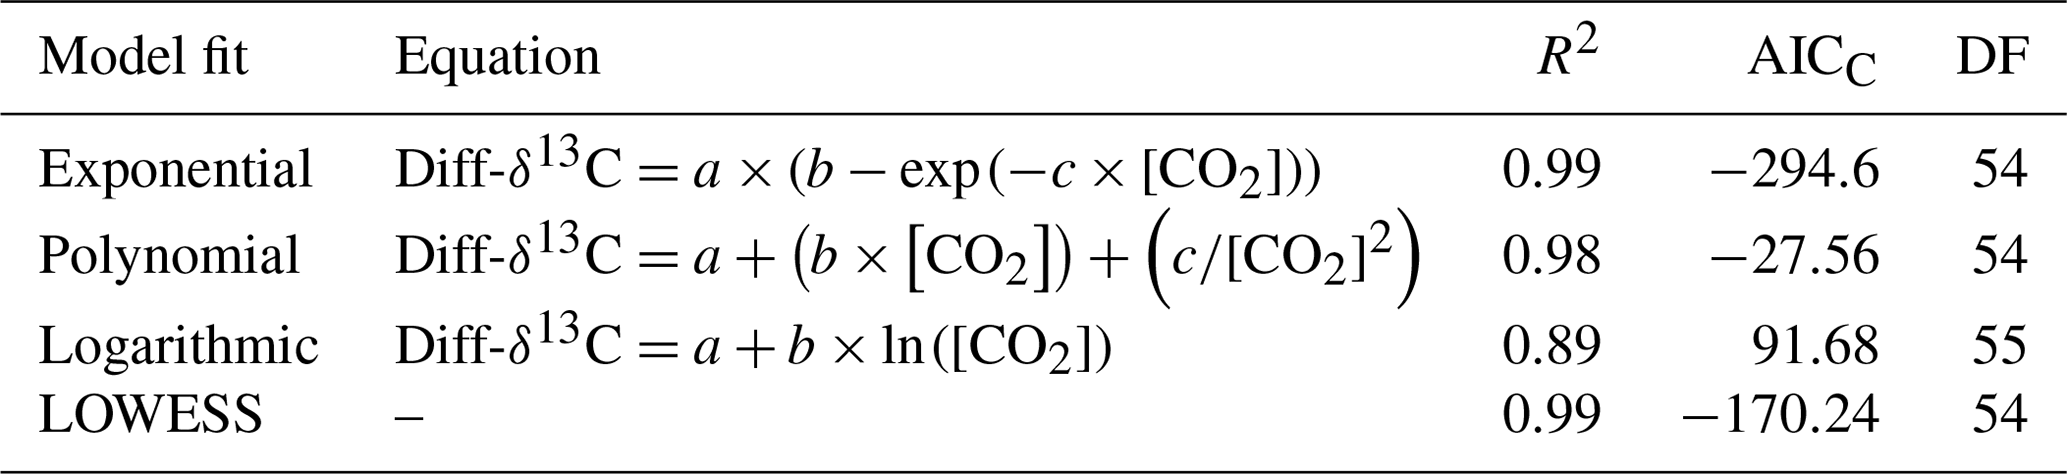
Table 2Correction factor models are fitted for Diff-δ18O, DF (degrees of freedom), AICC (Akaike information criterion), and [CO2] CO2 concentration in ppm.
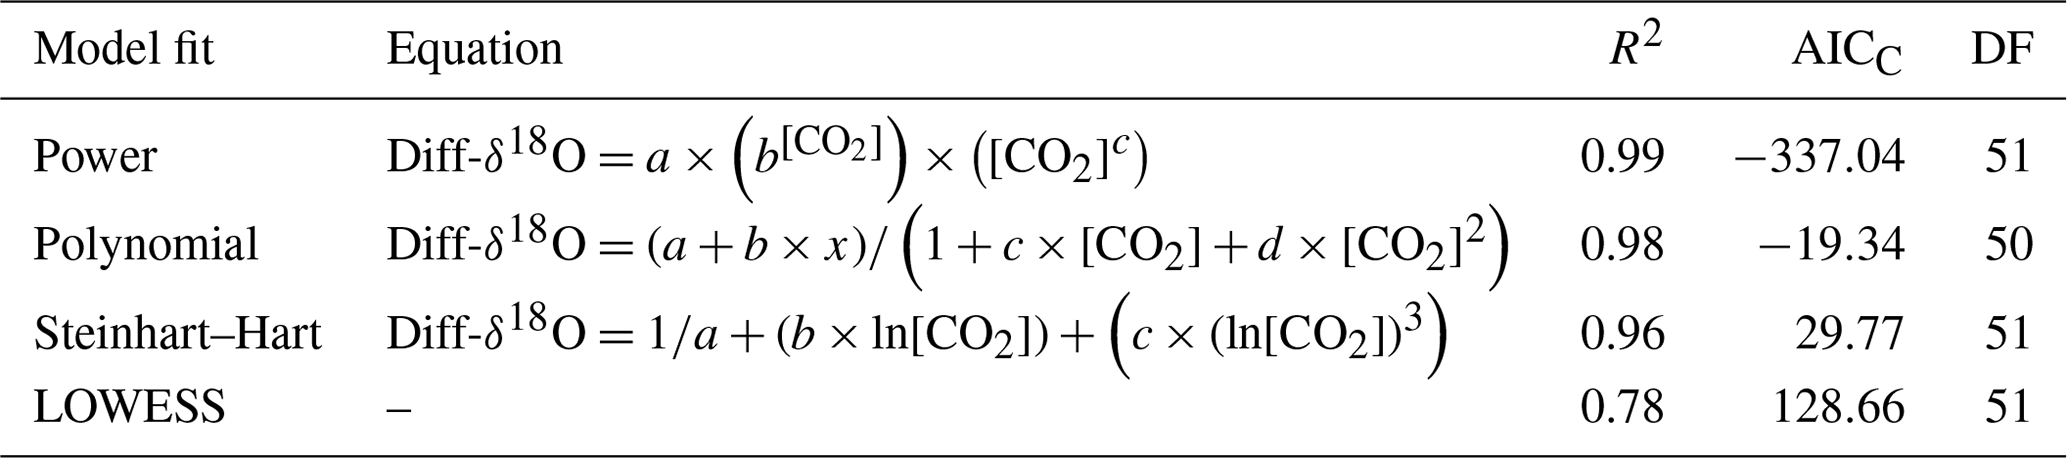
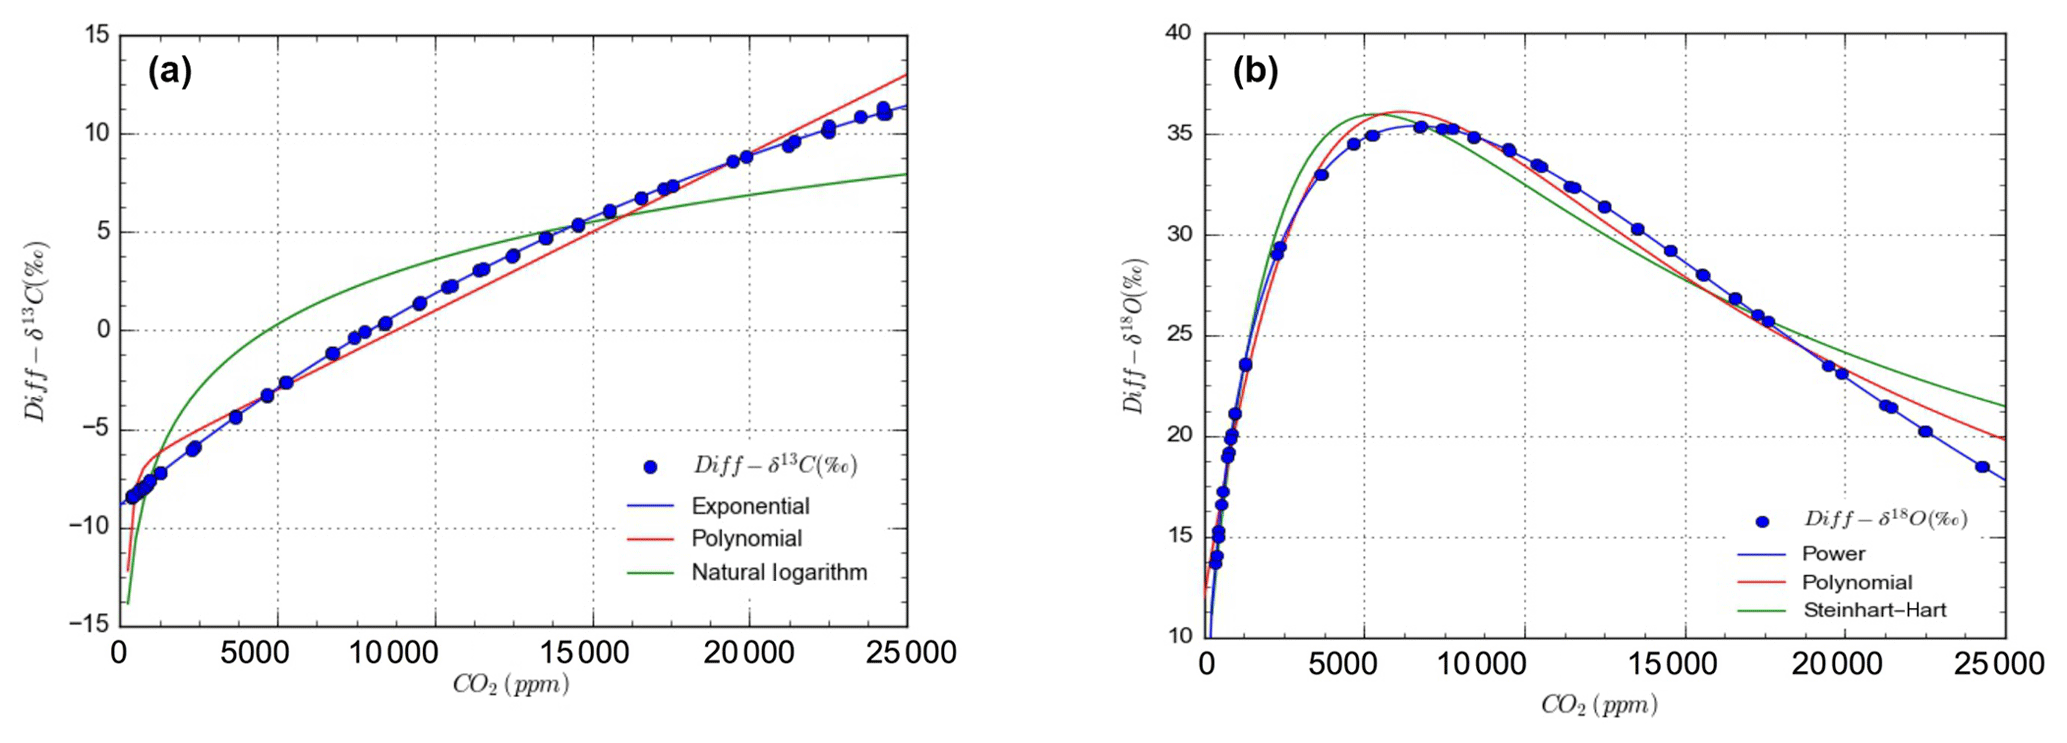
Figure 5Mathematical models for concentration dependent drift in OA-ICOS measurements of stable isotopes of carbon (a) and oxygen (b) in CO2 from IRMS measurements. Blue circles show Diff-δ13C (a) and Diff-δ18O (b) data points, and lines represent different mathematical models fitted on the measured data.
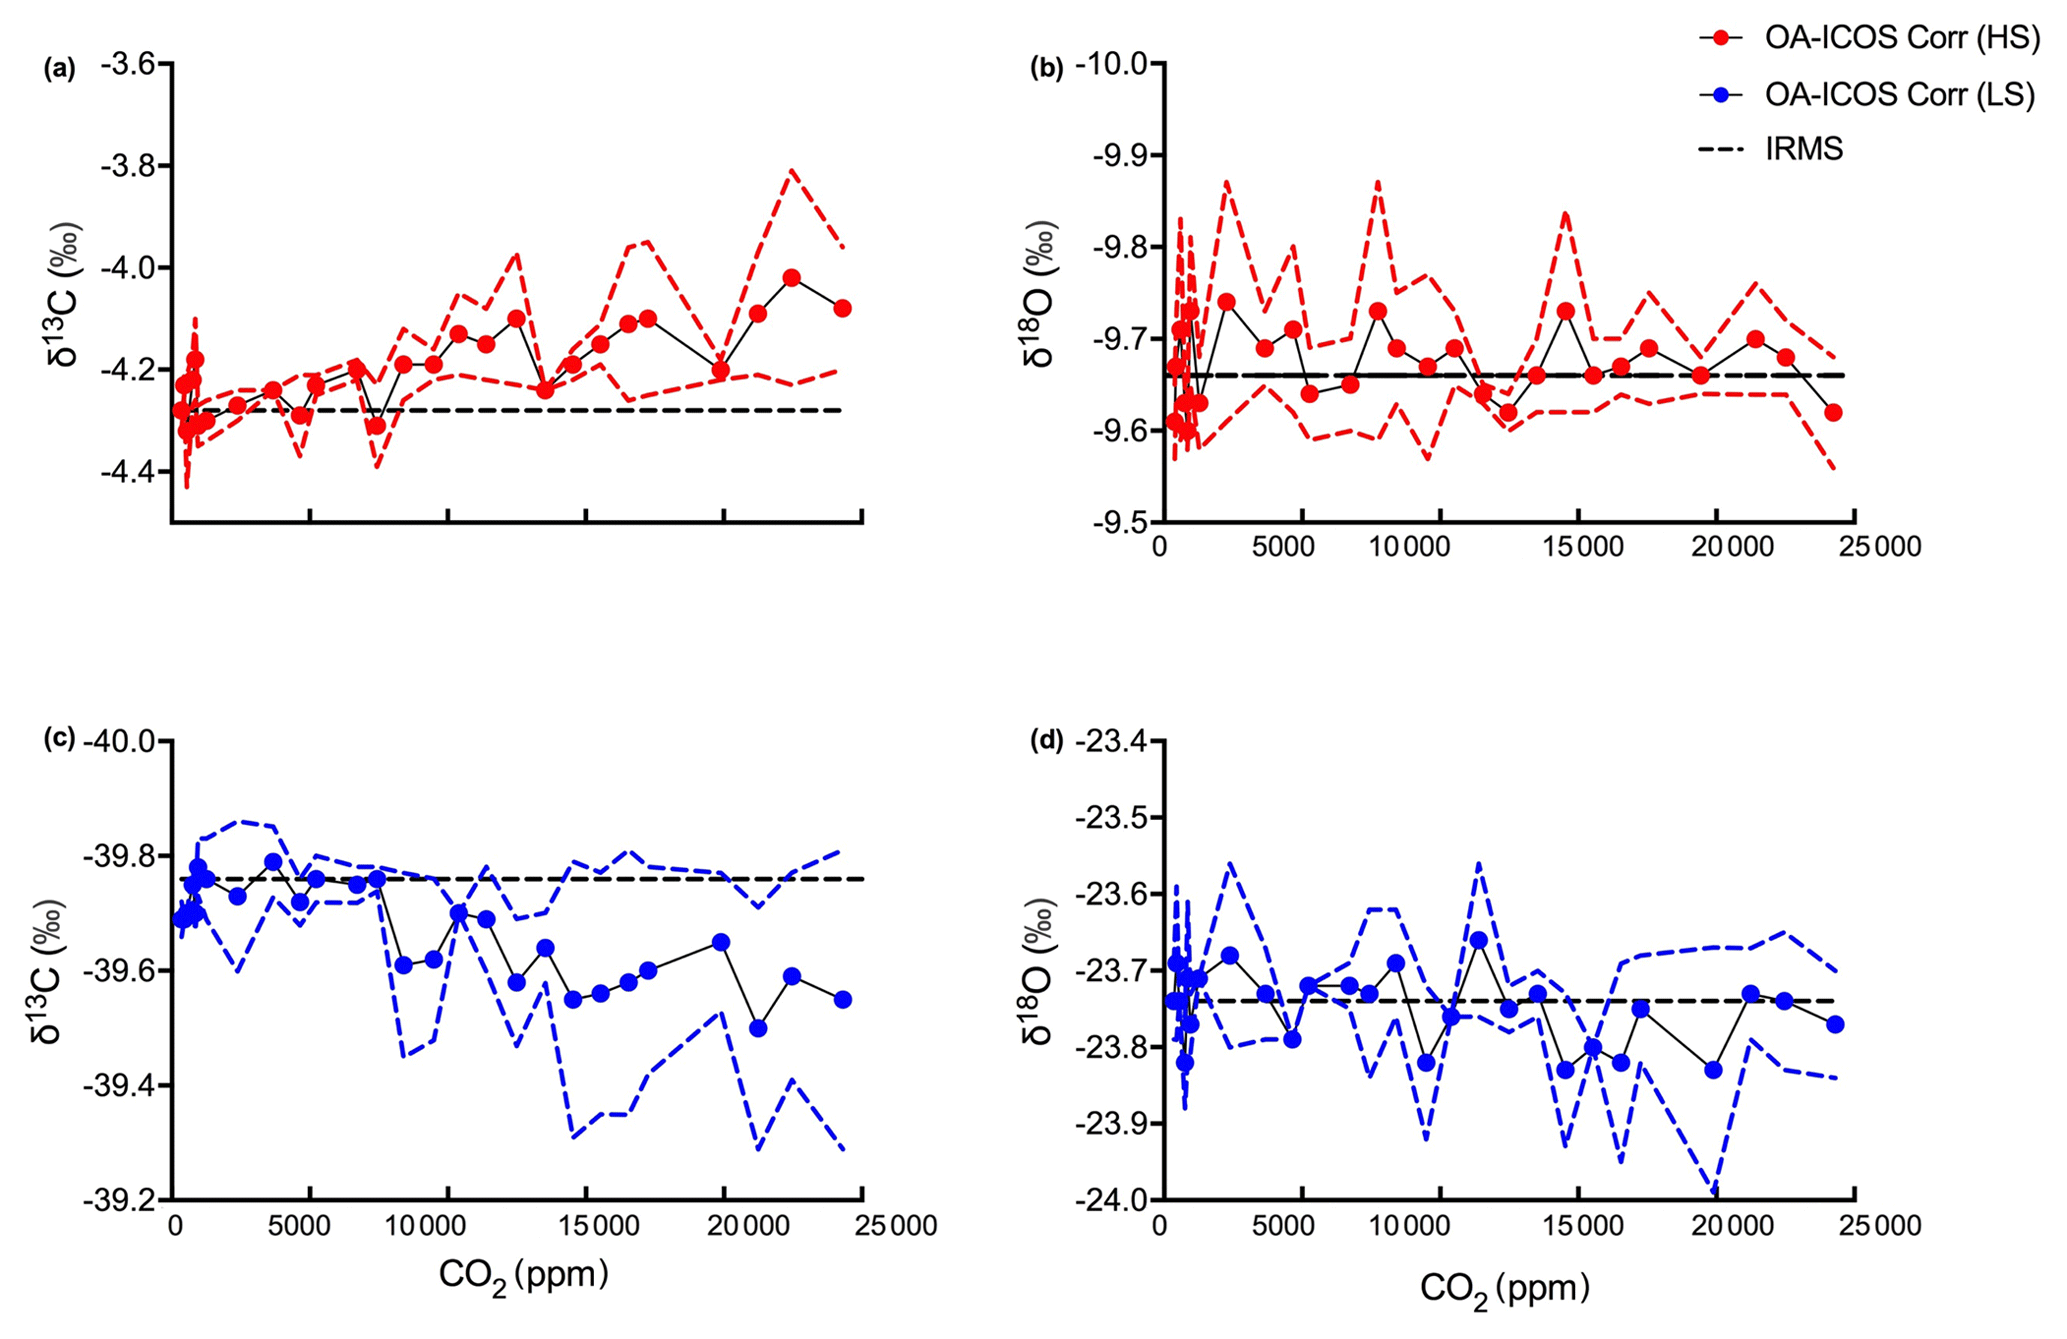
Figure 6Corrected (a, c) δ13C and (b, d) δ18O measurements by OA-ICOS CO2 carbon isotope analyser. δ13C and δ18O measured for heavy standard and light standard are shown as red and blue circles respectively. Actual δ13C and δ18O values reported after measuring by IRMS are shown as black dashed lines, and 95 % confidence intervals are shown as coloured dashed lines, respectively.
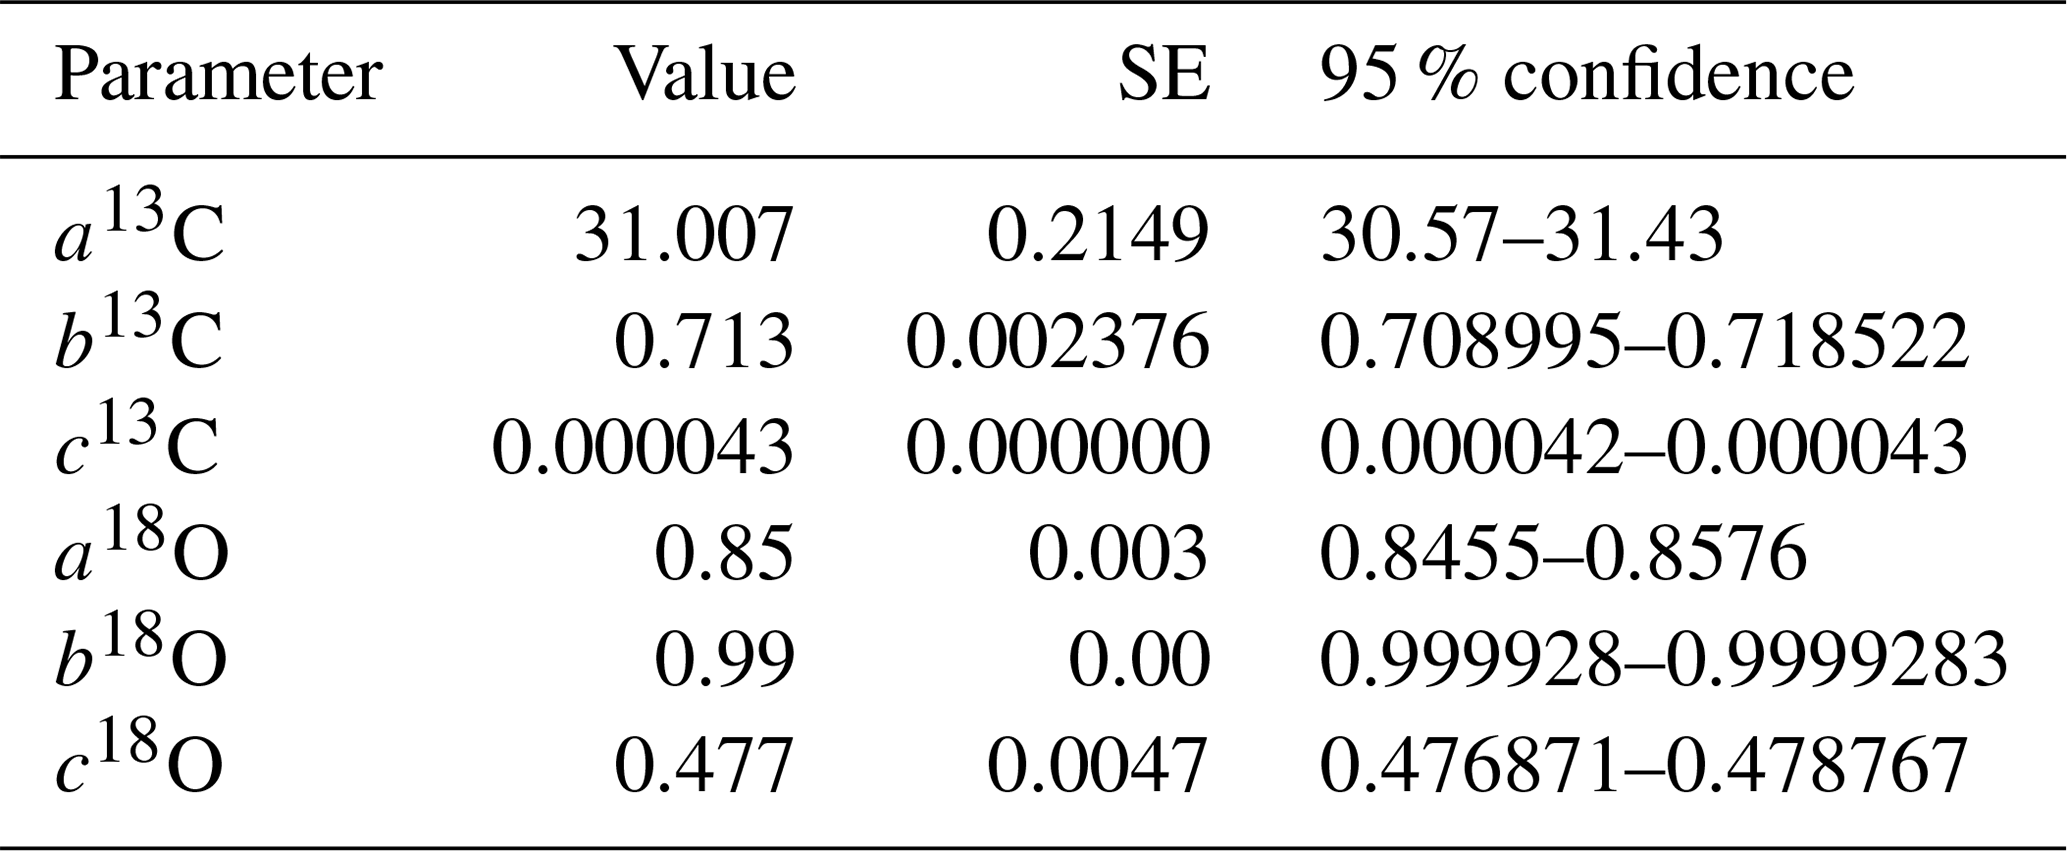
The dependency of δ13C and δ18O values on the CO2 concentration was compensated by using a non-linear model. The deviations (Diff-δ) of the measured delta values (δ(OA-ICOS)) from the absolute value of the standard gas (δ(IRMS)) at different concentrations of CO2 were calculated (Diff-). Several mathematical models were then fitted to Diff-δ as a function of changing CO2 concentration (see Fig. 5). The mathematical model with the best fit for Diff-δ data was selected using the corrected Akaike information criterion (AICC; Glatting et al., 2007; Hurvich and Tsai, 1989; Yamaoka et al., 1978). The non-linear model fits applied for Diff-δ13C and Diff-δ18O measurements are given in Tables 1 and 2, respectively. For Diff-δ13C, a three-parameter exponential model fitted best with r2=0.99 (see Table 3 for the values of the parameters; see Fig. S3a for model residuals), and a three-parameter power function model (see Table 2) with r2=0.99 showed the best fit for Diff-δ18O (see Table 3 for the values of the parameters; see Fig. S3b for model residuals). The best fit was then introduced into the measured isotopic data (δ13C and δ18O) and corrected for concentration-dependent errors (see Fig. 6). After correction, the standard deviation of δ13C was reduced to 0.08 ‰, and the deviation of δ18O to 0.09 ‰, for all measurements across the whole CO2 concentration range.
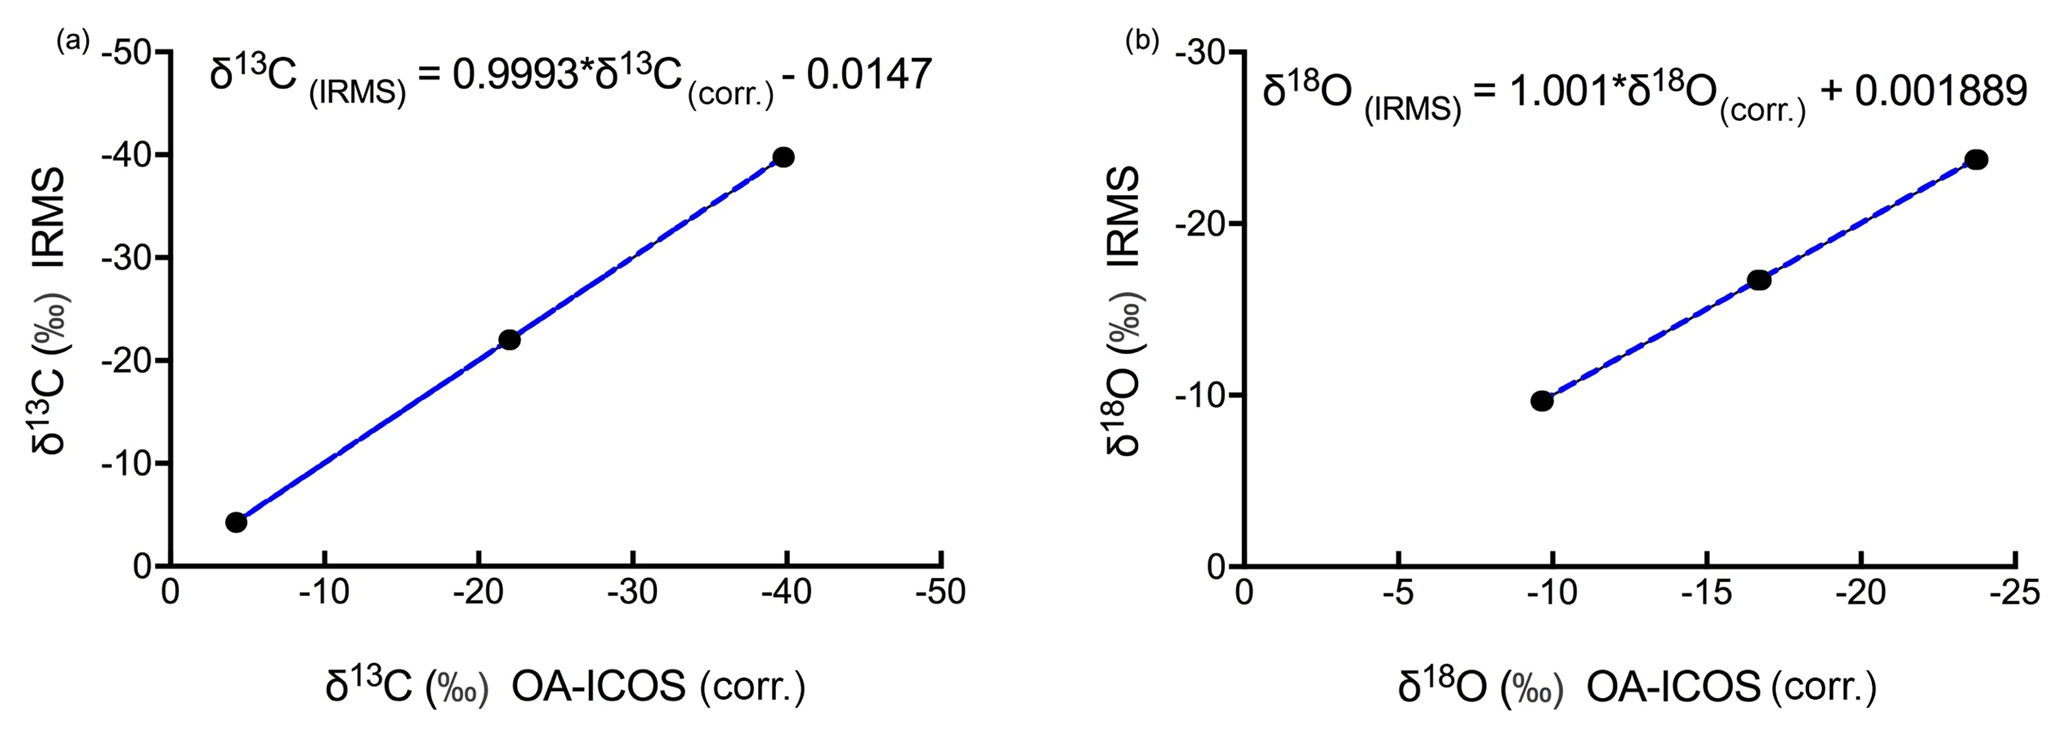
Figure 7Three-point calibration lines for (a) δ13C and (b) δ18O measurements using OA-ICOS with 95 % confidence interval.
After correcting the measured δ13C and δ18O values for the CO2 concentration-dependent deviations, a three-point calibration (Sturm et al., 2012) was made by generating linear regressions with the concentration-corrected δ13C and δ18O values against absolute δ13C and δ18O values (see Fig. 7; see Fig. S4 for linear regression residuals). Using the linear regression lines, we were able to measure the validation gas standard, with standard deviations of 0.0826 ‰ for δ13C and 0.0941 ‰ for δ18O.
Table 3Parameter values for correction factor model fit for Diff-δ13C and Diff-δ18O.
For the LGR CCIA 36-d, we found that routine calibration (correction for concentration-dependent error plus three-point calibration) was necessary for obtaining the required accuracy, in particular under fluctuating CO2 concentrations. The LGR CCIA-36d offers an option for calibration against a single standard, a feature which was already in place in a predecessor model (CCIA DLT-100; Guillon et al., 2012). This internal calibration is sufficient when LGR CCIA-36d is operated only under stable CO2 concentrations. To correct for the concentration dependency, we introduced mathematical model fits, which corrected for the deviation pattern found for both δ13C and δ18O. We assume that these deviations are instrument specific and that the fitting parameters need to be adjusted for every single device. Experiments conducted to investigate the influence of external temperature fluctuations on OA-ICOS measurements did not show any significant changes in the temperature inside the optical cavity of the OA-ICOS (see Fig. S1). The previous version of the Los Gatos CCIA was strongly influenced by temperature fluctuations during sampling (Guillon et al., 2012). The lack of temperature dependency as observed here with the most recent model can be mostly due to the heavy insulation provided with the system, which was not found in the older models.
Guillon et al. (2012) found a linear correlation between CO2 concentration and respective stable isotope signatures with a previous version of the Los Gatos CCIA CO2 stable isotope analyser. In our experiments with the OA-ICOS, the best fitting correlations between CO2 concentration and δ13C and δ18O measurements were exponential and power functions, respectively. We assume that measurement accuracy is influenced by the number of CO2 molecules present inside the laser cavity of the particular laser spectrometer, as we observed large standard deviation in isotopic measurements at lower CO2 concentrations. This behaviour of an OA-ICOS can be expected, as it functions by sweeping the laser along an absorption spectrum, measuring the energy transmitted after passing through the sample. Therefore, energy transmitted is proportional to the gas concentration in the cavity. The laser absorbance is then determined by normalising against a reference signal, finally calculating the concentration of the sample measured by integrating the whole spectrum of absorbance (O'Keefe et al., 1999).
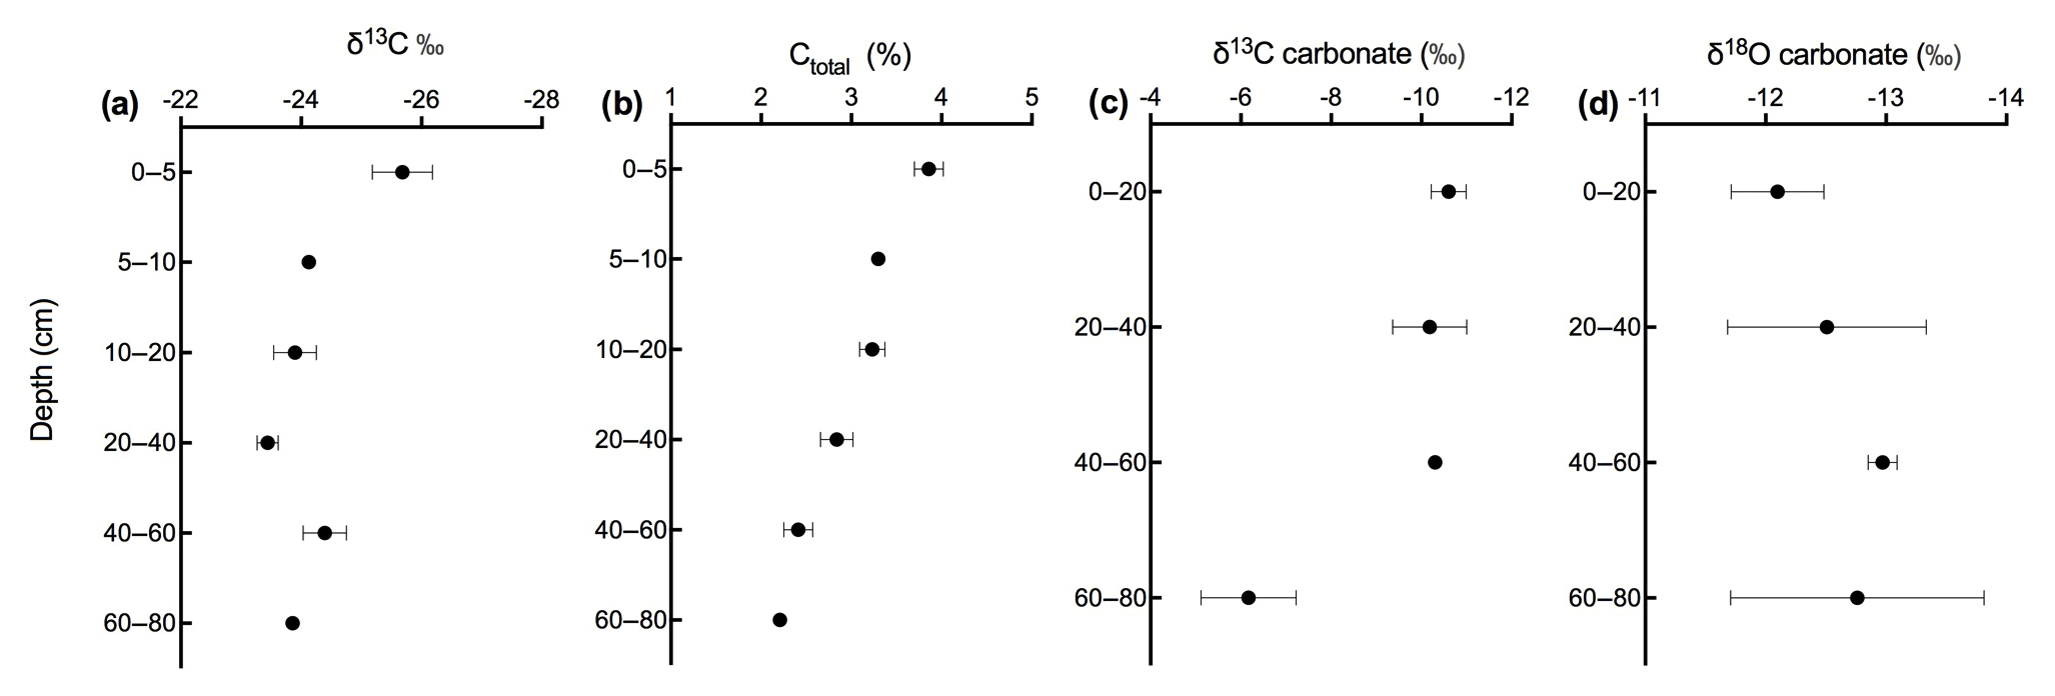
Figure 8Depth profile of (a) δ13C, (b) carbon content, (c) δ13C of soil carbonate, and (d) δ18O of soil carbonate in calcareous soil.
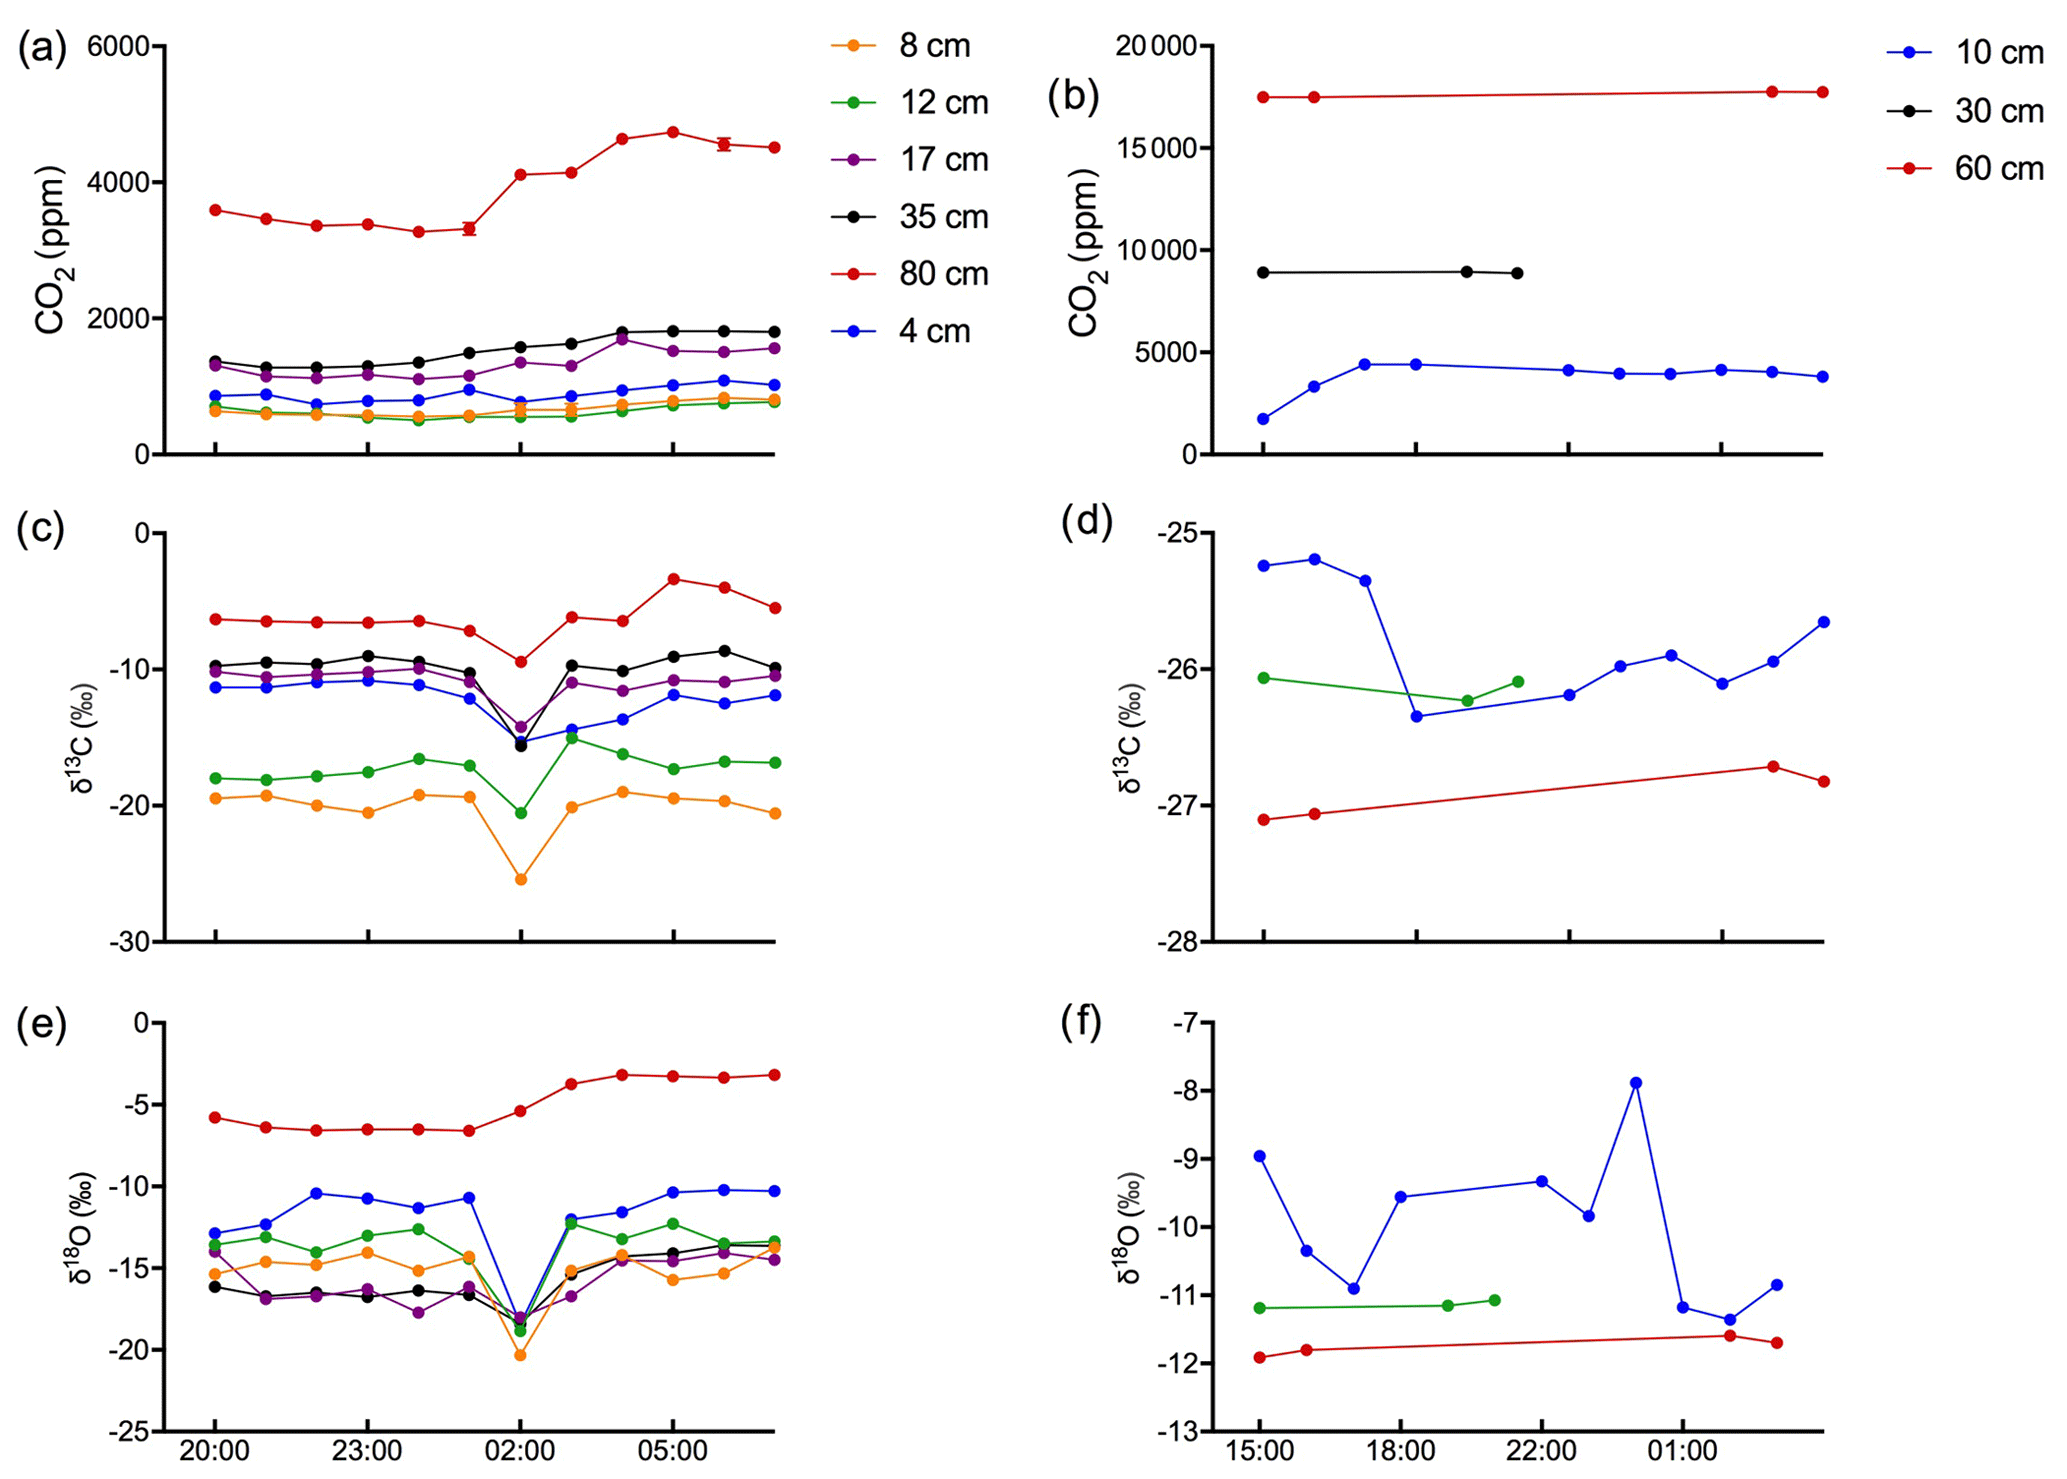
Figure 9Time course of the evolution of soil gas CO2 (ppm), δ13C, and δ18O in calcareous (a, c, e) and acidic (b, d, f) soils. Data collected continuously over a 12 h time frame for the calcareous soil and a 14 h time window with intermittent data collection for the acidic soil.
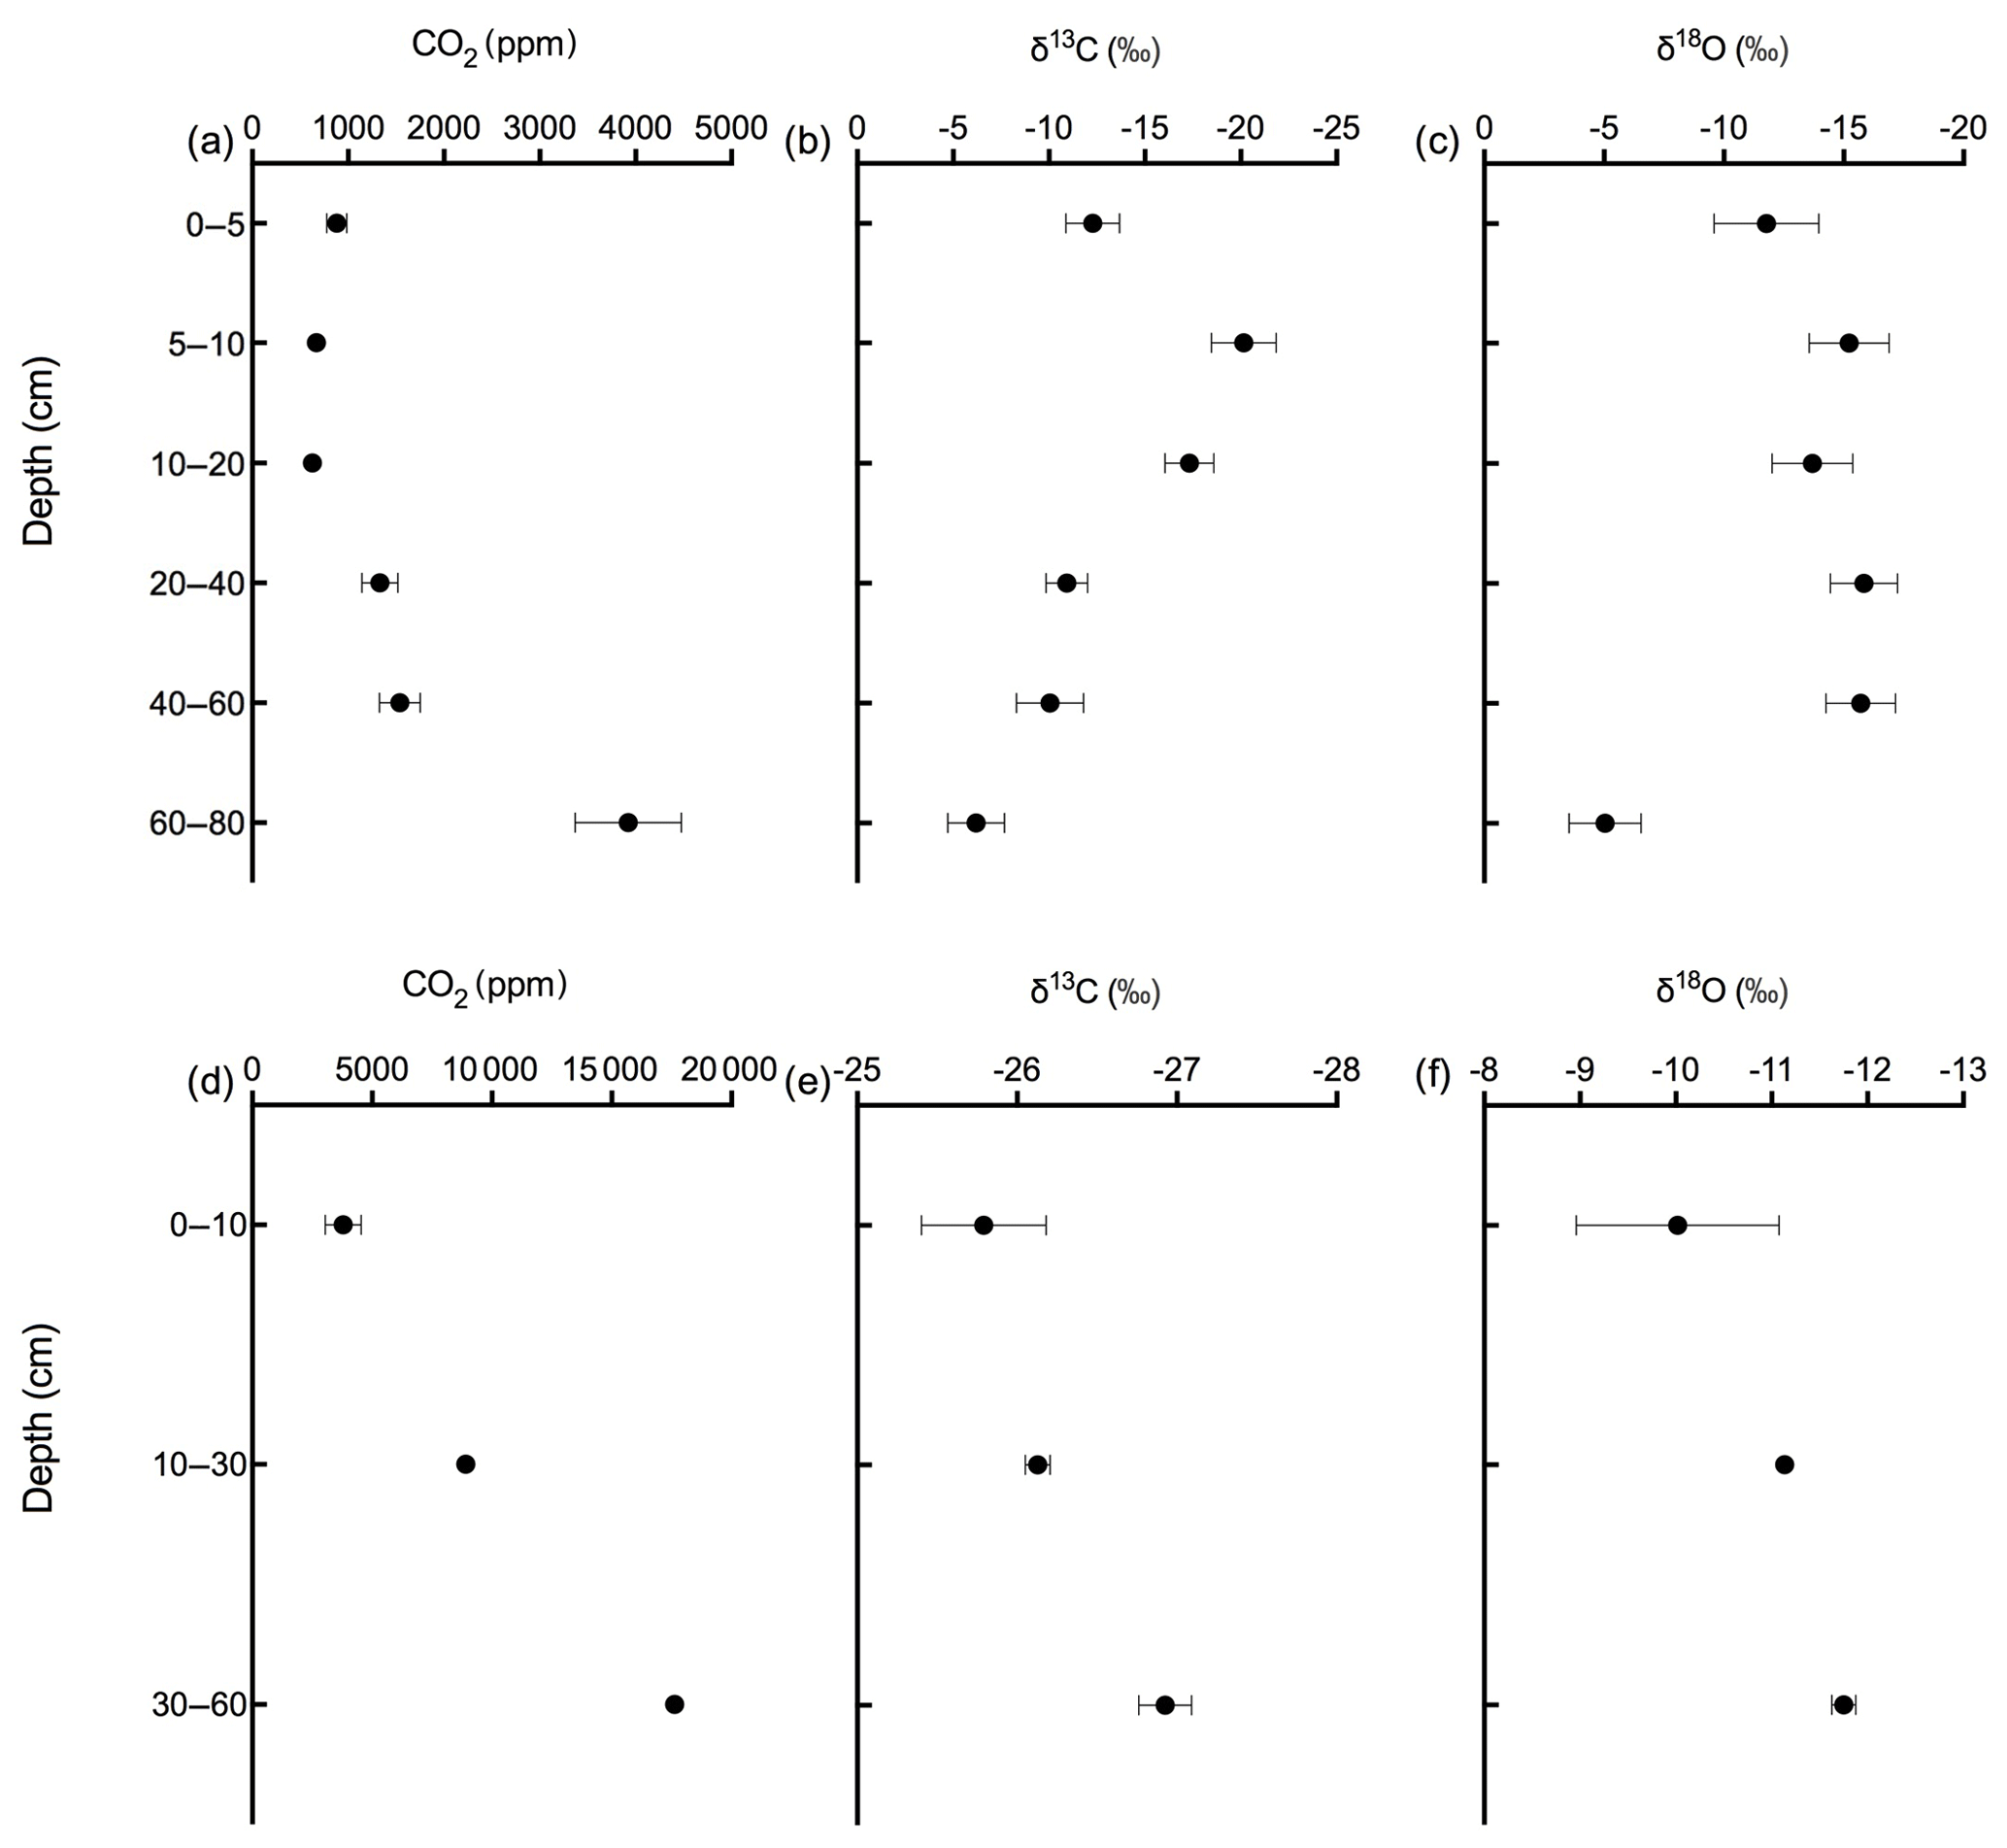
Figure 10Daily average data of soil CO2 (ppm), δ13C, and δ18O in calcareous (a, b, c) and acidic (d, e, f) soils across soil depth profiles.
3.2 Variation in soil CO2 concentration, carbon, and oxygen isotope values
Figures 9 and 10 show the CO2 concentration and the δ13C and δ18O measurements of soil CO2 in the calcareous as well as in the acidic soil across the soil profile with a sub-daily resolution and as averages for the day, respectively. We observed an increase in the CO2 concentration across the soil depth profile for both the calcareous and the acidic soil. Moreover, there were rather contrasting δ13C values across the profile for the two soil types. In the calcareous soil, CO2 was relatively enriched in 13C in the surface soil (4 cm) as compared to the 8 cm depth. Below 8 cm down to 80 cm depth, we found an increase in δ13C values. At 80 cm depth, the δ13C in soil CO2 ranged between −7.15 ‰ and −3.35 ‰ (see Fig. 9), with a daily average of ‰ (see Fig. 10), hence being clearly above atmospheric values ( ‰). For δ18O values of calcareous soil, the depth profile showed no specific pattern, except for the δ18O values at 80 cm depth, which were found to be less negative than the values at the other depths. The δ18O value in the top 4 cm was found to be slightly more enriched that the 8 cm depth, and between 8–35 cm, δ18O values showed little variation relative to each other. For the sub-daily measurements, we observed a sharp decline in δ18O values at around 02:00 CET, which is also observed but less pronounced for the δ13C signal. We assume that the reason for such aberrant values is a technical issue rather than a biological process. It could be due to the fact that the internal pump in the OA-ICOS was not taking an adequate amount of gas into the optical cavity, thereby creating a negative pressure inside the cavity resulting in the observed aberrant values. The patterns observed for the δ13C values of CO2 in the calcareous soil with 13C enrichment in deeper soil layers can be explained by a substantial contribution of CO2 from abiotic origin to total soil CO2 release as a result of carbonate weathering and subsequent outgassing from soil water (Schindlbacher et al., 2015). According to Cerling (1984), the distinct oxygen and carbon isotopic composition of soil carbonate depends primarily on the isotopic signature of meteoric water and on the proportion of C4 biomass present at the time of carbonate formation (Cerling, 1984) but also on numerous other factors that determine the 13C value of soil CO2. CO2 released as a result from carbonates in calcareous soil site have a distinct δ13C value of −9.3 (mean value across soil profile 0–80 cm depth; Fig. 8c), while CO2 released during biological respiratory processes has δ13C values around −24 ‰, as observed in the acidic soil (Fig. 10e). The δ13C values of soil CO2 observed in the deepest soil layer in the calcareous soil site most likely indicate the presence of carbonate sources of a pedogenic and geologic origin. Even though the contribution of CO2 from abiotic sources to soil CO2 is often considered to be low, several studies have reported significant proportions ranging between (10 %–60 %), emanating from abiotic sources (Emmerich, 2003; Plestenjak et al., 2012; Ramnarine et al., 2012; Serrano-Ortiz et al., 2010; Stevenson and Verburg, 2006; Tamir et al., 2011). Bowen and Beerling (2004) showed that isotope effects associated with soil organic matter (SOM) decomposition can cause a strong gradient in δ values of soil organic matter with depth but are not always reflected in the δ13C values of soil CO2. We have measured soil samples for bulk soil δ13C, carbonate δ13C, and δ18O values and have also determined the percentage of total carbon in the soil across a depth profile of (0–80 cm; see Fig. 8). We observed an increase in δ13C values for bulk soil in deeper soil layers (see Fig. 8a, c). Moreover, the carbonate δ13C values also got more positive in the 60–80 cm layer. Since total organic carbon content decreases with depth, it can be assumed that the CO2 derived from carbonate weathering, having less negative δ13C values, more strongly contributed to the soil CO2 (especially since we see an increase in soil CO2 concentration with depth). This is accordance with the laser-based measurements which showed a strong increase in the δ13C of soil CO2 in the deepest soil layer, leading us to the hypothesis that this signal indicates a strong contribution of carbonate-derived CO2. Water content, soil CO2 concentration, and the presence of organic acids or any other source of H+ are the major factors influencing carbonate weathering, and variations in soil CO2 partial pressure, moisture, temperature, and pH can cause degassing of CO2 which contributes to the soil CO2 efflux (Schindlbacher et al., 2015; Zamanian et al., 2016). CaCO3 solubility in pure H2O at 25 ∘C is 0.013 g L−1, but in weak acids like carbonic acid, the solubility is increased up to 5 fold (Zamanian et al., 2016). The production of carbonic acid due to CO2 dissolution will convert carbonate to bicarbonates, resulting in exchange of carbon atoms between carbonates and dissolved CO2.We assume that at our study site, the topsoil is decarbonated due to intensive agriculture for a longer period, thus the soil CO2 there originates primarily from autotrophic and heterotrophic respiratory activity. In contrast to the deeper soil layers, where the carbonate content is high, CO2 from carbonate weathering is assumed to be a dominating source of soil CO2. Also, outgassing of CO2 from the large groundwater body underneath the calcareous Gleysol might contribute to the inorganic CO2 sources in the deeper soil, as we found the groundwater table to be 1–2 m below the soil surface. Relative 13C enrichment of the CO2 in the topsoil (4 cm) compared to that at 8 cm depth is probably due to the invasive diffusion of atmospheric CO2, which has a δ13C value close to −8 ‰ (e.g. Levin et al., 1995). The δ18O patterns for CO2 between 4 and 35 cm might reflect the δ18O of soil water with stronger evaporative enrichment at the top and 18O depletion towards deeper soil layers. In comparison, the strong 18O enrichment of soil CO2 towards 80 cm in the calcareous Gleysol very likely reflects the 18O values of groundwater lending further support to the high contribution of CO2 originating from the outgassing of groundwater. We, however, need then to assume that the oxygen in the CO2 is not in full equilibrium with the precipitation-influenced soil water. Since mainly microbial carbonic anhydrase mediates the fast equilibrium between CO2, and water in the soil and the microbial activity is low in deeper soil layers (Schmidt et al., 2011), we speculate that in deep layers with a significant contribution of groundwater derived CO2 to the CO2 pool, a lack of full equilibration with soil water might be the reason for the observed δ18O values.
Soil CO2 concentration in the acidic soil showed a positive relationship with soil depth as CO2 concentration increased along with increasing soil depth (Figs. 9 and 10). CO2 concentrations were distinctly higher than in the calcareous soil, very likely due to the finer texture than in the gravel-rich calcareous soil. δ13C values amounted to approximately −26 ‰ in 30 and 60 cm depth, indicating the biotic origin from (autotrophic and heterotrophic) soil respiration (Schönwitz et al., 1986). In the topsoil, δ13C values did not strongly increase, pointing towards a less pronounced inward diffusion of CO2 in the acidic soil site, most likely due to more extensive outward diffusion of soil CO2, as indicated by the still very high CO2 concentration at 10 cm creating a sharp gradient between soil and atmosphere. Moreover, the acidic soil was rather dense and contained no stones, strongly suggesting that gas diffusivity was rather small. δ18O depth patterns of soil CO2 in the acidic soil most likely reflected δ18O values of soil water as CO2 became increasingly 18O depleted from top to bottom. The δ18O of deeper soil layers CO2 (30–60 cm) was close to the values expected when full oxygen exchange between soil water and CO2 occurred (Kato et al., 2004). Assuming an 18O fractionation of 41 ‰ between CO2 and water (Brenninkmeijer et al., 1983), this would result in an expected value for CO2 of ‰ vs. VPDB CO2. Corresponding results have been shown for δ18O of soil CO2 using similar hydrophobic gas-permeable membrane tubes used when measuring δ18O of soil CO2 and soil water in situ (Gangi et al., 2015).
During our preliminary tests with the OA-ICOS, we found that the equipment was highly sensitive to changes in CO2 concentrations. We found a non-linear response of the δ13C and δ18O values against changes in CO2 concentration. Given the fact that laser-based CO2 isotope analysers are deployed on site in combination with different gas sampling methods like automated chambers systems (Bowling et al., 2015) and hydrophobic gas-permeable membranes (Jochheim et al., 2018) for tracing various ecosystem processes, it is important to address this issue. Therefore, we developed a calibration strategy for correcting errors introduced in δ13C and δ18O measurements due to the sensitivity of the device against changing CO2 concentrations. We found that the OA-ICOS measures stable isotopes of CO2 gas samples with a precision comparable to conventional IRMS. The method described in this work for measuring CO2 concentration and δ13C and δ18O values in soil air profiles using an OA-ICOS and hydrophobic gas-permeable tubes is promising and can be applied for soil CO2 flux studies. As this set-up is capable of measuring continuously for longer time periods at a higher temporal resolution (0.05–0.1 Hz), it offers greater potential to investigate the isotopic identity of CO2 and the interrelation between soil CO2 and soil water. By using our measurement set-up, we could identify abiotic as well as biotic contributions to the soil CO2 in the calcareous soil. We infer that degassing of CO2 from carbonates due to weathering and evasion of CO2 from groundwater may leave the soil CO2 with a specific and distinct δ13C signature, especially when the biotic activity is rather low.
Data are available via https://doi.org/10.5281/zenodo.2551237 (Joseph, 2019).
The supplement related to this article is available online at: https://doi.org/10.5194/soil-5-49-2019-supplement.
CK, MW, AG, and JJ conceived the idea. JJ conducted the experiments, analyzed the data, and created the figures. JJ, AG, and MW wrote the paper. MS, FH, MA, and CK commented on and edited the paper.
The authors declare that they have no conflict of interest.
We thank the Federal Ministry of Education and Research, Germany (BMBF), and the KIT
(Karlsruhe Institute of Technology) for providing financial support for the
project ENABLE WCM (Grant Number: 02WQ1205). Arthur Gessler and Jobin Joseph acknowledge financial
support by the Swiss National Science Foundation (SNF; 31003A_159866). We thank Barbara Herbstritt, Hannes Leistert, Emil Blattmann and
Jens Lange, Matthias Saurer, Alessandro Schlumpf, Lukas Bächli, and
Christian Poll for outstanding support in making this project into a
reality.
Edited by: Raúl Zornoza
Reviewed by: Rolf Siegwolf and two anonymous referees
Allan, D. W., Ashby, N., and Hodge, C. C.: The Science of Timekeeping, Hewlett-Packard, 88, available at: http://www.allanstime.com/Publications/DWA/Science_Timekeeping/TheScienceOfTimekeeping.pdf (last access: 16 March 2018), 1997.
Arend, M., Gessler, A., and Schaub, M.: The influence of the soil on spring and autumn phenology in European beech, Tree Physiol., 36, 78–85, https://doi.org/10.1093/treephys/tpv087, 2016.
Baer, D. S., Paul, J. B., Gupta, M., and O'Keefe, A.: Sensitive absorption measurements in the near-infrared region using off-axis integrated-cavity-output spectroscopy, Appl. Phys. B-Lasers O., 75, 261–265, https://doi.org/10.1007/s00340-002-0971-z, 2002.
Barthel, M., Sturm, P., Hammerle, A., Buchmann, N., Gentsch, L., Siegwolf, R., and Knohl, A.: Soil labelling reveals the effect of drought on C18OO fluxes to the atmosphere, J. Exp. Bot., 65, 5783–5793, https://doi.org/10.1093/jxb/eru312, 2014.
Bertolini, T., Inglima, I., Rubino, M., Marzaioli, F., Lubritto, C., Subke, J.-A., Peressotti, A., and Cotrufo, M. F.: Sampling soil-derived CO2 for analysis of isotopic composition: a comparison of different techniques, Isot. Environ. Healt. S., 42, 57–65, https://doi.org/10.1080/10256010500503312, 2006.
Bond-Lamberty, B. and Thomson, A.: Temperature-associated increases in the global soil respiration record, Nature, 464, 579–582, https://doi.org/10.1038/nature08930, 2010.
Bowen, G. J. and Beerling, D. J.: An integrated model for soil organic carbon and CO2: Implications for paleosol carbonate pCO2 paleobarometry, Global Biogeochem. Cy., 18, GB1026, https://doi.org/10.1029/2003GB002117, 2004.
Bowling, D. R., Sargent, S. D., Tanner, B. D., and Ehleringer, J. R.: Tunable diode laser absorption spectroscopy for stable isotope studies of ecosystem–atmosphere CO2 exchange, Agr. Forest. Meteorol., 118, 1–19, https://doi.org/10.1016/S0168-1923(03)00074-1, 2003.
Bowling, D. R., Egan, J. E., Hall, S. J., and Risk, D. A.: Environmental forcing does not induce diel or synoptic variation in the carbon isotope content of forest soil respiration, Biogeosciences, 12, 5143–5160, https://doi.org/10.5194/bg-12-5143-2015, 2015.
Breecker, D. and Sharp, Z. D.: A field and laboratory method for monitoring the concentration and isotopic composition of soil CO2, Rapid Commun. Mass Sp., 22, 449–454, https://doi.org/10.1002/rcm.3382, 2008.
Brenninkmeijer, C. A. M., Kraft, P., and Mook, W. G.: Oxygen isotope fractionation between CO2 and H2O, Chem. Geol., 41, 181–190, https://doi.org/10.1016/S0009-2541(83)80015-1, 1983.
Cerling, T. E.: The stable isotopic composition of modern soil carbonate and its relationship to climate, Earth Planet. Sc. Lett., 71, 229–240, https://doi.org/10.1016/0012-821X(84)90089-X, 1984.
Emmerich, W. E.: Carbon dioxide fluxes in a semiarid environment with high carbonate soils, Agr. Forest. Meteorol., 116, 91–102, 2003.
Francey, R. J. and Tans, P. P.: Latitudinal variation in oxygen-18 of atmospheric CO2, Nature, 327, 495–497, https://doi.org/10.1038/327495a0, 1987.
Gangi, L., Rothfuss, Y., Ogée, J., Wingate, L., Vereecken, H., and Brüggemann, N.: A New Method for In Situ Measurements of Oxygen Isotopologues of Soil Water and Carbon Dioxide with High Time Resolution, Vadose Zone J., 14, 0, https://doi.org/10.2136/vzj2014.11.0169, 2015.
Glatting, G., Kletting, P., Reske, S. N., Hohl, K., and Ring, C.: Choosing the optimal fit function: Comparison of the Akaike information criterion and the F-test, Med. Phys., 34, 4285–4292, https://doi.org/10.1118/1.2794176, 2007.
Guillon, S., Pili, E., and Agrinier, P.: Using a laser-based CO2 carbon isotope analyser to investigate gas transfer in geological media, Appl. Phys. B, 107, 449–457, https://doi.org/10.1007/s00340-012-4942-8, 2012.
Gut, A., Blatter, A., Fahrni, M., Lehmann, B. E., Neftel, A., and Staffelbach, T.: A new membrane tube technique (METT) for continuous gas measurements in soils, Plant Soil, 198, 79–88, https://doi.org/10.1023/A:1004277519234, 1998.
Harwood, K. G., Gillon, J. S., Roberts, A., and Griffiths, H.: Determinants of isotopic coupling of CO2 and water vapour within a Quercus petraea forest canopy, Oecologia, 119, 109–119, https://doi.org/10.1007/s004420050766, 1999.
Hurvich, C. M. and Tsai, C.: Regression and time series model selection in small samples, Biometrika, 76, 297–307, https://doi.org/10.1093/biomet/76.2.297, 1989.
IUSS (International Union of Soil Sciences) Working Group WRB: World Reference Base for Soil Resources 2014, update 2015 International soil classification system for naming soils and creating legends for soil maps, World Soil Resources Reports No. 106, FAO, Rome, Italy, 2015.
Jochheim, H., Wirth, S., and von Unold, G.: A multi-layer, closed-loop system for continuous measurement of soil CO2 concentration, J. Plant Nutr. Soil Sci., 181, 61–68, https://doi.org/10.1002/jpln.201700259, 2018.
Joseph, J.: Application of a laser-based spectrometer for continuous insitu measurements of stable isotopes of soil CO2 in calcareous and acidic soils (Data set), Zenodo, https://doi.org/10.5281/zenodo.2551238, 2019.
Jost, H.-J., Castrillo, A., and Wilson, H. W.: Simultaneous 13C∕12C and 18O∕16O isotope ratio measurements on CO2 based on off-axis integrated cavity output spectroscopy, Isot. Environ. Healt. S., 42, 37–45, https://doi.org/10.1080/10256010500503163, 2006.
Kammer, A., Tuzson, B., Emmenegger, L., Knohl, A., Mohn, J., and Hagedorn, F.: Application of a quantum cascade laser-based spectrometer in a closed chamber system for real-time δ13C and δ18O measurements of soil-respired CO2, Agr. Forest. Meteorol., 151, 39–48, https://doi.org/10.1016/j.agrformet.2010.09.001, 2011.
Kato, T., Nakazawa, T., Aoki, S., Sugawara, S., and Ishizawa, M.: Seasonal variation of the oxygen isotopic ratio of atmospheric carbon dioxide in a temperate forest, Japan, Global Biogeochem. Cy., 18, GB2020, https://doi.org/10.1029/2003GB002173, 2004.
Kayler, Z. E., Sulzman, E. W., Rugh, W. D., Mix, A. C., and Bond, B. J.: Soil biology and biochemistry, Pergamon, available at: https://www.cabdirect.org/cabdirect/abstract/20103097455 (last access: 16 March 2018), 2010.
Keeling, C. D.: The concentration and isotopic abundances of atmospheric carbon dioxide in rural areas, Geochim. Cosmochim. Ac., 13, 322–334, https://doi.org/10.1016/0016-7037(58)90033-4, 1958.
Kerstel, E. and Gianfrani, L.: Advances in laser-based isotope ratio measurements: selected applications, Appl. Phys. B, 92, 439–449, https://doi.org/10.1007/s00340-008-3128-x, 2008.
Kuster, T. M., Arend, M., Bleuler, P., Günthardt-Goerg, M. S., and Schulin, R.: Water regime and growth of young oak stands subjected to air-warming and drought on two different forest soils in a model ecosystem experiment, Plant Biol., 15, 138–147, https://doi.org/10.1111/j.1438-8677.2011.00552.x, 2013.
Kuzyakov, Y.: Sources of CO2 efflux from soil and review of partitioning methods, Soil Biol. Biochem., 38, 425–448, https://doi.org/10.1016/j.soilbio.2005.08.020, 2006.
Levin, I., Graul, R., and Trivett, N. B. A.: Long-term observations of atmospheric CO2 and carbon isotopes at continental sites in Germany, Tellus B, 47, 23–34, https://doi.org/10.1034/j.1600-0889.47.issue1.4.x, 1995.
Maier, M. and Schack-Kirchner, H.: Using the gradient method to determine soil gas flux: A review, Agr. Forest. Meteorol., 192–193, 78–95, https://doi.org/10.1016/j.agrformet.2014.03.006, 2014.
Mortazavi, B., Prater, J. L., and Chanton, J. P.: A field-based method for simultaneous measurements of the δ18O and δ13C of soil CO2 efflux, Biogeosciences, 1, 1–9, https://doi.org/10.5194/bg-1-1-2004, 2004.
Nelson, D. D., McManus, J. B., Herndon, S. C., Zahniser, M. S., Tuzson, B., and Emmenegger, L.: New method for isotopic ratio measurements of atmospheric carbon dioxide using a 4.3 µm pulsed quantum cascade laser, Appl. Phys. B, 90, 301–309, https://doi.org/10.1007/s00340-007-2894-1, 2008.
Oerter, E. J. and Amundson, R.: Climate controls on spatial and temporal variations in the formation of pedogenic carbonate in the western Great Basin of North America, Geol. Soc. Am. Bull., 128, 1095–1104, https://doi.org/10.1130/B31367.1, 2016.
Ohlsson, K., Singh, B., Holm, S., Nordgren, A., Lovdahl, L., and Hogberg, P.: Uncertainties in static closed chamber measurements of the carbon isotopic ratio of soil-respired CO, Soil Biol. Biochem., 37, 2273–2276, https://doi.org/10.1016/j.soilbio.2005.03.023, 2005.
O'Keefe, A. and Deacon, D. A. G.: Cavity ring-down optical spectrometer for absorption measurements using pulsed laser sources, Rev. Sci. Instrum., 59, 2544–2551, https://doi.org/10.1063/1.1139895, 1988.
O'Keefe, A., Scherer, J. J., and Paul, J. B.: Cw Integrated Cavity Output Spectroscopy, Publ. Chem. Phys. Lett., 307, 343–349, 1999.
Parameswaran, K. R., Rosen, D. I., Allen, M. G., Ganz, A. M., and Risby, T. H.: Off-axis integrated cavity output spectroscopy with a mid-infrared interband cascade laser for real-time breath ethane measurements, Appl. Optics, 48, B73-79, https://doi.org/10.1364/AO.48.000B73, 2009.
Parent, F., Plain, C., Epron, D., Maier, M., and Longdoz, B.: A new method for continuously measuring the δ13C of soil CO2 concentrations at different depths by laser spectrometry, Eur. J. Soil Sci., 64, 516–525, https://doi.org/10.1111/ejss.12047, 2013.
Peltola, J., Vainio, M., Ulvila, V., Siltanen, M., Metsälä, M., and Halonen, L.: Off-axis re-entrant cavity ring-down spectroscopy with a mid-infrared continuous-wave optical parametric oscillator, Appl. Phys. B, 107, 839–847, https://doi.org/10.1007/s00340-012-5074-x, 2012.
Plestenjak, G., Eler, K., Vodnik, D., Ferlan, M., Čater, M., Kanduč, T., Simončič, P., and Ogrinc, N.: Sources of soil CO2 in calcareous grassland with woody plant encroachment, J. Soils Sediments, 12, 1327–1338, https://doi.org/10.1007/s11368-012-0564-3, 2012.
Ramnarine, R., Wagner-Riddle, C., Dunfield, K. E., and Voroney, R. P.: Contributions of carbonates to soil CO2 emissions, Can. J. Soil Sci., 92, 599–607, https://doi.org/10.4141/cjss2011-025, 2012.
Risk, D. and Kellman, L.: Isotopic fractionation in non-equilibrium diffusive environments, Geophys. Res. Lett., 35, L02403, https://doi.org/10.1029/2007GL032374, 2008.
Satakhun, D., Gay, F., Chairungsee, N., Kasemsap, P., Chantuma, P., Thanisawanyangkura, S., Thaler, P., and Epron, D.: Soil CO2 efflux and soil carbon balance of a tropical rubber plantation, Ecol. Res., 28, 969–979, https://doi.org/10.1007/s11284-013-1079-0, 2013.
Schär, C., Vidale, P. L., Lüthi, D., Frei, C., Häberli, C., Liniger, M. A., and Appenzeller, C.: The role of increasing temperature variability in European summer heatwaves, Nature, 427, 332–336, https://doi.org/10.1038/nature02300, 2004.
Schindlbacher, A., Borken, W., Djukic, I., Brandstätter, C., Spötl, C., and Wanek, W.: Contribution of carbonate weathering to the CO2 efflux from temperate forest soils, Biogeochemistry, 124, 273–290, https://doi.org/10.1007/s10533-015-0097-0, 2015.
Schmidt, M. W. I., Torn, M. S., Abiven, S., Dittmar, T., Guggenberger, G., Janssens, I. A., Kleber, M., Kögel-Knabner, I., Lehmann, J., Manning, D. A. C., Nannipieri, P., Rasse, D. P., Weiner, S., and Trumbore, S. E.: Persistence of soil organic matter as an ecosystem property, Nature, 478, 49–56, https://doi.org/10.1038/nature10386, 2011.
Schönwitz, R., Stichler, W., and Ziegler, H.: δ13C values of CO2 from soil respiration on sites with crops of C3 and C4 type of photosynthesis, Oecologia, 69, 305–308, https://doi.org/10.1007/BF00377638, 1986.
Serrano-Ortiz, P., Roland, M., Sanchez-Moral, S., Janssens, I. A., Domingo, F., Goddéris, Y., and Kowalski, A. S.: Hidden, abiotic CO2 flows and gaseous reservoirs in the terrestrial carbon cycle: Review and perspectives, Agr. Forest. Meteorol., 150, 321–329, https://doi.org/10.1016/j.agrformet.2010.01.002, 2010.
Sperber, C. Von, Weiler, M., and Büggemann, N.: The effect of soil moisture, soil particle size, litter layer and carbonic anhydrase on the oxygen isotopic composition of soil-released CO2, Eur. J. Soil Sci., 66, 566–576, https://doi.org/10.1111/ejss.12241, 2015.
Stevenson, B. A. and Verburg, P. S. J.: Effluxed CO2-13C from sterilized and unsterilized treatments of a calcareous soil, Soil Biol. Biochem., 38, 1727–1733, https://doi.org/10.1016/j.soilbio.2005.11.028, 2006.
Stumpp, C., Brüggemann, N., and Wingate, L.: Stable Isotope Approaches in Vadose Zone Research, Vadose Zone J., 17, 0, https://doi.org/10.2136/vzj2018.05.0096, 2018.
Sturm, P., Eugster, W., and Knohl, A.: Eddy covariance measurements of CO2 isotopologues with a quantum cascade laser absorption spectrometer, Agr. Forest. Meteorol., 152, 73–82, https://doi.org/10.1016/j.agrformet.2011.09.007, 2012.
Tamir, G., Shenker, M., Heller, H., Bloom, P. R., Fine, P., and Bar-Tal, A.: Can Soil Carbonate Dissolution Lead to Overestimation of Soil Respiration?, Soil Sci. Soc. Am. J., 75, 1414, https://doi.org/10.2136/sssaj2010.0396, 2011.
Torn, M. S., Davis, S., Bird, J. A., Shaw, M. R., and Conrad, M. E.: Automated analysis of 13C∕12C ratios in CO2 and dissolved inorganic carbon for ecological and environmental applications, Rapid Commun. Mass Sp., 17, 2675–2682, https://doi.org/10.1002/rcm.1246, 2003.
von Basum, G., Halmer, D., Hering, P., Mürtz, M., Schiller, S., Müller, F., Popp, A., and Kühnemann, F.: Parts per trillion sensitivity for ethane in air with an optical parametric oscillator cavity leak-out spectrometer, Opt. Lett., 29, 797–799, https://doi.org/10.1364/OL.29.000797, 2004.
Werner, C. and Gessler, A.: Diel variations in the carbon isotope composition of respired CO2 and associated carbon sources: a review of dynamics and mechanisms, Biogeosciences, 8, 2437–2459, https://doi.org/10.5194/bg-8-2437-2011, 2011.
Werner, C., Schnyder, H., Cuntz, M., Keitel, C., Zeeman, M. J., Dawson, T. E., Badeck, F.-W., Brugnoli, E., Ghashghaie, J., Grams, T. E. E., Kayler, Z. E., Lakatos, M., Lee, X., Máguas, C., Ogée, J., Rascher, K. G., Siegwolf, R. T. W., Unger, S., Welker, J., Wingate, L., and Gessler, A.: Progress and challenges in using stable isotopes to trace plant carbon and water relations across scales, Biogeosciences, 9, 3083–3111, https://doi.org/10.5194/bg-9-3083-2012, 2012.
Wingate, L., Ogée, J., Cuntz, M., Genty, B., Reiter, I., Seibt, U., Yakir, D., Maseyk, K., Pendall, E. G., Barbour, M. M., Mortazavi, B., Burlett, R., Peylin, P., Miller, J., Mencuccini, M., Shim, J. H., Hunt, J., and Grace, J.: The impact of soil microorganisms on the global budget of δ18O in atmospheric CO2, P. Natl. Acad. Sci. USA, 106, 22411–22415, https://doi.org/10.1073/pnas.0905210106, 2009.
Wingate, L., Ogée, J., Burlett, R., Bosc, A., Devaux, M., Grace, J., Loustau, D., and Gessler, A.: Photosynthetic carbon isotope discrimination and its relationship to the carbon isotope signals of stem, soil and ecosystem respiration, New Phytol., 188, 576–589, https://doi.org/10.1111/j.1469-8137.2010.03384.x, 2010.
Yamaoka, K., Nakagawa, T., and Uno, T.: Application of Akaike's information criterion (AIC) in the evaluation of linear pharmacokinetic equations, J. Pharmacokinet. Biopharm., 6, 165–175, https://doi.org/10.1007/BF01117450, 1978.
Zamanian, K., Pustovoytov, K., and Kuzyakov, Y.: Pedogenic carbonates: Forms and formation processes, Earth-Sci. Rev., 157, 1–17, https://doi.org/10.1016/J.EARSCIREV.2016.03.003, 2016.