Variability of Stable Isotope in Lake Water and Its Hydrological Processes Identification in Mt. Yulong Region


1
Key Laboratory of Western China’s Environmental Systems(Ministry of Education), College of Environmental Sciences, Lanzhou University, Lanzhou 730000, China
2
State Key Laboratory of Cryospheric Sciences, Northwest Institute of Eco-environment and Resources, Chinese Academy of Sciences (CAS), Lanzhou 730000, China
3
College of Urban and Environmental Sciences, Northwest University, Xi’an 710127, China
*
Author to whom correspondence should be addressed.
Water 2017, 9(9), 711; https://doi.org/10.3390/w9090711
Submission received: 13 July 2017
/
Revised: 11 September 2017
/
Accepted: 12 September 2017
/
Published: 16 September 2017
(This article belongs to the Special Issue Isotopes in Hydrology and Hydrogeology)
Abstract
:Lakes are regarded as important nodes in water resources, playing pivotal roles in the regional hydrological cycle. However, the systematic study on lake water balance is scarce in Mt. Yulong region. Here, we study the stable isotope compositions of precipitation, inflowing rivers and lake water to exploit the characteristics of hydrological supply and lake water balance. The results showed that there was a typical spatial distribution of surface isotope in August and April. Relatively high δ18O values with low d-excess were found on the east and west shores of the lake in August and in the middle part of the lake in April. The lowest δ18O with highest d-excess were found in the north and south shores in August and April, respectively. Meanwhile, slight isotopic stratification indicated that the lake water was vertically mixed-well. Subsequently, the evaporation-to-inflow ratios (E/Is) during the two periods were further derived based on the isotope mass balance model. Approximately 51% in August and 12% in April of the water flowing into Lashi Lake underwent evaporation. This study provides a reference for the long-term monitoring and modeling the hydrology processes of the basin, and is important for the regional water resource.
1. Introduction
Lakes can either increase seasonal streamflow by recharging local or regional groundwater, or decrease seasonal streamflow by increasing evaporation [1]. Lakes in glaciered catchments especially are natural integrators of surficial processes and are thus important information sources regarding climate change [2,3]. Therefore, an understanding of the roles that lakes at high elevations play in seasonal and annual water balances and the water cycles of glacier-runoff systems, especially in glaciered catchments, is essential.
Evaporation plays a vital role in the process of hydrological cycle, and constraints on fluxes of vapor, heat and isotopologues associated with evaporation are important for the quantification of many process related to the global water cycle, regional water balance, and interpretation of paleo-isotopic records [4]. Evaporation as a fraction of inflow to a lake (E/I) can be calculated using oxygen (18O) and deuterium (D) isotopes and models of isotopic fractionation during evaporation [5]. E/I models are based on the evaporative enrichment of 18O and D, for which the light isotopic species of water, H216 O, has a higher vapor pressure and diffusivity than those of the heavy species H218O and HDO and is preferentially removed from lakes during evaporation. The departure of δ18O and δD in a sample from the global meteoric water line (GMWL) is proportional to E/I [2].
The use of the isotope technique is of great significance for understanding the hydrologic balance of lakes and regional hydrologic cycles. As a powerful investigative tool, the stable isotope technique has increasingly been utilized for estimating water balances and regional hydrologic cycles. In particular, the stable isotopes of hydrogen and oxygen have been used to study lake evaporation processes [2,4,6], quantify snowmelt contributing to runoff [7], estimate hydrological balance [8], compute residence times [9] and identify water supply characteristics [10,11]. In China, most research has been made on the Qinghai-Tibet Plateau area. Zhou et al. [3] reported that more than half of the inflow to the Nam Co was lost through groundwater seepage, which was very useful for water cycling and water balance research of the Tibetan Plateau. Kang et al. [10] proposed that annual E/I ratios of Nam Co were between 52% and 68.3% during the period of 2006–2008. Liu et al. [12] indicated that approximately 57% and 24% of the water flowing into Laguna Potrok and AikeCona Lake underwent evaporation.
Mt. Yulong, located in southern part of the Hengduan Mountains, Yunnan Province, is a typical monsoonal temperate glacier region in China. There are a large number of plateau lakes, including Lashi Lake, Chenghai Lake and Wenhai Lake, which not only provide water resources but are also important in regional water cycle and environmental research. Under a background of shrinking glacier area and increasing terminal elevation, climatic change and rapid ablation in the Mt. Yulong area affect the storage capacity and hydrologic balance of the lakes [13]. In addition, large populations living downstream of the glaciered catchment in Lijiang city, primarily rely on the snow and glacier melt water for drinking and irrigation. Accordingly, it is imperative to study the importance of regional water resources and the hydrological cycles of lakes.
Detailed studies on water bodies isotope have been carried out in Mt. Yulong region, but the studies mainly focused on precipitation, snow-ice and runoff [14,15,16]. Meanwhile, the contributions of the multitude of sources to streamflow, including snowmelt, glacier melt water, and ground water base flow, have been studied based on isotope approaches [17]; Pu et al. [18] found that differences in isotopic compositions can provide the evolutionary processes between surface water and groundwater for water bodies. However, the reports on the characteristics of the stable isotope, and hydrological processes of lake water are scare. Furthermore, understanding lake evaporation is important for interpreting isotopic records of lake sediments [19,20]. Therefore, a more detailed understanding of the hydrological processes of lakes combined with the model simulations is urgently needed.
Here we report water isotopes (δ18O and δD) in lake water and further discuss the water balance of Lashi Lake in Mt. Yulong region. The overall objectives of the paper are: (1) to analyze the spatial variations and influencing factors of δ18O and d-excess; (2) to investigate the vertical distributions of the isotopic compositions and discuss the hydrologic conditions of the lakes in the typical temperate glacier region; and (3) to quantitatively evaluate the water balance of Lashi Lake using isotope method. This study is the first comprehensive water isotope investigation and provides insight into the hydrological processes of Lashi Lake in Mt. Yulong region.
2. Study Area and Methods
2.1. Study Area
Lijiang-Yulong Snow Mountain is a typical temperate glacier region that is affected by the monsoon and multiple circulations. Two atmospheric circulations dominate the region. The southern branch of the western dry circulation from the Atlantic Ocean prevails during the dry season (from November to the following April), and the warm moist flow from the Bay of Bengal enters during the wet season (from May to October). According to historical meteorological data from 1951 to 2013, the region has an average annual relative humidity of 63%, an average annual temperature of 12.8 °C, and an average annual precipitation of 956.2 mm. Approximate 90% of the rainfall occurs during the rainy season [21]. The hydrological system in the monsoon region is characterized by a complex structure, active water cycle and other factors. Extensive lakes are distributed over the study area, including Chenghai Lake, Lashi Lake and Wenhai Lake, which are the region’s water and tourism resources and also are especially significant for water cycle and environmental studies in the region.
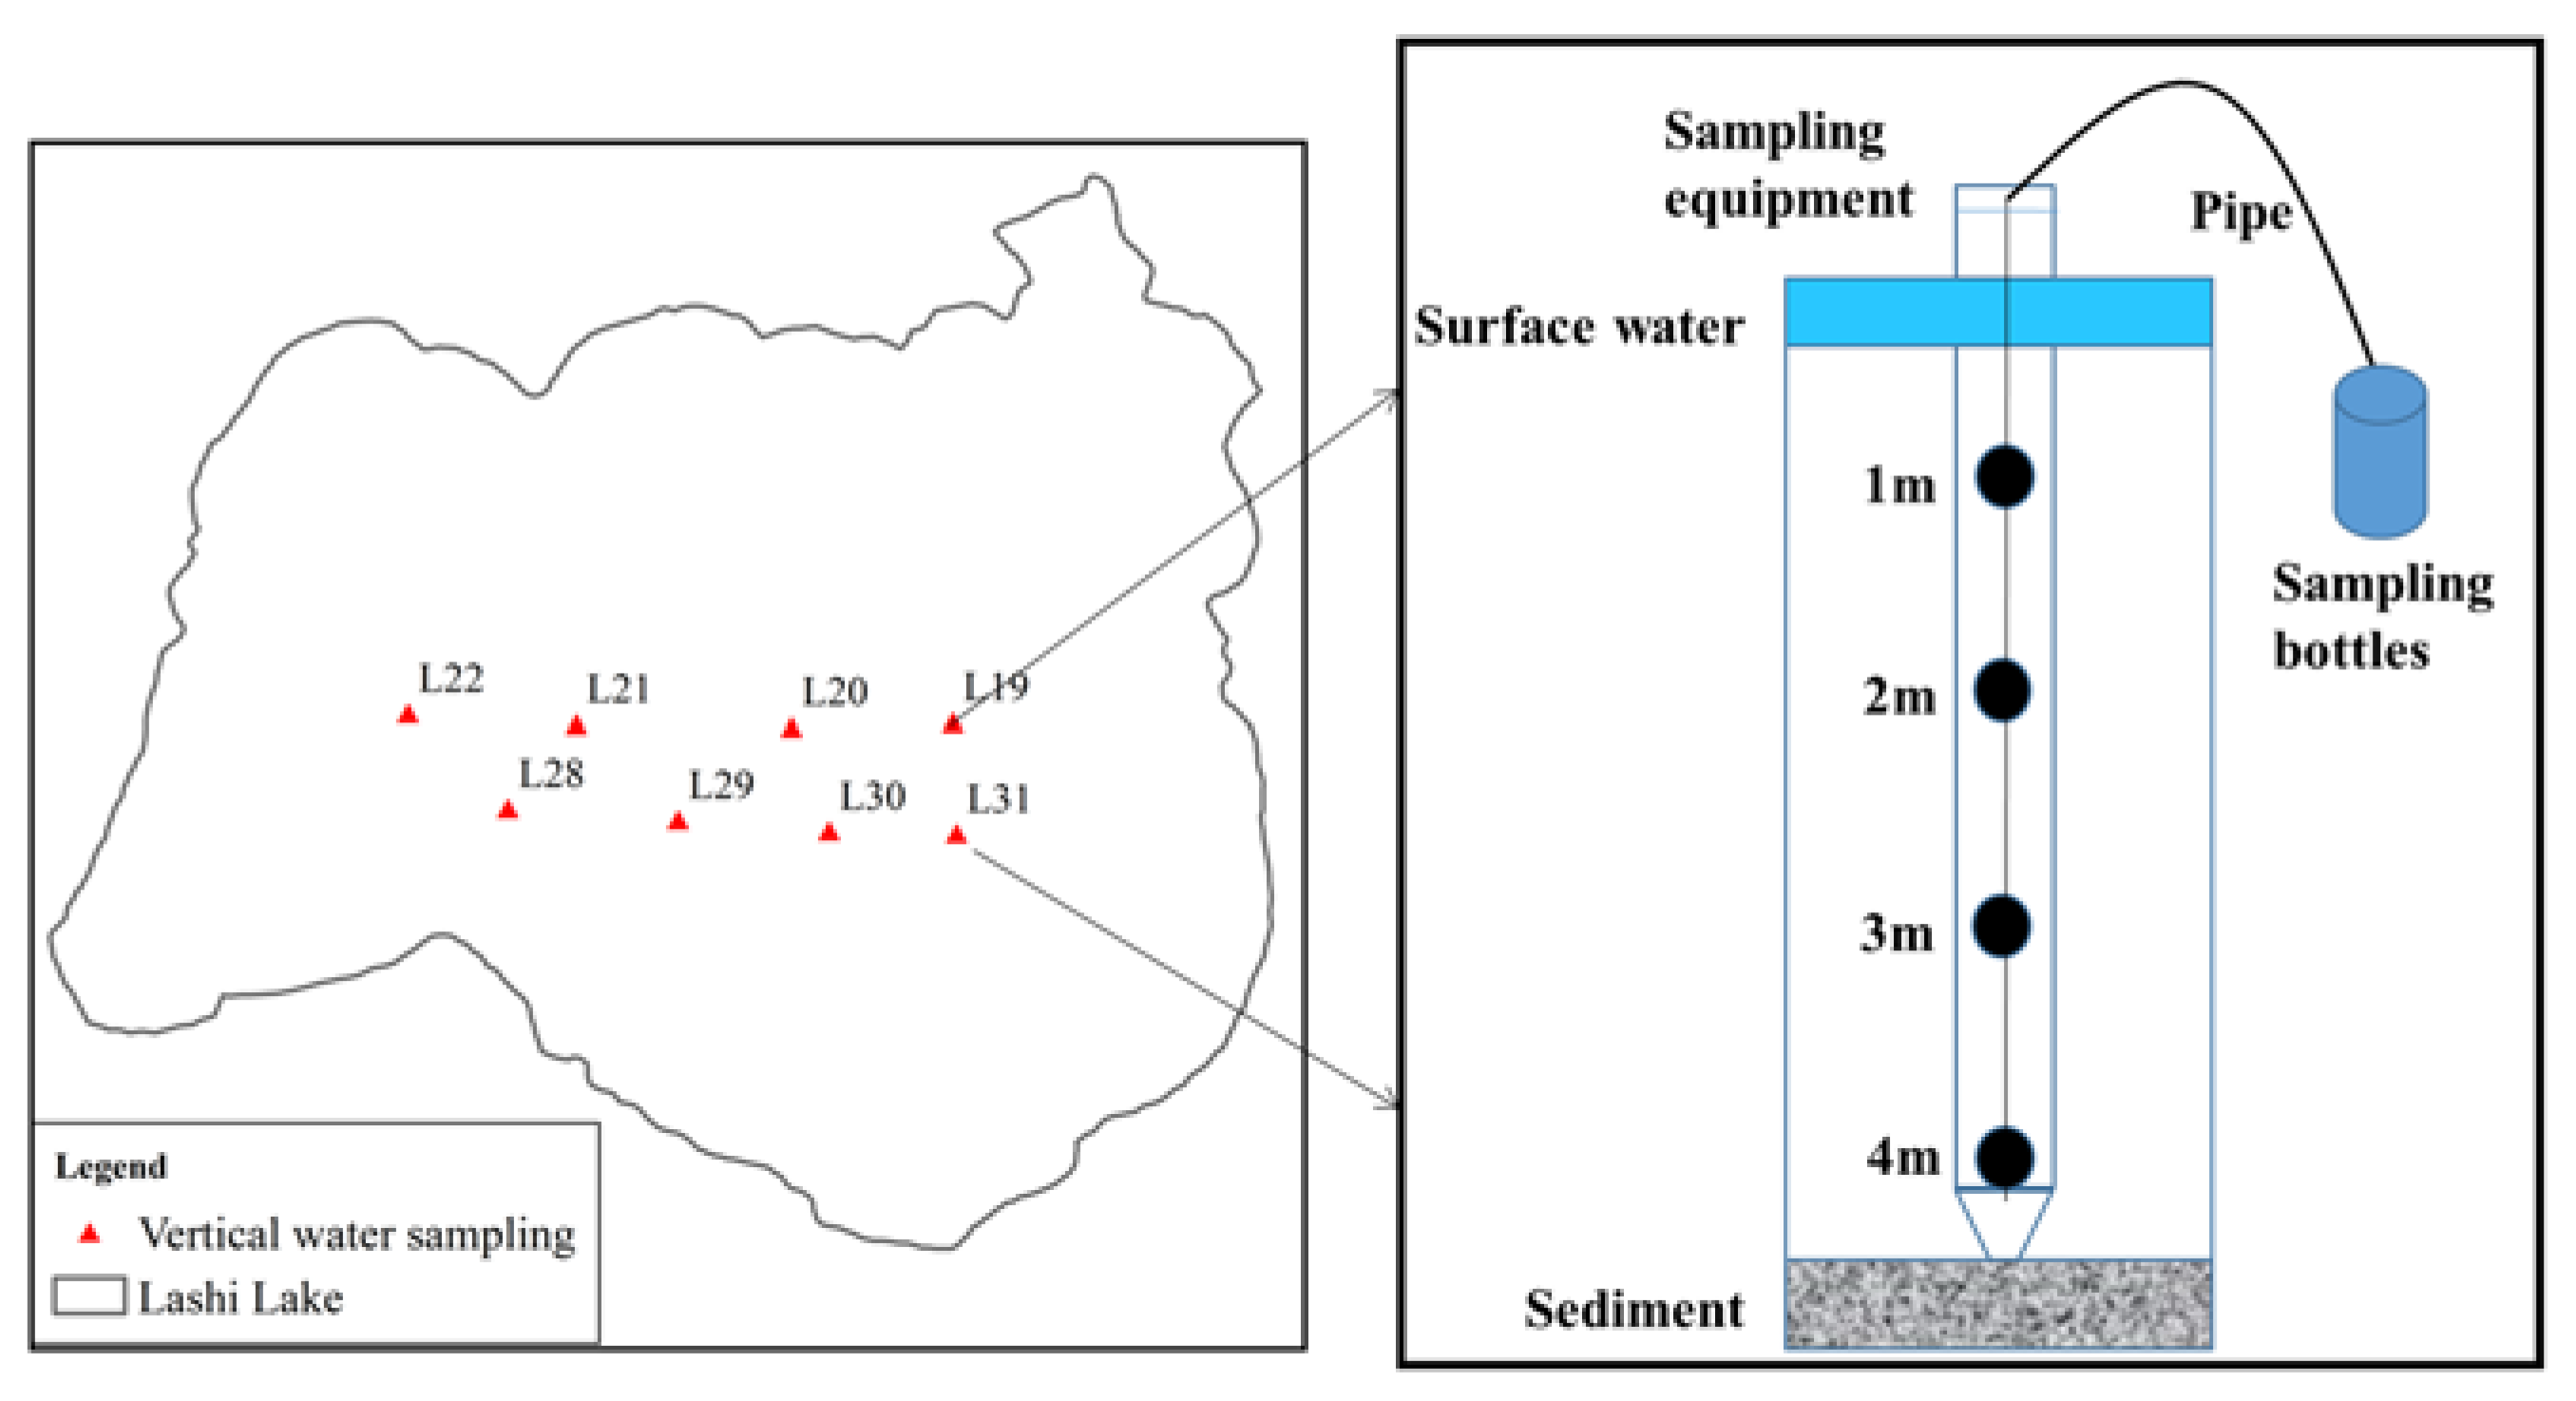
Lashi Lake (26° N, 100° E, 2437 m a.s.l.) is a plateau lake in the northwest of Yunnan Province and is also the largest freshwater lake in Yulong County. It is a glacial erosion lake developed by the faults, tectonic movements and the accumulation of sediment from glacier, river and marsh. According to the historical records, Lashi Lake covers an area of 241.1 km2 and lake water level has been declining during the flood season since 1983 [22]. Its mean water depth is 3.5 m, and the volume is 4.15 × 10⁷ m3 [23]. There was two major tributaries recharging the Lashi Lake: the Meiquan River at the northern part of Lake and the Qingshui River at the southern part of Lake (Figure 1). Abundant plant species (dominated by the emerged plant communities and submerged plant communities) are distributed around the lake.
2.2. Methods
2.2.1. Data Collection
During our sampling campaign between 2014 and 2015 in the Lashi basin, various water bodies including surface and vertical profile lake water samples, precipitation, snowmelt water and river water were collected (Table 1). 56 surface lake water samples were collected at regularly spaced sampling intervals in August 2014. Among them, 17 points taken along two cross-sections were selected for the depth profiles (the first cross-section included eight profiles L16–L23, and the second included nine profiles L25–L33) (Figure 2). The samplings interval was one meter from surface to the bottom of the Lashi Lake. In April 2015, 34 surface water samples were taken, of which 14 were used to obtain deep-water samples with the same methods as in 2014. The sampling site locations were acquired by GPS (global positioning system). Precipitation samples were collected during every rainwater event between June and September 2014 at Lijiang city on the east of Lashi Lake. Snowmelt samples were sampled on Baishui glacier No.1 in Yulong Snow Mountain. River water was collected during the lake water sampling period. In addition, river water samples were added in 2017.
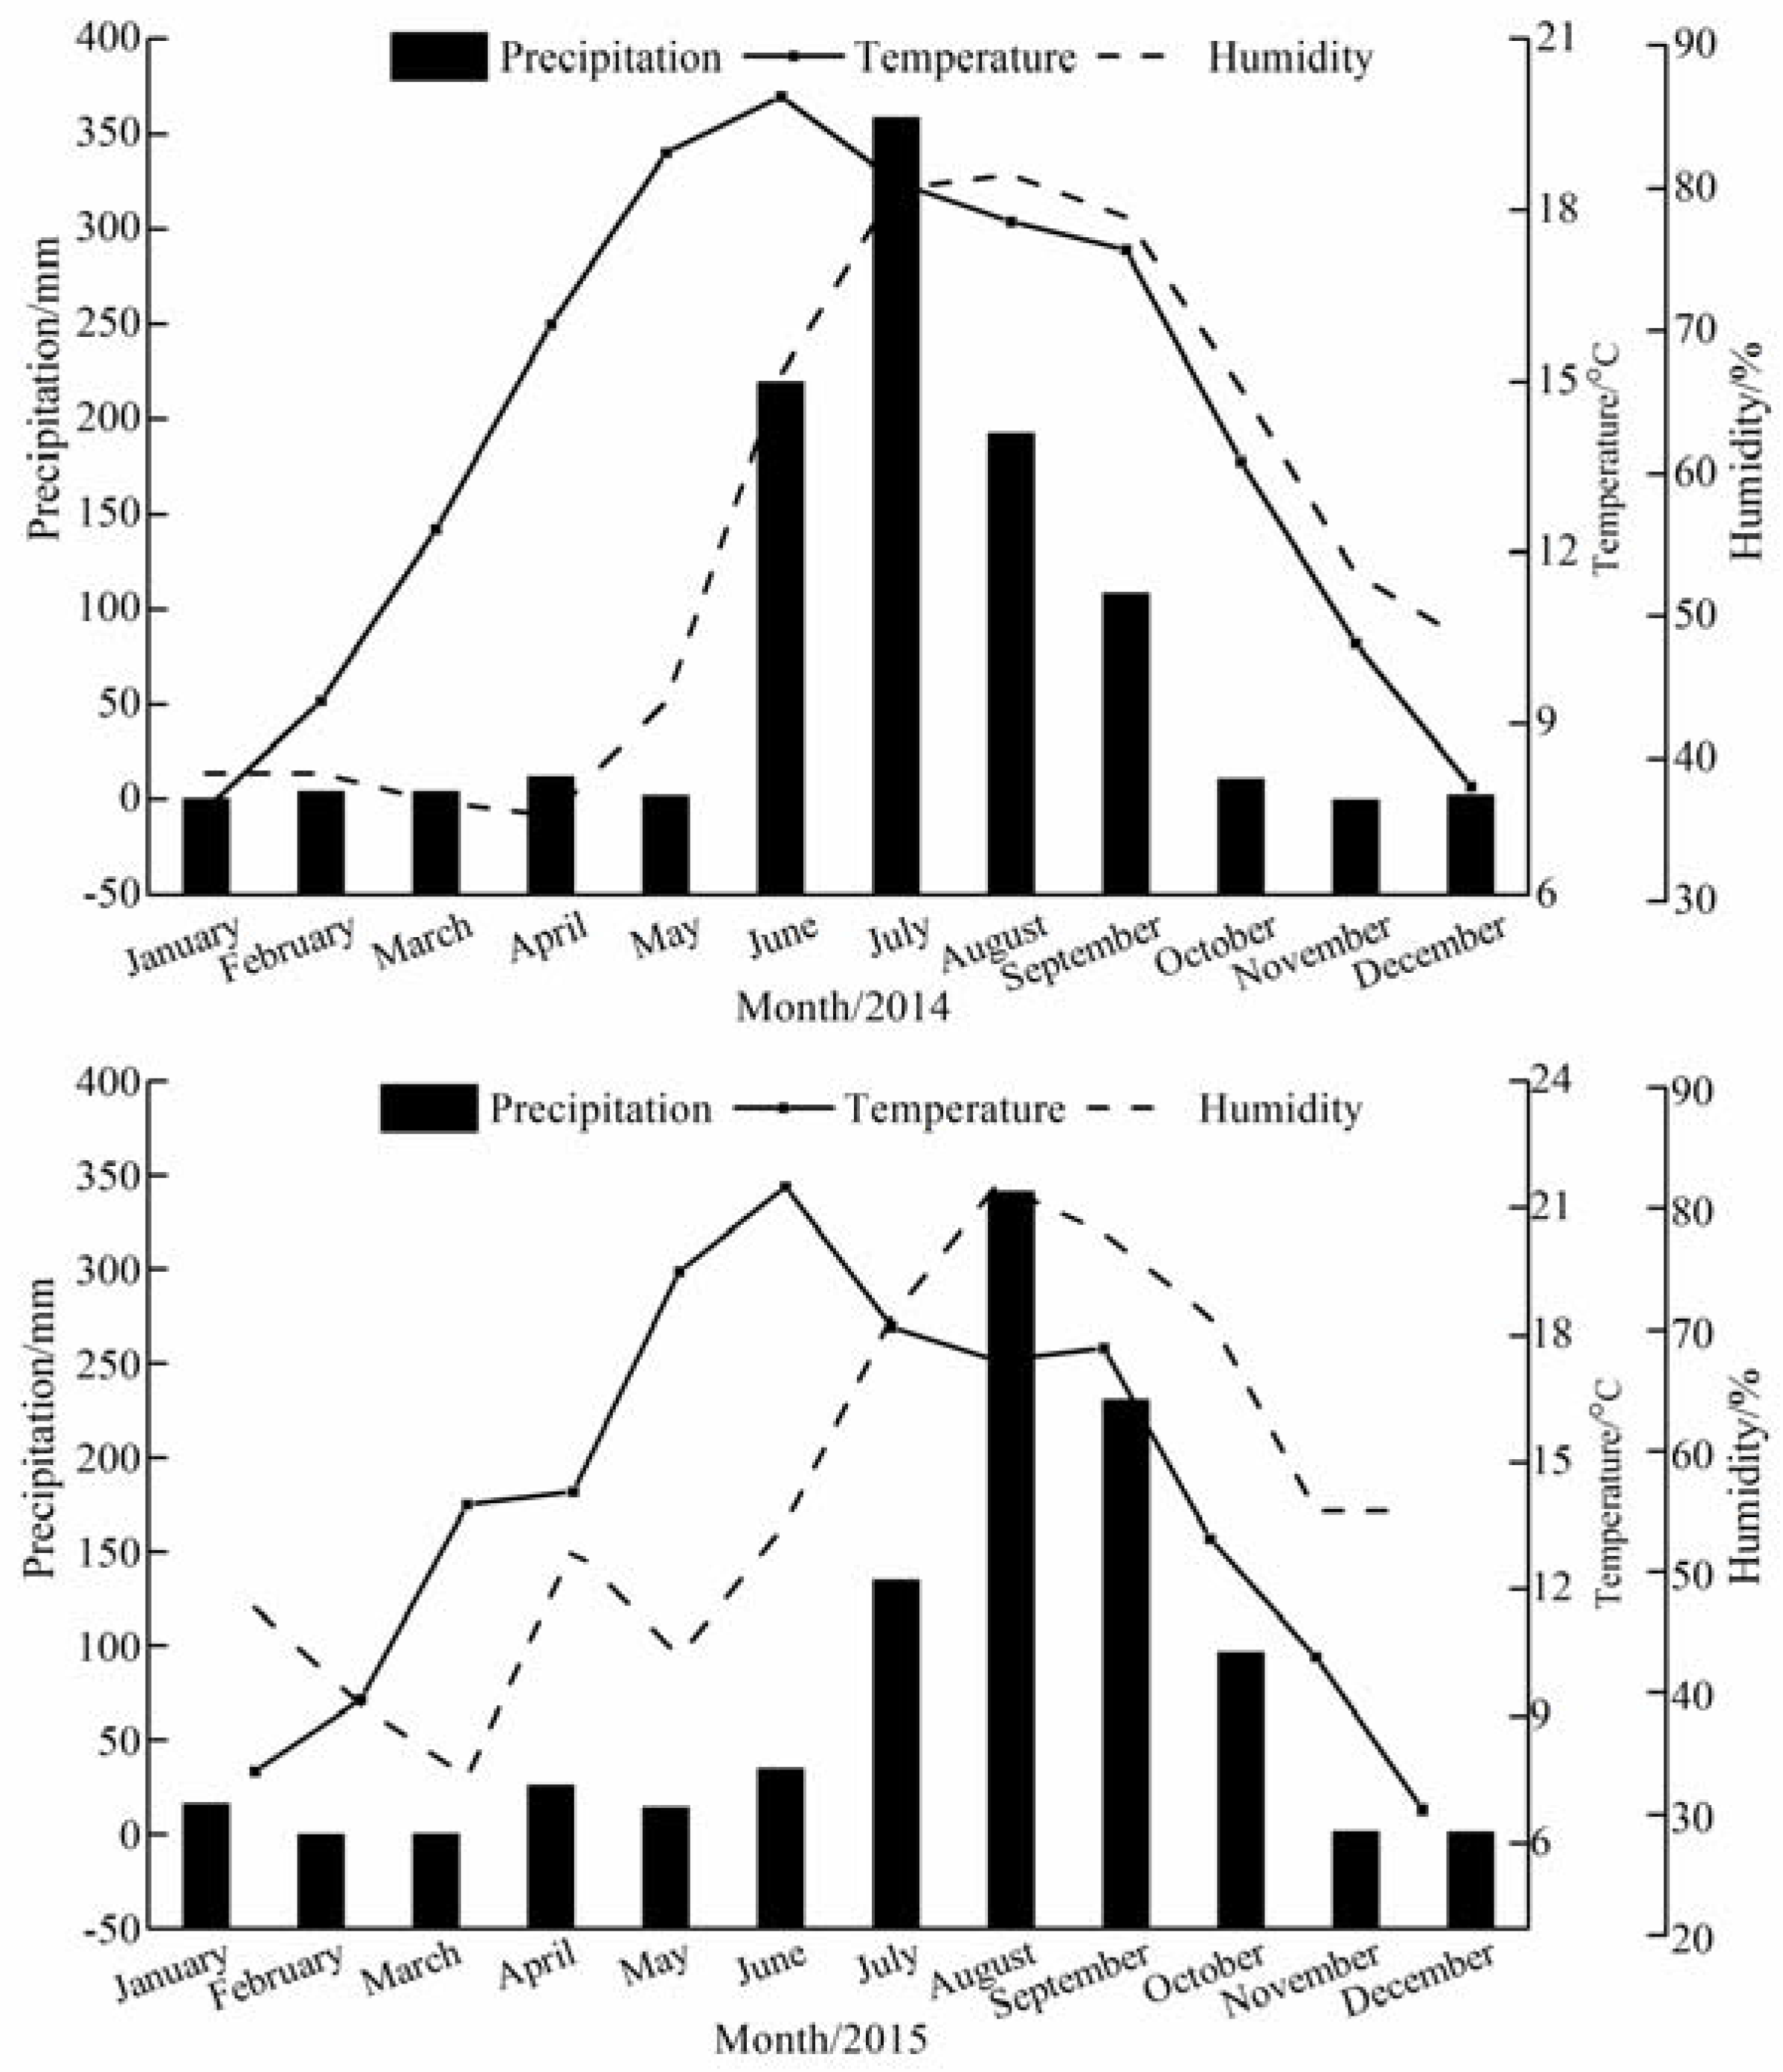
Mean monthly air temperature, relative humidity and precipitation data were obtained from the Lijiang Weather Station, which is located in the Lijiang basin. The temperature varied from 17.8 °C in August to 14.3 °C in April, and the relative humidity varied from approximately 81% in August during the summer monsoon period to approximately 52% in April during the pre−monsoon period (Figure 3).
The water samples were collected in 100 mL high-density polyethylene bottles and transported to the Key Laboratory of Western China’s Environmental Systems, Lanzhou University, for the stable isotope determination. The oxygen and hydrogen isotope compositions were analyzed using a Picarro L2130-I water isotope analyzer made in American Picarro Corporation (Santa Clara, CA 95054, USA), Wavelength-Scanned Cavity Ring Down Spectroscopy (WS-CRDS) system. Values were reported using the standard δ notation relative to the V-SMOW (Vienna Standard Mean Ocean Water). The levels of precision for δ18O and δD were ±0.025‰ and ±0.1‰, respectively.
2.2.2. Isotope-Mass Balance Model
Lake water isotopes represent a balance between inflow water isotopes and isotope fractionation via surface water evaporation, including equilibrium fractionation and kinetic fractionation. Here, we used a model to quantitatively estimate the lake water budge components using an isotope method based on mass-balance considerations. In the model, we assume that the lake is at hydrological and isotopic steady states. On the basis of the mass balance of water and isotope, the equations from Gibson and Edwards [5] are written respectively as:
where I is the total inflow, Q is the outflow, E is the evaporation, and δI, δQ and δE represent the isotopic compositions of the inflow, outflow and evaporation flux, respectively. Physical outflow does not cause isotopic fractionation, and outflow therefore is isotopically equal to the lake water values, i.e., δQ = δL [24]. By combining Equations (1) and (2), the evaporation-to-inflow ratio (E/I) can be expressed using the isotopic compositions of each water budget component:
where the lake water isotopic composition δL is known, and the isotope values of the inflows δI are calculated in the discussion section. The isotopic composition of the instantaneous net evaporation flux (δE) is outlined based on the linear resistance model put forth by Craig and Gordon [25]. The simplified relation is given as
where α* is the equilibrium fractionation factor between the vapor-liquid interface under the corresponding temperature condition, h is the relative humidity normalized to the temperature of the air-water interface, δA is the isotopic composition of the atmospheric moisture, and ε* and εK are equilibrium and kinetic enrichment factors, respectively.
I = Q + E
I × δI = Q × δQ + E × δE
The kinetic enrichment factor εK is only a function of relative humidity, and may be calculated using for oxygen and hydrogen as [26]
where the experimentally determined CK values of 14.2‰ for oxygen and 12.5‰ for hydrogen are used as representatives of typical lake evaporation conditions [27,28].
The equilibrium enrichment factor ε* is related to a*:
The equilibrium isotopic fractionation factors a* for oxygen and hydrogen, which are related to the temperature, have been proposed by Horita and Wesolowsk [29]. They can be expressed as
where T is the absolute temperature.
3. Results
3.1. Seasonal Variability of δ18O and d-excess in the Lake Surface Water
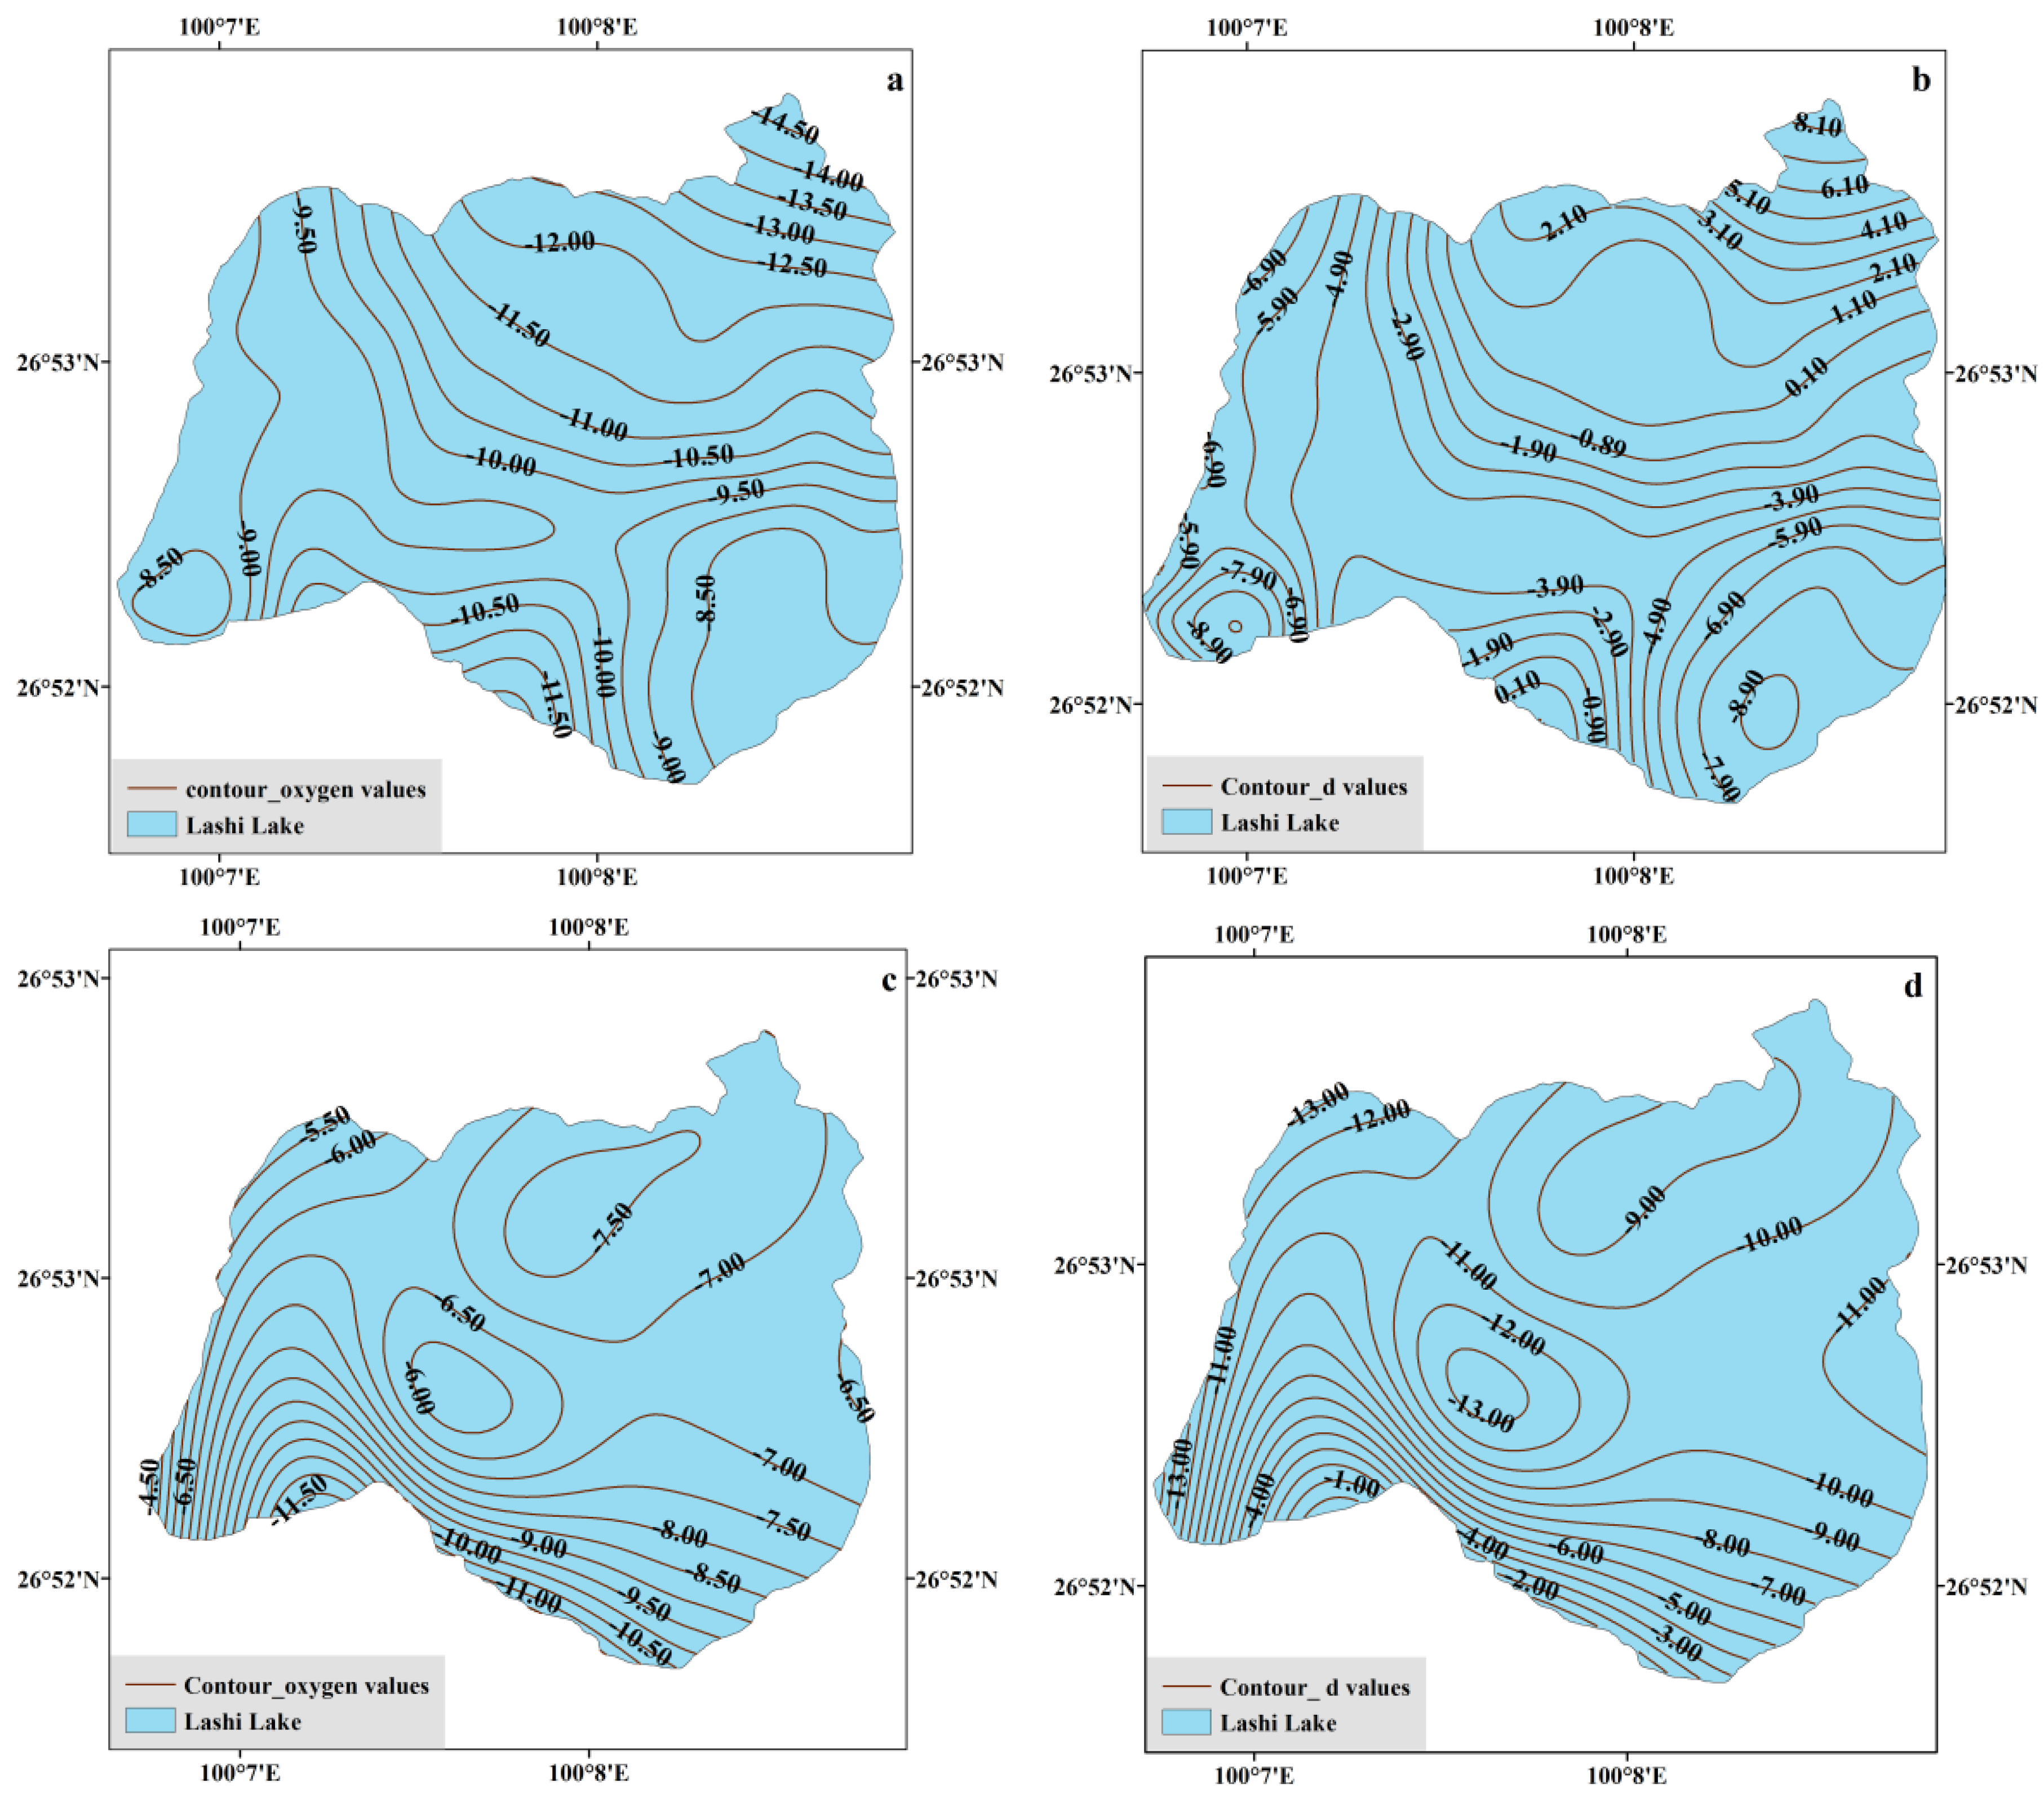
The compositions of the lake surface water sampled in August spanned a range of δ18O (−12.98‰ to −8.16‰) and d-excess (−9.14‰ to 4.43‰). The average δ18O and d-excess values of the lake water were −9.75‰ and −4.23‰, respectively. Figure 4 illustrated contoured variations in the oxygen isotope and d-excess compositions for the near-surface lake water. The δ18O and d-excess values of the surface lake water showed revised spatial variations (Figure 4). The higher δ18O values with lower d-excess values were found on the east and west shore of Lake. There were lowest δ18O (−14.50‰) with highest d-excess (8.10‰) values in the entrance where river water flowed into the lake. Lake water gradually enriched 18O from northeastern shore to the middle (−10.00‰) of the lake, and then became progressive depletion in 18O in August. This phenomenon was related to the river distribution around the lake. Meiquan River on the north shore and Qingshui River on the south shore (Figure 1) were major tributaries recharging to Lashi Lake. The mean δ18O value in Meiquan River was −13.22‰, while the mean δ18O value in Qingshui River was −11.65‰ in April 2017 (Table 1). Therefore, the different δ18O value of river water resulted in the isotopic variability trend.
The values of the surface lake water were relatively enriched in 18O in April. The δ18O values ranged from −9.95‰ to −6.88‰, with an average of −7.42‰, and the d-excess values ranged from −10.30‰ to −3.77‰, with an average of −9.28‰. The isotopic spatial distribution had a distinct characteristic compared to that of August. Relative higher δ18O values with d-excess were observed in the middle part of the lake, indicating that in the water circulation process the surface waters flowed from the entrance to the middle part of the lake and were ultimately evaporated there, which was similar to the lake studied by Zang et al. [31]. The lowest δ18O were found in the southern shore where distributed by the Qingshui River.
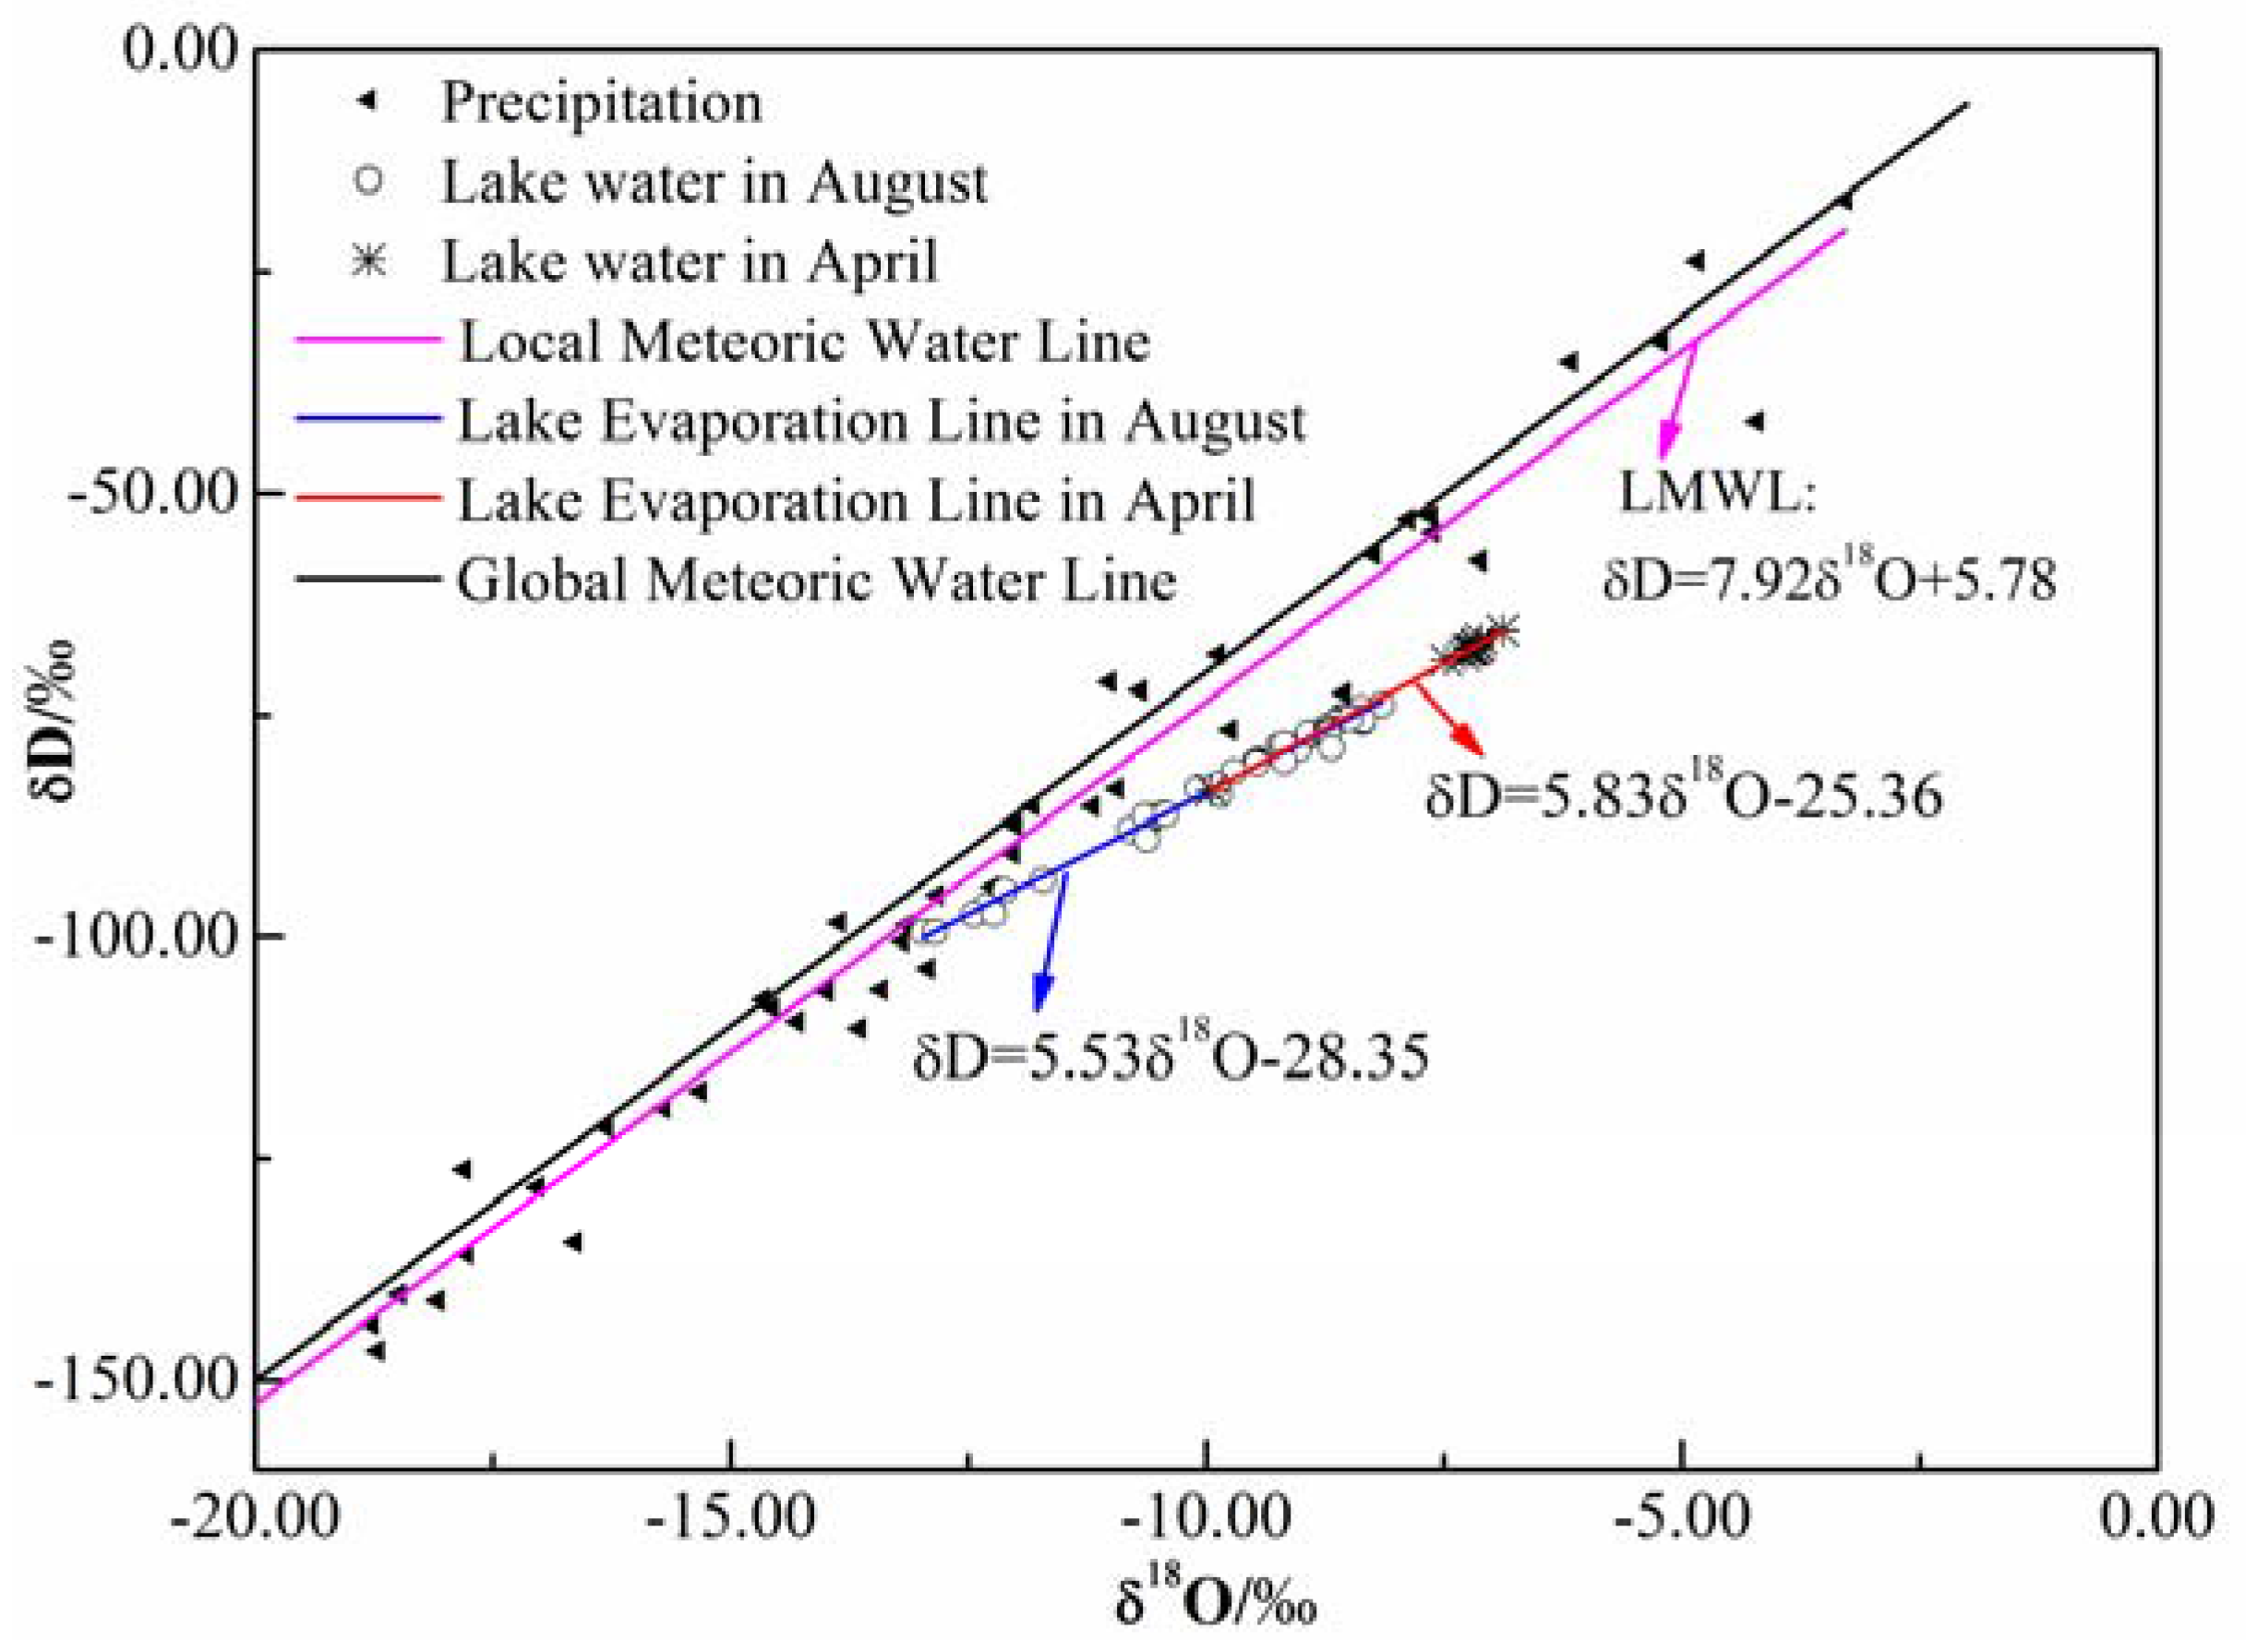
The average values for δ18O for August and April were ‒9.75‰ and ‒7.42‰, with standard deviation of 1.36‰ and 0.81‰, respectively. The result showed that the isotopic variability of the lake water were relatively stable in April. Both the precipitation and lake water isotopes showed high correlations between the δ18O and δD values during August and April (Figure 5). Local Meteoric Water Line (LMWL) was developed based hydrogen and oxygen composition of rainfall in June to September 2014 (δD = 7.92δ18O + 5.78, R2 = 0.99), the slope of 7.92 was close to that of Global Meteoric Water Line (GMWL). The relation line of lake water was δD = 5.53δ18O − 28.35 in August (R2 = 0.99) and δD = 5.83δ18O − 25.36 in April (R2 = 0.99). Figure 5 showed that all δ18O and δD values of lake water deviate from LMWL, indicating that lake water isotope may be affected by the evaporation enrichment.
To further determine the evaporation effect of surface lake water, we calculated deuterium excess (d-excess) as an index of how much evaporation had affected the isotopic value of each surface water sample using the following equation [32]: d-excess = δD − 8δ18O. The d-excess value indicated the influence of kinetic fractionation (evaporation) compared to the equilibrium fractionation on the water isotopic ratios. However, there continued to be few applications of d-excess values to lake water cycles relative to applications of δ18O [33]. In terrestrial environments, surface water with d-excess < 10 was presumed to have undergone some evaporation [34]. The d-excess values of surface lake water had an average of −4.23‰ and −7.11‰ in August and April, respectively, which suggested that the lake water underwent evaporation.
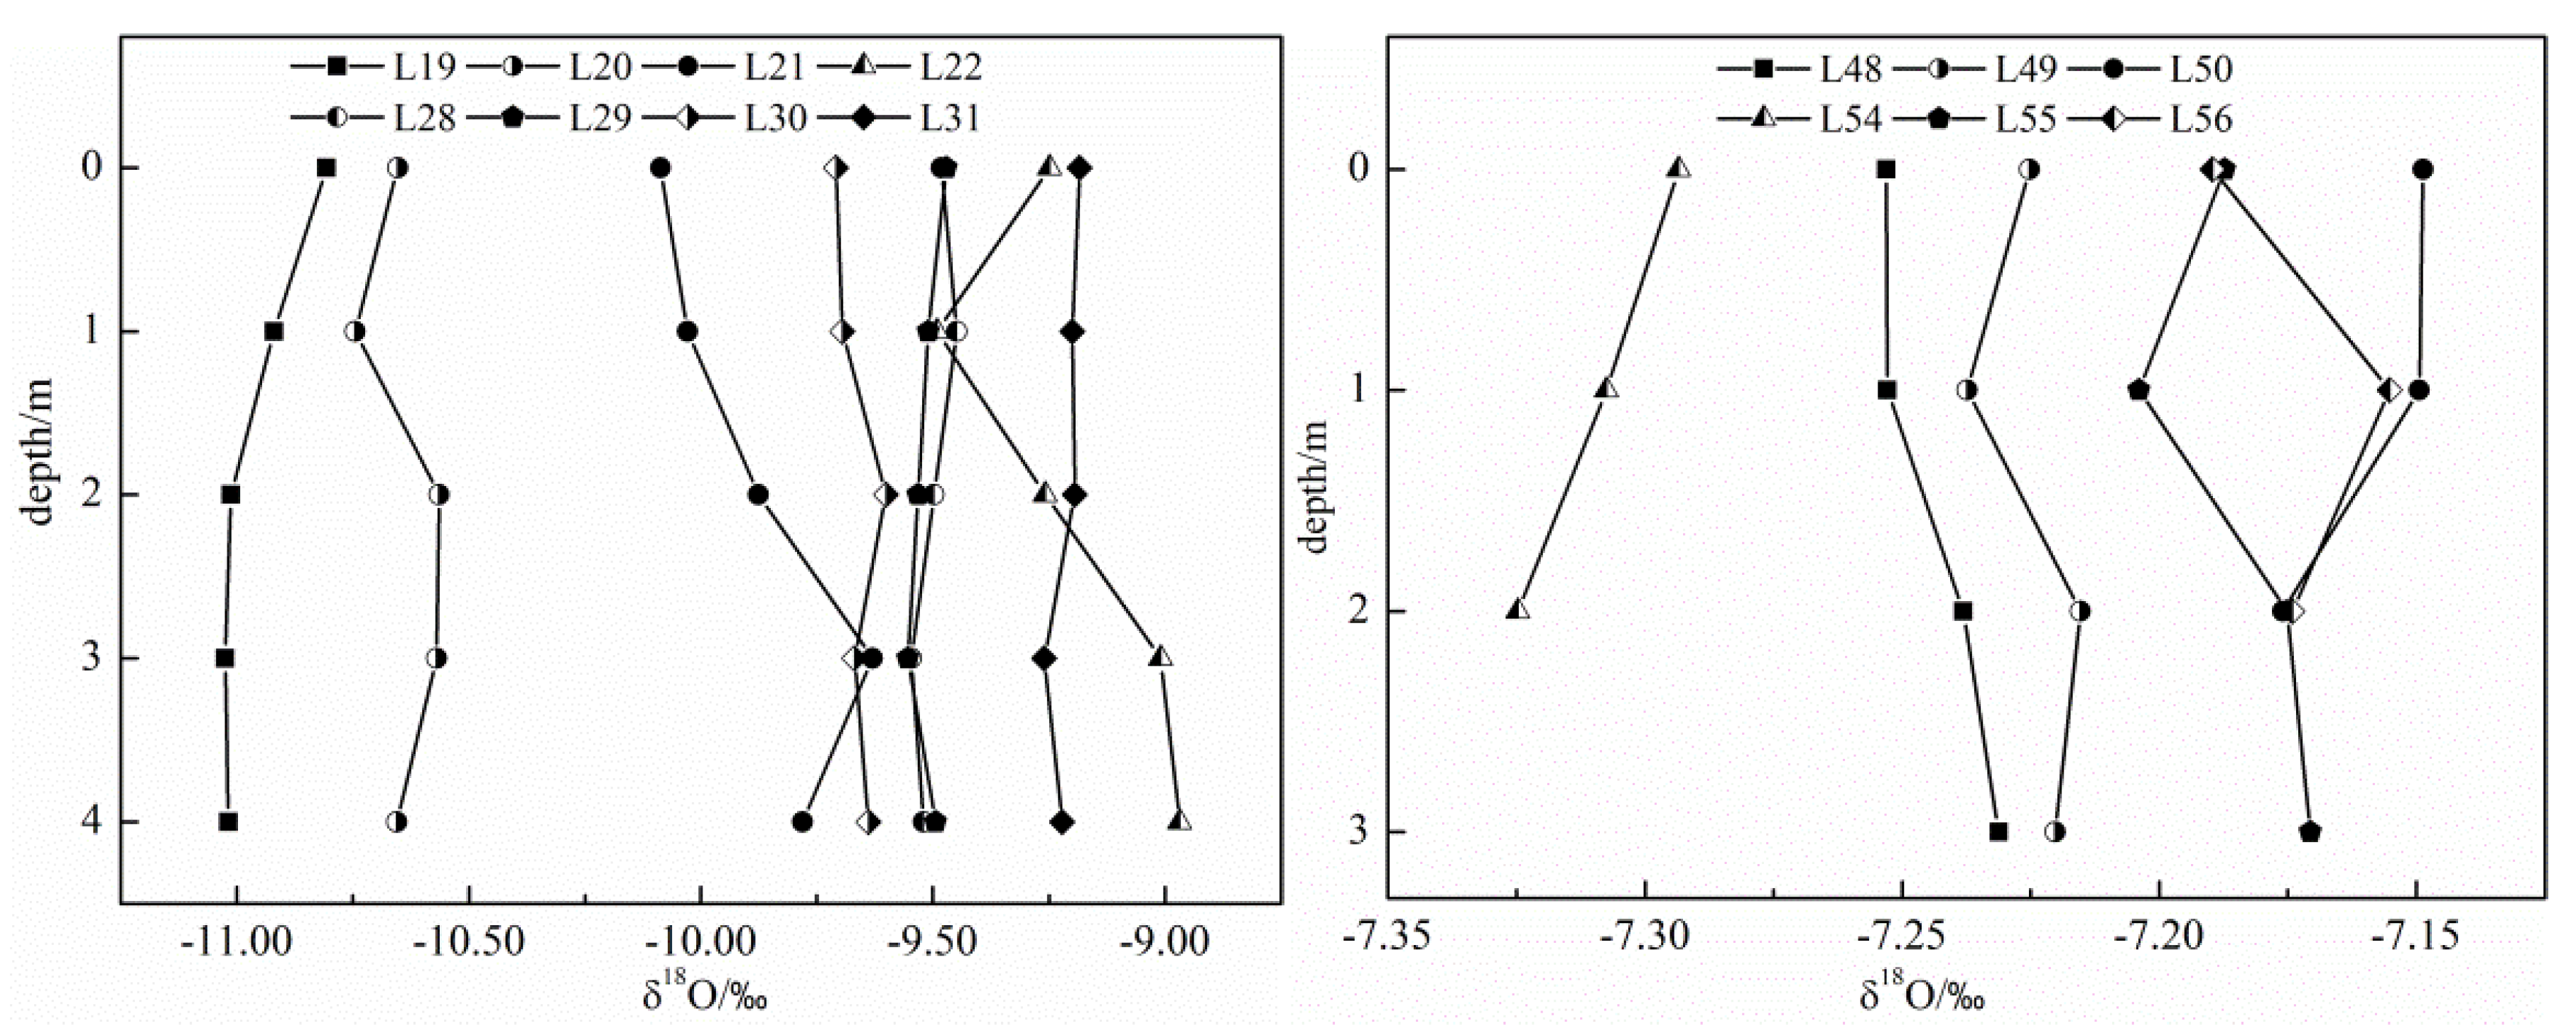
3.2. Spatial Variability of δ18O and d-excess in the Vertical Profiles
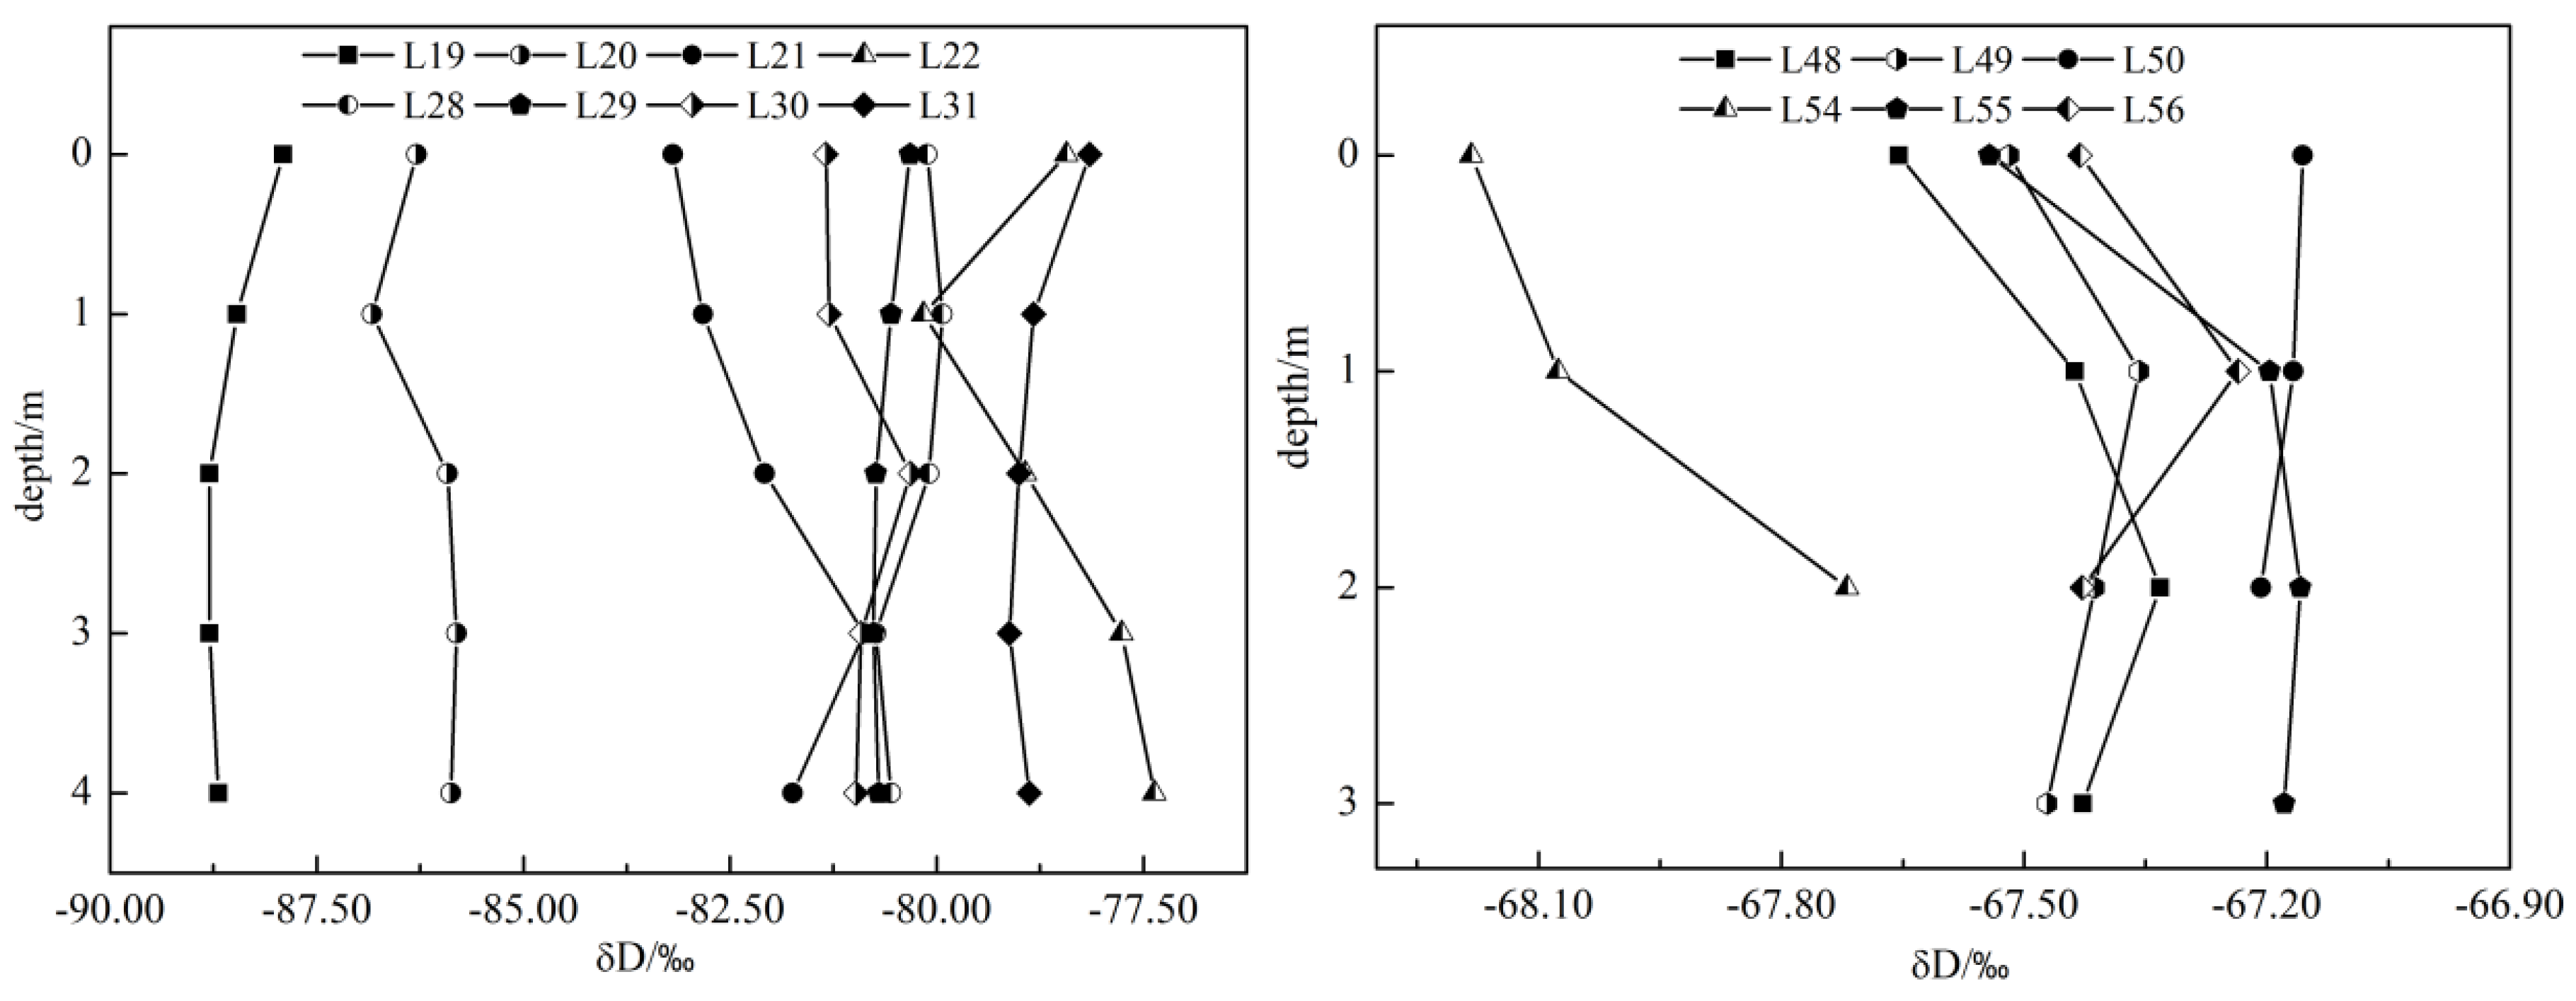
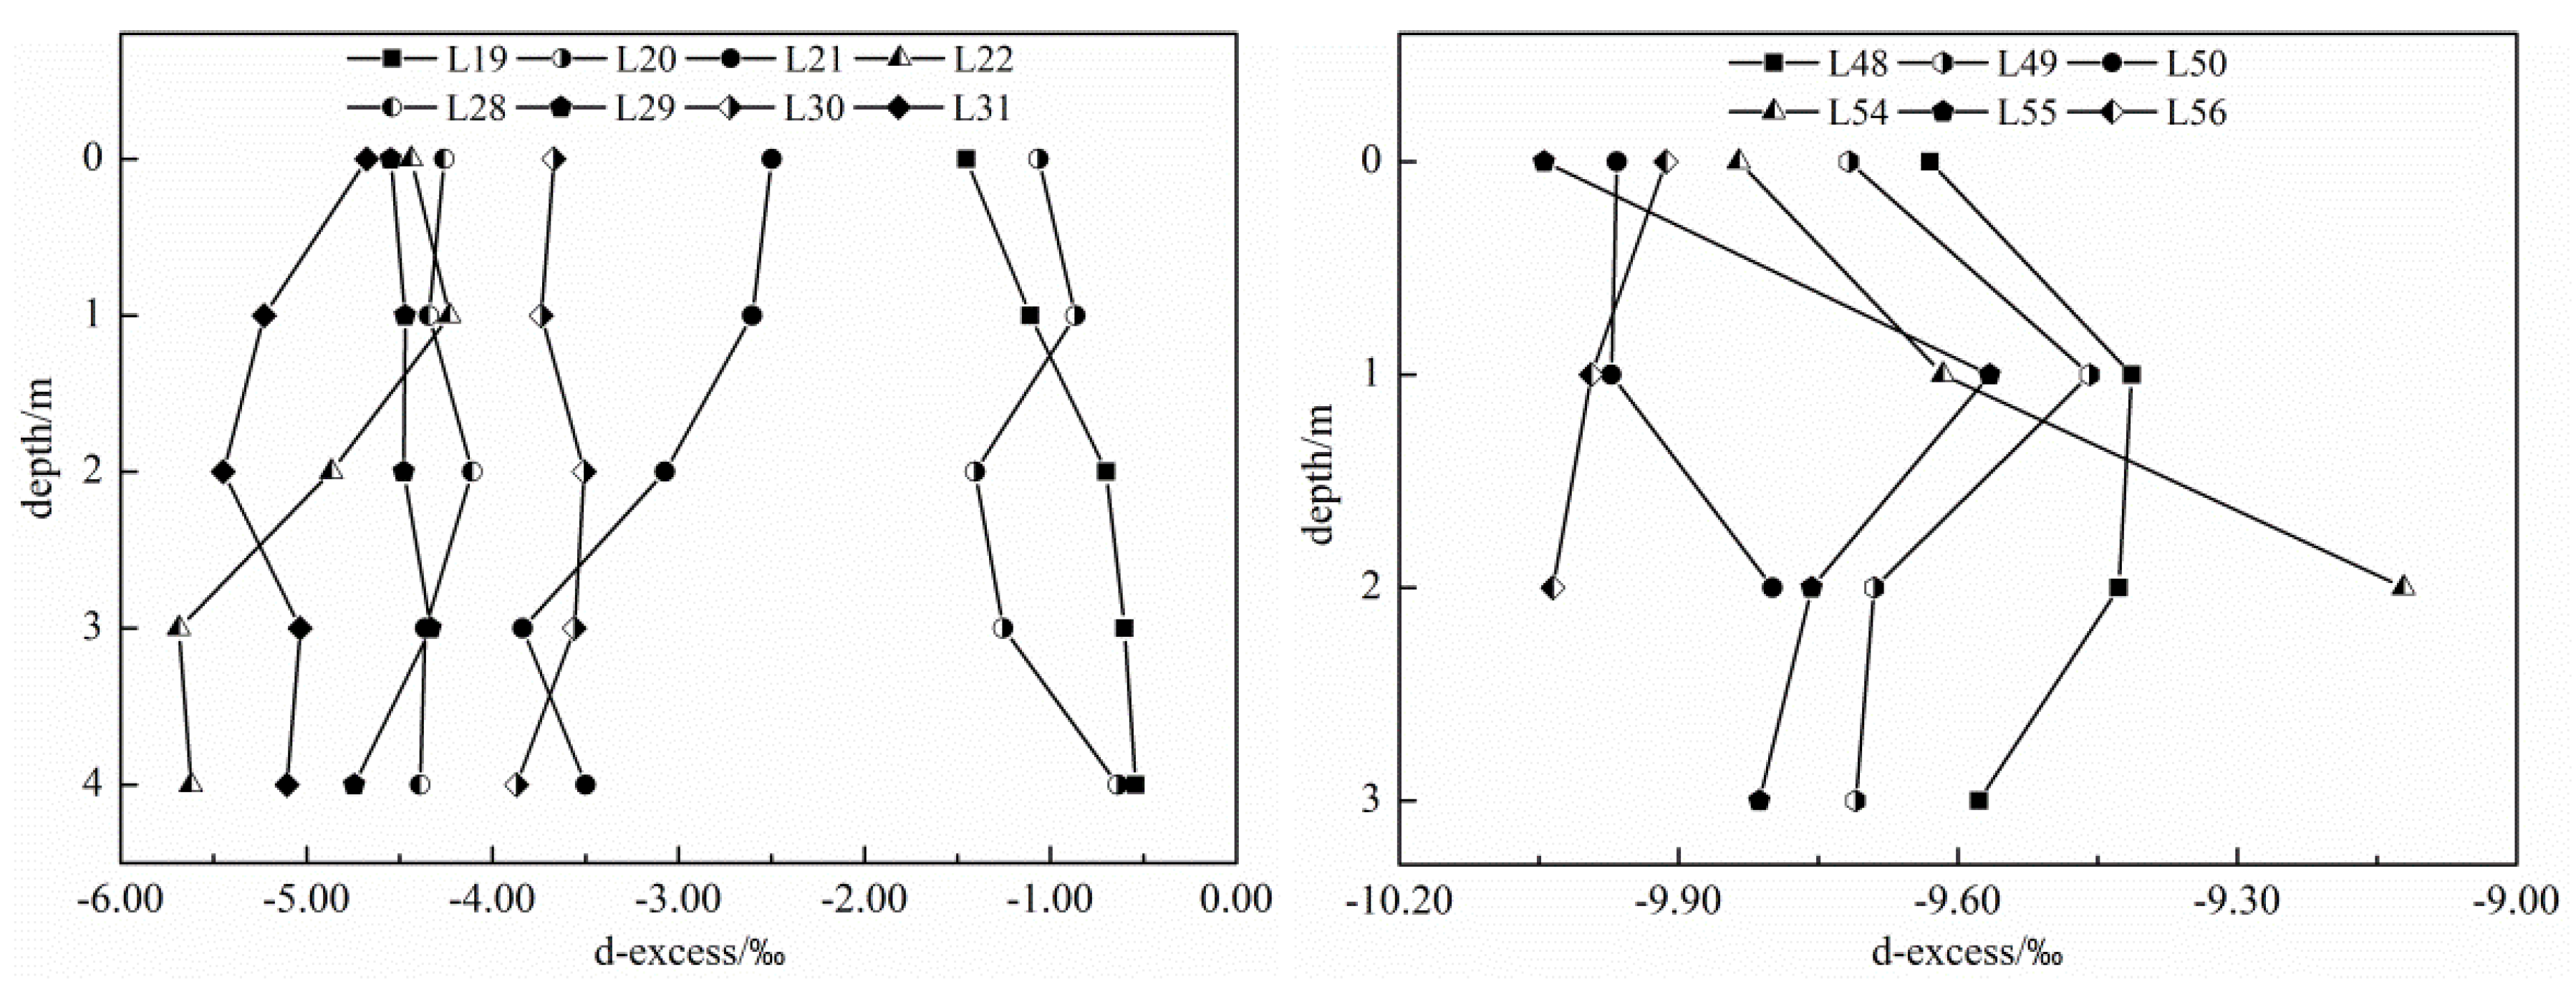
The isotopic compositions of the vertical profiles in the lake water ranged from ‒11.0‰ to ‒8.3‰ for δ18O (-88.8‰ to ‒77.4‰ for δD), with a mean value of −9.6‰ for δ18O (-82.0‰ for δD), whereas d-excess fluctuated from ‒9.25‰ to -0.54‰, with a mean value of ‒4.15‰ in August. The isotopic compositions ranged from ‒7.32‰ to ‒7.15‰ for δ18O (-68.2‰ to ‒67.2 for δD), with a mean value of ‒7.22‰ for δ18O (−67.4‰ for δD) in April, whereas the d-excess value fluctuated from ‒10.04‰ to ‒9.12‰, with a mean value of ‒9.72‰. As summarized in Table 2, the isotopic standard deviation of all profiles in August was higher than that of April. The fluctuations were extremely stable in April (0.00‰, 0.08‰, and 0.11‰ for δ18O, δD and d-excess) compared to August (0.07‰, 0.31‰, and 0.20‰ for δ18O, δD and d-excess). This indicated that the lake was in a relatively steady hydrological state in April. To further determine the isotopic stratification, the depth profiles in the lake were also analyzed (Figure 6, Figure 7 and Figure 8). Figure 6, Figure 7 and Figure 8 illustrated that the lake water was mixed-well in both August and April. Interestingly, the water isotopes had a progressively stabilized process as depth continued to increase until the bottom of lake, which was similar to that of Lake Garda studied by Longinelli et al. [35]. Lake Garda had no real isotopic stratification, particularly during summer (June to October). However, Halder et al. [36] suggested that the profiles had an obvious isotopic stratification; all the profiles taken during the summer months had a progressive depletion in 18O with depth, which reached minimum values in the middle of the water column, and then became increasingly enriched in 18O as depth continued to increase. This phenomenon was probably affected by many factors, including topography, climate factors (e.g., wind speed and precipitation) and the complex hydrological regime. In total, the profiles were relatively homogeneous under the different water supply conditions both in August and April; the phenomenon accompanied by additional influencing factors needs to be further studied.
3.3. Evaluation of E/I Ratios
The E/Is during the period August 2014 to April 2015 were separately calculated based on the oxygen and hydrogen isotope values of each of the hydrological elements (namely, ‘Method-δ18O’and ‘Method-δD’ in Table 3) using Equation (3). The calculated E/Is were 0.478 and 0.549 in Lashi Lake in August using Method-δ18O and Method-δD, respectively, with a relative error of 14.9%. Whereas the E/I ratios for April were 0.117 and 0.118 by Method-δ18O and Method-δD in April, with a relative error of 0.9%. The consistency of the Method-δ18O and Method-δD results indicated the reliability of the calculation process and accuracy of the modeling simulation.
4. Discussions
4.1. Sources Identification in Lashi Lake
Isotopic compositions of lake water sampled in August 2014 and April 2015 showed similar linear trends offset from the LMWL in δ18O-δD space but different distribution patterns (Figure 5). The isotope distribution in April was much sparser than that of August. Lake water isotope compositions were concentrated on the scope (-9.95‰ to ‒6.88‰ in δ18O) in April, which had more enrichment than August (‒12.98‰ to ‒8.16‰ in δ18O).
Rainfall, river water and snowmelt may be water sources to the lakes in the glaciered catchment. These different types of source waters showed distinct isotopic signatures based on the sampling of rain, river water and snowmelt from 2011 to 2015. The isotopic composition of rain, which was collected from June to September 2014, ranged from ‒27.99‰ to ‒3.28‰ for δ18O (-216.1‰ to ‒16.8‰ for δD), whereas the isotopic composition of snowmelt ranged from −8.60‰ to ‒3.98‰ for δ18O (-49.10‰ to ‒16.20‰ for δD) (sampled in May 2015). Although a slightly wide range of isotopic compositions were obtained for rain and snow, the isotopic composition of river water ranged from −13.90‰ to −12.81‰ for δ18O (‒103.4‰ to ‒97.03‰ for δD) (Table 1).
The relative influence of the main water source to lakes could be evaluated by comparing the isotopic compositions. Based on mixing, lake water with a high proportion of snowmelt would tend to be more isotopically enriched than lake water composed of a high proportion of rainfall [37]. Therefore, a lake with a higher δ18O value, within the isotopic range of snowmelt, would suggest that snowmelt played an important role in the lake’s water budget, whereas relatively lower δ18O values would suggest a greater proportion of rainfall contributing to the lake. Table 1 presented the lake inputs dominated by the two main sources of water in April (snowmelt and river water). The result was the same as that reported by Fan [38]. Lashi Lake may be fed by the snowmelt water from the south of Yulong Snow Mountain. Additionally, Pu et al. [21] have proven that the mutual supply rate between river water and groundwater was faster in the background of karst landform; the δ18O value had a small change during the process. Therefore, the groundwater may be the water source for Lashi Lake. In general, locally accumulated winter snowpack in Yulong Snow Mountain provided substantial isotopically-enriched snowmelt runoff to the lake during spring snowmelt. Whereas the δ18O value for August was relatively isotopically enriched than its primary source composed of rainfall and river water (the mean value was ‒12.98‰ and ‒13.22‰ collected in June and August, 2014). It was mainly affected by the evaporation.
4.2. Sensitivity Analysis of Isotope-Mass Balance Model
The variables and parameters used in the computations were listed in Table 4. δE depended on δL, δA, ε*, a* and εK. The errors in the determination of these variables would be connected to the estimated isotopic composition of lake evaporates. In the case of a well-mixed lake, the spatial variation of δL may not be significant. Therefore, the analytical errors for isotope ratios were of the order of 0.01‰, which may be taken as the error in δL. Among these main variables, the ε* and α* were temperature dependent, and εK was humidity dependent. In-situ the water temperature measurements were lacking, so the error would be induced due to the water temperature being replaced by air temperature [21]. Water temperatures here were higher (4–5 °C) than air temperatures, and consequently the E/I ratios here were underestimated by approximately 0.017 for δ18O and 0.080 for δD in August and approximately 0.001 for δ18O and 0.004 for δD in April. The underestimation would be significant in climates where the differences in the air and water temperatures were large.
A sensitivity analysis was not ignored here because of the input water isotope composition (δI) estimated by the intersection between LMWL and LEL. The oxygen isotopic compositions of the inflowing water (δI) derived from the LMWL-LEL intersection (−14.42‰, August 2014; −15.18‰, April 2015) were slightly more depleted than the average δ18O value (−13.25‰, 26 April 2015; −13.75‰, 29 November 2014; −13.22‰, 7 June 2014) for the surface river water inlets and for precipitation (−12.98‰, from 6 June to 1 September 2014). Therefore, to accurately evaluate the influences of the inflowing water isotopes on the lake water isotopes, the implementation of long-term field observations was urgent.
A more common approach for evaluating the isotopic composition of atmospheric water vapor (δA) relies on the assumption that the isotopic composition of local rainfall is in isotopic equilibrium with local atmospheric moisture. Field measurements have shown that this assumption was valid for temperate climates [27]. Based on the assumption, the atmospheric water vapor (δA) was estimated in this study. In addition, as illustrated in Figure 8, δA was expected to lie to the left and below of the LMWL. Due to a lack of measured data, the influence of this assumption on the E/I ratio could not be quantitatively evaluated. However, more recently, the major source of uncertainty in E/I ratio estimation was the atmospheric water vapor isotope and direct measurement in the field was the most accurate method to determine δA [39].
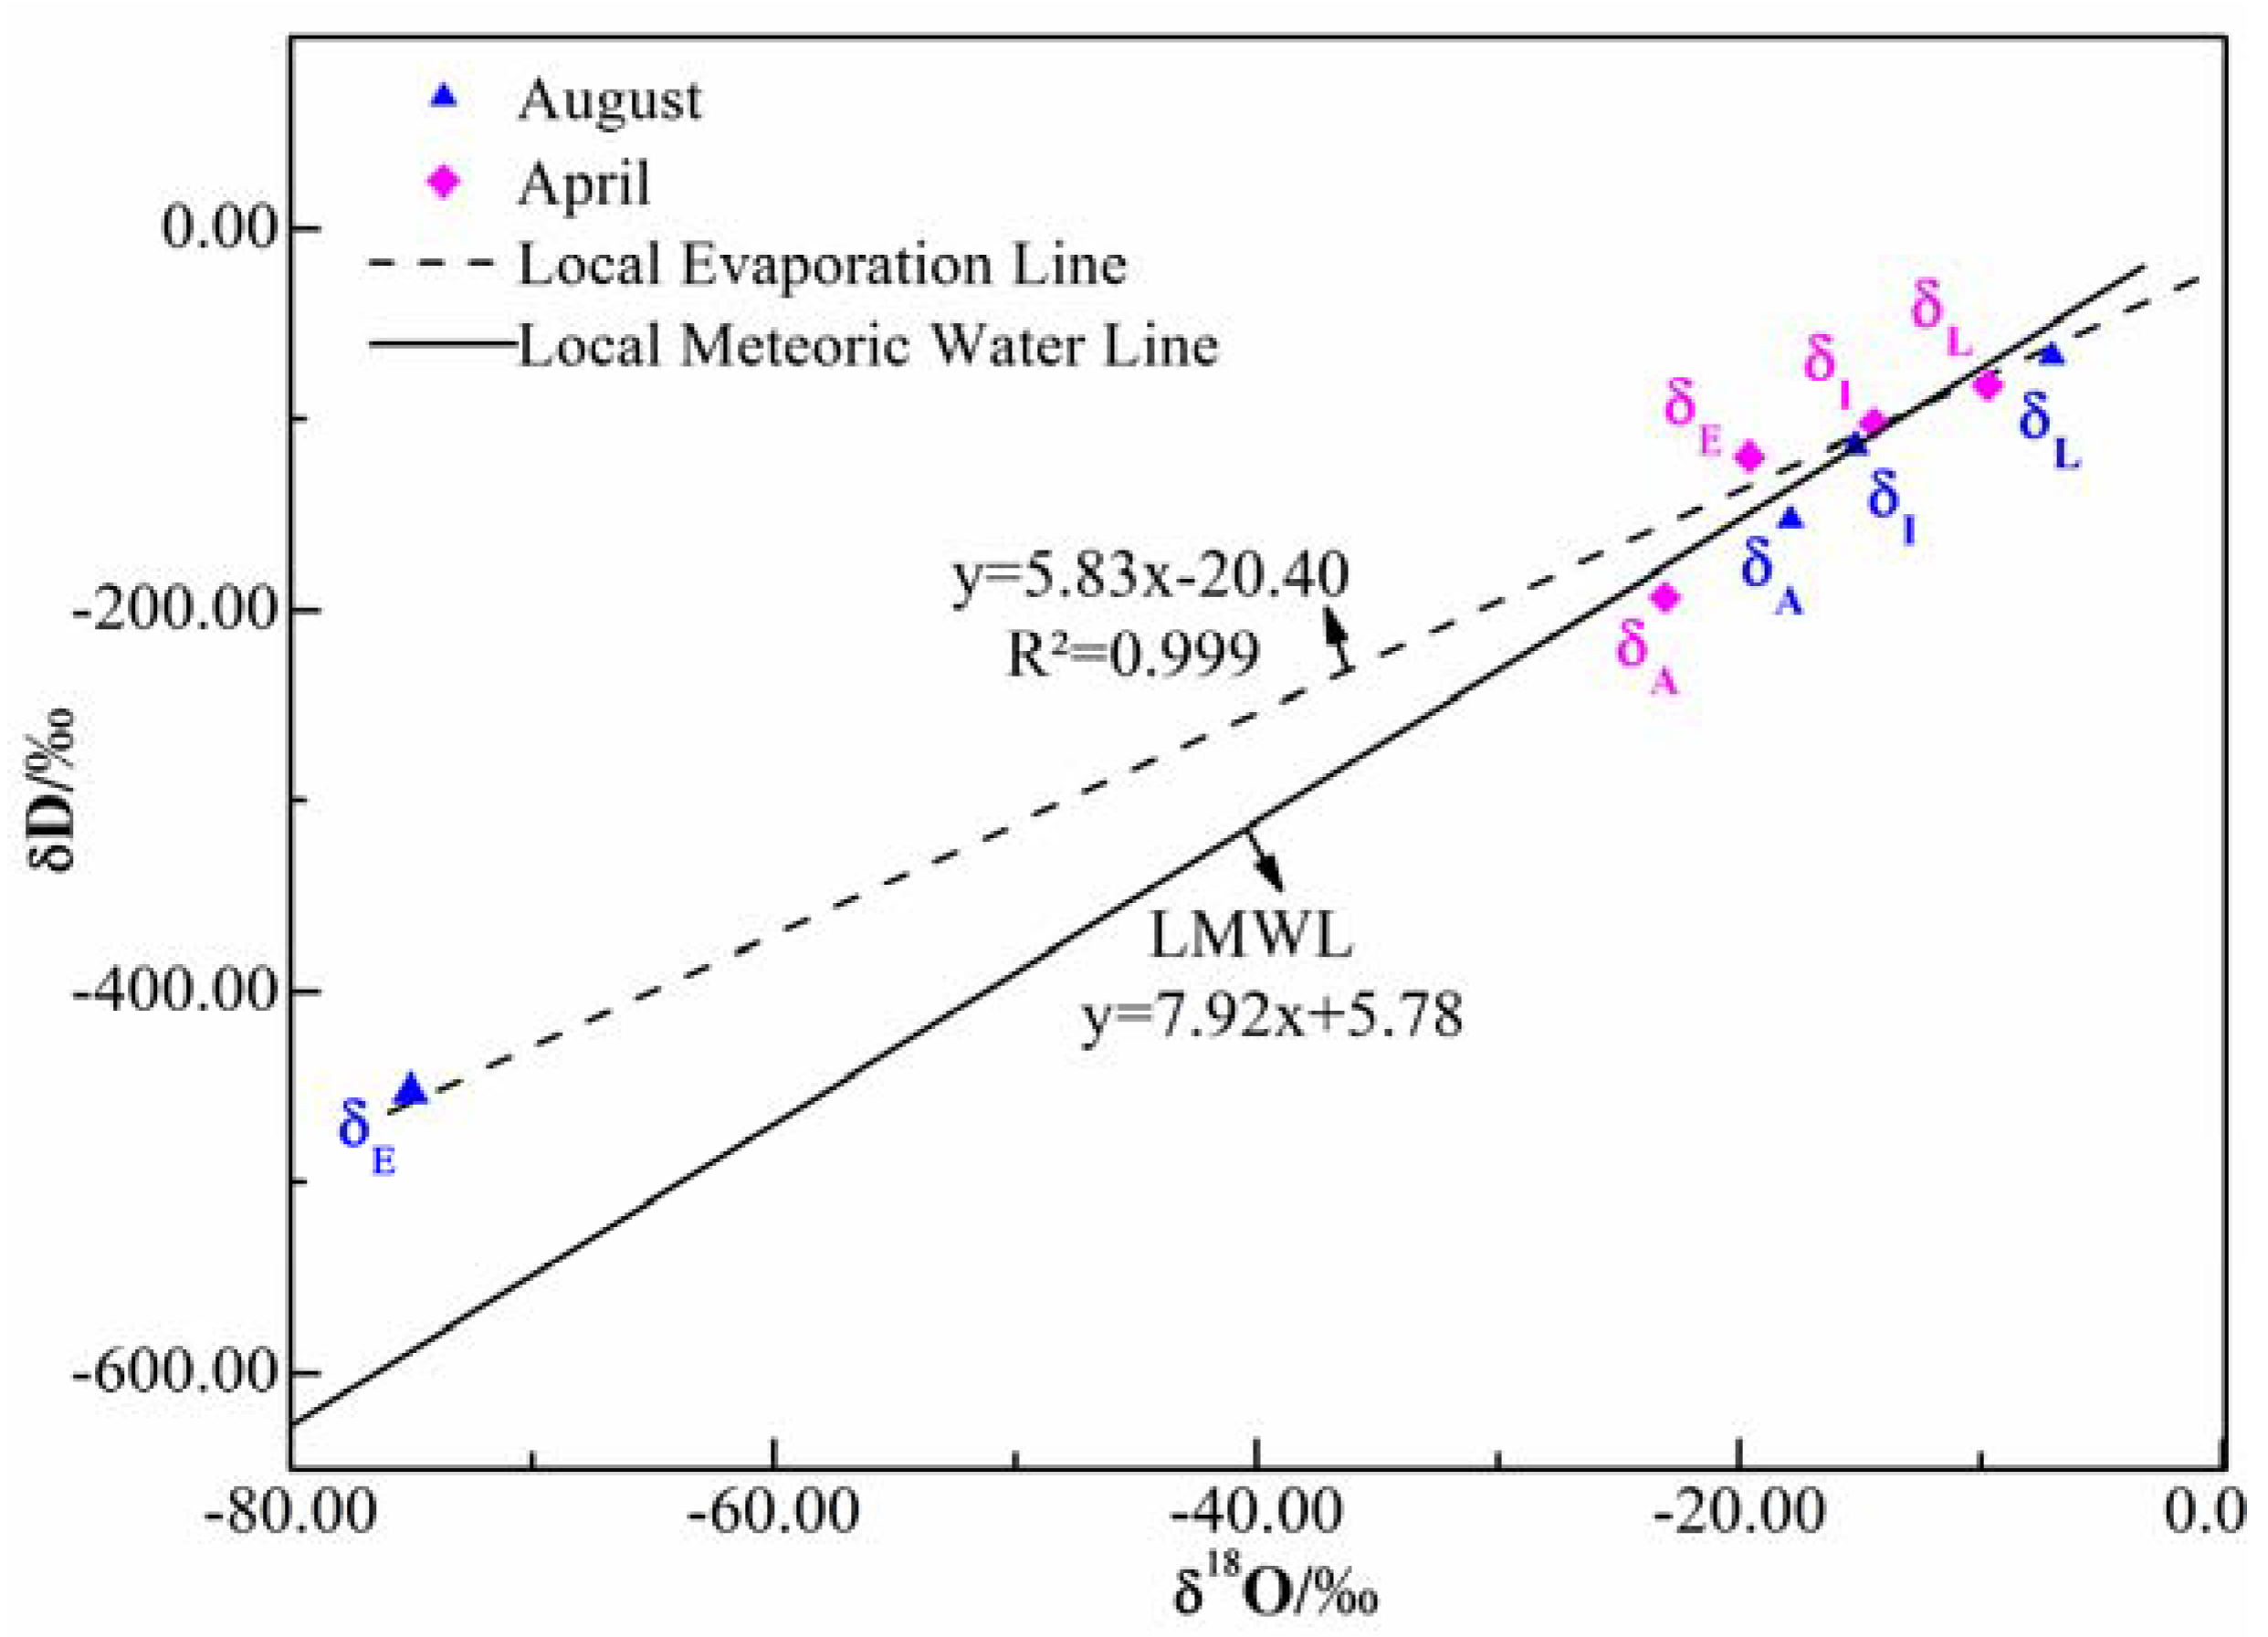
Figure 9 showed the local evaporation line (LEL) for the lake in different seasons by the connecting the known isotopic compositions of the lake (δL) with the modeled isotopic compositions of evaporation (δE), input water (δI) and atmospheric moisture (δA) [37,40]. The coefficient of determination (R2) for the linear regression was 0.999. The slope of the LEL was 5.83, which is within the typical range of 4 to 6 [37,40] and was primarily controlled by local atmospheric conditions, including relative humidity (h), temperature (T) and the isotopic composition of atmospheric moisture (δA) [41]. Moreover, the relative position of a given lake along the LEL was strongly associated with the water balance of the lake [5]. As shown in Figure 9, the modeled evaporative isotope compositions from the lake (δE), which lied to the left of the LMWL, were explained by isotopic fractionation during evaporation enrichment process [24].
4.3. Implications for E/I Ratio
The E/I ratio of Lashi Lake (0.51 in August and 0.12 in April) located in the south-eastern margin of the Tibet Plateau was different from the previous study of Ranwu Lake (E/I: 0.009) [39] for a similar region. Gongmo-tso and Drem-tso lakes in the Southern Tibet Plateau had different E/I ratios from this study, the E/I ratios were 0.10 and 0.80, respectively [24]. The E/I ratio of Cona lake on the central Tibet Plateau was from 0.24 to 0.27. The spatial difference indicated that the climatic condition and hydrological processes in different places played an important role in carefully assess of Lake water cycle and balance processes. The E/I ratio of Lashi Lake in April (0.12) was much lower than in August (0.51), probably due to relatively low evaporation in April, indicating a short residence time [2,42]. The phenomenon was the opposite of August.
The stable isotope approach not only characterized present-day lake systems, but also provided valuable information for reconstructions of past hydrological conditions [43]. The lake water isotope composition of a closed lake system was controlled by the evaporation to input ratio (E/I) [44]. The parameter (E/I) indicated the water balance of the lake and had been applied widely to study lake evaporation under different geographical and climatic scenarios [2,24,28,45].
5. Conclusions
This study systematically reported stable isotope compositions of lake water and source water (precipitation, snowmelt water, river water) in Lashi Lake basin as well as the lake water balance in August 2014 and April 2015. The surface lake water δ18O and d-excess had a typical spatial pattern. Relative higher δ18O and lower d-excess were distributed on the eastern and western part of the lake. The lowest δ18O with highest d-excess values were found close to the Meiquan River mouth. The lake water gradually enriched in 18O from the northeast coast to the middle of the lake, then gradually depleted in 18O in August, which was different from that of April. In April, relatively high δ18O values were observed in the middle part of the lake and the lowest δ18O were found in the south shore distributed of the Qingshui River. In addition, the vertical variability of the isotope in lake water indicated that the lake water was well-mixed.
Combing the isotope compositions and meteorological data, we estimated the E/I status of Lashi Lake. The model results indicated that the average E/I ratios was 0.51 in August and 0.12 in April. The consistent E/I ratios derived from δD and δ18O imply that the Craig-Gordon isotopic model was reliable in estimating the water balance of Lashi Lake. A sensitivity analysis demonstrated that there are three key factors influencing the accuracy of E/I estimations, including temperature of surface lake water, the isotopic compositions of inflowing rivers and atmospheric water vapor. Therefore, it is necessary to conduct long-term field observations for the three factors, which could improve the accuracy of E/I ratio and determine the dominant factors influencing the water balance of lakes.
Acknowledgments
This work was financially supported by the Project of the National Natural Science Foundation of China (41401083), the Foundation of China Postdoctoral Science Foundation (2016T90964, 2014M552517) and the State Key Laboratory of Cryospheric Sciences (SKLCS-ZZ-2017). We would like to express our great gratitude to every editor and reviewer for their reading of the manuscript, and for their insightful comments and suggestions.
Author Contributions
Xiaoyi Shi wrote the draft; Tao Pu improved the figures and modified the manuscript. All authors read and approved the final manuscript.
Conflicts of Interest
The authors declare no conflict of interest.
References
- Bullock, A.; Acreman, M. The role of wetlands in the hydrological cycle. Hydrol. Earth Syst. Sci. Discuss. 2003, 7, 358–389. [Google Scholar] [CrossRef]
- Biggs, T.W.; Lai, C.T.; Chandan, P.; Lee, R.M.; Messina, A.; Lesher, R.S.; Khatoon, N. Evaporative fractions and elevation effects on stable isotopes of high elevation lakes and streams in arid western Himalaya. J. Hydrol. 2015, 522, 239–249. [Google Scholar] [CrossRef]
- Zhou, S.Q.; Kang, S.C.; Chen, F.; Joswiak, D.R. Water balance observations reveal significant subsurface water seepage from Lake Nam Co, south-central Tibetan Plateau. J. Hydrol. 2013, 491, 89–99. [Google Scholar] [CrossRef]
- Feng, X.H.; Lauder, A.M.; Posmentier, E.S.; Kopec, B.G.; Virginia, R.A. Evaporation and transport of water isotopologues from Greenland lakes: The lake size effect. Quat. Sci. Rev. 2015, 131, 302–315. [Google Scholar] [CrossRef]
- Gibson, J.J.; Edwards, T.W.D. Regional water balance trends and evaporation–transpiration partitioning from a stable isotope survey of lakes in northern Canada. Glob. Biogeochem. Cycles 2002, 16, 10–1–10–14. [Google Scholar] [CrossRef]
- Turner, K.W.; Wolfe, B.B.; Edwards, T.W.D. Characterizing the role of hydrological processes on lake water balances in the old crow flats, yukon territory, Canada, using water isotope tracers. J. Hydrol. 2010, 386, 103–117. [Google Scholar] [CrossRef]
- Penna, D.; Engel, M.; Mao, L.; Dell’Agnese, A.; Bertoldi, G.; Comiti, F. Tracer-based analysis of spatial and temporal variations of water sources in a glacierized catchment. Hydrol. Earth Syst. Sci. 2014, 11, 5271–5288. [Google Scholar] [CrossRef]
- Jasechko, S.; Gibson, J.J.; Edwards, T.W.D. Stable isotope mass balance of The Laurentian Great Lakes. J. Gt. Lakes Res. 2014, 40, 336–346. [Google Scholar] [CrossRef]
- Chiogna, G.; Santoni, E.; Camin, F.; Tonon, A.; Majone, B.; Trenti, A. Stable isotope characterization of the Vermigliana catchment. J. Hydrol. 2014, 509, 295–305. [Google Scholar] [CrossRef]
- Kang, S.C.; Yi, Y.; Xu, Y.W.; Xu, B.Q.; Zhang, Y.L. Water isotope framework for lake water balance monitoring and modelling in the nam co basin, Tibetan plateau. J. Hydrol. Reg. Stud. 2017, 12, 289–302. [Google Scholar] [CrossRef]
- Elmarami, H.; Meyer, H.; Massmann, G. Combined approach of isotope mass balance and hydrological water balance methods to constrain the sources of lake water as exemplified on the small dimictic lake silbersee, northern Germany. Isot. Environ. Health Stud. 2016, 53, 184–197. [Google Scholar] [CrossRef] [PubMed]
- Liu, Z.F.; Tian, L.D.; Yao, T.D.; Gong, T.L. Estimation of evaporation from Cona lake in the central Tibetan Plateau using an isotope-based method. J. Nat. Resour. 2009, 24, 2014–2023. [Google Scholar]
- Kriegel, D.; Mayer, C.; Hagg, W.; Vorogushyn, S.; Duethmann, D.; Gafurov, A.; Farinotti, D. Changes in glaciersation, climate and runoff in the second half of the 20th century in the Naryn basin, central Asia. Glob. Planet. Chang. 2013, 110, 51–61. [Google Scholar] [CrossRef]
- He, Y.Q.; Pang, H.X.; Theakstone, W.H.; Zhang, D.; Lu, A.G.; Song, B.; Yuan, L.L.; Ning, B.Y. Spatial and temporal variations of oxygen isotopes in snowpacks and glacial runoff in different types of glacial area in western China. Ann. Glaciol. 2006, 43, 269–274. [Google Scholar] [CrossRef]
- Pang, H.X.; He, Y.Q.; Lu, A.G.; Zhao, J.D.; Ning, B.Y.; Yuan, L.L.; Song, B.; Zhang, N.N. Comparisons of stable isotopic fractionation in winter and summer at Baishui Glacier No. 1, Mt. Yulong, China. J. Geogr. Sci. 2006, 16, 306–314. [Google Scholar] [CrossRef]
- Pang, H.X.; He, Y.Q.; Zhang, Z.L.; Lu, A.G.; Gu, J.; Zhao, J.D. The δ18O and the monsoon water vapor source in the monsoon precipitation. Chin. Sci. Bull. 2005, 50, 2263–2266. [Google Scholar]
- Pu, T.; He, Y.Q.; Zhu, G.F.; Zhang, N.N.; Du, J.K.; Wang, C.F. Characteristics of water stable isotopes and hydrograph separation in Baishui catchment during the wet season in Mt. Yulong region, south western China. Hydrol. Process. 2013, 27, 3641–3648. [Google Scholar] [CrossRef]
- Pu, T.; He, Y.Q.; Zhang, T.; Wu, J.K.; Zhu, G.F.; Chang, L. Isotopic and geochemical evolution of ground and river waters in a karst dominated geological setting: A case study from Lijiang basin, South-Asia monsoon region. Appl. Geochem. 2013, 33, 199–212. [Google Scholar] [CrossRef]
- Jones, M.D.; Imbers, J. Modeling mediterranean lake isotope variability. Glob. Planet. Chang. 2010, 71, 193–200. [Google Scholar] [CrossRef]
- Steinman, B.A.; Abbott, M.B. Isotopic and hydrologic responses of small, closed lakes to climate variability: Hydroclimate reconstructions from lake sediment oxygen isotope records and mass balance models. Geochimica et Cosmochimica Acta 2013, 105, 342–359. [Google Scholar] [CrossRef]
- Pu, T.; He, Y.Q.; Zhu, G.F.; Xin, H.J.; Cao, W.H.; Niu, H.W. Hydrochemical characteristics of typical rivers in a temperate glacier basin, China. Environ. Earth Sci. 2013, 68, 615–621. [Google Scholar] [CrossRef]
- Tan, N.Y. The Resources of Water can Keep on the Research that Exploitation Guarantees System and Practice- the River of Lijiang Lashihai Plateau Wetly the Protection Makes Use of with Development. Ph.D. Thesis, Sichuan University, Sichuan, China, 2005. [Google Scholar]
- Shi, X.Y.; Pu, T.; He, Y.Q.; Lu, H.; Niu, H.W.; Xia, D.S. Spatial distribution of stable isotope from the lakes in typical temperate glacier region. Environ. Sci. 2016, 37, 1685–1691. [Google Scholar]
- Shi, X.N.; Zhang, F.; Tian, L.D.; Joswiak, D.R.; Zeng, C.; Qu, D.M. Tracing contributions to hydro-isotopic differences between two adjacent lakes in the southern Tibetan Plateau. Hydrol. Process. 2014, 28, 5503–5512. [Google Scholar] [CrossRef]
- Craig, H.; Gordon, L.I. Deuterium and oxygen 18 variations in the ocean and the marine atmosphere, Stable isotopes in oceanographic studies and paleotemperatures. In Proceedings of the Spoleto Conferences in Nuclear Geology; Lischi e F.: Pisa, Italy, 1965; pp. 9–130. [Google Scholar]
- Gat, J.R. Oxygen and hydrogen isotopes in the hydrologic cycle. Earth Planet. Sci. 1996, 24, 225–262. [Google Scholar] [CrossRef]
- Horita, J.; Rozanski, K.; Cohen, S. Isotope effects in the evaporation of water: A status report of the Craig-Gordon model. Isot. Environ. Health Stud. 2008, 44, 23. [Google Scholar] [CrossRef] [PubMed]
- Gibson, J.J.; Birks, S.J.; Yi, Y. Stable isotope mass balance of lakes: A contemporary perspective. Quat. Sci. Rev. 2015, 131, 316–328. [Google Scholar] [CrossRef]
- Horita, J.; Wesolowski, D.J. Liquid-vapor fractionation of oxygen and hydrogen isotopes of water from the freezing to the critical temperature. Geochimica et Cosmochimica Acta 1994, 58, 3425–3437. [Google Scholar] [CrossRef]
- Özaydin, V.; Şendil, U.; Altinbilek, D. Stable isotope mass balance method to find the water budget of a lake. J. Eng. Environ. Sci. 2001, 25, 329–344. [Google Scholar]
- Zang, Y.L.; Wang, J.L.; Tian, L.D.; Weng, Y.B.; Wen, R.; Zong, J.B. The spatial distribution of stable isotopes in YamzhoYumco lake. J. Southwest Univ. Nat. Sci. Edit. 2014, 36, 127–132. [Google Scholar]
- Dansgaard, W. Stable isotopes in precipitation. Tellus A 1964, 16, 436–468. [Google Scholar] [CrossRef]
- Cui, J.P.; Tian, L.D.; Biggs, T.; Wen, R. Deuterium-excess determination of evaporation to inflow ratios of an alpine lake: Implications for water balance and modeling. Hydrol. Process. 2017, 31, 1034–1046. [Google Scholar] [CrossRef]
- Brooks, J.R.; Gibson, J.J.; Birks, S.J.; Weber, M.H.; Rodecap, K.D.; Stoddard, J.L. Stable isotope estimates of evaporation: Inflow and water residence time for lakes across the United States as a tool for national lake water quality assessments. Limnol. Oceanogr. 2015, 59, 2150–2165. [Google Scholar] [CrossRef]
- Longinelli, A.; Stenni, B.; Genoni, L.; Flora, O.; Defrancesco, C.; Pellegrini, G. A stable isotope study of the Garda lake, northern Italy: Its hydrological balance. J. Hydrol. 2008, 360, 103–116. [Google Scholar] [CrossRef]
- Halder, J.; Decrouy, L.; Vennemann, T.W. Mixing of rhône river water in lake Geneva (Switzerland-France) inferred from stable hydrogen and oxygen isotope profiles. J. Hydrol. 2013, 477, 152–164. [Google Scholar] [CrossRef]
- Yi, Y.; Brock, B.E.; Falcone, M.D.; Wolfe, B.B.; Edwards, T.W.D. A coupled isotope tracer method to characterize input water to lakes. J. Hydrol. 2008, 350, 1–13. [Google Scholar] [CrossRef]
- Fan, T. Research on the Evolution Process and Trend of Eco-Geological Environment of Lijiang, Northwest of Yunnan. Ph.D. Thesis, Kunming University of Science and Technology, Yunnan, China, 2010. [Google Scholar]
- Skrzypek, G.; Mydłowski, A.; Dogramaci, S.; Hedley, P.; Gibson, J.J.; Grierson, P.F. Estimation of evaporative loss based on the stable isotope composition of water using hydrocalculator. J. Hydrol. 2015, 523, 781–789. [Google Scholar] [CrossRef]
- Edwards, T.W.D.; Wolfe, B.B.; Gibson, J.J.; Dan, H. Use of water isotope tracers in high latitude hydrology and paleohydrology. Dev. Paleoenviron. Res. 2004, 8, 187–207. [Google Scholar]
- Birks, S.J.; Edwards, T.W.D. Global prediction of δA and δ2H-δ18O evaporation slopes for lakes and soil water accounting for seasonality. Glob. Biogeochem. Cycles 2008, 22, GB2031. [Google Scholar]
- Ju, J.T.; Zhu, L.P.; Wang, J.B.; Cui, Y.Y.; Huang, L.; Yang, R.M.; Ma, Q.F.; Luo, L.; Wang, Y.J. Estimating the contribution of glacial meltwater to ranwu lake, a proglacial lake in se tibet, using observation data and stable isotopic analyses. Environ. Earth Sci. 2017, 76, 229. [Google Scholar] [CrossRef]
- Mayr, C.; Lücke, A.; Stichler, W.; Trimborn, P.; Ercolano, B.; Oliva, G.; Ohlendorf, C.; Soto, J.; Fey, M.; Haberzettl, T.; et al. Precipitation origin and evaporation of lakes in semi-arid patagonia (argentina) inferred from stable isotopes (δ18O, δ2H). J. Hydrol. 2007, 334, 53–63. [Google Scholar] [CrossRef]
- Lister, G.S.; Kelts, K.; Zao, C.K.; Yu, J.Q.; Niessen, F. Lake Qinghai, China: Closed-basin like levels and the oxygen isotope record for ostracoda since the latest pleistocene. Palaeogeogr. Palaeoclimatol. Palaeoecol. 1991, 84, 141–162. [Google Scholar] [CrossRef]
- Wen, R.; Tian, L.D.; Liu, F.J.; Qu, D.M. Lake water isotope variation linked with the in-lake water cycle of the alpine Bangong Co, arid western Tibetan Plateau. Arct. Antarct. Alp. Res. 2002, 48, 563–580. [Google Scholar] [CrossRef]
Figure 1.
Location of the study area and sampling point sites.

Figure 2.
Schematic diagram of the locations of profiles in the middle part of Lashi Lake.

Figure 3.
Precipitation, temperature and relative humidity are obtained from January 2014 to December 2015.
Figure 3.
Precipitation, temperature and relative humidity are obtained from January 2014 to December 2015.

Figure 4.
Contoured variations of oxygen isotope composition and deuterium excess value in August and April. (a,b) stand for the spatial variation of oxygen isotope and d-excess value in August; (c,d) stand for the spatial variation of oxygen isotope and d-excess value in April. The diagram was established using “Spline function” as the method of interpolation and extracting contour.

Figure 5.
The relation line of hydrogen and oxygen isotope in precipitation and lake water.

Figure 6.
Oxygen isotope composition with depth profiles. Curve diversification of oxygen isotope composition in eight and six depth profiles in August 2014 (left) and April 2015 (right), respectively.
Figure 6.
Oxygen isotope composition with depth profiles. Curve diversification of oxygen isotope composition in eight and six depth profiles in August 2014 (left) and April 2015 (right), respectively.

Figure 7.
Hydrogen isotope composition with depth profiles in August 2014 (left) and April (right) 2015, respectively.
Figure 7.
Hydrogen isotope composition with depth profiles in August 2014 (left) and April (right) 2015, respectively.

Figure 8.
Variations of d-excess along vertical profiles taken in August 2014 (left) and April (right) 2015.
Figure 8.
Variations of d-excess along vertical profiles taken in August 2014 (left) and April (right) 2015.

Figure 9.
Schematic δ18O and δD diagram identifying key isotopic parameters used in isotope-mass balance studies. These include lake water isotope composition (δL), isotope composition of evaporated vapor from the lake (δE), input water isotope composition (δI). The atmospheric moisture isotope composition (δA) is also shown.


Table 1.
Values of δ18O for snowmelt, lake water, rainfall and river water samples.
| Water Type | Sampling Date | Sampling Number | δ18O/‰ | ||
|---|---|---|---|---|---|
| Ave | Max | Min | |||
| Surface lake water | August 2014 | 46 | −9.75 | −8.16 | −12.98 |
| Surface lake water | April 2015 | 12 | −7.42 | −6.88 | −9.95 |
| Profile lake water | August 2014 | 40 | −9.80 | −9.00 | −11.00 |
| Profile lake water | April 2015 | 21 | −7.22 | −7.15 | −7.32 |
| Precipitation | June–September 2014 | 46 | −12.98 | −3.28 | −27.99 |
| Snowmelt | May 2015 | 16 | −6.30 | −3.98 | −8.60 |
| Meiquan River | June–August 2014 | 6 | −13.22 | −12.88 | −13.56 |
| Meiquan River | November 2014/May 2015 | 7 | −13.50 | −12.81 | −13.90 |
| Qingshui River | May 2017 | 6 | −11.65 | −11.48 | −11.83 |
Table 2.
The standard deviation of all profiles water isotope.
| August Profile Number | Std./‰ | April Profile Number | Std./‰ | ||||
|---|---|---|---|---|---|---|---|
| δ18O | δD | d-excess | δ18O | δD | d-excess | ||
| L19 | 0.09 | 0.38 | 0.39 | L48 | 0.01 | 0.14 | 0.11 |
| L20 | 0.07 | 0.43 | 0.31 | L49 | 0.01 | 0.07 | 0.12 |
| L21 | 0.19 | 0.91 | 0.57 | L50 | 0.02 | 0.03 | 0.10 |
| L22 | 0.21 | 1.09 | 0.67 | L54 | 0.02 | 0.24 | 0.37 |
| L28 | 0.04 | 0.34 | 0.11 | L55 | 0.01 | 0.18 | 0.20 |
| L29 | 0.03 | 0.18 | 0.15 | L56 | 0.02 | 0.11 | 0.06 |
| L30 | 0.04 | 0.41 | 0.14 | Ave. | 0.00 | 0.08 | 0.11 |
| L31 | 0.03 | 0.38 | 0.28 | ||||
| Ave. | 0.07 | 0.31 | 0.20 | ||||
Table 3.
The E/I ratios calculated based on δ18O or δD and their mean values.
| Year | Method-δ18O | Method-δD | Method-Mean |
|---|---|---|---|
| 2014/8 | 0.478 | 0.549 | 0.5135 |
| 2015/4 | 0.117 | 0.118 | 0.1175 |
Table 4.
Variables and parameters used in the calculation of isotopic compositions of evaporation vapor during the study period.
Table 4.
Variables and parameters used in the calculation of isotopic compositions of evaporation vapor during the study period.
| Variables/Parameters | August 2014 | April 2015 | ||
|---|---|---|---|---|
| δ18O/‰ | δD/‰ | δ18O/‰ | δD/‰ | |
| Air temperature (T) | 17.8 °C | 14.3 °C | ||
| Relative humidity (h) | 81% | 52% | ||
| Equilibrium liquid-vapor isotope fractionation(α*)/‰ | 1.01 | 1.09 | 1.01 | 1.09 |
| Equilibrium separation term (ε*)/‰ | 9.99 | 87.66 | 9.94 | 87.06 |
| Kinetic separation term (εK)/‰ | 2.70 | 2.38 | 6.82 | 6.00 |
| Isotopic compositions of precipitation (εP)/‰ | ‒12.98 | ‒97.03 | ‒7.52 | ‒55.73 |
| Isotopic compositions of atmospheric moisture (εA)/‰ | ‒23.10 | ‒193.20 | ‒17.54 | ‒147.64 |
| Isotopic compositions of lake water (εL)/‰ | ‒9.70 | ‒82.20 | ‒7.06 | ‒66.60 |
| Isotopic compositions of evaporation vapor (εE)/‰ | ‒19.58 | ‒119.31 | ‒75.04 | ‒452.46 |
© 2017 by the authors. Licensee MDPI, Basel, Switzerland. This article is an open access article distributed under the terms and conditions of the Creative Commons Attribution (CC BY) license (http://creativecommons.org/licenses/by/4.0/).
Share and Cite
MDPI and ACS Style
Shi, X.; Pu, T.; He, Y.; Qi, C.; Zhang, G.; Xia, D. Variability of Stable Isotope in Lake Water and Its Hydrological Processes Identification in Mt. Yulong Region. Water 2017, 9, 711. https://doi.org/10.3390/w9090711
AMA Style
Shi X, Pu T, He Y, Qi C, Zhang G, Xia D. Variability of Stable Isotope in Lake Water and Its Hydrological Processes Identification in Mt. Yulong Region. Water. 2017; 9(9):711. https://doi.org/10.3390/w9090711
Chicago/Turabian StyleShi, Xiaoyi, Tao Pu, Yuanqing He, Cuishan Qi, Guotao Zhang, and Dunsheng Xia. 2017. "Variability of Stable Isotope in Lake Water and Its Hydrological Processes Identification in Mt. Yulong Region" Water 9, no. 9: 711. https://doi.org/10.3390/w9090711
Note that from the first issue of 2016, this journal uses article numbers instead of page numbers. See further details here.