
Recognition of the Mental Workloads of Pilots in the Cockpit Using EEG Signals †
by
 , , and
Aura Hernández-Sabaté
1,2,* ,
,
José Yauri
1,2 ,
,
Pau Folch
3,4,
Miquel Àngel Piera
4 and
Debora Gil
1,2 1
Computer Vision Center, Universitat Autònoma de Barcelona, Bellaterra, 08193 Barcelona, Spain
2
Departament de Ciències de la Computació, Universitat Autònoma de Barcelona, Bellaterra, 08193 Barcelona, Spain
3
Aslogic, Parc de Recerca UAB, Bellaterra, 08193 Barcelona, Spain
4
Telecommunications and Systems Engineering Department, Universitat Autònoma de Barcelona, Bellaterra, 08193 Barcelona, Spain
*
Author to whom correspondence should be addressed.
†
This paper is an extended version of our paper published in 23rd International Conference of the Catalan Association for Artificial Intelligence, Lleida, Spain, 20–22 October 2021.
Appl. Sci. 2022, 12(5), 2298; https://doi.org/10.3390/app12052298
Submission received: 22 December 2021
/
Revised: 29 January 2022
/
Accepted: 6 February 2022
/
Published: 22 February 2022
(This article belongs to the Special Issue Women in Artificial intelligence (AI))
Abstract
:The commercial flightdeck is a naturally multi-tasking work environment, one in which interruptions are frequent come in various forms, contributing in many cases to aviation incident reports. Automatic characterization of pilots’ workloads is essential to preventing these kind of incidents. In addition, minimizing the physiological sensor network as much as possible remains both a challenge and a requirement. Electroencephalogram (EEG) signals have shown high correlations with specific cognitive and mental states, such as workload. However, there is not enough evidence in the literature to validate how well models generalize in cases of new subjects performing tasks with workloads similar to the ones included during the model’s training. In this paper, we propose a convolutional neural network to classify EEG features across different mental workloads in a continuous performance task test that partly measures working memory and working memory capacity. Our model is valid at the general population level and it is able to transfer task learning to pilot mental workload recognition in a simulated operational environment.
1. Introduction
A fundamental aspect of multiple task management is to attend to new stimuli and integrate associated task requirements into an ongoing task set—that is, to engage in interruption management [1]. Interruptions often negatively affect human performance. Specifically, most laboratory and applied experiments demonstrate that interruptions increase post-interruption performance times [2] and error rates [3], increase perceived workload [4], and motivate compensatory behavior [5].
The commercial flightdeck is a naturally multi-tasking work environment, one in which interruptions are frequent and of various forms. Further, interruptions have been cited as a contributing factor in many aviation incident reports. External and aircraft events, and interactions with other operators, compete for pilots’ attention and require pilots to integrate performance requirements associated with these unexpected prompts with ongoing flightdeck tasks.
For that, the study of workload is essential to prevent accidents, since it could compromise human task performance [6]. Since workload involves cognitive, neuro-physiologic, and perceptual processes to resolve a task, it is affected by individual capabilities, motivation, and physical and emotional state [7]. Although this multifaceted nature of workload prevents one from studying workload directly, it is feasible to infer it from various quantifiable variables [8]. There exist many proposals for recognizing workload based on physiological features, such as hearth rate, eye movement and dilation, electroencephalogram (EEG), and electrocardiogram (ECG) [9,10]. The recent emergence of low cost EEG headsets has driven new researches (such as interaction with home devices, teaching-learning educative methods, and mentally control robotic arms) further than the medical screening of neurological disorders. In the particular case of cognitive state assessment, EEG alone is becoming the preferred sensor for addressing its characterization [11,12,13]. However, there is not enough evidence in the literature to validate how well models generalize to new subjects performing tasks of a workload similar to the ones included during the model’s training.
The goal of this study was to characterize the mental workloads of airplane pilots in the cockpit from the analysis of EEG signals.
The remainder of this paper is organized as follows: Section 2 summarizes the state-of-the-art related work. Section 3 details the ground truth generation. Section 4 explains the models used to recognize the different levels of workload. Section 5 presents the experimental design. Section 6 is devoted to the experimental results. Finally, Section 7 outlines the conclusions and future work.
2. Related Work
The most generalized mechanisms to measure workload can be split into two main categories [9,14,15]: subjective measures based on the subject perception and objective scores based on physiological responses.
On the one hand, subjective measures are still the most used to assess mental workload, the NASA Task Load Index (TLX) [16] being the most prominent test used to gain insights about the perceived workload levels while a subject works with various human–machine interface systems [17,18]. This questionnaire measures the mental workload based on a weighted average of six sub-variables: mental demand, physical demand, temporal demand, performance, effort, and frustration. It is widely used in aviation to assess mental workload of pilots while interacting with plane controls [19,20].
On the other hand, physiological measures provide more reliable data of workload by measuring physiological dynamic changes which cannot be controlled consciously, so they have been becoming more popular among researchers in recent years [21,22,23]. The most common sensors/measurements used to record physiological data are: electrocardiogram (ECG) to register heart electrical activity, electromyograph to read skeletal muscles’ electrical activity, electroencephalogram (EEG) to detect electrical activity in the brain, photoplethysmography to register volumetric changes in the blood flow, respiration rate sensors, electro-dermal activity (EDA) to read skin surface temperature, oxygen density in the blood in the brain, and eye movement trackers, among others [24]. TLX surveys allow one to assess the perceived workload [16], but it is highly subjective. However, physiological data occur spontaneously, and together with TLXs, provide more reliable information [9,17,21].
The combination of several physiological sensors to classify workload states gives better results than using a single one. The approach proposed in [25] combines EEG, ECG, and electrooculography (EOG); and results show the best predictive power for their combination (80%) rather than the analysis of each one independently (70%). In addition, the study in [10] reports an accuracy average of 85.2 (±4.3%) combining EEG, ECG, respiration rate, and EDA to classify four mental states. The work in [26] still shows better results combining EEG, ECG, and EDA than using only EEG signals from classifying four mental states, although results from the single sensor are promising (86.66%).
Deep learning (DL) approaches are gaining ground over more classical machine learning techniques due to their ability to automatically extract features [24,27,28].
The application fields fall into five general groups: emotion recognition [29], motor imagery [30], seizure detection [31], sleep scoring [32], and mental workload. Saadati et al. [33] combined functional Near Infrared Spectroscopy (fNIRS) and adapted a CNN architecture to allow fNIRS-EEG input to the CNN with promising results (89/5 of correct classification). The study in [6] proposed a concatenated structure of deep recurrent and 3D convolutional neural networks to combine both raw and spectral EEG data and assess two degrees of mental workload, reporting an average accuracy of 88.9% in a cross-task assessment. In the same fashion, Kwak et al. [34] proposed a LSTM based temporal attention technique to simultaneously extract EEG features containing both local and global structure information, obtaining an accuracy of 90.8% on their own dataset. Chakladar et al. presented a new framework using the grey wolf optimizer algorithm and deep BLSTM-LSTM neural model for estimating different levels of mental workload, achieving 86.33% and 82.57% classification accuracy for “No task” and “multitasking activity” experiments, respectively. None of them transfer learning to another type of task.
Contributions
AI methods characterizing WL from EEG signals must face several challenges. First, in order to properly be trained and tested, it is mandatory to have data with unambiguous annotations (known as ground truth, GT). The collection of this annotated data is complex because the concept of WL itself is multifaceted and difficult to determine in an objective, systematic manner. Second, for optimal performance of the system, it should properly combine the signals recorded from the different EEG electrodes. Finally, a main issue that a machine learning (ML) system involving humans should consider is its generalization power, including reproducibility of results and the capability of transfer learning—that is, to what extent a general model trained over a set of individuals can successfully predict a new unseen individual performing a different task than the ones used for training the system [35].
This work contributes to the three challenges as follows:
- Unambiguous Annotated Dataset. In order to generate data with unambiguous annotation, we have designed serious games and flight scenarios in an A320 simulator. The serious game was a modified n-back-test [36] with increasing memory demand. The level of difficulty of the test is our GT for training models. Such level of difficulty was cross-checked with the difficulty perceived by the player assessed using NASA TLX questionnaire. Models were trained using n-back-test data recorded from a population that did not include pilots. The task and population transfer of systems were validated in cockpit simulation exercises designed to have different levels of complexity, and unexpected unsaved situations known to substantially drop pilots’ performance.
- Models able to recognize two levels of workload with high generalization capability. Two different architectures are proposed for the fusion of EEG sensor signals (channels) at two different levels [37]: input data (labeled input projector model) and convolutional feature (labeled feature projector model) models. Both architectures consist of an input unit managing fusion at the input level, a convolutional unit, and an output unit for fusion of convolutional features. For each architecture, several classification problems (including an increasing number of WL classes) were trained on n-back-test data using a one-subject-out scheme and tested in binary problem for detection of WL on flight simulations.
The results show that between the two models, projecting convolutional feature channels achieved higher performance, with 76.25% sensitivity and 87.81% specificity in WL detection in n-back-test leave-one-out subject evaluation, and good task transfer with the detected WL increasing with the number of interruptions.
3. Data Annotation and Ground Truth Generation
In this paper, we provide two different automatically annotated datasets that served to train, validate, and verify the learning and population transfer of models. The first dataset was recorded from a group of non-pilot subjects playing a memory demanding, serious game with an increasing WL. The second dataset was recorded from pilots flying scenarios of different complexity on an A320 flight simulator.
3.1. Dual N-Back Test
N-Back-tests are memory demanding games requiring the resolution of tasks according to a stimulus presented N trials before. We used three variants of the n-back-tests to induce low, medium, and high mental workloads:
- Position 1-back for low workload. A square appears every few seconds in one of eight different positions on a regular grid over the screen. Players must press a keyboard key when the position of the square on the current screen is the same as the square of the previous grid.
- Arithmetic 1-back for medium workload. An integer between 0 and 9 appears every few seconds on the screen while an audio message says an arithmetic operation (plus, minus, multiply, or divide). Players have to solve this operation using the current number and number that appeared prior.
- Dual arithmetic 2-back for high workload. This test combines the two previous ones. An integer between 0 and 9 appears every few seconds in one of eight different positions on a regular grid. At the same time, for each number that appears on screen, an operator is presented with an audio message. As before, players have to solve this operation using the current number and the number that appeared two instances before. In addition, players have to press a key if the position of the current number is the same as the position of the number shown two screens before.
The neurophysiological response of a subject against mentally demanding tasks depends on his baseline state, which is prone to vary across time. In order to account for differences in the baseline states of subjects, prior to the n-back-tests, participants watched a relaxing video for 10 min. For each experiment (1—low, 2—medium, and 3—high workload), we had a video watching stage, a baseline phase, and the n-back-test, the workload phase. Thus, we call BL1, BL2, and BL3 the baseline phases of the experiments; and WL1, WL2, and WL3 are devoted to the workload phases of the experiments.
After the game, participants answered a TLX questionnaire to collect their subjective perceptions of game difficulty and workload. Results presented in [38] showed that the level of difficulty of the games was correlated to the performance of players and also to the subjective perception of WL computed using NASA-TLX questionnaire.
A total of 20 subjects participated in the experiment. Subjects were adults between 20 and 60; all of them were healthy without any condition that might have caused an imbalance in the data recorded. The sequence of tasks was randomly assigned to subjects, and recording of each session was on different days and hours.
3.2. Flight Simulations
The experiments were designed considering the importance of collecting experimental data that could be useful to quantifying the impact of a task load increment to pilots through operational interruptions by an air traffic controller (ATC), cabin crew (TCP), and electronic centralized aircraft monitor (ECAM) warnings, in order to assess to what extent the system presented to discriminate between low and high workload can be transferred to a more complex environment.
Four scenarios with different levels of complexity were designed, all of them assuming pilot monitoring (PM) incapacitation in order to check how interruptions can overload pilot flying (PF).
- Flight 1. It is based in a nominal standard flight. This experiment is used to take reference parameters. Thus, nominal flight without considering any interrupting event from abnormal procedures due to system failure nor ATC vectoring instructions. In this scenario, ATC provides a minimum number of instructions which the pilots are used to. This scenario the lowest complexity and is considered as the BL class.
- Flight 2. It also relies on the approach phase and it is modified from the nominal scenario, by three different interruptions which increase the PF workload. This scenario has an overall high WL demand.
- Flight 3. This scenario is based on the previous experiment with similar interruptions, but they are slightly advanced or delayed to times at which the PF workload is low and the pilot can attend the interruption without a negative performance impact. Given that interruptions were issued at the most appropriate times, this scenario has a lower level of WL demand than Flight 2.
- Flight 4. This last scenario is based on the previous experiment with the same interruptions, but they are fired at times in which PF is attending to concurrent actions, considerably increasing the workload and impacting the PF performance. This scenario has a similar or greater WL than Flight 2.
The functional resonance analysis method (FRAM) [39] is an agent based modeling framework to identify those factors that affect the performance of the pilot in cockpit functionalities considering different socio-technical operational conditions. According to this agent, the impact of an interruption on the PF workflow depends largely on the time at which the interruption occurs. Consequently, FRAM provides a reliable measure of the workload that will be faced by the pilot, and thus, it was used to design simulation scenarios with interruptions triggered at times when the pilot had a low and high WL peaks, and thus to provide realistic flying situations of controlled difficulty. In addition, FRAM output (both, number of tasks and its complexity) was used to assess the ability of ML models to detect WL peaks associated with highly demanding tasks. In this case a single pilot flew the 4 scenarios.
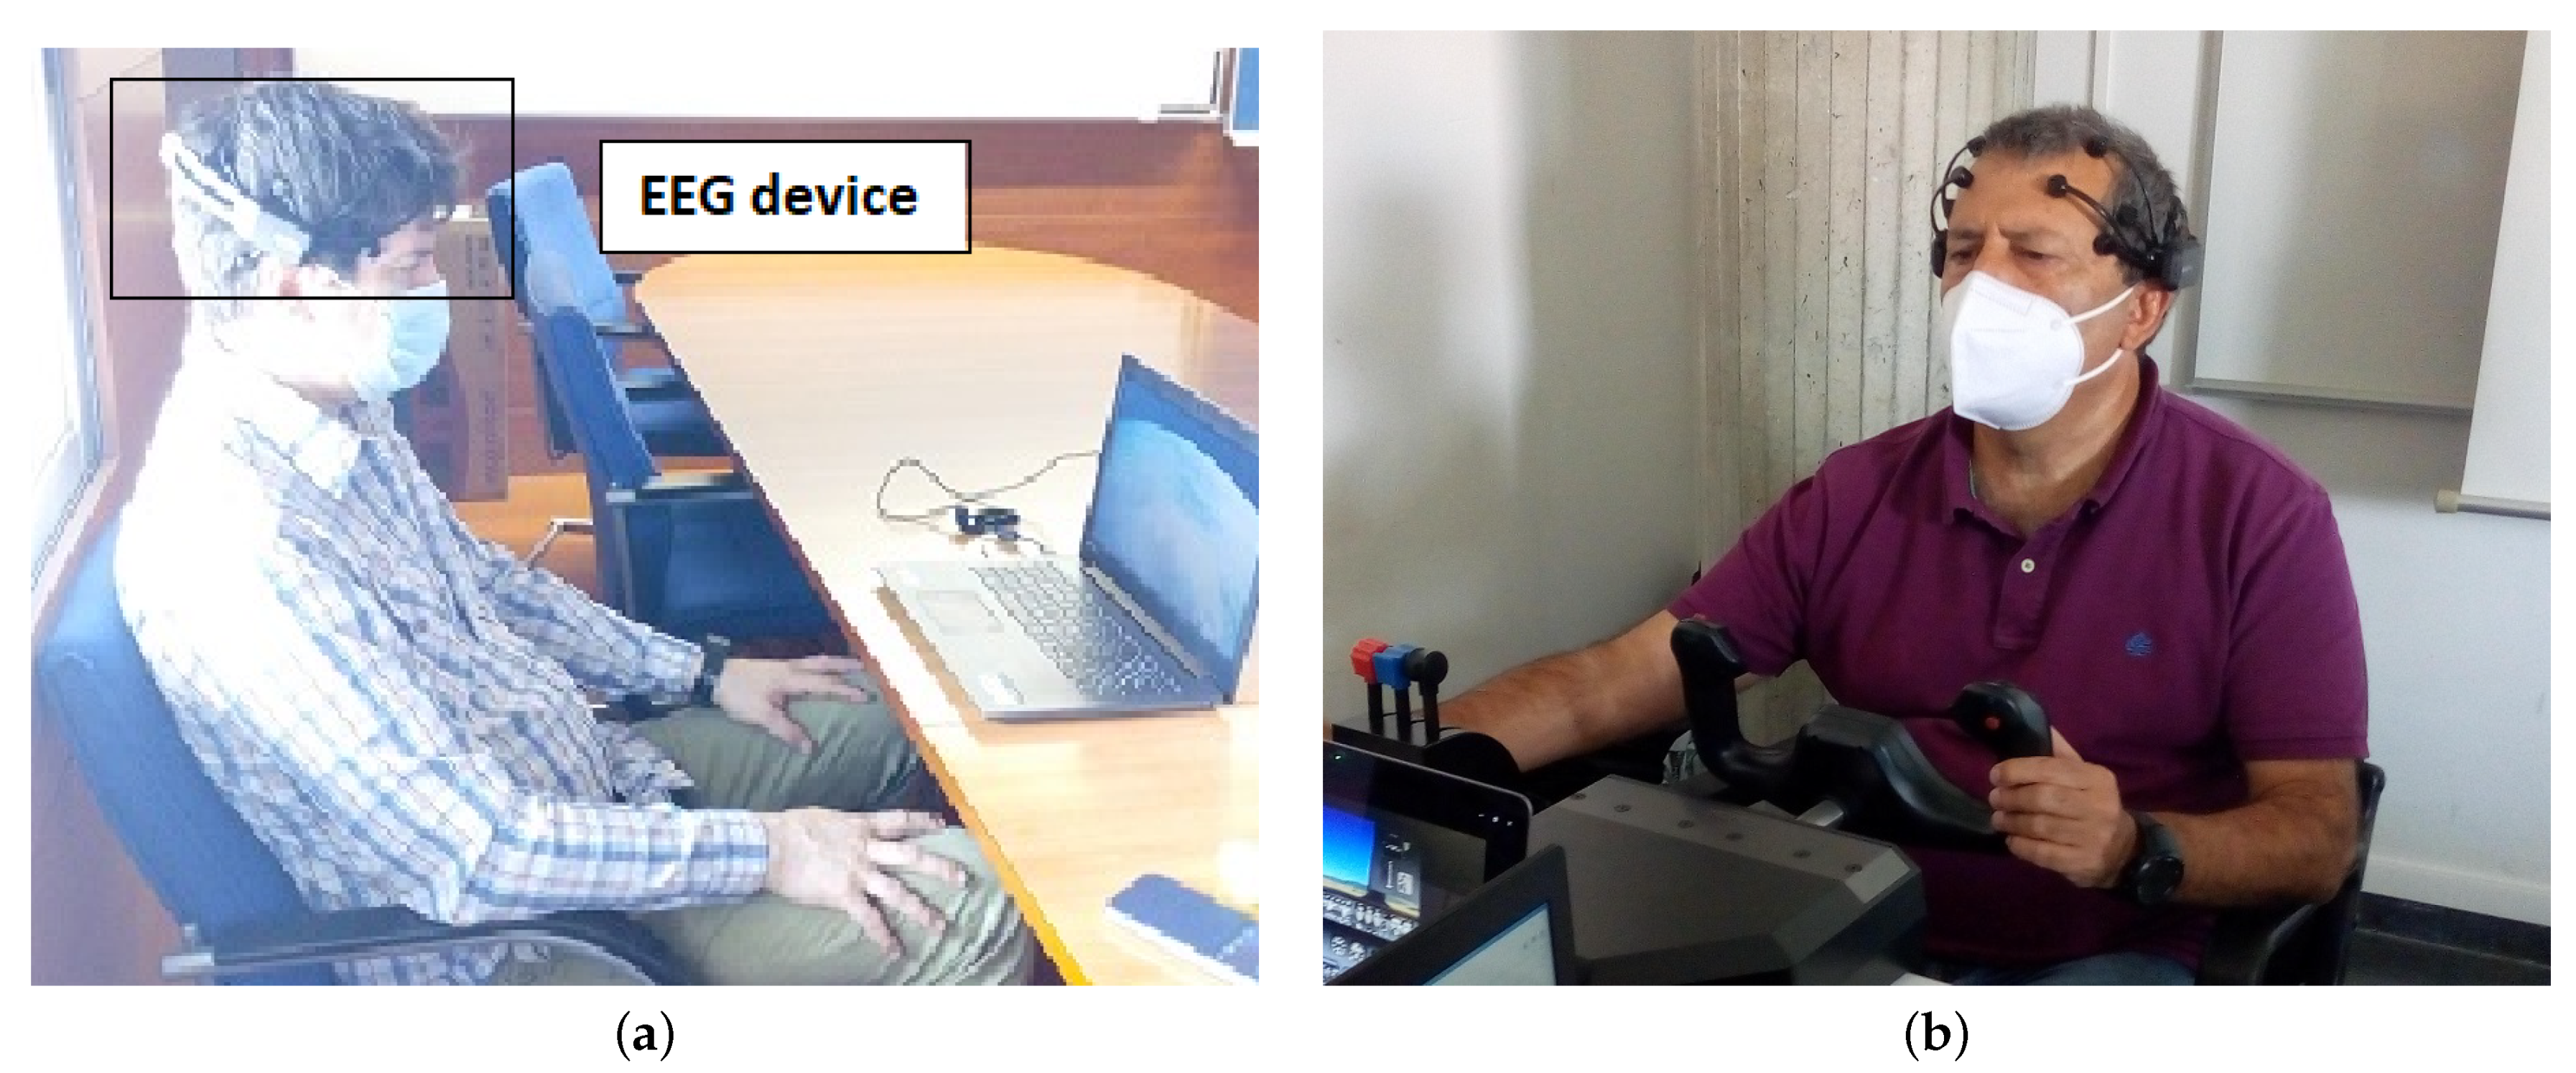
Figure 1 illustrates a volunteer during a session for the dual n-back test task (a) and a pilot during a simulated flight session (b).
4. Workload Recognition
In this section, we present our models, able to recognize between two levels of workload. Each method consists of two stages: First, raw input data are extracted from EEG signals and preprocessed to obtain the proper input data. Later, these signals are fed into the network model to automatically extract the features that will be further combined in a classifier step to discriminate among the number of classes previously determined (baseline vs. workload in our case).
4.1. Extracting Input Data from EEG Signals
For EEG recording, an EMOTIV EPOC+ headset [40] was used, which has 14 electrodes placed according to the 10/20 system. This sensor provides both raw data and power spectra for the main brain frequencies (, , , , and ). Given that proposed n-back tasks are memory demanding stressing games and baseline phases consist in watching a relaxing video, the theta wave [41] is the best candidate for discriminating the different mental loads of our experimental phases. In this work, we used the power spectrum of theta wave (4–8 Hz) sampled at 8 Hz.
Eye blinking and sudden head movements introduce abrupt sharp peaks of large amplitude in the power spectra wave that should be filtered before using them as predictors of a mental state [21]. In particular, we used an interquartile range (IQR) [42] filtering strategy to detect outlier values associated with muscular movement wave peaks. Our IQR filtering was based on setting the value of the 99% percentile of the distribution to all points above it.
To ensure a high quality of signals, we further filter data according to the quality of the EEG during recordings provided by the headset itself. For each sensor and recorded sample, Emotiv reports the quality of the recording in a discrete scale with values in the range 0–4 indicating how good the contact between sensor and head is: 4 for optimal—0 for none. For the sake of data with the highest possible quality while keeping a reasonable sample size, signals with a of bad recordings were discarded (<3). Further, since there is no evidence about what are the most discriminating sensors that best correlate with the detection of mental workload, the whole phase was discarded if the signals of two or more of the sensors were low quality. Finally, a subject was discarded if either all its base line or its workload phases were discarded, since, in this case, there were not enough data to define the binary classification. After this quality filtering, only 16 of the 20 subjects were selected for models training and testing.
In order to feed data to models, signals were cut in temporal windows. Notice that the size and overlap of the temporal windows might be a critical issue in order to properly include workload peaks [43]. For that we have used several window widths with different overlaps, obtaining the best results with 40 s windows overlapped 30 s. Thus, the input data of the networks were the concatenations of 40 s windows for the 14 EEG sensors (14 × 40 = 560-dimensional feature space). In order to account for the difference in units and magnitudes, input data were standardized using the mean and standard deviation of the training set.
4.2. Network Architectures
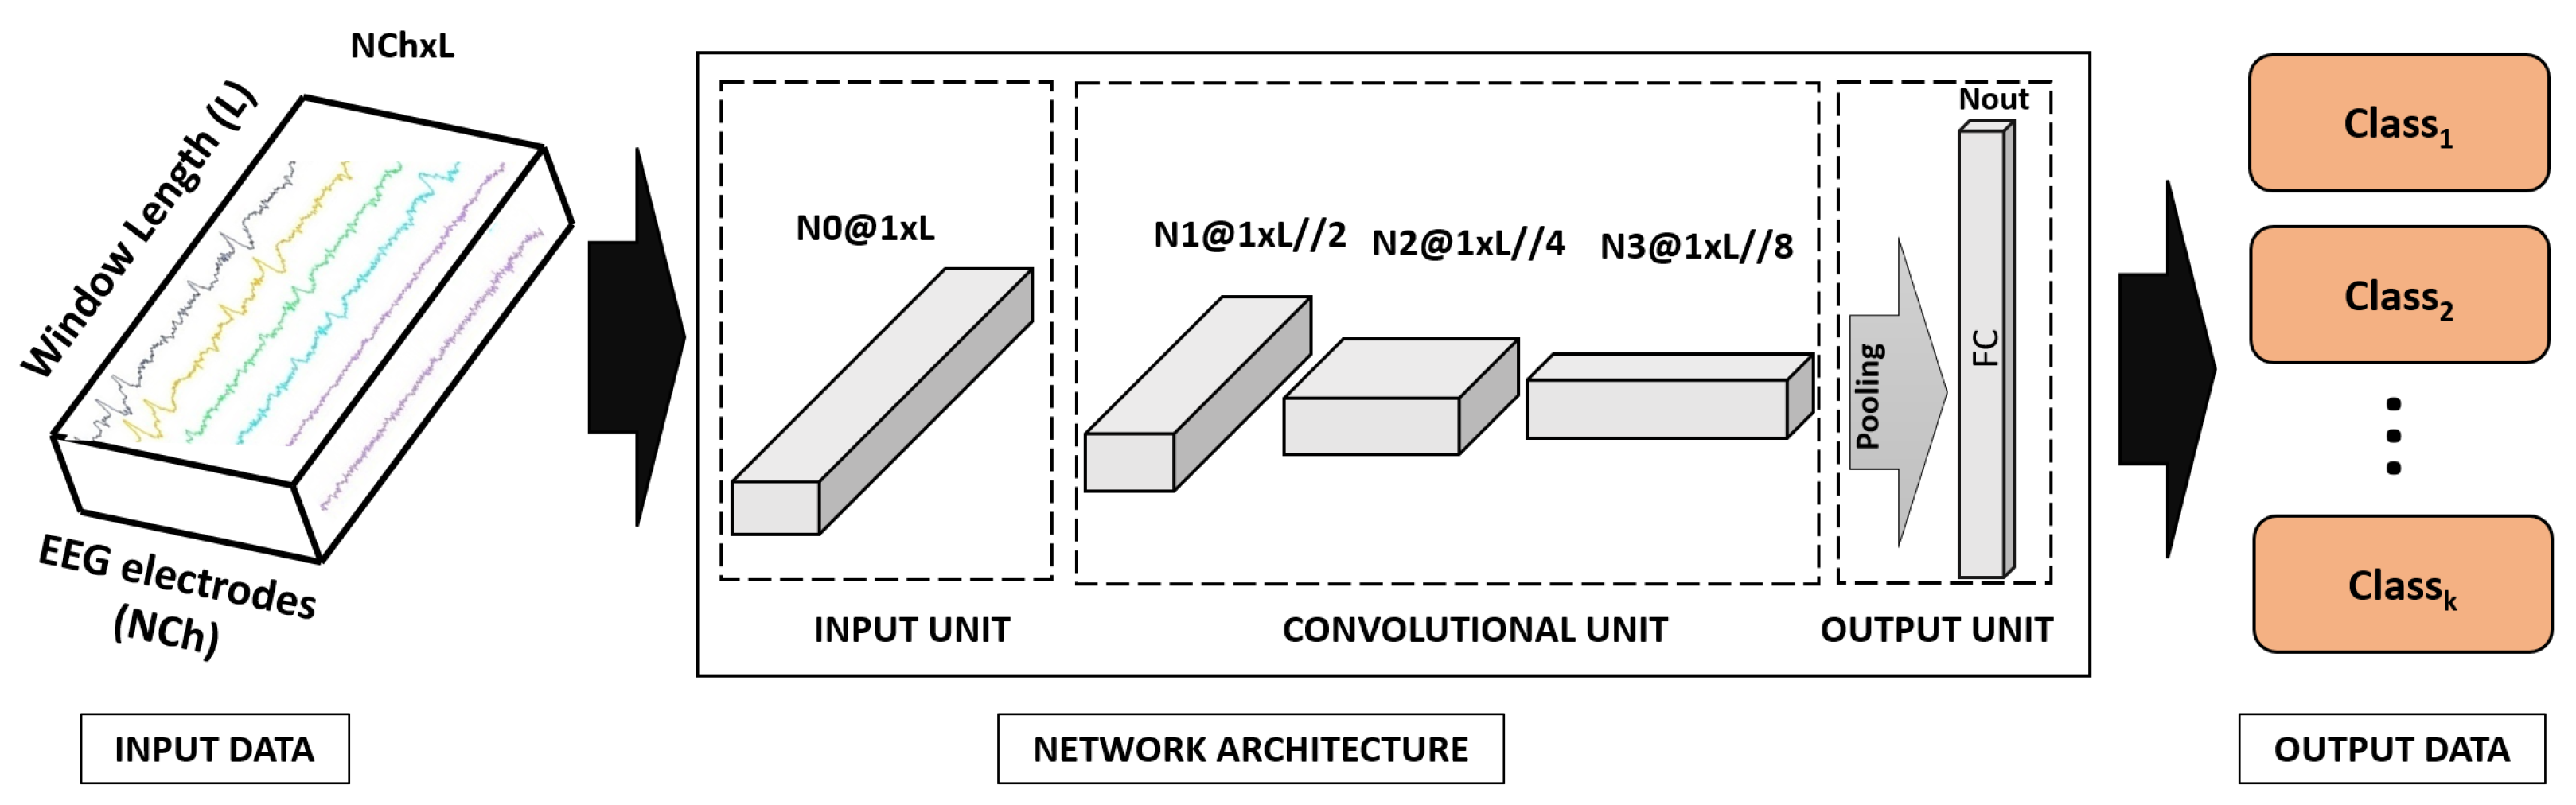
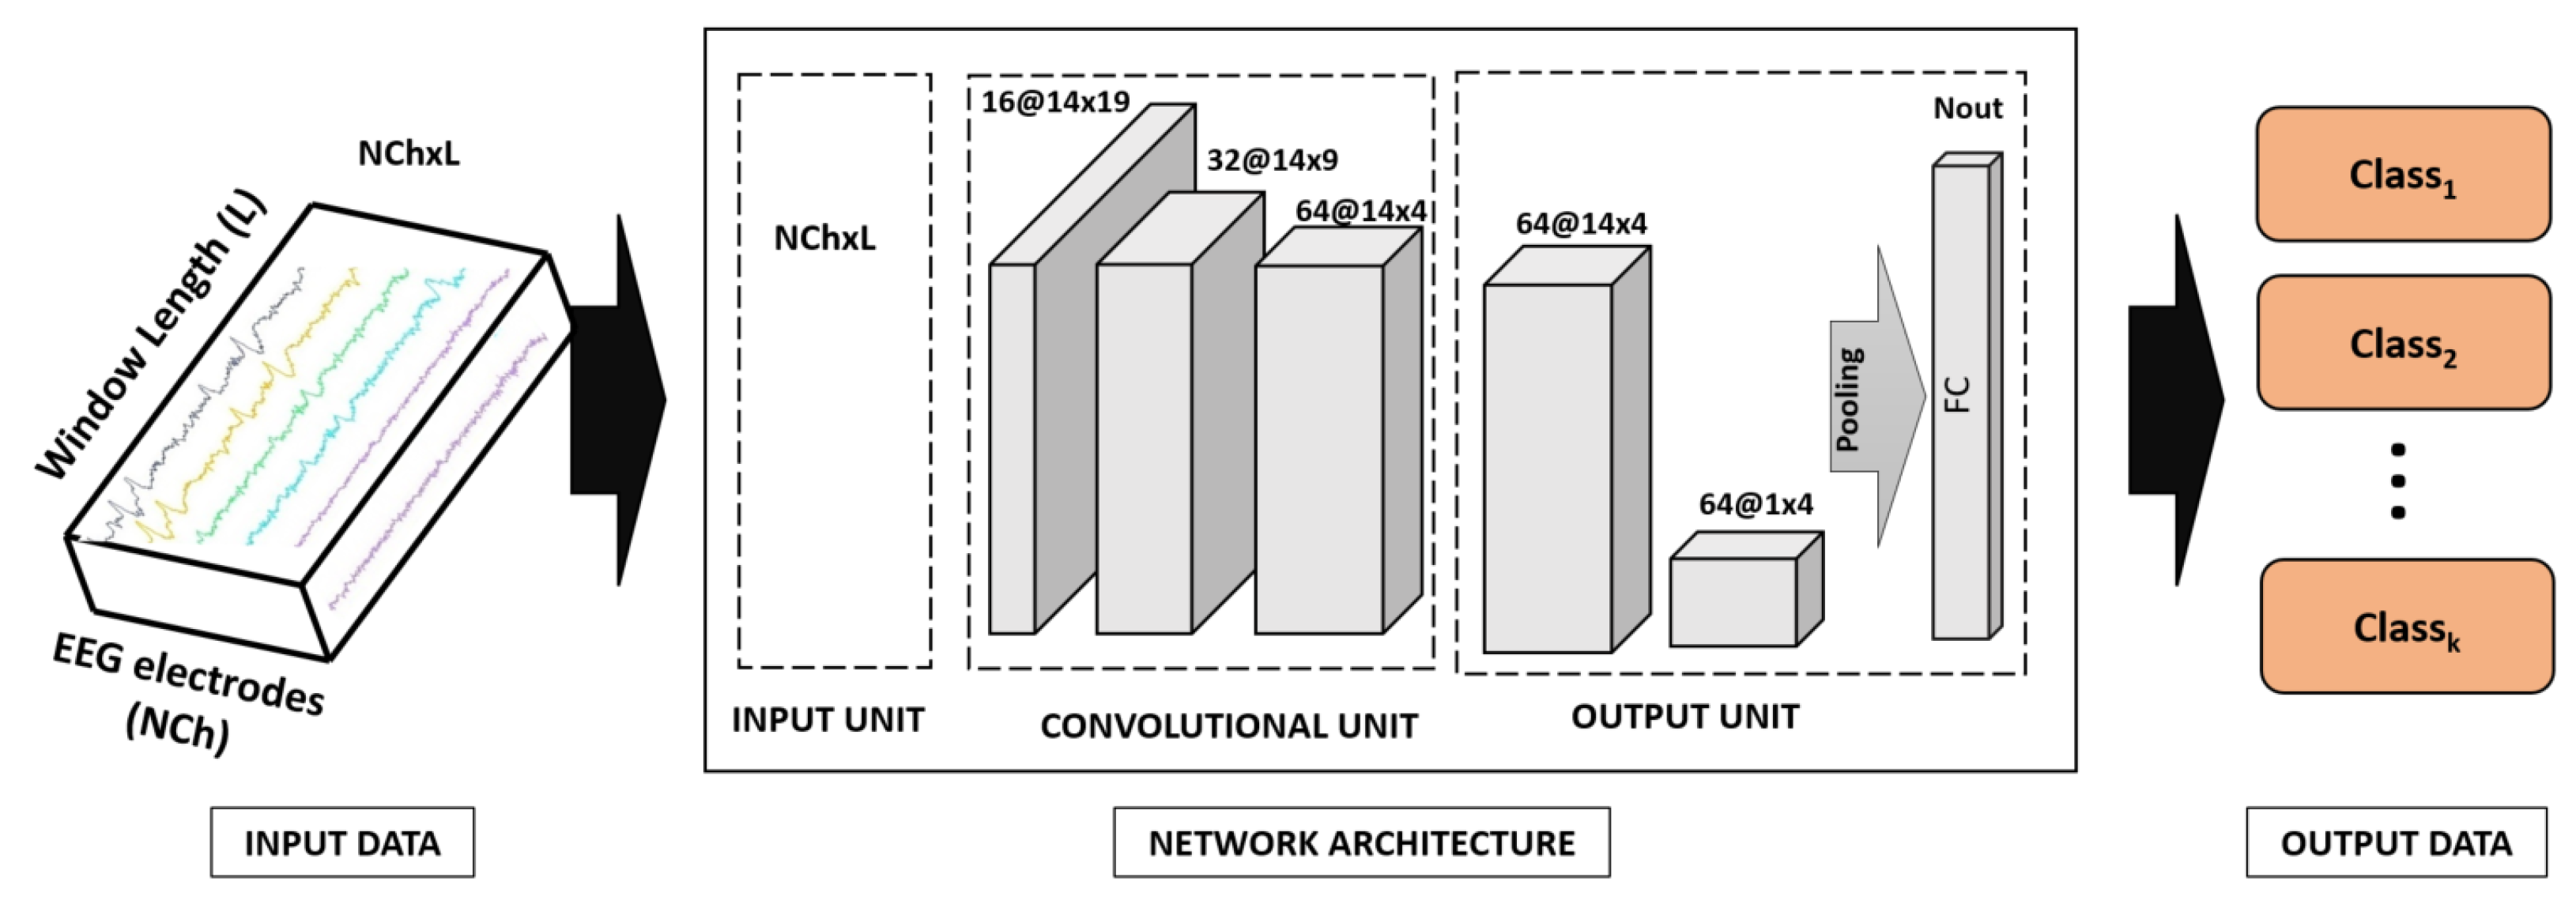
The spatio-temporal representation of EEG signals is an issue that any classification ML system has to face. The simplest question is when to combine the signals: before or after extracting features? As Figure 2 and Figure 3 show, we propose two architectures that differ in the moment when EEG sensor signals (channels) are projected: one projects input EEG sensors (input projector model) and the other one projects the convolutional features extracted from each EEG sensor (feature projector model). Each model has one input unit projecting EEG channels (if applicable), a convolutional unit equal for both models, and an output unit projecting the convolutional features extracted from each EEG sensor (if applicable). This output unit has a fully connected layer with sigmoid activation and output the number of classes. To account for different window lengths, we apply an average pooling before the classification layer. All convolutional layers use kernels of size 3 and stride 1 and have Relu activation.
The convolutional unit has 3 blocks consisting of one convolutional layer with max pooling and having 16, 32, and 64 neurons for each convolutional layer, respectively. The classification layer has 256 neurons. For the input projector model, the projection unit has one convolutional layer with 16 neurons. For the feature projector model, the output unit has 2 blocks consisting of one convolutional layer before the classification layer. The first one has 64 neurons, the second one projects convolutional features also using 64 neurons.
Although our main problem is a binary one, to ensure generalization capabilities of the classifier (including task transfer), we increased the diversity of the classifier by increasing the number of classes used to train the network. That is, our architecture was trained as a classifier to discriminate between a BL and WL classes using 4 different grouping of the data recorded from the 3 n-back tests:
- Binary problem (noted BLs-WL2) given by BL = (BL1, BL2, BL3) and WL2. That is, the BL class is defined by aggregating the baselines for the 3 games and WL class defined by the workload phase of the second experiment.
- Three class problem 1 (noted BLs-WL2-WL3) given by BL = (BL1, BL2, BL3), WL2 and WL3. That is, a BL class defined as before and two WL classes given by the workload phase of the second and third experiments.
- Three class problem 2 (noted WL1-WL2-WL3) given by WL1, WL2 and WL3. That is, a BL class defined by the workload phase of the first experiment and two WL classes given by the phase 2 of the second and third experiments.
- Four class problem (noted BLs-WL1-WL2-WL3) given by BL = (BL1, BL2, BL3), WL1, WL2 and WL3. That is, a BL class defined as in the first configuration and also defined by the workload phase of the first experiment and two WL classes given by the workload phase of the second and third experiments.
Unlike binary problems, in multiclass settings, the classifier does not predict the probability of belonging to each class. It rather gives a score of belongingness. It follows that the class predicted is not the one having a score above 0.5 (as is the case in binary problems), but the one having the largest value of the score predicted by the classifier. In our case, since the final class prediction is binary, we compute the binary class labels in the multiclass settings by binarizing first the output probabilities and then taking the maximum between the two as the final class label. The transformation between classifier output and BL-WL classes scores is as follows:
- BLs-WL2-WL3: The probability of BL is directly the probability of the train BL class, whereas the probability of the class WL it is the maximum of the probabilities of the WL2 and WL3 classes.
- WL1-WL2-WL3: The probability of the class BL is given the probability of the class WL1, whereas for the class WL it is the maximum of the probabilities of the WL2 and WL3 classes.
- BLs-WL1-WL2-WL3: The probability of the class BL is the maximum probability of the BL and WL1 classes, whereas for the class WL it is the maximum of the probabilities of the WL2 and WL3 classes.
5. Experimental Design
In order two validate the proposed models, two experiments were conducted:
5.1. Training and Validation Using N-Back-Test Data
To assess to what extent a model trained over a set of individuals can successfully predict a new unseen individual, we have used a generalist population model, where a single model using all subjects was trained to assess whether inter subject variability can be properly modeled. The validation of the capability for modeling a population was tested using a leave-one-out scheme to allow statistical analysis. Models were trained using a batch size of 750, a weighted cross-entropy loss to compensate unbalances between baseline and workload phases, Adam [44] as optimization method, 100 epochs, and a learning rate of 0.0001.
The performances of the different approaches for detection of mental workload were assessed using the accuracy (or sensitivity) for each class:
where TP = number of true positives and FN = number of false negatives. Sensitivity measures the ability of the system to detect BL and WL classes. Since we have a binary classification problem with WL the positive class, the sensitivity for BL corresponds to the specificity of the model.
5.2. Task Transfer Verification Using Flight Simulator Data
To assess the capability of our model for transfer learning, experiments were devoted to showing that the model trained to detect WL in a memory demanding task (n-back test) can detect an increase of WL associated with multitask procedures with interruptions decreasing performance.
The EEG signals of the flight dataset explained in Section 3 are intended to assess:
- Correlation of WL recognition with the number of tasks carried out by the pilot. Since we expected that the proportion of samples classified by our model as medium–high WL would be higher in the intervals where the PF performed more tasks, we show the percentages of predictions for BLs and each WL in correspondence with the number of tasks demanded.
- Correlation of WL recognition to flight complexity. Flights 2 and 4 were designed to have higher workloads than Flight 3 (Flight 1 is considered the baseline) so that the hypothesis is that the proportion of samples classified by the model as medium–high WL will be higher than in flight 3.
6. Results
In this section, we show and discuss the results obtained.
6.1. Training and Validation Using N-Back-Test Data
Table 1 and Table 2 summarize the recalls of baseline (BL) and workload (WL2) for the binarized models trained on different class problems for, respectively, the input and feature projector models. Tables show ranges for WL and BL detection computed for the 16 subjects after removing three outlying cases (80% of population) that all approaches failed to correctly predict.
For all cases, performance was more robust for the three-class problem, although specificity was better in the 2-class and 4-class problems. Regarding projection approaches, models projecting features achieved higher performance. In particular, the binary class feature projector model achieved an average detection of BL of 87.81% and a WL of 76.25%.
6.2. Task Transfer Verification Using Flight Simulator Data
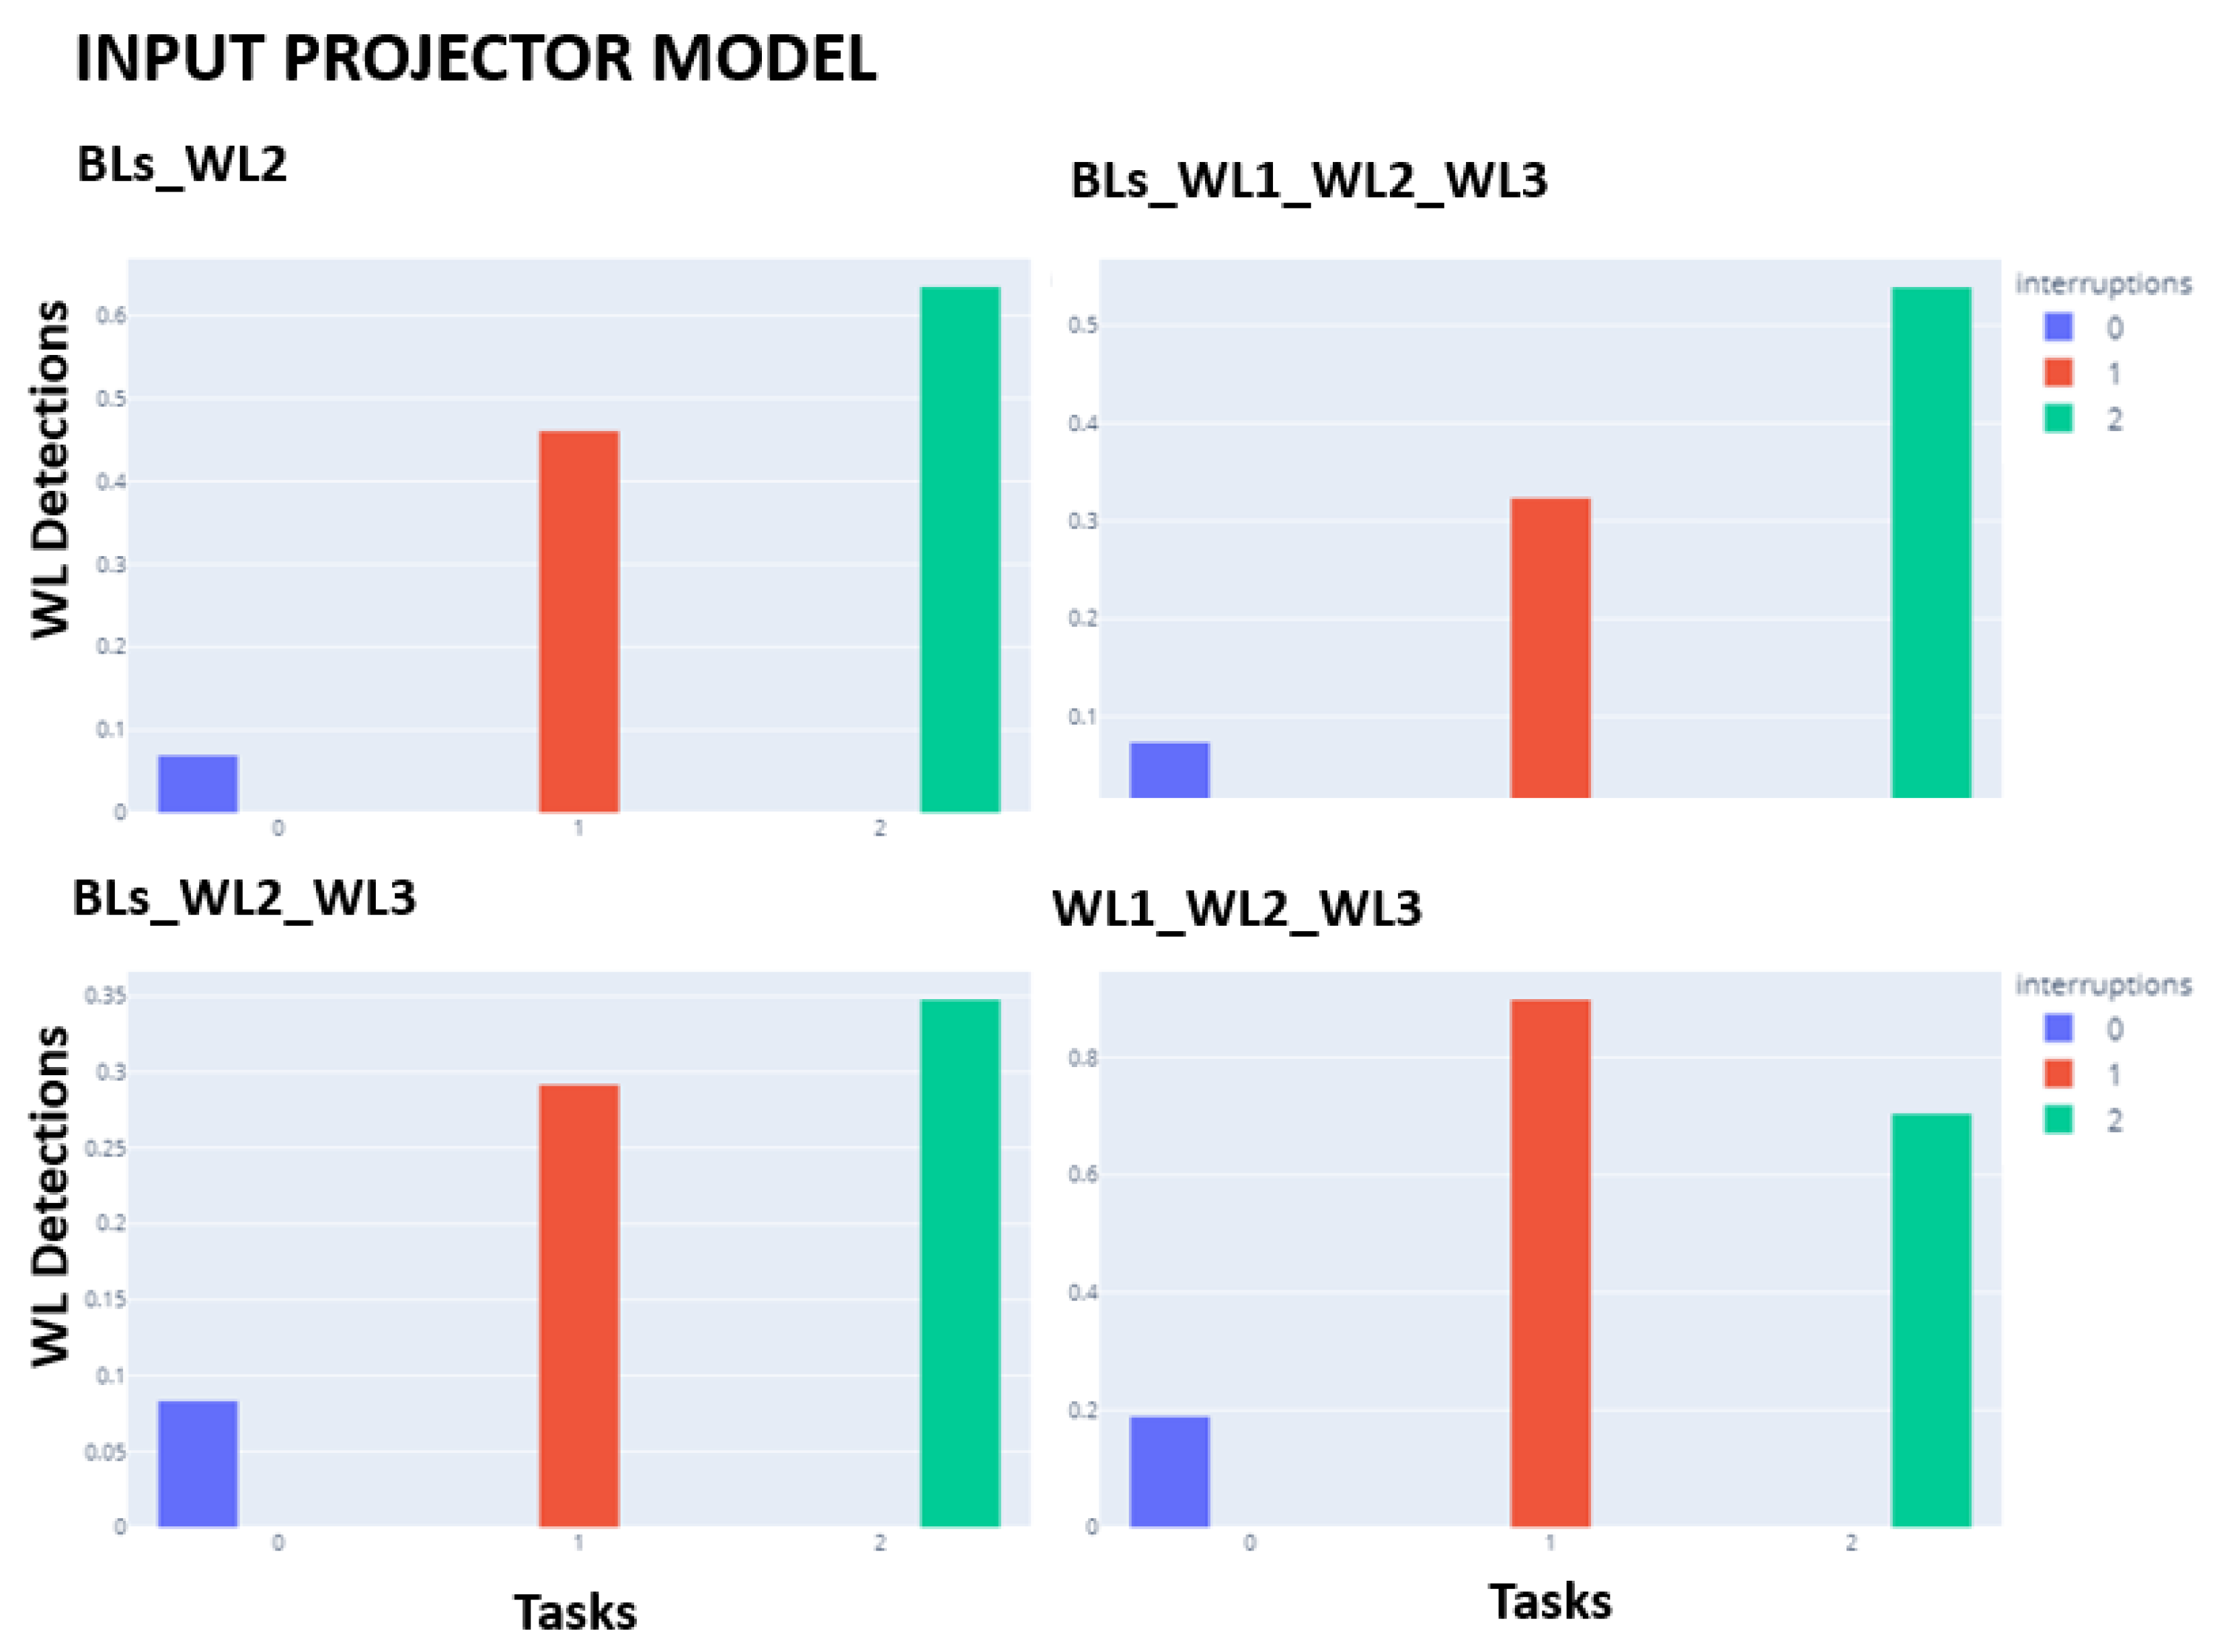
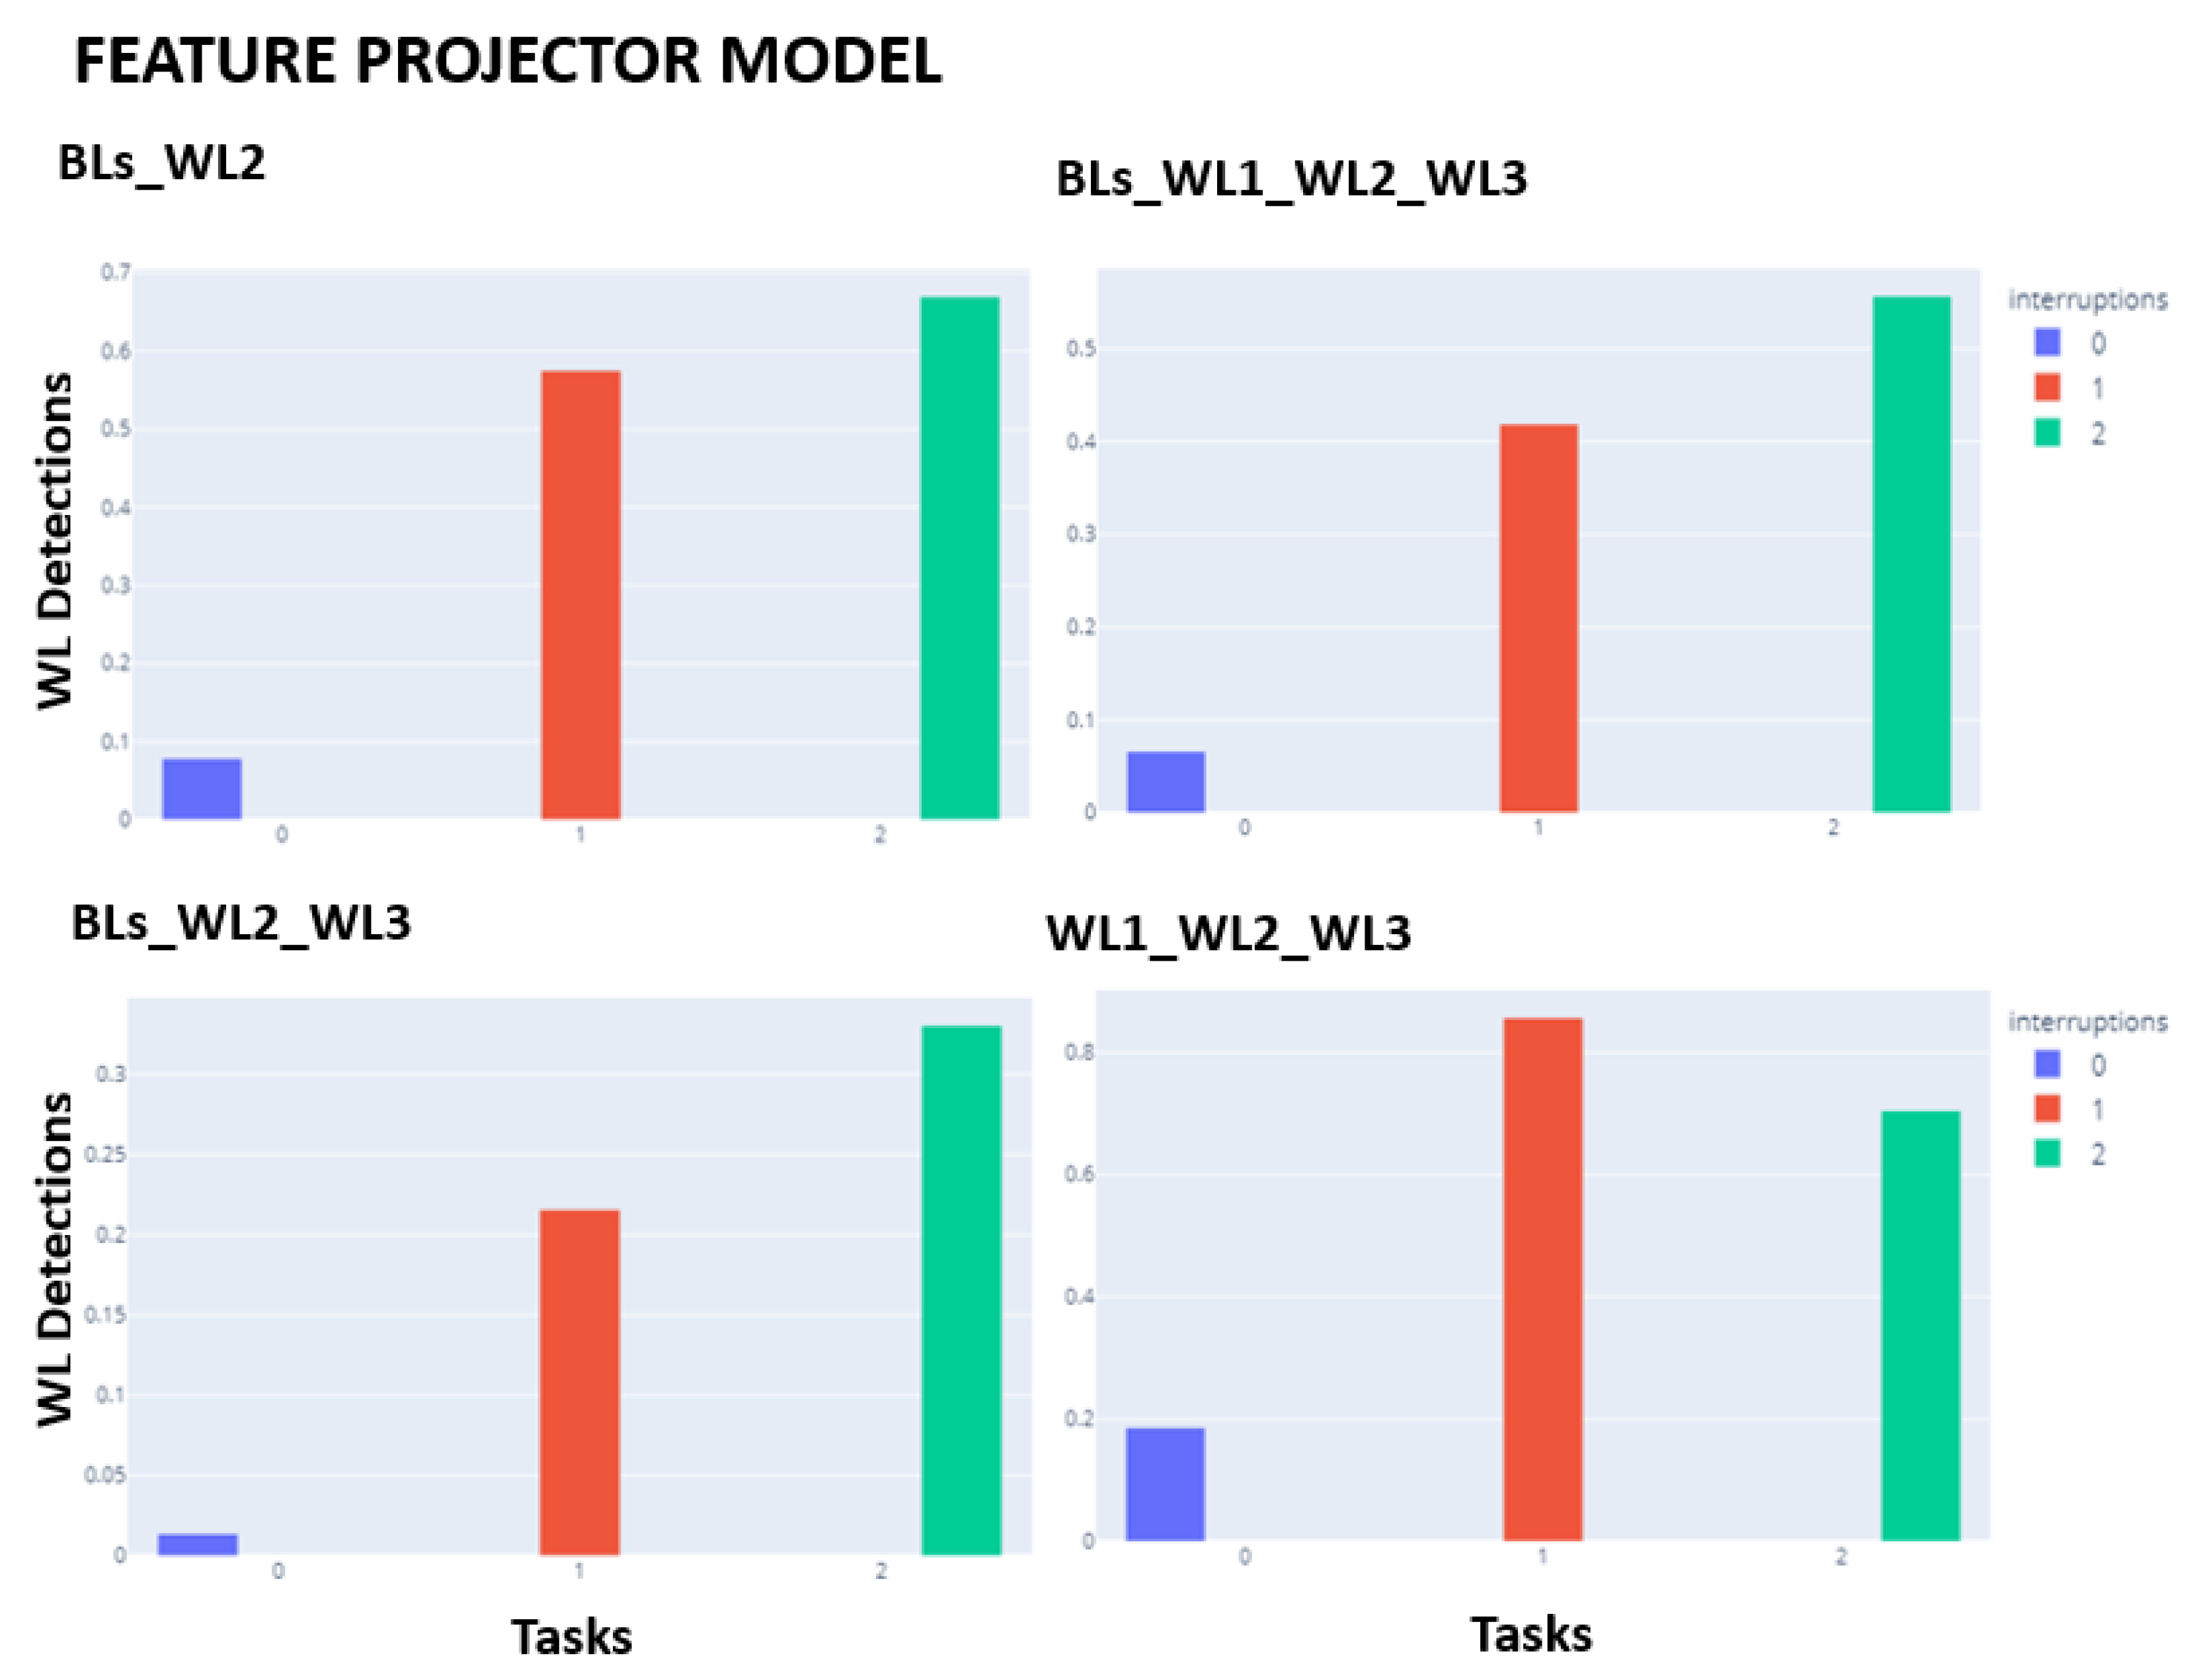
Barplots in Figure 4 and Figure 5 show the percentages of WL detection as a function of the number of interruptions (0, 1, or 2). The expected pattern was the percentage of WL detection increasing with the number of interruptions. For both projection models, the 3-class problem WL1_WL2_WL3 is the only model that does not follow the expected increasing pattern. For the remaining problems, both architectures seem to behave equally.
Figure 6 and Figure 7 show the barplots for the number of BL and WL predictions for the four flights. The expected pattern was to have the most detections in Flight 1, Flight 2, and Flight 4 (similar amounts of WL detected) and for Flight 3 to present a decrease in detected WL with respect these flights. Only the feature projector model follows the pattern expected. The most significant differences between flights are evident in the 3-class problem BLs_WL2_WL3, followed by the 4-class problem. The 3-class problem WL1_WL2_WL3 does not apparently detect any difference among Flight 3 and Flight 4.
7. Conclusions
In this paper, we have presented two different approaches to the fusion of EEG sensor signals. Models were trained and validated on self-designed games (one serious game and one flight simulator with specific scenarios) to ensure unambiguous annotations. Models were trained and validated on the serious game using a one-subject-out scheme; and simulator data gathered from a subject not included in the training data were used to evaluate transfer capability.
Results show that between the two models, projecting convolutional feature channels achieved higher performance, with 76.25% sensitivity and 87.81% specificity in WL detection in n-back-test leave-one-out subject evaluation and good task transfer with the detected WL increasing with the number of interruptions. Although these results provide evidence of the ability of the EEG sensor to discern between more and less demanding tasks—increasing the evidence the robustness of the EEG and its ability to transfer tasks—the fact that the 3-class problem BLs_WL2_WL3 does not correlate with flight complexity suggests the following improvements.
A delicate issue that has an impact on the performances of methods is the filtering of signals required to remove muscular motion peaks and other artifacts. EEG pre-processing approaches have not been standardized, and even small changes in the artifact removal strategy may result in differences with large effects on particular portions of the signal. In this study, we have adopted a filtering approach based on signal probabilistic distribution for outlier removal in the temporal space. We consider that muscular motion could be filtered calibrating muscular signals before test recording to set either the values or the frequency ranges associated with muscular motion.
Some studies claim the importance of considering multiple aspects of a user’s state when developing cognitive state detection algorithms [45]. Consequently, affective state should be considered.
Given that the way EEG sensors are fused has a direct impact in performance of models, alternative architectures should be further investigated. In this context, a direct improvement would be to consider ensemble models processing each sensor separately with own-learned weights. Furthermore, more recent architectures such as convolutional/LSTM and Lambda Nets that include attention modeling should be also studied.
Author Contributions
Conceptualization, D.G. and M.À.P.; methodology, P.F., A.H.-S. and D.G.; software, P.F. and J.Y.; validation, J.Y., P.F., A.H.-S. and D.G.; formal analysis, A.H.-S. and D.G.; investigation, P.F., A.H.-S. and D.G.; resources, M.À.P.; data curation, J.Y. and P.F.; writing—original draft preparation, J.Y. and A.H.-S.; writing—review and editing, A.H.-S. and D.G.; visualization, J.Y. and A.H.-S.; supervision, D.G., A.H.-S. and M.À.P.; project administration, M.À.P. and D.G.; funding acquisition, M.À.P. All authors have read and agreed to the published version of the manuscript.
Funding
This research was partially funded by Cleansky, grant number 831993, Ministerio de Ciencia e Innovación (MCI), Agencia Estatal de Investigación (AEI) and Fondo Europeo de Desarrollo Regional (FEDER), RTI2018-095209-B-C21 (MCI/AEI/FEDER, UE); Agència de Gestió d’Ajuts Universitaris i de Recerca grant numbers 2017-SGR-1597 and 2017-SGR-1624; and CERCA Programme/Generalitat de Catalunya.
Institutional Review Board Statement
Ethical review and approval were waived for this study, because data collected was not identifiable human material (the only data collected are anonymised EEG signals without any other information). Even so, participants were provided with information on the purpose, and on the content of the research. They were also given the choice to participate by agreeing to this information, or to not participate, and could quit the experiments at any moment. All this is in line with regulations on the use of personal information in scientific research in Spain.
Informed Consent Statement
Informed consent was obtained from all subjects involved in the study.
Data Availability Statement
Publicly available datasets were analyzed in this study. These data can be found here: http://iam.cvc.uab.es/portfolio/e-pilots-dataset/ accessed on 7 February 2022.
Acknowledgments
Authors would like to thank Carles Sánchez for his help in the revision of the paper. DGil is a Serra Hunter Fellow. DGil would like to dedicate this work to her mother Esther Resina Enfedaque, the best woman ever.
Conflicts of Interest
The authors declare no conflict of interest.
References
- Latorella, K.A. Investigating Interruptions: Implications for Flightdeck Performance; NASA: Washington, DC, USA, 1999; Volume 99. [Google Scholar]
- Foroughi, C.K.; Werner, N.E.; McKendrick, R.; Cades, D.M.; Boehm-Davis, D.A. Individual differences in working-memory capacity and task resumption following interruptions. J. Exp. Psychol. Learn. Mem. Cogn. 2016, 42, 1480. [Google Scholar] [CrossRef]
- Oulasvirta, A.; Saariluoma, P. Long-term working memory and interrupting messages in human–computer interaction. Behav. Inf. Technol. 2004, 23, 53–64. [Google Scholar] [CrossRef]
- Kirmeyer, S.L. Coping with competing demands: Interruption and the type A pattern. J. Appl. Psychol. 1988, 73, 621. [Google Scholar] [CrossRef] [Green Version]
- Cellier, J.M.; Eyrolle, H. Interference between switched tasks. Ergonomics 1992, 35, 25–36. [Google Scholar] [CrossRef]
- Zhang, P.; Wang, X.; Zhang, W.; Chen, J. Learning Spatial-Spectral-Temporal EEG Features With Recurrent 3D Convolutional Neural Networks for Cross-Task Mental Workload Assessment. IEEE Trans. Neural Syst. Rehabil. Eng. 2019, 27, 31–42. [Google Scholar] [CrossRef]
- Li, D.; Wang, X.; Menassa, C.C.; Kamat, V.R. Understanding the impact of building thermal environments on occupants’ comfort and mental workload demand through human physiological sensing. In Start-Up Creation; Elsevier: Amsterdam, The Netherlands, 2020; pp. 291–341. [Google Scholar]
- Hendy, K.C.; Liao, J.; Milgram, P. Combining time and intensity effects in assessing operator information-processing load. Hum. Factors 1997, 39, 30–47. [Google Scholar] [CrossRef]
- Heine, T.; Lenis, G.; Reichensperger, P.; Beran, T.; Doessel, O.; Deml, B. Electrocardiographic features for the measurement of drivers’ mental workload. Appl. Ergon. 2017, 61, 31–43. [Google Scholar] [CrossRef]
- Han, S.Y.; Kwak, N.S.; Oh, T.; Lee, S.W. Classification of pilots’ mental states using a multimodal deep learning network. Biocybern. Biomed. Eng. 2020, 40, 324–336. [Google Scholar] [CrossRef]
- Zhang, P.; Wang, X.; Chen, J.; You, W.; Zhang, W. Spectral and Temporal Feature Learning with Two-Stream Neural Networks for Mental Workload Assessment. IEEE Trans. Neural Syst. Rehabil. Eng. 2019, 27, 1149–1159. [Google Scholar] [CrossRef]
- Lee, D.H.; Jeong, J.H.; Kim, K.; Yu, B.W.; Lee, S.W. Continuous EEG Decoding of Pilots’ Mental States Using Multiple Feature Block-Based Convolutional Neural Network. IEEE Access 2020, 8, 121929–121941. [Google Scholar] [CrossRef]
- Wu, E.Q.; Peng, X.; Zhang, C.Z.; Lin, J.; Sheng, R.S. Pilots’ fatigue status recognition using deep contractive autoencoder network. IEEE Trans. Instrum. Meas. 2019, 68, 3907–3919. [Google Scholar]
- Averty, P.; Collet, C.; Dittmar, A.; Athènes, S.; Vernet-Maury, E. Mental workload in air traffic control: An index constructed from field tests. Aviat. Space Environ. Med. 2004, 75, 333–341. [Google Scholar]
- Da Silva, F.P. Mental Workload, Task Demand and Driving Performance: What Relation? Procedia-Soc. Behav. Sci. 2014, 162, 310–319. [Google Scholar] [CrossRef] [Green Version]
- Hart, S.G. NASA-task load index (NASA-TLX); 20 years later. In Proceedings of the Human Factors and Ergonomics Society Annual Meeting; Sage Publications: Los Angeles, CA, USA, 2006; Volume 50, pp. 904–908. [Google Scholar]
- Borghini, G.; Astolfi, L.; Vecchiato, G.; Mattia, D.; Babiloni, F. Measuring neurophysiological signals in aircraft pilots and car drivers for the assessment of mental workload, fatigue and drowsiness. Neurosci. Biobehav. Rev. 2014, 44, 58–75. [Google Scholar] [CrossRef]
- Hart, S.G.; Staveland, L.E. Development of NASA-TLX (Task Load Index): Results of empirical and theoretical research. In Advances in Psychology; Elsevier: Amsterdam, The Netherlands, 1988; pp. 139–183. [Google Scholar]
- Wickens, C.D. Situation awareness and workload in aviation. Curr. Dir. Psychol. Sci. 2002, 11, 128–133. [Google Scholar] [CrossRef]
- Parasuraman, R.; Sheridan, T.B.; Wickens, C.D. Situation awareness, mental workload, and trust in automation: Viable, empirically supported cognitive engineering constructs. J. Cogn. Eng. Decis. Mak. 2008, 2, 140–160. [Google Scholar] [CrossRef]
- Wang, Z.; Yang, L.; Ding, J. Application of heart rate variability in evaluation of mental workload. Chin. J. Ind. Hyg. Occup. Dis. 2005, 23, 182–184. [Google Scholar]
- Stanton, N.; Salmon, P.M.; Rafferty, L.A. Human Factors Methods: A Practical Guide for Engineering and Design; Ashgate Publishing, Ltd.: Farnham, UK, 2013. [Google Scholar]
- Jang, E.H.; Park, B.J.; Kim, S.H.; Chung, M.A.; Park, M.S.; Sohn, J.H. Classification of human emotions from physiological signals using machine learning algorithms. In Proceedings of the Sixth International Conference on Advances in Computer-Human Interactions 2013 (ACHI 2013), Nice, France, 24 February–1 March 2013; Citeseer: Princeton, NJ, USA, 2013; pp. 395–400. [Google Scholar]
- Rim, B.; Sung, N.J.; Min, S.; Hong, M. Deep learning in physiological signal data: A survey. Sensors 2020, 20, 969. [Google Scholar] [CrossRef] [Green Version]
- Ziegler, M.D.; Russell, B.A.; Kraft, A.E.; Krein, M.; Russo, J.; Casebeer, W.D. Computational Models for Near-real-time Performance Predictions Based on Physiological Measures of Workload. In Neuroergonomics; Elsevier: Amsterdam, The Netherlands, 2019; pp. 117–120. [Google Scholar]
- Secerbegovic, A.; Ibric, S.; Nisic, J.; Suljanovic, N.; Mujcic, A. Mental workload vs. stress differentiation using single-channel EEG. In CMBEBIH 2017; Springer: Berlin/Heidelberg, Germany, 2017; pp. 511–515. [Google Scholar]
- Ismail Fawaz, H.; Forestier, G.; Weber, J.; Idoumghar, L.; Muller, P.A. Deep Learning for Time Series Classification: A Review. Data Min. Knowl. Discov. 2019, 33, 917–963. [Google Scholar] [CrossRef] [Green Version]
- Faust, O.; Hagiwara, Y.; Hong, T.J.; Lih, O.S.; Acharya, U.R. Deep learning for healthcare applications based on physiological signals: A review. Comput. Methods Programs Biomed. 2018, 161, 1–13. [Google Scholar] [CrossRef]
- Zhang, Y.; Chen, J.; Tan, J.H.; Chen, Y.; Chen, Y.; Li, D.; Yang, L.; Su, J.; Huang, X.; Che, W. An investigation of deep learning models for EEG-based emotion recognition. Front. Neurosci. 2020, 14, 1344. [Google Scholar] [CrossRef]
- Venkatachalam, K.; Devipriya, A.; Maniraj, J.; Sivaram, M.; Ambikapathy, A.; Iraj, S.A. A Novel Method of motor imagery classification using eeg signal. Artif. Intell. Med. 2020, 103, 101787. [Google Scholar]
- Zhao, W.; Wang, W. SeizureNet: A model for robust detection of epileptic seizures based on convolutional neural network. Cogn. Comput. Syst. 2020, 2, 119–124. [Google Scholar] [CrossRef]
- Zhang, X.; Xu, M.; Li, Y.; Su, M.; Xu, Z.; Wang, C.; Kang, D.; Li, H.; Mu, X.; Ding, X.; et al. Automated multi-model deep neural network for sleep stage scoring with unfiltered clinical data. Sleep Breath. 2020, 4, 581–590. [Google Scholar] [CrossRef] [Green Version]
- Saadati, M.; Nelson, J.; Ayaz, H. Convolutional Neural Network for Hybrid fNIRS-EEG Mental Workload Classification. In Advances in Neuroergonomics and Cognitive Engineering; Ayaz, H., Ed.; Springer International Publishing: Cham, Switzerland, 2020; pp. 221–232. [Google Scholar]
- Kwak, Y.; Kong, K.; Song, W.J.; Min, B.K.; Kim, S.E. Multilevel feature fusion with 3d convolutional neural network for eeg-based workload estimation. IEEE Access 2020, 8, 16009–16021. [Google Scholar] [CrossRef]
- Ziegler, M.D.; Kraft, A.; Krein, M.; Lo, L.C.; Hatfield, B.; Casebeer, W.; Russell, B. Sensing and assessing cognitive workload across multiple tasks. In International Conference on Augmented Cognition; Springer: Cham, Switzerland, 2016; pp. 440–450. [Google Scholar]
- Jaeggi, S.M.; Buschkuehl, M.; Jonides, J.; Perrig, W.J. Improving fluid intelligence with training on working memory. Proc. Natl. Acad. Sci. USA 2008, 105, 6829–6833. [Google Scholar] [CrossRef] [Green Version]
- Bokade, R.; Navato, A.; Ouyang, R.; Jin, X.; Chou, C.A.; Ostadabbas, S.; Mueller, A.V. A cross-disciplinary comparison of multimodal data fusion approaches and applications: Accelerating learning through trans-disciplinary information sharing. Expert Syst. Appl. 2021, 165, 113885. [Google Scholar] [CrossRef]
- Yauri, J.; Hernández-Sabaté, A.; Folch, P.; Gil, D. Mental Workload Detection Based on EEG Analysis. In Artificial Intelligence Research and Development; IOS Press: Amsterdam, The Netherlands, 2021; pp. 268–277. [Google Scholar]
- Piera, M.A.; Ramos, J.J.; Muñoz, J.L. A socio-technical holistic agent based model to assess cockpit supporting tools performance variability. IFAC-PapersOnLine 2019, 52, 122–127. [Google Scholar] [CrossRef]
- Emotiv. EMOTIV EPOC+ 14-Channel Wireless EEG Headset; Emotiv: San Francisco, CA, USA, 2021. [Google Scholar]
- Addante, R.J.; Watrous, A.J.; Yonelinas, A.P.; Ekstrom, A.D.; Ranganath, C. Prestimulus Theta Activity Predicts Correct Source Memory Retrieval. Proc. Natl. Acad. Sci. USA 2011, 108, 10702–10707. [Google Scholar] [CrossRef] [Green Version]
- Wasserman, L. All of Statistics: A Concise Course in Statistical Inference; Springer: Berlin/Heidelberg, Germany, 2010. [Google Scholar]
- Gupta, S.S.; Taori, T.J.; Ladekar, M.Y.; Manthalkar, R.R.; Gajre, S.S.; Joshi, Y.V. Classification of cross task cognitive workload using deep recurrent network with modelling of temporal dynamics. Biomed. Signal Process. Control 2021, 70, 103070. [Google Scholar] [CrossRef]
- Kingma, D.P.; Ba, J. Adam: A Method for Stochastic Optimization. In Proceedings of the 3rd International Conference on Learning Representations, ICLR 2015-Conference Track Proceedings, Banff, AB, Canada, 14–16 April 2014. [Google Scholar]
- Bagheri, M.; Power, S.D. EEG-based detection of mental workload level and stress: The effect of variation in each state on classification of the other. J. Neural Eng. 2020, 17, 056015. [Google Scholar] [CrossRef]
Figure 1.
Data collection with Emotiv Epoc+ headset. (a) A volunteer during a n-back-test and (b) a pilot during simulated flight session.
Figure 1.
Data collection with Emotiv Epoc+ headset. (a) A volunteer during a n-back-test and (b) a pilot during simulated flight session.

Figure 2.
Architecture of the input projector model.

Figure 3.
Architecture of the feature projector model.

Figure 4.
FRAM tasks barplots of WL predictions for the input projector model.

Figure 5.
FRAM tasks barplots of WL predictions for the feature projector model.

Figure 6.
Flight test barplots of WL predictions for the input projector model.

Figure 7.
Flight test barplots of WL predictions for the feature projector model.


Table 1.
Input projector model binarized.
| All Population | 80% of Population | ||
|---|---|---|---|
| BL-WL2 | BL | ||
| WL | |||
| BLs-WL2-WL3 | BL | ||
| WL | |||
| WL1-WL2-WL3 | BL | ||
| WL | |||
| BLs-WL1-WL2-WL3 | BL | ||
| WL |
Table 2.
Feature projector model binarized.
| All Population | 80% of Population | ||
|---|---|---|---|
| BL-WL2 | BL | ||
| WL | |||
| BLs-WL2-WL3 | BL | ||
| WL | |||
| WL1-WL2-WL3 | BL | ||
| WL | |||
| BLs-WL1-WL2-WL3 | BL | ||
| WL |
Publisher’s Note: MDPI stays neutral with regard to jurisdictional claims in published maps and institutional affiliations. |
© 2022 by the authors. Licensee MDPI, Basel, Switzerland. This article is an open access article distributed under the terms and conditions of the Creative Commons Attribution (CC BY) license (https://creativecommons.org/licenses/by/4.0/).
Share and Cite
MDPI and ACS Style
Hernández-Sabaté, A.; Yauri, J.; Folch, P.; Piera, M.À.; Gil, D. Recognition of the Mental Workloads of Pilots in the Cockpit Using EEG Signals. Appl. Sci. 2022, 12, 2298. https://doi.org/10.3390/app12052298
AMA Style
Hernández-Sabaté A, Yauri J, Folch P, Piera MÀ, Gil D. Recognition of the Mental Workloads of Pilots in the Cockpit Using EEG Signals. Applied Sciences. 2022; 12(5):2298. https://doi.org/10.3390/app12052298
Chicago/Turabian StyleHernández-Sabaté, Aura, José Yauri, Pau Folch, Miquel Àngel Piera, and Debora Gil. 2022. "Recognition of the Mental Workloads of Pilots in the Cockpit Using EEG Signals" Applied Sciences 12, no. 5: 2298. https://doi.org/10.3390/app12052298
Note that from the first issue of 2016, this journal uses article numbers instead of page numbers. See further details here.