

Abstract
Experiments in which CO2 gas was generated by the yeast fermentation of sugar in an elastic layer of gelatine gel confined between two glass plates are described and analyzed theoretically. The CO2 gas pressure causes the gel layer to fracture. The gas produced is drained on short length scales by diffusion and on long length scales by flow in a fracture network, which has topological properties that are intermediate between river networks and hierarchical-fracture networks. A simple model for the experimental system with two parameters that characterize the disorder and the intermediate (river-fracture) topology of the network was developed and the results of the model were compared with the experimental results.
Export citation and abstract BibTeX RIS

Published by the EPLA under the terms of the Creative Commons Attribution 3.0 License (CC-BY). Further distribution of this work must maintain attribution to the author(s) and the published article's title, journal citation, and DOI.
Introduction
The formation of many branched, hierarchical networks such as rivers, blood vessels, leaf veins, lightning, etc. are the responses of physical systems to the transport of fluids, substances dissolved in fluids or charge. Such directed tree networks are efficient transport systems and they have characteristic statistical properties [1–4]. It has been postulated that river networks and the landscapes associated with them minimize hydrodynamic energy dissipation [3]. The evolution of river networks is controlled primarily by erosion, an interaction between flowing water and the landscape that does not extend beyond the local drainage basin [4].
Fracture networks are localized strain responses to stress beyond the elastic limits of solids and the fracture network characteristics can reveal the nature of the elastic loading, be it external shear, compression or tension, or generated by material shrinkage [5–7] or by overpressured fluids inside the solid [8]. Even if the fluid pressure in fractures is increased only locally, the elastic interactions are long ranged and local pressure increases may have long-range effects such as triggering earthquakes [9, 10]. While the statistical topology of river networks has been investigated for almost 70 years [11], the statistical description of fractures [12] has only recently been extended to fracture network topologies [13].
Hydraulic fracturing, used by the petroleum industry to enhance the permeability of reservoir rocks, is induced by injecting a fluid at high pressure into the rock via a cased, cemented and perforated well. In some geological processes large fluid pressures are generated pervasively inside very large rock volumes and the fluid is expelled and transported out of the system. For example, in subduction zones hydrous minerals are subject to increasing pressure and temperature until they are no longer thermodynamically stable and form anhydrous minerals and hydrous fluids with a smaller solid volume but larger total (solid plus fluid) volume [9]. Magmas are formed by partial melting of the Earth's mantle, the melt segregates and moves through the crust to form volcanic intrusions, oceanic crust and volcanoes [14]. As they are progressively burried, organic rich shales are heated and the organic material is thermally decomposed into low-molecular-mass hydrocarbons with lower densities and viscosities. The transport of these lighter hydrocarbons through the virtually impermeable shale to adjacent high-permeability rock layers is called primary migration and if the shale layer is thick the hydrocarbon drainage must occur via fractures generated in the shale [15].
Although the generation and drainage of fluids in subduction zones, magmas and organic rich shales have each been extensively investigated, the focus of these investigations has been on physical, chemical and geological details rather than generic phenomena. In all of these systems, the solid is under confining stress, a fluid is generated internally in the solid and above some length scale, the fluid migrates through fractures generated in the solid. Here, a set of experiments, a simple theory and an algorithmic model for a system with these characteristics are presented. This system demonstrates the evolution of a new class of networks, drainage fracture networks that are intermediate between river networks and hierarchical-fracture networks. River-like drainage networks with loops has been mentioned as topologically possible, but less efficient, network in studies of transport efficiency [1]. Here we explore the physical reasons why they exist in our experiments and possibly in Nature.
Experimental set-up
The experimental set-up consists of a Hele-Shaw cell with a gel containing water, gelatin, sugar and yeast. When the yeast consumes the sugar it produces CO2 and CO2 bubbles nucleate and evolve into gas-filled fractures. The gas is transported along these cracks to the edges of the gel layer. The Hele-Shaw cell consists of two 300 × 300 × 10 mm glass plates clamped together and separated by 3 mm.
The Hele-Shaw cell was filled with liquid gelatine solution after cleaning the inner surfaces with detergent and distilled water to ensure good adhesion between gelatine and glass. A gelatin solution was prepared by dissolving 58 g of gelatine sheets (from Gelita) in 1 dm3 of boiling water (100°C). 7.5 g of sugar was dissolved in the gelatine solution, which was then cooled to 30 °C, mixed with 2.5 g of baking yeast and stirred well to homogenize it. Half of the liquid solution was poured into an area of L × L,L = 250 mm of the Hele-Shaw cell and the other half was poured into a bottle connected to a gas volume meter. Both solutions were kept in a refrigerator at 6 °C for 10 hours to obtain a solid, homogeneous gel. It is assumed that the yeast particles are homogeneously distributed on large scales and variations in the particle size and local number density (and gas production rate) are treated as quenched disorder.
Four experiments were conducted under similar conditions at room temperature (17 ± 1 °C), where the gelatine is a transparent, brittle, nearly elastic solid [16]. Two experiments (Exp1,Exp2; see supplementary movie gel_fracture_EPL.wmv) were performed with the same concentration of yeast and sugar (as described above). In the other two experiments (Exp3,Exp4) half and double the amounts of yeast and sugar were used. At 17 °C, yeast is activated, consumes sugar and produces CO2 gas. Fracture nucleation and propagation was imaged every minute at a resolution of 9 pixels/mm. Measurements of the bubble sizes and fracture apertures have an estimated accuracy of ±0.1 mm. Digital image correlation analysis showed that the motion of the camera was ⩽1 pixel length.
Results
After ≈2 hours fracture nucleation and growth began and the fractures transported gas to the edges of the gel. Development of the fracture pattern continued for an additional 20 hours until the "final" pattern, shown in fig. 1, was obtained.
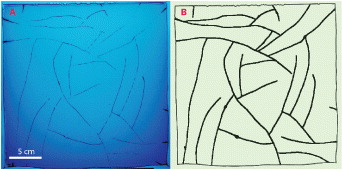
Fig. 1: Original and processed optical images of Exp1. A: original image of fracture pattern at time t = 22 h. B: processed binary image used for further analysis of network topology and geometry. The boundary of the gelatine layer is not confined and it is the drainage perimeter.
Download figure:
Standard imageIn parallel with the fracture experiment, the bottle for measuring the gas production rate, γ, was held at the same temperature as the Hele-Shaw cell. In the Exp1 and Exp2 the gas production rate increased steadily from zero, after ≈2 h the production rate had reached ≈0.7 ml/h and at 20 h it peaked at ≈2 ml/h.
Dynamics of fracture nucleation and growth
The first tiny bubble appeared in the gel after about 2 hours from the beginning of the experiment and 10–20 bubbles nucleated during the next 20 hours. Bubbles grew until they reached a diameter of approximately l0 = 2.3 ± 0.2 mm and then changed into elongated cracks with sharp tips after 12 ± 3 min. However, for about 50% of the fractures, an initial bubble nucleation and growth stage was not observed with the image resolution used in these experiment (see movies in the Supplementary Material: crack_1_EPL_format.wmv, crack_4_EPL_format.wmv). Crack tips propagated with increasing velocity, at both ends of the fractures, unless they became blunted or closely approached the boundary of the gelatine layer or another crack. During the free propagation regime, before cracks started interacting with other cracks or with the boundary, the crack length evolved with time as

where t is the time since fracture nucleation. The increase in the timescale, τ with increasing gas production rate, γ, could be represented by τ = 0.54/γ − 0.20 ± 0.017 h. Each crack tip either propagated until it connected to another fracture or reached the gel boundary, or it slowed down and eventually halted inside the gel matrix, forming a dead end. When a fracture was not connected to other fractures or the gel boundary, its aperture a increased with time due to increasing gas pressure until a maximum aperture of approximately 3 mm was reached along most of the fracture length. When two cracks intersected their apertures changed rapidly indicating pressure equilibration. When a crack reached the gel boundary, its aperture collapsed as the gas drained from the system in less than one second. Once a crack formed, it continued to serve as an intermittent drainage pathway that closed and opened. New fractures nucleated and propagated until a steady-state fracture pattern stabilized, see fig. 1A.
To analyze the development of the fracture pattern, the images of fractured gelatine were processed such that all pixels that were once covered by a fracture were preserved in accumulated images that represent the development of the fracture network. The final accumulated fracture pattern for experiment Exp1 is displayed in fig. 1B.
In most cases, both crack tips propagated linearly, with about the same velocity, until they reached a distance of λe = 10 ± 5 mm from another crack or a distance of 20 ± 5 mm from the gel edge. In such instances they would slow down, speed up, or change direction, depending on the circumstances. We will refer to λe as the elastic interaction length.
Using digital image correlation [17], the motion of tracer particles in the gel and of the gel edges was tracked. When cracks open, new volume is generated in the system, but no systematic expansion of the gel in the plane of the Hele-Shaw cell was found. However, by using an LVDT displacement sensor (Omega Engineering), we found that the glass plates confining the gel moved in the direction perpendicular to the plane of the Hele-Shaw cell plane, allowing the gel to increase in thickness. The total deflection of the plates corresponded to a total volume increase of (1.9 ± 0.1) × 10−6 m3. Since the gel is essentially incompressible, this corresponds to the volume of the gas trapped in the fractures and the largest total volume of the open fractures was estimated from image analysis to be (2.2 ± 0.1) × 10−6 m3.
Spatial distribution of fracture nucleation
To characterize the mechanisms of crack formation and growth we analyzed to what degree new fractures nucleate either in the middle of unfractured domains, near existing fractures, or randomly. When a crack formed it was assigned a number indicating the order in which it was formed as shown for experiments Exp1 and Exp2 in fig. 2A and B. Distance maps as shown in fig. 3 were computed where the colour indicates the distance r(x,y) from the coordinate (x,y) to the closest fracture or free boundary. For each nucleation event i, the distance ri, position, (xi,yi) and gradient ∇r(xi,yi) were determined just before nucleation occurred. On a line through (xi,yi) in the direction ∇r(xi,yi), the local maximum of r is denoted rmax,i. The normalized distance ri/rmax,i = 0 or 1 correspond to nucleation at an existing fracture or in the middle of an unfractured domain. The cumulative distribution N(r/rmax > ri/rmax,i), which is plotted in fig. 4, characterizes the degree of randomness in the locations of the nucleation sites and is fitted by N = (ri/rmax,i)μ, μ = 1.94. μ ⩽ 1 (the exact value depends on the shape of the unfractured area) corresponds to completely random nucleation and  corresponds to deterministic nucleation in the middle of an unfractured domain. The inset shows the cumulative distribution of ri and demonstrates that there is a minimum distance between nucleation sites and pre-existing fractures.
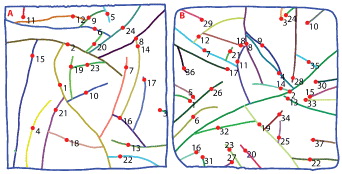
Fig. 2: A, B: nucleation sites and fracture labeling in Exp1 (A) and Exp2 (B). The fractures are distinguished by their colours and their numbers indicate the order in which they appeared. The red circles mark the nucleation sites.
Download figure:
Standard image
Fig. 3: Map of distance, r(x,y) to the nearest fracture right before and after the nucleation of fracture 10 in fig. 2A. A: a line from (x10,y10) in the direction ∇r(x10,y10) up to the position of the local maximum of r, rmax,10 is drawn in black. Panel B shows how the distance map is changed immediately following the nucleation of fracture 10. See supplementary movie nucl_movie_EPL_standart.wmv.
Download figure:
Standard image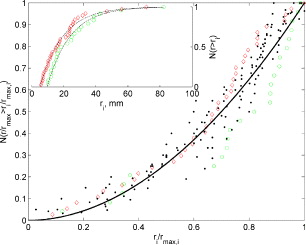
Fig. 4: Cumulative distribution of the normalized distances, ri/rmax,i, from nucleation sites to the nearest drainage interface. Green data points correspond to Exp1, red to Exp2. The black dots correspond to randomly generated networks using the fragmentation fracture model. The continuous line is a fit of the data using the function y = xμ,μ = 1.94. The inset shows the cumulative distributions of ri. This indicates that there is a minimum distance between nucleation points and pre-existing fractures, rmin of about 5 and 10 mm in the 2 experiments.
Download figure:
Standard imageFracture growth direction
The direction of fracture propagation from the nucleation point was measured and it was found that the distribution of angles between the fracture directions and the distance gradients, ∇r(xi,yi), was uniform between 0 and 90 degrees.
Analysis of steady-state fracture pattern
The steady-state fracture network shown in fig. 1B was skeletonized and all intersections of fractures (blue circles in fig. 5A) and fracture tips (red squares in fig. 5A) were identified and labeled as nodes. A fracture may be divided into segments consisting of the part of the fracture between two adjacent nodes or between a node and an end of the fracture and these segments are identified by different colours in fig. 5A, (the outer boundary is considered to be one continuous segment).
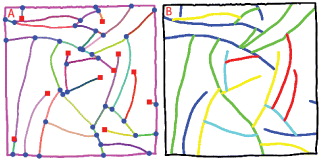
Fig. 5: Characteristics of the fracture network of Exp1. A: fracture segments labeled with different colours. Blue discs indicate junctions between segments and red squares indicate dead ends. B: fracture network coloured according to the fracture generation number, nC, of fracture C intersecting fractures A and B: nC = max(nA,nB) + 1. Black: 0; blue: 1; green: 2; yellow: 3; light blue: 4; red: 5.
Download figure:
Standard imageAt each node we measured the angles between intersecting segments. There were two distinct peaks: one in the range 180 ± 5° and the other in the range 90 ± 10°. By joining segments that intersect at angles about 180°, we reconstructed the continuous fractures which formed by propagation from a single nucleation point. This fracture pattern has a temporal order of nucleation (see numbering in fig. 2). In addition a hierarchical order can be defined such that if fracture C ends at fractures A and B its generation number is nC = max(nA,nB) + 1, where nA and nB are the generation numbers of fractures A and B [6]. The draining perimeter is considered to be generation 0. In the experiments, up to five fracture generations (n = 5) were measured. In fig. 5B, the fractures of Exp1 have been colour coded to indicate their fracture generation numbers. A fracture is "younger" than the youngest fracture it forms a junction with. One possible alternative generation numbering scheme emphasizing the drainage aspect of the network would be n'C = min(n'A,n'B) + 1, which corresponds to numbering of river segments in a drainage basin. Using this scheme the highest drainage generation is n' = 3.
Discussion and conclusion
The experimental results were used to propose a mechanism of fracture nucleation and propagation. We now demonstrate that the fracture network has intermediate statistical properties between those of river-like and hierarchical-fracture–like patterns.
A diffusion-nucleation model for fracturing
The production of CO2 provides the energy required for fracturing the gel and the fracture network evolution depends on the coupling between CO2 transport and elastic interactions in the matrix. The observation that fractures initiate as bubbles far away from existing boundaries suggest that crack nucleation is not determined by elastic interactions. We therefore propose the following diffusion-nucleation model:
- 1)Most of the generated CO2 is dissolved into the gel, which consists of 95% water. The solubility and diffusion coefficient of CO2 in the gel are approximately the same as in pure water, c0 = 1.8 g/l and D = 1.85· 10−9 m2 s−1 [18]. The dissolved CO2 has negligible mechanical effects on the gel matrix.
- 2)Bubbles nucleate when CO2 generation leads to local supersaturation in the gel. Nucleation is heterogeneous and only a small supersaturation is required.
- 3)As bubbles grow they begin interacting elastically with the gel matrix and a transition from bubbles to fractures occurs.
- 4)The subsequent fracture propagation is driven by the gas pressure on the fracture walls which induces elastic stresses in the material.
Growth of a single fracture
After a fracture has nucleated it propagates when the gas pressure exceeds some critical value pc. When fractures propagate slowly the gas pressure is constant and equal to pc. Using the ideal gas approximation  , the change in fracture volume is

The fracture aperture is limited to a = 3 mm due to adhesion of the gel to the walls of the Hele-Shaw cell and the volume of gas in the fracture is V ≈lah, where l is the fracture length and h = 3 mm is the distance between the glass plates. During propagation of a single fracture we assume a constant CO2 flux, ϕ, over the fracture surfaces

The expression
for the fracture length can be derived by combining eqs. (2) and (3) and integrating. Here, l0 is the integration constant, which characterizes the critical length above which a gas bubble evolves into a fracture. This corresponds to eq. (1), which was used to fit the experimental data and comparison of eqs. (1) and (4) indicate that 1/τ∝ϕ∝γ.
Size of unfractured domains
Various factors control the final configuration of the fracture network. Since the gas production rate is virtually constant for a long period after the last fracture has stopped propagating we assume that the system reaches a quasi-steady state in which the fracture network drains the gel matrix sufficiently to hinder further fracturing. Using a diffusion-nucleation model, the characteristic size of unfractured domains, for which loss of CO2 by diffusion is sufficient to prevent nucleation of new fractures can be estimated.
Consider a gel segment bounded by two parallel fractures separated by a distance 2δ. Assuming a constant CO2 production rate, γ, the steady-state equation for the concentration field in the gel is

We assume that the flux ϕ of CO2 across a fracture surface is proportional to the difference between the concentration c of dissolved CO2 at the surface and the concentration required for chemical equilibrium with the gas pressure p = kHc in the fracture, i.e.,

where kH is the Henry's coefficient and k is a rate constant of CO2 evaporation from the gel. The solution of (5) is

We assume that to nucleate a bubble a critical supersaturation cc = pc/kH is needed. Inserting c(x = 0) = cc into eq. (7) we may solve for the critical distance δc and find two scaling regimes:
- diffusion limited (
 ), ,
), , - evaporation limited ( ), .


It follows that in the diffusion-limited case γ1/2δc should have a constant value and γδc should have a constant value for the reaction-limited (evaporation-limited) case. In Exp1 the mean production rate was γ = 1.6 ml/h and 2δc = 22.2 mm (γδ = 17.76, γ1/2δ = 14.0) and in Exp4 the mean production rate was γ = 6.2 ml/h and 2δc = 10.7 mm (γδ = 33.2, γ1/2,δ = 13.3). This is consistent with the diffusion-limited model, but not with the reaction-limited model. The shape of the cumulative distribution function (for ri/rmax,i) shown in fig. 4, with μ = 1.94, is also consistent with the diffusion-limited scenario, but not with the reaction-limited model since in the reaction-limited limit μ ⩽ 1.
Elastic interactions, directed networks and loops
The short range of the elastic interactions is a consequence of the adhesion between the gel and the essentially rigid walls of the Hele-Shaw cell. A three-dimensional solid full of gas-filled fractures will also have a limited elastic interaction length due to the "screening" by open fractures. The elastic interaction between fractures in the model system results in the opening and closing of fracture apertures at junctions, which act as valves to the gas flow. This dynamic process, causing intermittent gas release, will be described in detail in a future communication. The adhesion between the gel and the glass walls of the Hele-Shaw cell also imposes an effective confinement on the system similar to the effects of compressive elastic stress on a three-dimensional system. Under such confining conditions, neighbouring fractures in analogous three-dimension systems will interact in a similar manner —when the aperture of one fracture increases due to increased fluid pressure it will increase the compressive stress on neighbouring fractures and this will reduce their apertures.
It should be noted that although δc ∼ rmin ∼ λe ∼ 10 mm in experiments Exp1 and Exp2, the similarity between λe and the other lengths is fortuitous. The elastic interaction length λe does not depend on the gas production rate as do δc and rmin and elasticity does not control δc and rmin.
The direction of gas flow follows the direction of the pressure gradient, but because confinement induces elastic interactions between fractures and nearby fractures and junctions, which may act as valves when the gas pressure is reduced, the direction of the pressure gradient is not static. Because of the "valve closing" effect, fractures that are connected at one end to a fracture network that reaches the edge of the gel may propagate at the other end until that end also contacts a pre-existing fracture. The end result is a network with loops. A hierarchical-fracture network [6, 7] is ideally fully connected.
Model of fracture propagation
A simple model that captures some of the essential features of our experimental system and incorporates river-like and hierarchical-fracture–like networks as limiting cases was developed (see fig. 6). A lattice model of size L × L was used, where L is the size of the gelatine layer. Fractures nucleate and propagate sequentially and form a "final" pattern when the system is completely drained, i.e., when the cumulative fracture length in the pattern exceeds or equals the cumulative fracture length lt. lt/L is 8.5 in Exp1 and 8.7 in Exp2. The nucleation sites are chosen according to a probability distribution P(x,y) that depends on the distance from the site to the nearest fracture or boundary. We chose a power law distribution such that the probability of nucleating a fracture at site (x,y) is

where r(x,y) is the distance from the nearest fracture or the boundary. This choice is justified by the experimental distribution (fig. 4), where the power law exponent was determined to be μ = 1.94 ± 0.06. The black dots in fig. 4 show the resulting cumulative distribution of ri/rmax,i of nucleation points for 20 realizations of the model. This demonstrates that although the model was constructed with a different metric from that used to measure μ an exponent of μ = 1.94 makes the model nucleation distribution lie within the range of uncertainty of the experimental nucleation distribution.

Fig. 6: Fragmentation fracture model with ω = 0.36 shown at three stages of evolution, lt/L = 2.2,5.1,8.56. The lines are coloured according to the fracture generation number, nC, of fracture C intersecting fractures A and B: nC = max(nA,nB) + 1. Black: 0; blue: 1; green: 2; yellow: 3; light blue: 4; red: 5.
Download figure:
Standard imageOnce a nucleation site is selected, the fracture orientation is randomly selected as horizontal or vertical. The fracture propagates by the same distance in both directions until it reaches and forms a junction with another fracture or the system boundary. At this instance the fracture may either cease to grow because it is drained by the joining fracture (with probability 1 − ω), or it may continue to grow until the other end meets an existing fracture (with probability ω). ω = 1 corresponds to all fractures connected at both ends which is typical of a hierarchical-fracture pattern [6]. ω = 0 corresponds to all fractures connected at one end only which is typical of river networks. The probability ω of a network can be deduced from the ratio between the number of dead ends, nd, and the number of junctions, nj:  and ω are 0.41 and 0.32 for Exp1 and Exp2.
Conclusion
The generation and exsolution of CO2 in a gel-filled Hele-Shaw cell generated a new type of drainage fracture network with topological properties intermediate between those of directed river networks and hierarchical-fracture networks. The valve-like opening and closing of fracture apertures at fracture junctions plays an important role in the formation of this type of fracture network. Diffusion of CO2 in the gel inhibits the nucleation of new fractures in the vicinity of pre-existing fractures and a simple random nucleation model that takes this and the probability that fracture propagation stops before both ends of the growing fracture reach other fractures, reproduces key characteristics of the experimental fracture network.
Acknowledgments
We acknowledge support by the Petromaks program of the Norwegian Research Council. This study was supported by a Center of Excellence grant from the Norwegian Research Council to the Physics of Geological Processes Center (PGP).