 Thilo Dürr-Auster1†
 Matthias Wiggenhauser1,2†Christophe Zeder3
 Rainer Schulin4
 Dominik J. Weiss5†
 Emmanuel Frossard1*
- 1Group of Plant Nutrition, Department of Environmental System Science, Institute for Agricultural Sciences, ETH Zurich, Zurich, Switzerland
- 2Geochemistry Group, Institut des Sciences de la Terre, CRNS, Université Grenoble-Alpes, Grenoble, France
- 3Laboratory of Human Nutrition, Department of Health Sciences and Technology, Institute of Food, Nutrition and Health, ETH Zurich, Zurich, Switzerland
- 4Soil Protection, Department of Environmental System Science, Institute of Terrestrial Ecosystems, ETH Zurich, Zurich, Switzerland
- 5Environmental Geochemistry, Department of Earth Science and Engineering, Imperial College London, London, United Kingdom
Organic fertilizer applications can contribute to Zinc (Zn) biofortification of crops. An enriched stable isotope source tracing approach is a central tool to further determine the potential of this biofortification measure. Here, we assessed the use of the widely available quadrupole single-collector ICPMS (Q-ICPMS, analytical error = 1% relative standard deviation) and the less accessible but more precise multicollector ICPMS as reference instrument (MC-ICPMS, analytical error = 0.01% relative standard deviation) to measure enriched Zn stable isotope ratios in soil–fertilizer–plant systems. The isotope label was either applied to the fertilizer (direct method) or to the soil available Zn pool that was determined by isotope ratios measurements of the shoots that grew on labeled soils without fertilizer addition (indirect method). The latter approach is used to trace Zn that was added to soils with complex insoluble organic fertilizers that are difficult to label homogeneously. To reduce isobaric interferences during Zn isotope measurements, ion exchange chromatography was used to separate the Zn from the sample matrix. The 67Zn:66Zn isotope ratios altered from 0.148 at natural abundance to 1.561 in the fertilizer of the direct method and 0.218 to 0.305 in soil available Zn of the indirect method. Analysis of the difference (Bland–Altman) between the two analytical instruments revealed that the variation between 67Zn:66Zn isotope ratios measured with Q-ICPMS and MC-ICPMS were on average 0.08% [95% confidence interval (CI) = 0.68%]. The fractions of Zn derived from the fertilizer in the plant were on average 0.16% higher (CI = 0.49%) when analyzed with Q- compared to MC-ICPMS. The sample matrix had a larger impact on isotope measurements than the choice of analytical instrument, as non-purified samples resulted on average 5.79% (CI = 9.47%) higher isotope ratios than purified samples. Furthermore, the gain in analytical precision using MC-ICPMS instead of Q-ICPMS was small compared to the experimental precision. Thus, Zn isotope measurements of purified samples measured with Q-ICPMS is a valid method to trace Zn sources in soil–fertilizer–plant systems. For the indirect source tracing approach, we outlined strategies to sufficiently enrich the soil with Zn isotopes without significantly altering the soil available Zn pool.
Introduction
Low Zn concentrations in edible plant parts can lead to Zn deficiency in humans especially in areas with cereal based diets (Black et al., 2008, Wessells and Brown, 2012). Thus, there is a need for agricultural measures that increase Zn concentrations in staple foods such as the addition of inorganic and organic fertilizers to soils (Aghili et al., 2014; Cakmak and Kutman, 2018).
Isotope source tracing allows to precisely determine the efficiency of fertilizers by determining the contributions of fertilizers and soil to plant Zn uptake (McBeath et al., 2013). There are two ways of doing this. In the direct method, the fertilizer itself is labeled with an isotope tracer before being added to the unlabeled soil. In the indirect method, soluble Zn (e.g. ZnCl2) is added to the soil to label the plant available Zn fraction of the soil and the subsequent addition of an unlabeled fertilizer to the soil leads then to an isotope dilution of the plant available Zn fraction. For both source tracing techniques, three conditions need to be fulfilled: i) the introduced spike should not alter the availability of Zn from the labeled source, ii) the isotope used for labeling do not differ in their behavior in the system, iii) and the isotopic label should be homogeneously mixed in the source to be traced (Cobelli et al., 2000; Hamon et al., 2008). The indirect method is particularly useful for complex insoluble fertilizers (organic and mineral) that are difficult to label homogeneously (Frossard et al., 2011). It was successfully used to determine the effects of complex insoluble fertilizers on N and P nutrition of crops (Douxchamps et al., 2011; Nanzer et al., 2014) and to measure Zn uptake from Zn oxide (McBeath and McLaughlin, 2014).
Zinc source tracing can employ natural stable isotope fractionation, radioisotopes or enriched stable isotopes. The radioisotope 65Zn has successfully been used in soil–plant systems with both source tracing approaches (Sinaj et al., 1999; Diesing et al., 2008; Aghili et al., 2014; McBeath and McLaughlin, 2014; Hippler et al., 2015). Compared to stable isotope systems, radioisotope systems are more readily analyzed (Stürup et al., 2008; Wiggenhauser et al., 2018). However, 65Zn is a gamma-emitter with a half-life of 244.4 days and safety issues, legal regulation limits for in-situ experiments, transport as well as waste management and storage are problematic and complicate experiments. In the last decades, technical improvements of mass spectrometry enabled to measure natural variations of metal stable isotopes ratios (Weiss et al., 2008; Wiederhold, 2015). To this end, a multicollector ICPMS (MC-ICPMS) is used that achieves a precision of 0.01% relative standard deviation (RSD) for isotope ratio measurements which is adequate to study natural biogeochemical fractionation processes (Cloquet et al., 2008; Caldelas and Weiss, 2017). Analysis of such natural variations has allowed source tracing of metals on field or catchment scales (Borrok et al., 2009; Bigalke et al., 2010; Imseng et al., 2019; Yang et al., 2019). However, this approach requires that the isotope ratios of sources and sinks are distinguishable, which is not always the case (Wiggenhauser et al., 2018).
The addition of enriched stable isotopes to fertilizers or soils makes it easier to distinguish the isotope ratios of these sources and consequently, the demand on analytical precision is reduced, which allow to use a single-collector quadrupole ICP-MS equipped with a collision cell (Q-ICPMS) with a typical precision ∼ 1% RSD (Stürup et al., 2008). Compared to MC-ICPMS, these instruments are less expensive and more accessible since they are routinely used to measure elemental concentrations. Furthermore, the less complex and demanding measurement procedure permits increased sample throughput. Compared to radioisotopes, the use of enriched metal isotopes does not require special waste management and a laboratory that fulfills the safety requirements. However, the use of stable isotopes requires the addition of much larger masses of isotopic label to the labeled source than the use of radioisotopes (Stürup et al., 2008).
The precision of mass spectrometry isotope measurements can be compromised by isobaric interferences (Mason et al., 2004a) and mass discrimination effects (Mason et al., 2004b). Isobaric interferences are due to elemental isobars (species having the same mass as the measured isotope), originating from instrumental and sample matrix components (Mason et al., 2004a). These interferences can be minimized by separating the target element from the sample matrix by means of resin ion exchange chromatography (i.e. sample purification, Durrant et al., 1994; Mason et al., 2004a). Mass discrimination effects are due to mass-dependent fractionation within the instrument and can be corrected by using a sample-standard bracketing method (Walczyk, 2001; Mason et al., 2004b).
McBeath and co-workers (2013) used Q-ICPMS to assess the Zn efficiency of a Zn coated P fertilizer enriched with the stable 67Zn isotope. To our knowledge, there is no study yet showing that Q-ICPMS can be used in combination with the indirect method and stable Zn isotope labeling. This is particularly interesting though, since several studies showed that organic fertilizer can increase the Zn concentration in crops (Amer et al., 1980; Manzeke et al., 2012; Aghili et al., 2014; Habiby et al., 2014; Soltani et al., 2014; Grüter et al., 2017; Manzeke et al., 2017). An efficient indirect Zn source tracing technique would allow quantification of the Zn contribution of organic fertilizers to the plant. However, compared to the direct source tracing approach, the isotope enrichment in the labeled source is less strong since the isotope label that is added to soil is mixed with the Zn in the soil which has Zn isotopes that are at natural abundance. Hence, for the indirect method, the precision of the Q-ICPMS could become an issue.
The objective of this study was to assess whether the precision of Q-ICPMS for measuring stable Zn isotope ratios is adequate to determine the transfer of Zn from complex organic fertilizer to plant in systems spiked with 67Zn without compromising the conditions outlined before. To this end, Italian ryegrass (Lolium multiflorum) was grown under controlled conditions and fertilized with a straw compost. We investigated the Zn transfer from the compost into the plants in two types of treatments: i) With a 67Zn labeled compost in a non-labeled soil (direct method) and ii) with a non-labeled compost added to a soil labeled with 67Zn (indirect method). The Q-ICPMS measurements were compared with MC-ICPMS measurements whereby the MC-ICPMS was considered as a reference method.
Material and Methods
Soils
Two arable soils from Switzerland one from Heitenried and one from Lindau, were chosen for this study (Table 1). The soils differed in pH (Heitenried 4.9, Lindau 7.7) and total Zn content (Heitenried 54.1 mg kg−1, Lindau 101 mg kg−1). On both sites, the soils were collected from a depth of 0–20 cm and sieved to 7 mm aggregate size. The soil batches used for the indirect method were labeled with 67Zn using the following procedure: four boxes were filled with a layer of 20 cm of soil above a 30 cm layer of foam glass drainage gravel. The two layers were separated from each other by a fleece mat. Two boxes were filled with Heitenried and two with Lindau soil. One box with each soil was then percolated for 20 weeks with 67Zn-enriched nutrient solution. For the direct method, the other two boxes were treated in the same way with non-enriched solution. The 67Zn-enriched nutrient solutions were obtained from a project that determined bioavailability of Zn in wheat meals (Signorell et al. 2019). For that study, wheat was grown hydroponically in 67Zn-enriched and non-enriched nutrient solutions that were frequently replaced. The left overs of the hydroponic nutrient solutions were added to the soils of the experiment here by using 18 randomly distributed nozzles. The nutrient solutions percolated through the soils by gravity and were recollected underneath the soil and again added to the soil through the nozzles. The nozzles were frequently randomized after the soils were carefully mixed by hand. The average 67Zn isotope enrichment of the nutrient solution was equal to the isotope enrichment in the hydroponically grown wheat (67Zn abundance = 32%, Signorell et al. 2019). After the labeling procedure, the four soil batches were air-dried, homogenized using a concrete mixer for minimum 10 min, sieved to 2 mm, and stored for 1 year, until they were used for the study presented here. The Zn isotope composition of the total soil Zn was determined after the labeling.
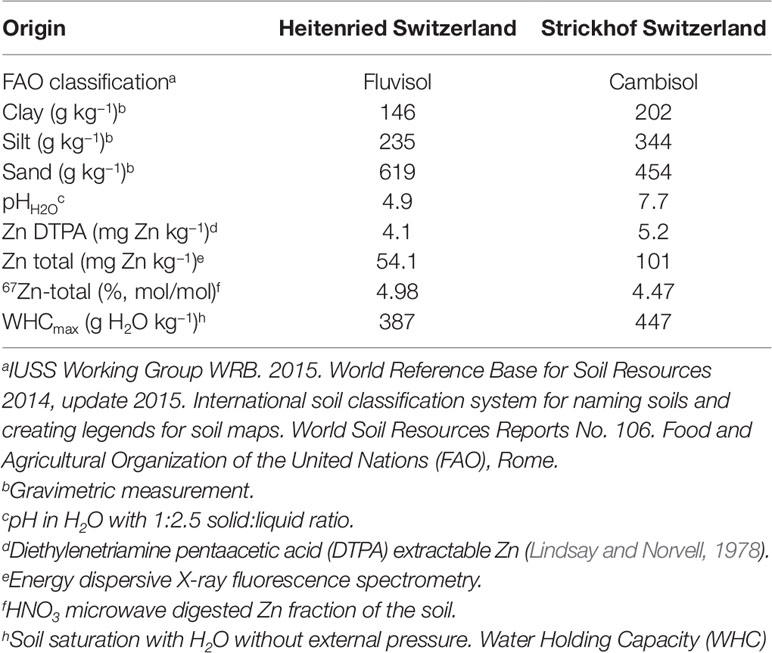
Table 1 Soil properties (labeled soil).
Wheat Straw Composts
The 67Zn-labeled and non-labeled wheat straws used to produce the organic fertilizer were obtained from the same hydroponic experiment from which the nutrient solutions were obtained (Signorell et al. 2019). Four kilograms of each straw type were hashed and composted at 40°C during 4 months. To accelerate microbial decomposition, we added ammonium nitrate and water (>18.2 MΩ) at regular intervals and mixed the composting straw after each addition. After incubation, the composts were dried at 65°C and finely ground.
Growth Trial
Ryegrass was grown in pots containing 400 g dry soil. For direct source tracing, non-labeled soil was mixed with 67Zn-labeled wheat straw compost, whereas for indirect source tracing 67Zn-labeled soil was mixed with non-labeled wheat straw compost. The compost was added as low and high dose (Table 2). Reference treatments without Zn compost were established with labeled and unlabeled soils for control. The control soils were used to provide the isotope composition of the plant available Zn pool of the soil. Furthermore, we included a treatment with 66Zn soil labeling to widen the range of 67Zn:66Zn available for analysis. All treatments were prepared with four treatment replicates. The plants were grown in a climate chamber with a daily photoperiod of 14 h at 25 klx. Temperature and relative humidity were set to 24°C and 60% during daytime and to 18°C and 65% during nighttime, respectively.
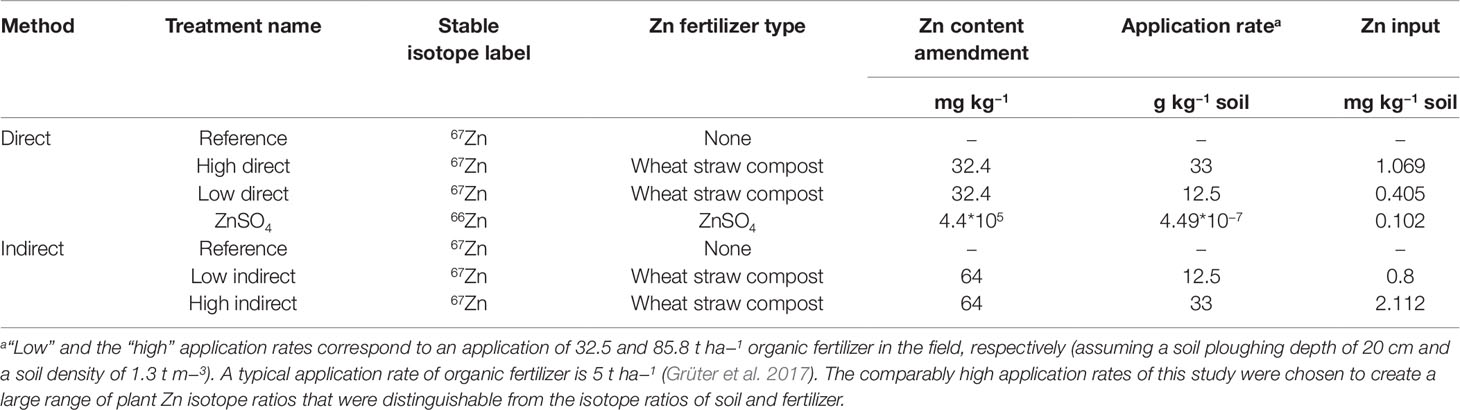
Table 2 Experimental parameters.
Each pot was sown with 0.5 g of Italian Ryegrass (L. multiflorum, var. Gemini). Nutrient solution was applied 14 days after sowing (DAS) at a rate of 460 mg N kg−1 (ammonium nitrate), 57 mg P kg−1, 144 mg K kg−1, 32 mg S kg−1, 50 mg Mg kg−1, 6 mg Fe kg−1 soil, 232 µg B kg−1, 127 µg Mn kg−1, 31 µg Cu kg−1, and 54 µg Mo kg−1 soil. In the treatments with low compost dose N addition was reduced to 321 mg N kg−1 soil and in the treatments with high compost dose to 92 mg N kg−1 soil for “high direct” and “high indirect” in order to supply the same total amount of N to each pot. The pots were watered to maintain a soil moisture between 40% and 80% water holding capacity of the soil. The shoots were harvested at 21 DAS (first cut) and 30 DAS (second cut), but only the samples of the second cut were used for analysis. For the first cut, Zn derived from the ryegrass seeds could significantly contribute to the total Zn uptake in ryegrass (Nanzer, 2012). Thus, the seeds could be a third Zn source with an isotope composition at natural abundance that decreases the variability of Zn isotope ratios in the ryegrass which was not desirable for this study.
Sample Processing and Ion Exchange Chromatography
Composted wheat straw samples collected just before preparing the soil–compost mixtures and the ryegrass shoot samples collected at harvest were dried for 48 h at 65°C in bags made of pure cellulose (pergamin) and milled in tungsten bowls. Subsamples of 200 mg dry material for each treatment replicate were suspended in 2 ml H2O (> 18.2 MΩ) and 2 ml HNO3 (Rotipuran® Supra 15.5 M, Zn < 0.5 µg L−1) in single-use glass tubes and digested in a high-pressure single-reaction microwave chamber (turboWave, MWS microwave system). An aliquot of the extract was used for total Zn analysis by means of inductively coupled plasma atomic emission spectrometry. The rest of each extract was transferred into PTFE containers, evaporated to dryness and dissolved in 6 M HCl (Rotipuran®Supra 11.6 M, Zn < 1 µg L−1). Zinc was separated from the matrix by ion exchange chromatography following a slightly modified protocol from Pinna et al. (2001). Spectra/Chrom® Minicolumns PP, 7.5 ml with 45 µm filter were filled with 2.3 cm of anion exchange resin (AG® 1-X8, 100–200 mesh, chloride form, Bio-Rad laboratories). The resin was cleaned by adding successively 3 × 5 ml HNO3 2 M, 2 ml H2O, and 5 ml of HCl 0.5 M. Then the column was conditioned with 2 × 5 ml HCl 6 M and the samples were loaded onto the resin. Next, the matrix cations (except Cu, Fe, and Zn) were washed with 2 × 5 ml HCl 6M. Cu and Fe were eluted with 5 ml HCl 2.5 M and 3 × 5 ml HCl 0.5 M, respectively. In the last step, Zn was eluted into PTFE container with 2 × 5 ml HCl 0.005 M. The resulting eluate was evaporated to dryness, dissolved in HNO3 15.5 M, and evaporated twice again. Finally, the dry residues were dissolved in 2 ml HNO3 0.05 M and stored in polyethylene (PE) tubes. In order to quantify the additional benefit of ion exchange chromatography on the spectral interferences the 67Zn:66Zn ratio of the plant extracts was measured on the Q-ICPMS before and after purification.
Sample Analysis
All purified extracts were analyzed for Zn isotope composition by means of both Q-ICPMS and MC-ICPMS. For Q-ICPMS we used an Agilent 7500ce with a helium supplied octopole reaction system. Each sample was analyzed 12 times. For each mass (64Zn, 66Zn, 67Zn, 68Zn, 70Zn) a three-point peak pattern was selected with an integration time of 0.1 s per point. Mass bias correction was performed by using standard-sample-standard bracketing with a conventional zinc sulfate heptahydrate solution (ZnSO4•7H2O, Sigma Aldrich) and applying a power law mass fractionation correction (Peel et al., 2009). The samples were diluted to obtain a concentration of approximately 200 µg L−1 in accordance with the ZnSO4-standard. The average of the RSD was <1.3% for all isotope ratios (67Zn:xxZn) except 67Zn:70Zn which reached an average RSD of 2.7% due to the low natural abundance of 70Zn (0.61% mole fraction, Berglund and Wieser, 2011). For MC-ICPMS we used a double focusing high resolution Thermo-Finnigan Neptune (Bremen, Germany), equipped with an Apex desolvation unit (Elemental Scientific, Omaha, USA). Zinc isotopic ratios were analyzed in three blocks of 20 measurements for each sample. To correct for instrumental mass bias, standard-sample-standard bracketing was applied, using a commercial Zn standard solution (Titrisol, Merck Chemicals), where one block of 20 measurements of standard Zn was performed before and one after each block of sample measurements. Zn concentrations of samples and standard were matched (approximately 1 mg L−1). To correct for isobaric interference of 64Ni on 64Zn also 62Ni was measured. No other ratio normalizations were carried out. Regarding the analytical error, the RSD was <0.05% for all isotopic ratios. The correction factor of the standard-sample-standard bracketing was calculated based on the natural Zn isotope abundances (mole fraction in %) reported by the International Union of Pure and Applied Chemistry: 49.17% for 64Zn, 27.73% for 66Zn, 4.04% for 67Zn, 18.45% for 68Zn, and 0.61% for 70Zn (Berglund and Wieser, 2011). Typical procedural blanks were 1% of the total Zn in a sample.
Source Tracing Calculation System
In the present study, the source tracing system included two Zn sources, i.e. soil available Zn and the compost, and a sink which represents the Zn isotope mixture of both sources present in the ryegrass shoots of the Zn-fertilized treatments. The terms of the mass balance formula are composed of the 67Zn:66Zn ratio of the plant and the 67Zn and 66Zn abundances (mole fraction in %) of the two sources. Consequently, all stable Zn isotope ratios (67Zn:64Zn, 67Zn:66Zn, 67Zn:68Zn, 67Zn:70Zn) of the sources needed to be measured in order to calculate the isotope abundances. The ryegrass shoots of reference treatments provided the mean isotope composition of the available Zn in the soil. The mean isotope composition of the compost was obtained from the measurement of four independently processed compost subsamples.
To calculate the fractions of plant Zn derived from the organic fertilizer, we adapted equations from McBeath et al. (2013) according to terms in Table 3. The source tracing system consisted of two Zn sources, i.e. soil and compost, and one sink, i.e. the ryegrass shoots. Thus, plant Zn is composed of a fraction derived from the compost (Zndffertilizer) and a fraction derived from the soil (Zndfsoil):
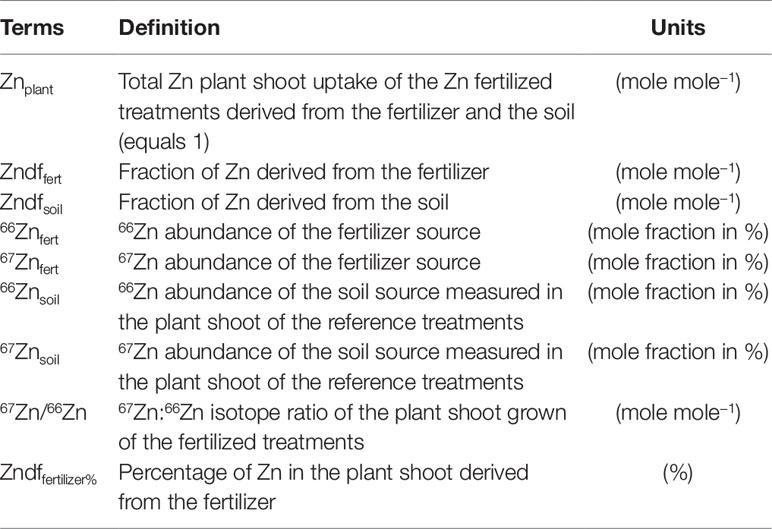
Table 3 Terminology of the mass balance equations described in Eq. 1-6.
The Zn mass (µg) in the plant shoots from the Zn fertilized treatments is composed of Zn derived from the compost (Zndffert) and from soil available Zn (Zndfsoil):
The mass balance can be deconstructed with regard to 66Zn and 67Zn:
The isotope ratio in the plant is obtained by dividing Eq. 3 by Eq. 2:
Using Eq. 1, Zndfsoil is substituted by (Znplant − Zndffert):
As Znplant represents the total Zn in the plant shoots it can be replaced by 1. By solving the equation for Zndffert we obtain the Zn fraction derived from the fertilizer (%):
Statistical Comparison of the Analytical and Experimental Precision
For the results, we considered three different types of precision: i) the analytical precision, which originated from repeat measurements of a single sample (e.g. isotope ratio in a single plant), ii) precision resulting from measurements of processing replicates which originated from the same sample that was processed several times (e.g. isotope ratio of the compost), and iii) experimental precision which originated from treatment replicates that consisted of n = 4 independent replicates (e.g. the mean isotope ratio of plants that grew in pots representing a treatment of the growth trial).
To compare the performance of the two analytical instruments used, we used Bland–Altman graphs computed using the software package R (Version 3.3.2, R Foundation, Vienna, Austria) and the package “BlandAltmanLeh” (Lehnert, 2015). This approach illustrates on the x-axes mean values of e.g. isotope ratios obtained with two different analytical methods and on the y-axes the absolute difference of these values. The graphical output of this approach enables to inspect trends between the two analytical techniques (e.g. higher isotope ratios deviate more than low isotope ratios) while the data output gives the mean (bias) and the 95% confidence interval of the absolute difference of the two analytical methods (Altman and Bland, 1983; Giavarina, 2015; Jarosch et al., 2015).
Differences in mean 67Zn abundances in the plant available soil Zn pool and in the labeled composts between Q-ICPMS and the MC-ICPMS analyses were tested using a pairwise t-test with Bonferroni p-value adjustment. Data distribution was assessed for normality using Bland–Altman plots in combination with the Shapiro–Wilk test.
Results
Source Tracing System
Figure 1 shows that the 67Zn:66Zn isotope ratios in the labeled sources were higher in the directly labeled fertilizers (1.561) than in the indirectly labeled soil available Zn pools (0.218 to 0.305). All labeled sources were significantly higher than the measured isotope ratio at natural abundance (0.148). The plant 67Zn:66Zn ratios were always closer to the 67Zn:66Zn ratio of the soil than to that of the compost, indicating that soil Zn always provided a larger Zn fraction to the plant than the compost fertilizer. But in all treatments, i.e. direct and indirect labeling, the 67Zn:66Zn ratio of plant Zn could always be statistically distinguished from the respective ratio of plant available soil Zn, which means that a contribution from the compost was always detectable.
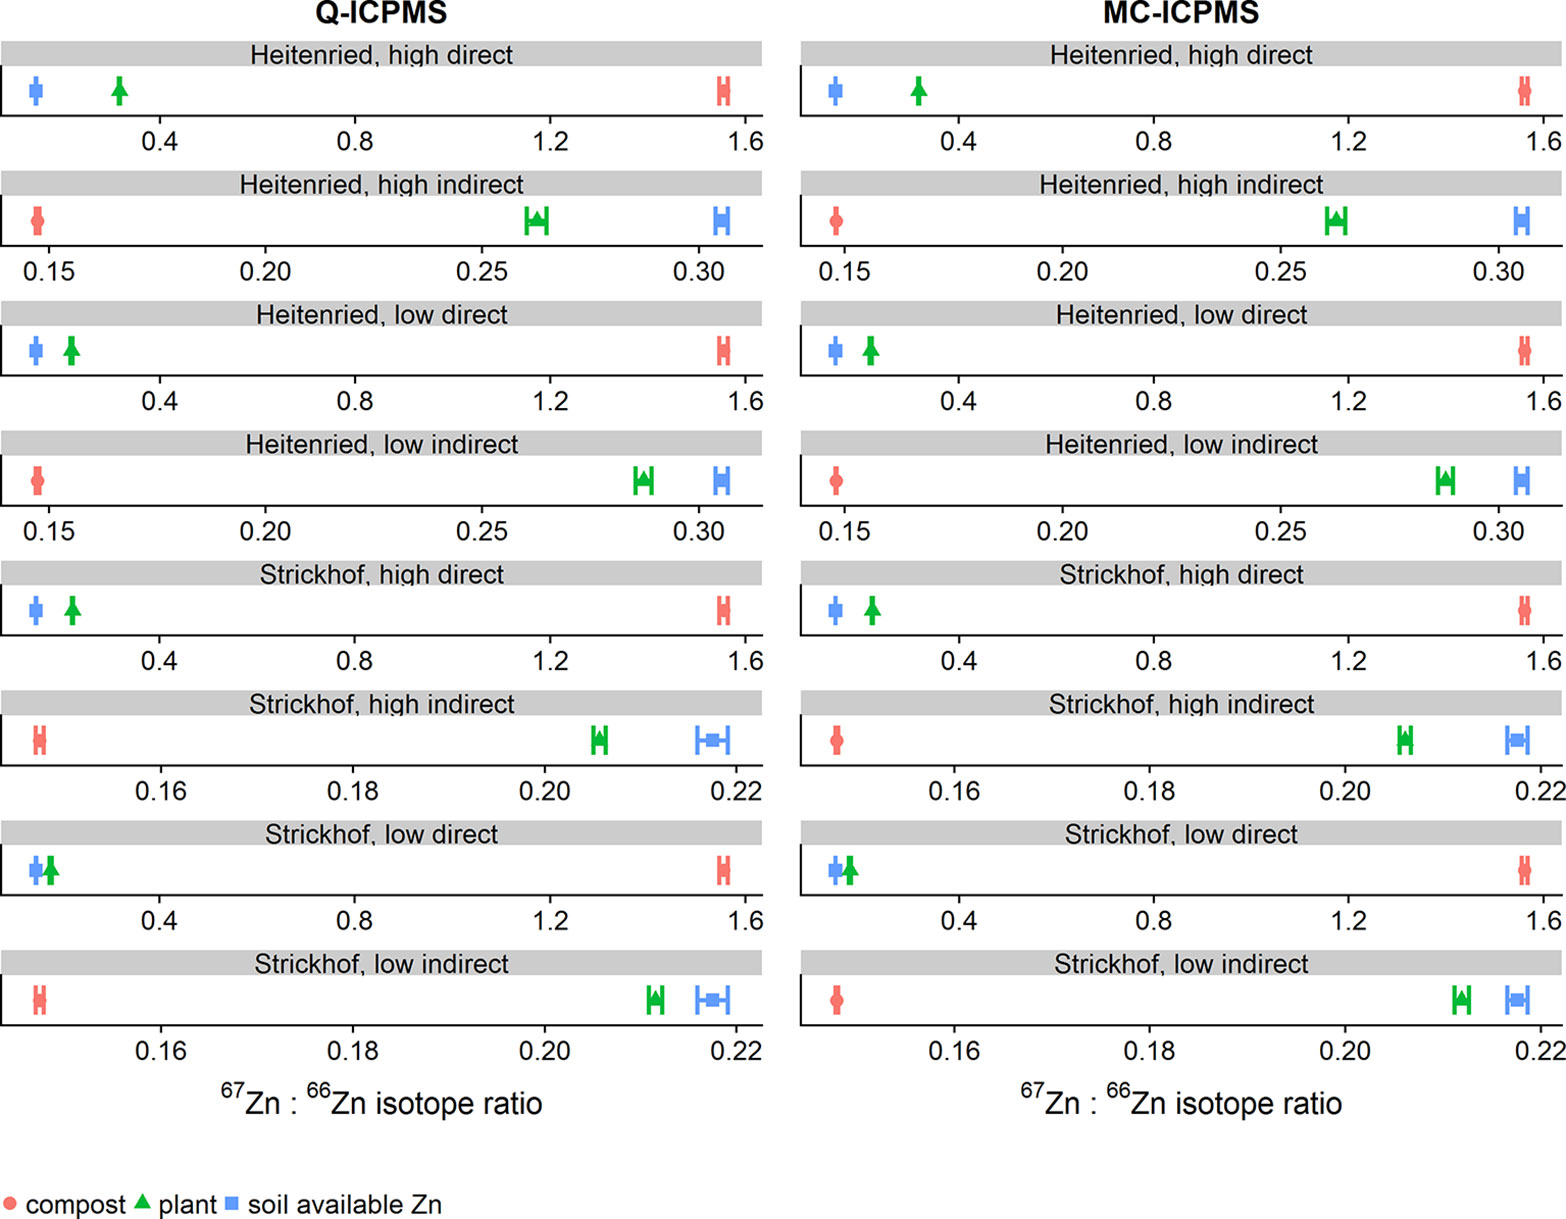
Figure 1 Mean 67Zn:66Zn-ratios of soil available Zn, the compost, and the plant of purified samples that were measured with Q-ICPMS (left column) or with MC-ICPMS (right column). The 67Zn:66Zn-ratios of soil available Zn and the plant represent the mean from n = 4 treatment replicates, whereas the 67Zn:66Zn ratios of the compost represent the mean from n = 4 processing replicates. Error bars represent the 95% confidence interval (CI).
Comparison of Measurements of Zn Isotope Abundances in the Sources
The analysis of processing replicates from the two sources for 67Zn gave no significant differences between Q- and MC-ICPMS measurements (Table 4). The confidence intervals were of similar magnitude with both methods for labeled sources, while they were between 3 and 14 times smaller in MC- than in Q-ICPMS analyses of unlabeled sources. With both instruments, the confidence intervals were always larger for labeled than for unlabeled samples. The 67Zn abundances of the plants growing on unlabeled soil were close to 4.04% (mole fraction), the natural 67Zn abundance reported by the International Union of Pure and Applied Chemistry (Berglund and Wieser, 2011), whereas the abundances of the unlabeled composts were slightly higher (4.12% 67Zn).
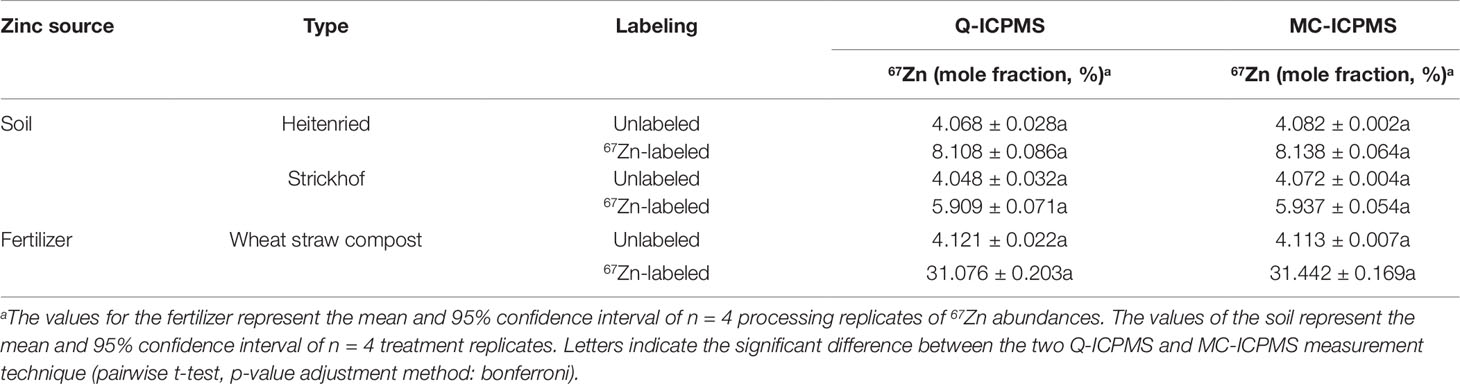
Table 4 67Zn abundances in the sources.
Comparison of 67Zn:66Zn Isotope Ratios Obtained From Q- and MC-ICPMS Measurements
In total, 57 purified plant samples from the fertilized and reference treatments were analyzed for their Zn isotope ratios with both instruments. Ranging from 0.140 to 0.319, the 67Zn:66Zn isotope ratios obtained with Q-ICPMS were on average 0.00014 units lower than those obtained with MC-ICPMS (Figure 2, all isotope ratios were mass bias corrected). Compared to the range of isotope ratios measured in this study, the average error was equal to ±0.08%. Based on the confidence intervals, the limit of agreement was ±0.0014 units. This means that the isotope ratios obtained with Q-ICPMS can be up to ±0.0014 units higher or lower than the ratios obtained with MC-ICPMS without being significantly different (Giavarina, 2015). Compared to the range of isotope ratios measured in this study, the limit of agreement was equal to 0.68%.
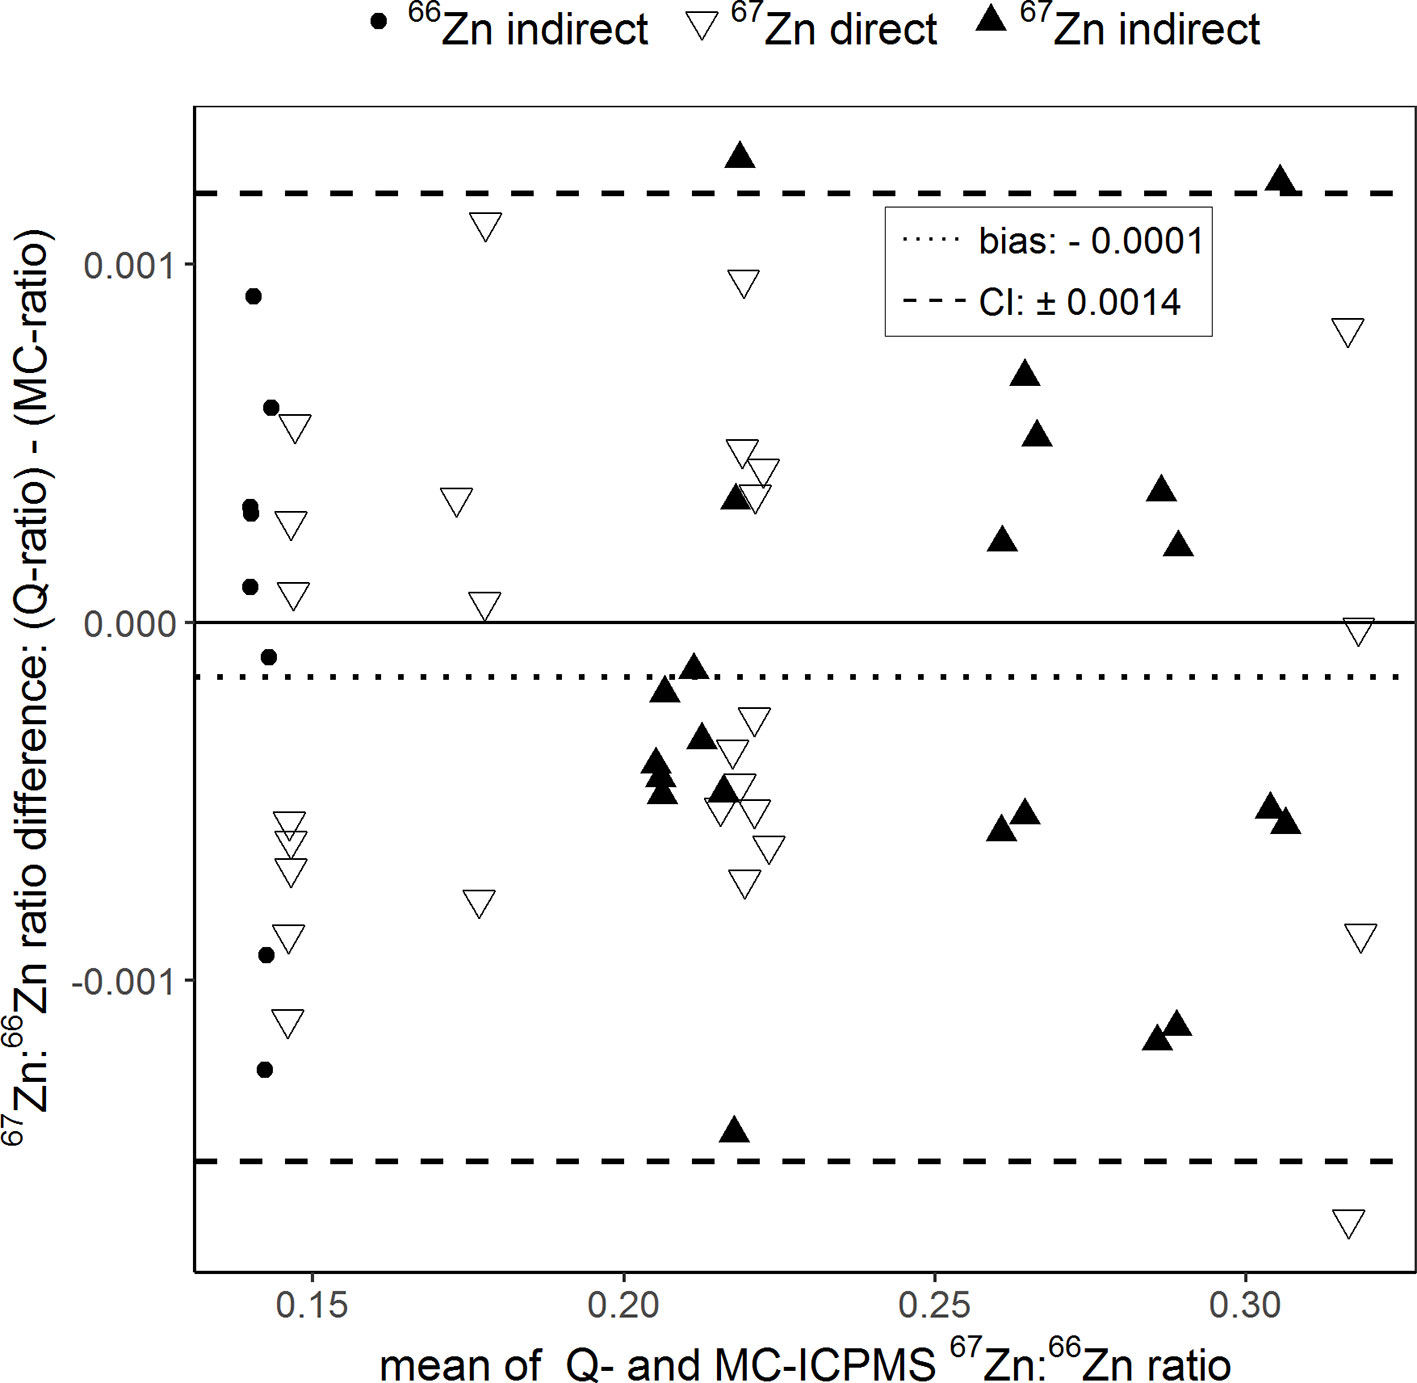
Figure 2 Bland–Altman plot comparing the 67Zn:66Zn ratios of purified samples that were obtained with single-collector quadrupole ICPMS (Q) and multicollector ICPMS (MC). “Direct” and “indirect” refer to the labeling technique with either an enriched 66Zn or 67Zn isotope. The results of each sample measured with both instruments were averaged (x-axis) and plotted against their difference (y-axis). The dotted line represents the bias and the dashed lines the 95% confidence interval (CI) of the Bland–Atman analysis.
Comparison of Zndffertilizer% Values
The Bland–Altman plot in Figure 3 compares the percentages of plant Zn derived from the compost (Zndffertilizer%) calculated using the isotope ratios determined with the two ICP-MS instruments. Overall, the Zndffertilizer% values obtained ranged from 2.6% to 27.6%. In average, the Zndffertilizer% values obtained with Q-ICPMS were 0.16% higher than those obtained with MC-ICPMS. The limit of agreement indicates that these values could differ up to 0.49%. Furthermore, comparing individual treatments, the Zndffertilizer% values differed from a minimum of 0.03% to a maximum of 0.50% between the two ICPMS methods.
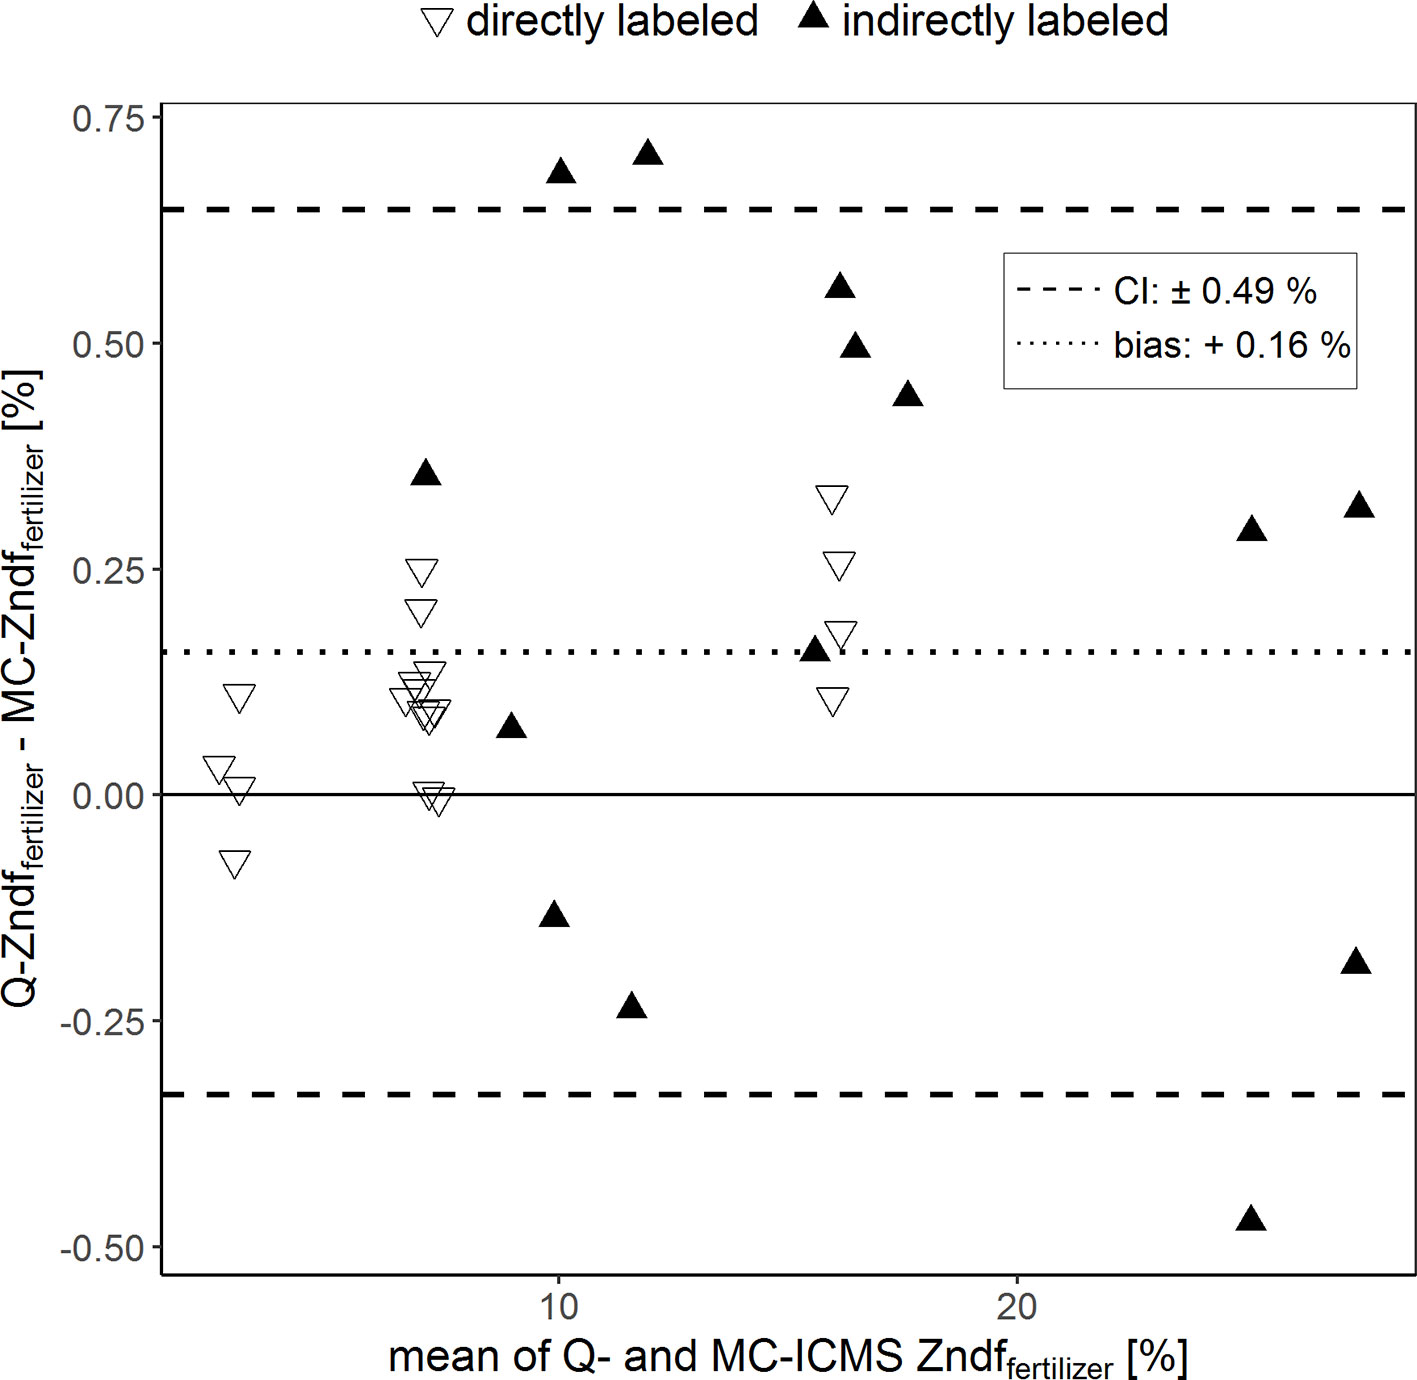
Figure 3 Bland–Altman plot comparing the Zn derived from the fertilizer values (Zndffertilizer%) of purified samples that were obtained with single-collector quadrupole ICPMS (Q) and multicollector ICPMS (MC). The results of each sample measured with both instruments were averaged (x-axis) and plotted against their difference (y-axis). The dotted line represents the bias and the dashed lines the 95% confidence interval (CI) of the Bland–Altman analysis.
Effect of Sample Purification on 67Zn:66Zn Isotope Ratio Measurements
The Bland–Altman plot in Figure 4 shows the effect of the sample purification by resin ion exchange chromatography on the determination of 67Zn:66Zn ratios. Purified and non-purified samples were analyzed only by Q-ICPMS. The 67Zn:66Zn ratios obtained from the unpurified samples were in average 0.011 units higher than those obtained from the purified samples. This difference was 5.79% of to the total range of isotope ratios measured. Differences in 67Zn:66Zn ratios between purified and non-purified samples of up to 9.47% (±0.018 units) were still within confidence limits.
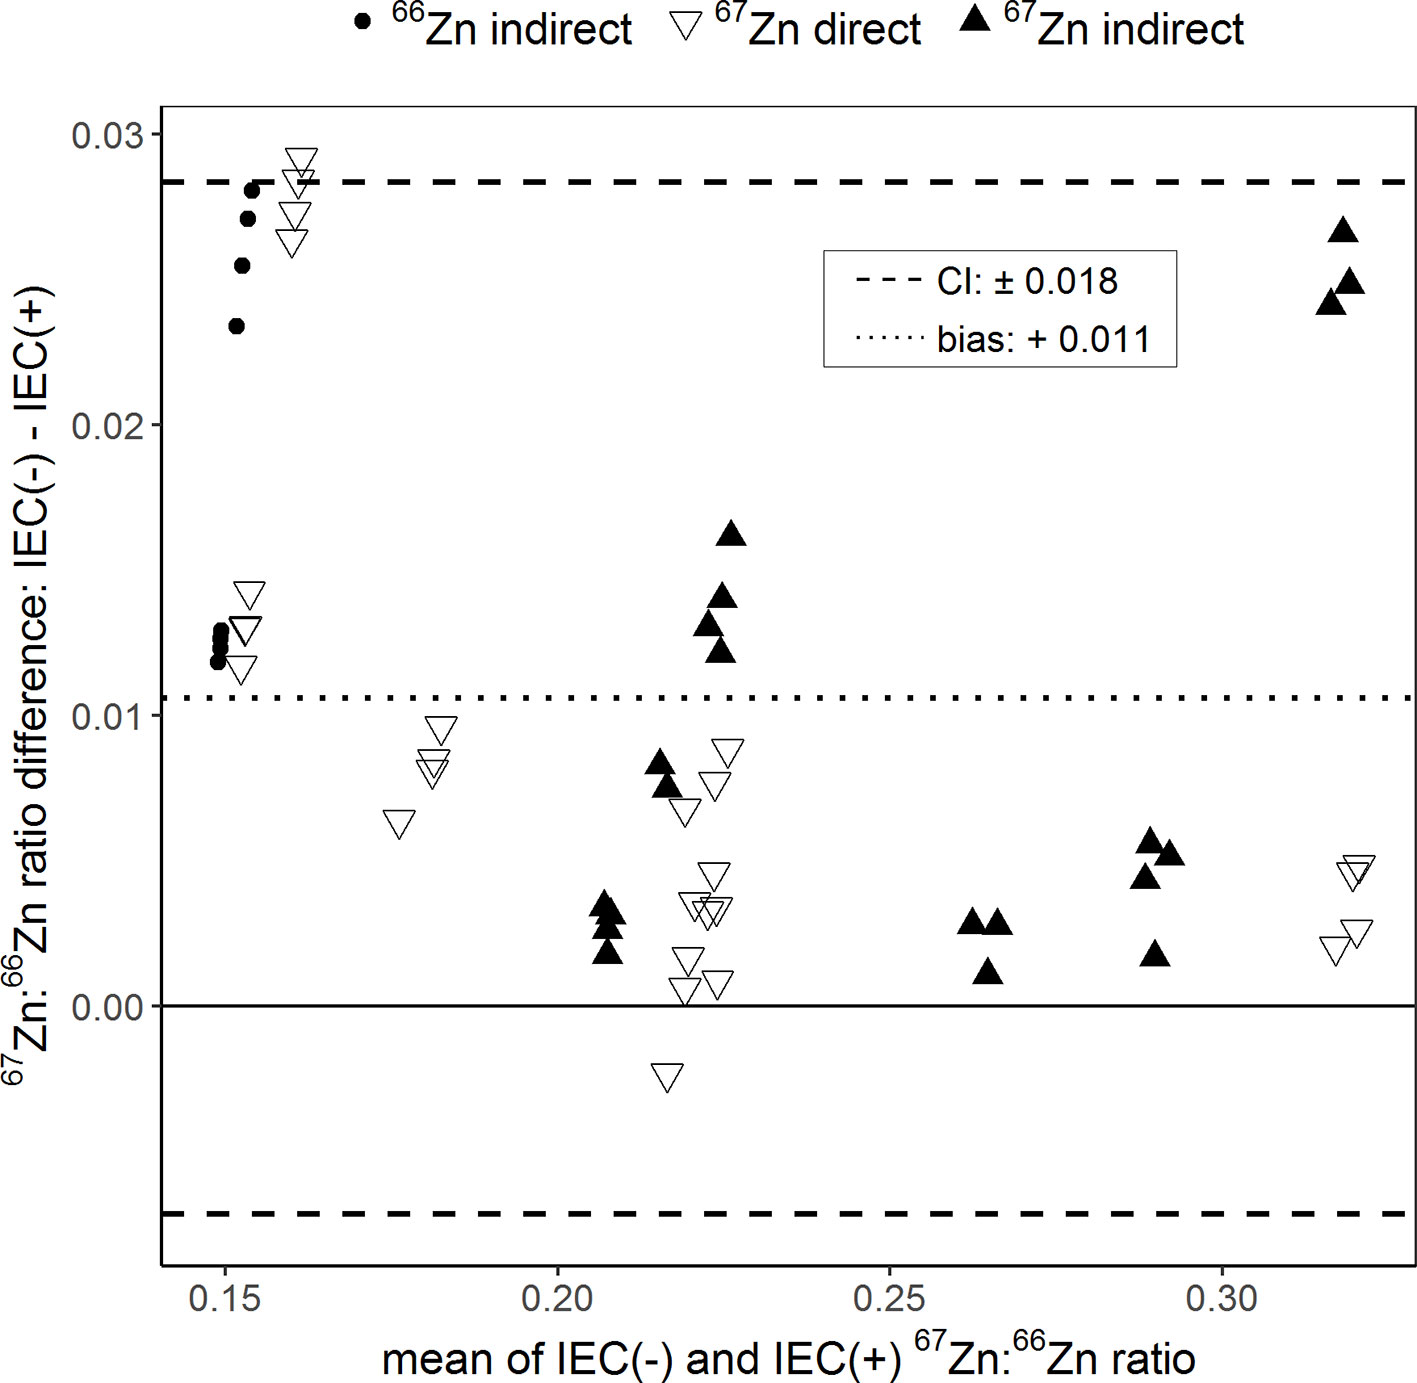
Figure 4 Bland–Altman plot comparing the 67Zn:66Zn ratios measured in samples for which either ion exchange chromatography (IEC(+)) was conducted to separate the sample matrix from Zn or for which no separation was conducted (IEC(−)). “Direct” and “indirect” refer to the labeling technique with either an enriched 66Zn or 67Zn isotope. The results of each sample measured with and without IEC were averaged (x-axis) and plotted against their difference (y-axis). The dotted line represents the bias and the dashed lines the 95% confidence interval (CI) of the Bland–Altman analysis.
Discussion
Analytical Precision Versus Experimental Reproducibility
The analytical precision of the 67Zn:66Zn ratio measurements was in the range of typical RSD for both analytical methods: approximately 1% for Q-ICPMS and 0.01% for MC-ICPMS (Stürup et al., 2008). However, the maximum difference between the final Zndffertilizer% values obtained with the two methods was 0.49%. A similar relationship between analytical error and variability between sampling and treatment replicates was observed in lead isotope ratios measurements for lichens (Spiro et al., 2004). Hence, the experimental error due to sample preparation and the variability between treatment replicates outweighed the analytical errors associated with the ICPMS analyses. Thus, our study suggests that Q-ICPMS is adequate to trace Zn isotopes in studies on plant Zn sourcing with a limited number of treatment and sample replicates.
Impact of Sample Matrix on Zn Isotope Measurements
Our results show that Zn separation from the sample matrix by ion exchange chromatography remains an essential step to accurately measure 67Zn:66Zn ratios with Q-ICPMS (Figure 4). Sulfur, magnesium, and nitrogen are abundant major mineral nutrients. Forming argides (magnesium, nitrogen) and oxides (sulfur) in the plasma, they have the potential to affect Zn and Ni (correction of elemental interference) isotope analyses of plant samples by spectral interferences. Furthermore, the sample matrix can affect isotope measurements also through non-spectral effects by influencing sample transport efficiency, ionization, ion transfer, and ion detection (Prohaska et al., 2014).
Whether the time-consuming purification step is needed might depend on the degree of isotope enrichment, the concentration of the target element, and on the analytical device used for the isotope analysis. With indirect source tracing, it was not feasible to enrich the isotope as much as with direct source tracing (Figure 1). Thus, sample purification might be essential with indirect source tracing (see also Comparison of67Zn:66Zn Isotope Ratios Obtained From Q- and MC-ICPMS Measurements). If Zn isotope source tracing method is used e.g. in Zn biofortification studies, Zn isotopes may have to be analyzed in samples with low Zn concentrations, and thus relatively large spectral interferences and matrix effects may have to be considered. An additional benefit of sample purification is that it allows at the same time to study other elements besides Zn with lower concentrations in soil–plant systems. For instance, the non-essential and highly toxic element Cd, which behaves similar as Zn in soil–plant systems, is usually about 100 to 300 times less concentrated than Zn in non-contaminated soils (Mertens and Smolders, 2013). Previous studies successfully measured Zn isotope ratios of unpurified samples by using a high-resolution single-collector ICPMS (HR-ICPMS) to determine isotope exchange kinetics for Zn in soils (Sivry et al., 2011; Ren et al., 2016). These double-focusing magnetic sector instruments have a higher resolving power than Q-ICPMS and are better in resolving spectral interferences (Thomas, 2013). However, it needs to be tested if HR-ICPMS can resolve spectral interferences of samples with low Zn concentrations and low isotope enrichment as in the case of indirect source tracing in our study.
Indirect Source Tracing
Indirect source tracing enables to test the efficiency of complex organic fertilizers for Zn biofortification. Critical issues for this method are on the one hand that the amount of added enriched stable isotope needs to be large enough to make the sources distinguishable, while on the other hand the mass of Zn added to the soil must not be so large that the plant available soil Zn is altered significantly. To assess if the isotope enrichment in the labeled source was large enough to resolve the Zn source contributions to the plant, we compared the isotope enrichment with the experimental precision (Table 5). The 67/66Zn isotope enrichment in the directly labeled systems was equal to 67/66Znlabeled.source − 67/66Znunlabeled.source = 1.4089. If we divide this value by using a conservative estimate of 2 standard deviations (2sd) of the experimental precision that was obtained by measuring the 67/66Zn isotope ratio in the plants, the result is that 414 67/66Zn isotope ratios could be statistically distinguished from each other in between the two Zn sources. This resolution means that Zn contributions of approximately 0.24% (100% divided by 414) from the sources to the plant can be detected. In the indirectly labeled sources, the isotope enrichment was 0.0702 in the Strickhof and 1.579 in the Heitenried soil. With this isotope enrichment, only n = 26 and 58 67/66Zn isotope ratios can be statistically distinguished from each other in the Strickhof and Heitenried soil, respectively. With this resolution, Zn contributions of approximately 1.72% to 3.85% from the sources to the plant can be detected. The weaker resolution in the indirectly labeled sources was caused by dilution of the 67Zn enriched isotope label in the pool of resident soil Zn. Furthermore, the isotope enrichment of the soil available Zn pools differed between the soils, and thus also the number of significantly distinguishable isotope ratios. Previous studies showed that soils can contain different number of compartments which have distinct Zn isotope exchange rates and contain distinct quantities of Zn (Cobelli et al., 2000; Diesing et al. 2008). Hence, these compartments determine the mass of Zn in the soil available Zn pool and thus also the mass of 67Zn that needs to be added to a soil to sufficiently enrich the soil available Zn pool with 67Zn.
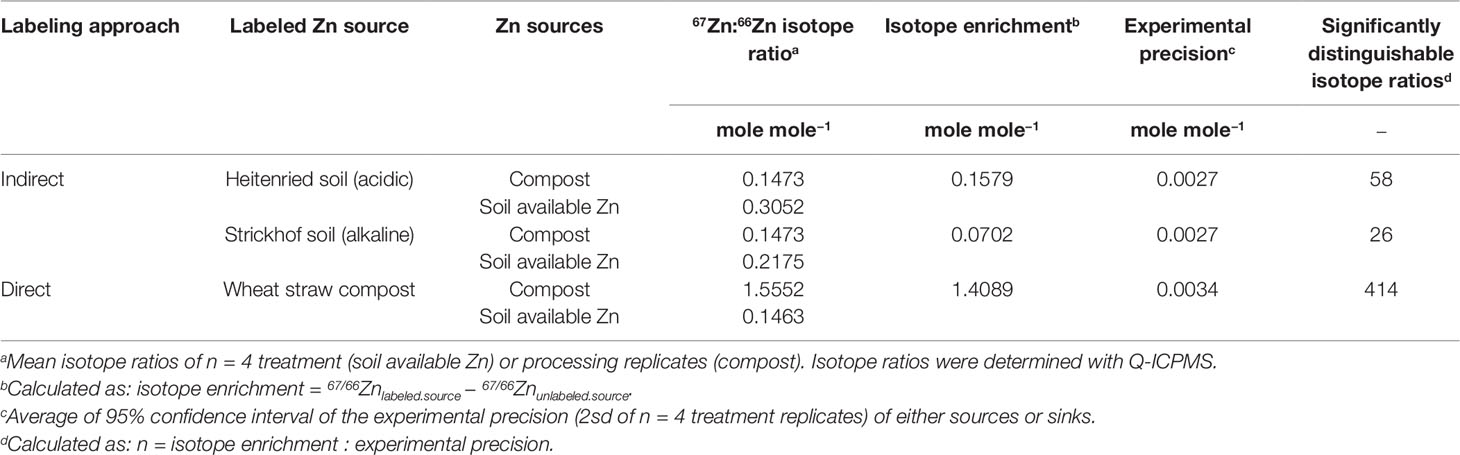
Table 5 Resolution of Zn source contribution.
If the resolution of n = 26–58 statistically distinguishable isotope ratios between the two Zn sources is sufficient to determine the Zn contributions of the sources depends on the range of expected Zndffertilizer% values. We compiled data from similar Zn source tracing studies that cover several soil and fertilizer types (Figure 5). The Zndffertilizer% values ranged from 0.1% to 99% with an average of 38% and a median of 19%. The Zndffertilizer% values >50% were mostly reported for Zn sources that readily dissolved in soils such as Zn sulfates and Zn oxides (Nanzer, 2012; McBeath and McLaughlin, 2014). Studies that tested organic fertilizers or complex recycling fertilizer reported values below 50% (Amer et al., 1980; Nanzer, 2012; Aghili et al., 2014). Thus we expect that the majority of Zndffertilizer% values, and their corresponding 67Zn:66Zn isotope ratios, range upto 50%. Within this range, 13 and 29 statistically distinguishable isotope ratios can be resolved with the obtained experimental precision of 67Zn:66Zn = 0.0027 (2sd). To improve this resolution, more 67Zn or a less abundant Zn isotope such as 70Zn needs to be added to the soil to increase the isotope enrichment without further increasing the mass of Zn added to the soil (Larner and Rehkämper, 2012).
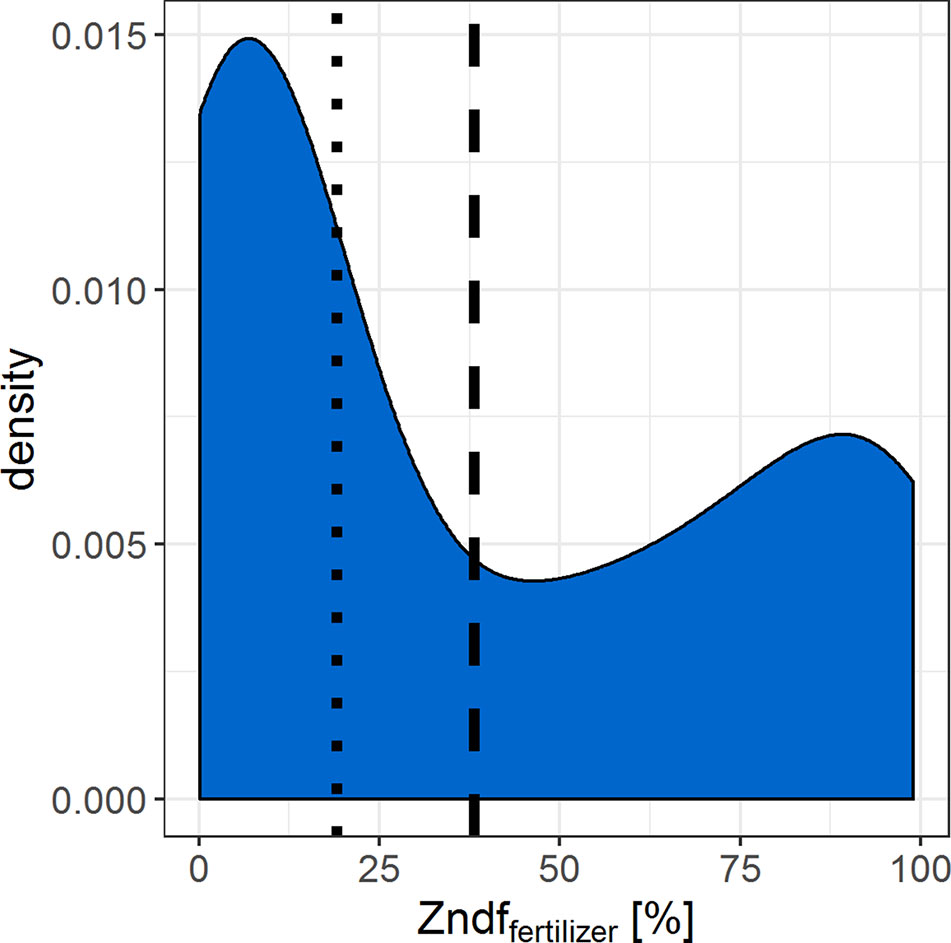
Figure 5 Density curve that summarizes the Zn derived from fertilizer values (Zndffertilizer%) found in similar Zn source tracing studies (Amer et al. 1980; Nanzer, 2012; McBeath et al., 2013; Aghili et al., 2014; McBeath & McLaughlin, 2014). Dashed line = median, dotted line = mean of n = 101 Zndffertilizer% values.
For future experiments, we recommend that the optimal mass of enriched 67Zn or 70Zn label that is added to a soil is determined in pretests, in which e.g. Zn isotope composition of available soil Zn is determined after adding different amounts of enriched Zn isotopes to the soil. Furthermore, available soil Zn pools should be assessed before and after labeling by using e.g. salt extracts, chelating agents, DGT techniques, or isotope exchange techniques (Zhang et al., 2004; Menzies et al., 2007; Diesing et al., 2008; Ren et al., 2016) to test the impact of soil labeling on the size of the soil available Zn pool.
Conclusions
We tested the use of Q-ICPMS in comparison to the more precise but less accessible MC-ICPMS as analytical method to determine plant Zn uptake from complex organic fertilizers using stable Zn isotope source tracing. We found that the analytical precision was by far sufficient in relation to sampling and experimental variability and that also the bias relative to the MC-ICPMS measurements was negligible for the calculation of plant Zn fractions derived from the fertilizer source. For indirect source tracing, it is recommended to purify samples by ion exchange chromatography prior to Q-ICPMS analysis. Prior to the indirect source tracing experiment, stable isotope labeling of soil available Zn needs to be optimized for each soil by maximizing the isotope enrichment of this Zn source while not changing the plant availability of Zn in the soil.
Data Availability Statement
All datasets generated for this study are included in the article/supplementary material.
Author Contributions
TD-A conducted the laboratory work. WM and DW were leading the write-up of the manuscript while all co-authors provided inputs. EF initiated the project, CZ helped to conduct the MC-ICPMS measurements, DW advised the comparison of the two instruments, and EF and RS supervised the project.
Funding
The project was funded by the Swiss State Secretariat for Education and Research within the framework of the COST (European Cooperation for Science and Technology) action “Mineral-Improved Crop Production for Healthy Food and Feed” (FA0905) with the project number C10.0085.
Conflict of Interest
The authors declare that the research was conducted in the absence of any commercial or financial relationships that could be construed as a potential conflict of interest.
Acknowledgments
We thank the staff of the group of plant nutrition and soil protection for the support in the laboratory.
References
Aghili, F., Gamper, H. A., Eikenberg, J., Khoshgoftarmanesh, A. H., Afyuni, M., Schulin, R., et al. (2014). Green manure addition to soil increases grain zinc concentration in bread wheat. PloS One 9, e101487. doi: 10.1371/journal.pone.0101487
Altman, D. G., Bland, J. M. (1983). Measurement in medicine: The analysis of method comparison studies. Statistician 32, 307. doi: 10.2307/2987937
Amer, F., Rezk, A. I., Khalid, H. M. (1980). Fertilizer zinc efficiency in flooded calcareous soils. Soil Sci. Soc Am. J. 44, 1025. doi: 10.2136/sssaj1980.03615995004400050031x
Berglund, M., Wieser, M. E. (2011). Isotopic compositions of the elements 2009 (IUPAC Technical Report). Pure Appl. Chem. 83, 397–410. doi: 10.1351/PAC-REP-10-06-02
Bigalke, M., Weyer, S., Kobza, J., Wilcke, W. (2010). Stable Cu and Zn isotope ratios as tracers of sources and transport of Cu and Zn in contaminated soil. Geochim. Cosmochim. Acta 74, 6801–6813. doi: 10.1016/j.gca.2010.08.044
Black, R. E., Allen, L. H., Bhutta, Z. A., Caulfield, L. E., de Onis, M., Ezzati, M., et al. (2008). Maternal and child undernutrition: global and regional exposures and health consequences. Lancet 371, 243–260. doi: 10.1016/S0140-6736(07)61690-0
Borrok, D. M., Wanty, R. B., Ian Ridley, W., Lamothe, P. J., Kimball, B. A., Verplanck, P. L., et al. (2009). Application of iron and zinc isotopes to track the sources and mechanisms of metal loading in a mountain watershed. Appl. Geochem. 24, 1270–1277. doi: 10.1016/j.apgeochem.2009.03.010
Cakmak, I., Kutman, U. B. (2018). Agronomic biofortification of cereals with zinc: a review: Agronomic zinc biofortification. Eur. J. Soil Sci. 69, 172–180. doi: 10.1111/ejss.12437
Caldelas, C., Weiss, D. J. (2017). Zinc Homeostasis and isotopic fractionation in plants: a review. Plant Soil 411, 17–46. doi: 10.1007/s11104-016-3146-0
Cloquet, C., Carignan, J., Lehmann, M. F., Vanhaecke, F. (2008). Variation in the isotopic composition of zinc in the natural environment and the use of zinc isotopes in biogeosciences: a review. Anal. Bioanal. Chem. 390, 451–463. doi: 10.1007/s00216-007-1635-y
Cobelli, C., Foster, D., Toffolo, G., (2000). Tracer kinetics in biomedical research: from data to model. New York: Kluwer Academic/Plenum Publ.
Diesing, W. E., Sinaj, S., Sarret, G., Manceau, A., Flura, T., Demaria, P., et al. (2008). Zinc speciation and isotopic exchangeability in soils polluted with heavy metals. Eur. J. Soil Sci. 59, 716–729. doi: 10.1111/j.1365-2389.2008.01032.x
Douxchamps, S., Frossard, E., Bernasconi, S. M., van der Hoek, R., Schmidt, A., Rao, I. M., et al. (2011). Nitrogen recoveries from organic amendments in crop and soil assessed by isotope techniques under tropical field conditions. Plant Soil 341, 179–192. doi: 10.1007/s11104-010-0633-6
Durrant, S. F., Krushevska, A., Amarasiriwardenat, D., Argentine, M. D., Romon-Guesnier, S., Barnes, R. M. (1994). Matrix separation by chelation to prepare biological materials for isotopic zinc analysis by inductively coupled plasma mass spectrometry. J. Anal. At Spectrom. 9, 6. doi: 10.1039/JA9940900199
Frossard, E., Achat, D. L., Bernasconi, S. M., Bünemann, E. K., Fardeau, J.-C., Jansa, J., et al. (2011). “The use of tracers to investigate phosphate cycling in soil–plant systems,” in Phosphorus in Action. Eds. Bünemann, E., Oberson, A., Frossard, E. (Berlin, Heidelberg: Springer Berlin Heidelberg), 59–91. doi: 10.1007/978-3-642-15271-9_3
Giavarina, D. (2015). Understanding Bland Altman analysis. Biochem. Med. 25, 141–151. doi: 10.11613/BM.2015.015
Grüter, R., Costerousse, B., Bertoni, A., Mayer, J., Thonar, C., Frossard, E., et al. (2017). Green manure and long-term fertilization effects on soil zinc and cadmium availability and uptake by wheat (Triticum aestivum L.) at different growth stages. Sci. Total Environ. 599–600, 1330–1343. doi: 10.1016/j.scitotenv.2017.05.070
Habiby, H., Afyuni, M., Khoshgoftarmanesh, A. H., Schulin, R. (2014). Effect of preceding crops and their residues on availability of zinc in a calcareous Zn-deficient soil. Biol. Fertil. Soils 50, 1061–1067. doi: 10.1007/s00374-014-0926-7
Hamon, R. E., Parker, D. R., Lombi, E., (2008). “Chapter 6 Advances inisotopic dilution techniques in trace element research,”in Advances in Agronomy (Elsevier), 289–343. doi: 10.1016/S0065-2113(08)00406-9
Hippler, F. W. R., Boaretto, R. M., Quaggio, J. A., Boaretto, A. E., Abreu-Junior, C. H., Mattos, D. (2015). Uptake and distribution of soil applied zinc by citrus trees—addressing fertilizer use efficiency with 68Zn labeling. PloS One 10, e0116903. doi: 10.1371/journal.pone.0116903
Imseng, M., Wiggenhauser, M., Müller, M., Keller, A., Frossard, E., Wilcke, W., et al. (2019). The fate of Zn in agricultural soils: a stable isotope approach to anthropogenic impact, soil formation, and soil–plant cycling. Environ. Sci. Technol. acs.est.8b03675. doi: 10.1021/acs.est.8b03675
Jarosch, K. A., Doolette, A. L., Smernik, R. J., Tamburini, F., Frossard, E., Bünemann, E. K. (2015). Characterisation of soil organic phosphorus in NaOH-EDTA extracts: A comparison of 31P NMR spectroscopy and enzyme addition assays. Soil Biol. Biochem. 91, 298–309. doi: 10.1016/j.soilbio.2015.09.010
Larner, F., Rehkämper, M. (2012). Evaluation of stable isotope tracing for ZnO nanomaterials—new constraints from high precision isotope analyses and modeling. Environ. Sci. Technol. 46, 4149–4158. doi: 10.1021/es204440d
Lehnert, B. (2015). Package ‘BlandAltmanLeh.’ Package ‘BlandAltmanLeh.’ Available at: https://cran.r-project.org/web/packages/BlandAltmanLeh/.
Lindsay, W. L., Norvell, W. A. (1978). Development of a DTPA soil test for Zinc, Iron, Manganese, and Copper1. Soil Sci. Soc. Am J. 42, 421. doi: 10.2136/sssaj1978.03615995004200030009x
Manzeke, G. M., Mapfumo, P., Mtambanengwe, F., Chikowo, R., Tendayi, T., Cakmak, I. (2012). Soil fertility management effects on maize productivity and grain zinc content in smallholder farming systems of Zimbabwe. Plant Soil 361, 57–69. doi: 10.1007/s11104-012-1332-2
Manzeke, M. G., Mtambanengwe, F., Nezomba, H., Watts, M. J., Broadley, M. R., Mapfumo, P. (2017). Zinc fertilization increases productivity and grain nutritional quality of cowpea (Vigna unguiculata [L.] Walp.) under integrated soil fertility management. Field Crops Res. 213, 231–244. doi: 10.1016/j.fcr.2017.08.010
Mason, T. F. D., Weiss, D. J., Horstwood, M., Parrish, R. R., Russell, S. S., Mullane, E., et al. (2004a). High-precision Cu and Zn isotope analysis by plasma source mass spectrometry. Part 1. Spectral interferences and their correction. J. Anal. At Spectrom. 19, 209. doi: 10.1039/b306958c
Mason, T. F. D., Weiss, D. J., Horstwood, M., Parrish, R. R., Russell, S. S., Mullane, E., et al. (2004b). High-precision Cu and Zn isotope analysis by plasma source mass spectrometry. Part 2. Correcting for mass discrimination effects. J. Anal. At Spectrom. 19, 218. doi: 10.1039/b306953b
McBeath, T. M., McLaughlin, M. J. (2014). Efficacy of zinc oxides as fertilisers. Plant Soil 374, 843–855. doi: 10.1007/s11104-013-1919-2
McBeath, T. M., McLaughlin, M. J., Kirby, J. K., Degryse, F. (2013). A stable-isotope methodology for measurement of soil-applied-zinc fertilizer recovery in durum wheat (Triticum durum). J. Plant Nutr. Soil Sci., 756–763. doi: 10.1002/jpln.201200305
Menzies, N. W., Donn, M. J., Kopittke, P. M. (2007). Evaluation of extractants for estimation of the phytoavailable trace metals in soils. Environ. Pollut. 145, 121–130. doi: 10.1016/j.envpol.2006.03.021
Mertens, J., Smolders, E., (2013). “Zinc,” in Heavy Metals in Soils. Ed. Alloway, B. J. (Dordrecht: Springer Netherlands), 465–493. doi: 10.1007/978-94-007-4470-7_17
Nanzer, S. (2012). Evaluation of a phosphate fertilizer from sewage sludge. Dissertation. Zurich: ETH Zurich.
Nanzer, S., Oberson, A., Berger, L., Berset, E., Hermann, L., Frossard, E. (2014). The plant availability of phosphorus from thermo-chemically treated sewage sludge ashes as studied by 33P labeling techniques. Plant Soil 377, 439–456. doi: 10.1007/s11104-013-1968-6
Peel, K., Weiss, D., Sigg, L. (2009). Zinc isotope composition of settling particles as a proxy for biogeochemical processes in lakes: Insights from the eutrophic Lake Greifen, Switzerland. Limnol. Oceanogr. 54, 1699–1708. doi: 10.4319/lo.2009.54.5.1699
Pinna, K., Woodhouse, L. R., Sutherland, B., Shames, D. M., King, J. C. (2001). Exchangeable zinc pool masses and turnover are maintained in healthy men with low zinc intakes. J. Nutr. 131, 2288–2294. doi: 10.1093/jn/131.9.2288
Prohaska, T, Irrgeher, J, Zitek, A, Jakubowski, N, editors. (2014). Sector Field Mass Spectrometry for Elemental and Isotopic Analysis. Cambridge: Royal Society of Chemistry. doi: 10.1039/9781849735407
Ren, Z., Sivry, Y., Dai, J., Tharaud, M., Cordier, L., Zelano, I., et al. (2016). Exploring Cd, Cu, Pb, and Zn dynamic speciation in mining and smelting-contaminated soils with stable isotopic exchange kinetics. Appl. Geochem. 64, 157–163. doi: 10.1016/j.apgeochem.2015.09.007
Signorell, C., Zimmermann, M. B., Cakmak, I., Wegmüller, R., Zeder, C., Hurrell, R., et al. (2019). Zinc absorption from agronomically biofortified wheat is similar to post-harvest fortified wheat and is a substantial source of bioavailable zinc in humans. J. Nutr. doi: 10.1093/jn/nxy328
Sinaj, S., Machler, F., Frossard, E. (1999). Assessment of isotopically exchangeable zinc in polluted and nonpolluted soils. Soil Sci. Soc Am. J. 63, 1618. doi: 10.2136/sssaj1999.6361618x
Sivry, Y., Riotte, J., Sappin-Didier, V., Munoz, M., Redon, P.-O., Denaix, L., et al. (2011). Multielementary (Cd, Cu, Pb, Zn, Ni) stable isotopic exchange kinetic (SIEK) method to characterize polymetallic contaminations. Environ. Sci. Technol. 45, 6247–6253. doi: 10.1021/es2006644
Soltani, S., Khoshgoftarmanesh, A. H., Afyuni, M., Shrivani, M., Schulin, R. (2014). The effect of preceding crop on wheat grain zinc concentration and its relationship to total amino acids and dissolved organic carbon in rhizosphere soil solution. Biol. Fertil. Soils 50, 239–247. doi: 10.1007/s00374-013-0851-1
Spiro, B., Weiss, D. J., Purvis, O. W., Mikhailova, I., Williamson, B. J., Coles, B. J., et al. (2004). Lead isotopes in lichen transplants around a cu smelter in russia determined by MC-ICP-MS reveal transient records of multiple sources. Environ. Sci. Technol. 38, 6522–6528. doi: 10.1021/es049277f
Stürup, S., Hansen, H. R., Gammelgaard, B. (2008). Application of enriched stable isotopes as tracers in biological systems: a critical review. Anal. Bioanal. Chem. 390, 541–554. doi: 10.1007/s00216-007-1638-8
Thomas, R. (2013). Practical guide to ICP-MS: a tutorial for beginners. Boca Raton: CRC Press, Taylor & Francis Group.
Walczyk, T. (2001). The potential of inorganic mass spectrometry in mineral and trace element nutrition research. Fresenius J. Anal. Chem. 370, 444–453. doi: 10.1007/s002160100866
Weiss, D. J., Rehkamper, M., Schoenberg, R., McLaughlin, M., Kirby, J., Campbell, P. G. C., et al. (2008). Application of of nontraditional stable-isotope systems to the study of sources and fate of metals in the environment. Environ. Sci. Technol. 42, 655–664. doi: 10.1021/es0870855
Wessells, K. R., Brown, K. H. (2012). Estimating the global prevalence of zinc deficiency: results based on zinc availability in national food supplies and the prevalence of stunting. PloS One 7, e50568. doi: 10.1371/journal.pone.0050568
Wiederhold, J. G. (2015). Metal stable isotope signatures as tracers in environmental geochemistry. Environ. Sci. Technol. 49, 2606–2624. doi: 10.1021/es504683e
Wiggenhauser, M., Bigalke, M., Imseng, M., Keller, A., Rehkämper, M., Wilcke, W., et al. (2018). Using isotopes to trace freshly applied cadmium through mineral phosphorus fertilization in soil-fertilizer-plant systems. Sci. Total Environ. doi: 10.1016/j.scitotenv.2018.08.127
Yang, W.-J., Ding, K.-B., Zhang, P., Qiu, H., Cloquet, C., Wen, H.-J., et al. (2019). Cadmium stable isotope variation in a mountain area impacted by acid mine drainage. Sci. Total Environ. 646, 696–703. doi: 10.1016/j.scitotenv.2018.07.210
Keywords: zinc, stable isotopes, isotope dilution, labelling, soil, organic fertilizer, source tracing, ryegrass
Citation: Dürr-Auster T, Wiggenhauser M, Zeder C, Schulin R, Weiss DJ and Frossard E (2019) The Use of Q-ICPMS to Apply Enriched Zinc Stable Isotope Source Tracing for Organic Fertilizers. Front. Plant Sci. 10:1382. doi: 10.3389/fpls.2019.01382
Received: 10 April 2019; Accepted: 07 October 2019;
Published: 13 November 2019.
Edited by:
Jan Kofod Schjoerring, University of Copenhagen, DenmarkReviewed by:
Therese McBeath, Commonwealth Scientific and Industrial Research Organisation (CSIRO), AustraliaIan William Oliver, Keele University, United Kingdom
Copyright © 2019 Dürr-Auster, Wiggenhauser, Zeder, Schulin, Weiss and Frossard. This is an open-access article distributed under the terms of the Creative Commons Attribution License (CC BY). The use, distribution or reproduction in other forums is permitted, provided the original author(s) and the copyright owner(s) are credited and that the original publication in this journal is cited, in accordance with accepted academic practice. No use, distribution or reproduction is permitted which does not comply with these terms.
*Correspondence: Emmanuel Frossard, emmanuel.frossard@usys.ethz.ch
†These authors have contributed equally to this work