


Abstract
Gaudy plumage coloration is a widespread ornamental trait in birds and thought to be sexually selected. Although much attention has been devoted to structural coloration reflecting in UV, the signaling function of structural colors lacking UV reflectance and those that exhibit iridescence coloration are poorly documented. The train of the peacock (Pavo cristatus), a classical example of a sexually selected trait, is composed of iridescent structurally colored eyespots not reflecting in UV. Until today, the role played by the structural color of the eyespots in female mate choice has never been investigated using spectrometry. We measured eyespot coloration from a stationary angle (static coloration) and the change in coloration resulting from different angles (iridescent coloration). We assessed coloration with reflectance spectrometry, and we analyzed reflectance spectra using 2 methods. First, we extracted the reflectance spectra shape descriptors hue, brightness, and chroma. Second, we computed color and brightness contrasts signaled by eyespot feathers, taking peafowl color visual sensitivity into account. Iridescence was estimated by the maximal change for all parameters. Brightness was correlated with male mating success. The maximal change in color contrast was correlated with both the frequency of male visitation by females and male mating success. These results suggest that peahens can use both static and dynamic (i.e., iridescent) aspects of plumage structural coloration as signals to detect and choose their mates.
Sexual communication between males and females often involves colorful plumage ornaments. Color production can result from 2 separate but not mutually exclusive mechanisms: pigment deposition into the feathers and feather microstructure (Fox and Vevers 1960; Yoshioka and Kinoshita 2002). Structural colors are produced by constructive interference arrays of melanin granules and/or air vacuoles suspended in the keratin (Yoshioka and Kinoshita 2002; Zi et al. 2003; Shawkey et al. 2006). In many bird species, structural colors have the property to change the wavelength of maximal reflectance depending on the angle of the observer or the light source. This property is called iridescence (Newton 1704; Osorio and Ham 2002). Iridescence is presumed to be a very conspicuous signal as any movement of the signaler and/or the receiver will change the color perceived and cause hue shifts (Bennett et al. 1997; Cuthill et al. 1999). Therefore, iridescence should catch females' attention and increase the detectability of the transmitted signal.
Indicator models of sexual selection assume that ornaments are sexually selected because they are costly to produce or to maintain (Zahavi 1975; Grafen 1990). The role played by the pigment-based colors in intra- and intersexual communication and their costs have been extensively investigated (reviewed by Fitzpatrick 1998; Senar 1999; Hill and McGraw 2006). The adaptive function of structurally based color ornaments, and especially iridescent colors, has received less attention until very recently. Although structural coloration is long thought to have evolved under intersexual selection, empirical studies reporting a possible influence of structural color on mate choice are still scarce and most of them are limited to cases in which substantial ultraviolet reflectance is present (reviewed in Siefferman and Hill 2003; Bennett and Théry 2007).
Color ornaments are traditionally considered as simple traits. However, most of them show a tremendous intraspecific variation in their morphological aspect (e.g., shape and size) and their physical properties (e.g., hue, brightness, chroma, and iridescence). A color ornament can therefore be considered as a complex signal, each component acting as a single trait (Grether et al. 2004). As a consequence, theory on the evolution of multiple traits can be applied to color ornaments. For instance, one might speculate that complex color ornaments may increase the probability of detection through the exploitation of a preexisting female sensory bias (Rowe 1999) or may convey additive or redundant information on male quality (Møller and Pomiankowski 1993). In this perspective, the specific role of iridescence in mate choice has not yet been investigated and whether iridescent signals add some evolutionary advantages or are a simple alternative to other possible structural colors is still unsolved (for a discussion, see Cuthill et al. 1999).
The peacock (Pavo cristatus) train represents one of the most complex color ornaments among bird species. The train is composed of “fish tail–like” structure feathers and of 140–170 feathers ending in an eyespot (Manning 1989). Train feathers molt in late summer and start to grow immediately after until the next molt. The eyespots contain various structural colors that change with the angle of viewing (i.e., iridescent) (Burgess et al. 2006) and have been the subject of the oldest scientific descriptions of structural colors (Hooke 1665 in Kinoshita and Yoshioka 2005; Newton 1704). The feather barbule is composed of melanin rods connected by keratin acting as photonic crystals (Zi et al. 2003; Burgess et al. 2006). Interestingly, during the courtship display, the male presents his train to the females from various angles. A visiting female commonly approaches and stops in front of the male, assessing the male at 90° to the surface of the feather. Then, the male turns away, allowing the female to observe the iridescence of his train. If the female interacts with the male, he turns to face her and shivers his train. This sequence of events can be repeated a number of times before the male attempts to mate with the female (Petrie et al. 1992). Previous studies on the traits involved in the process of mate choice in the peafowl revealed that males with a larger number of eyespots achieved a higher mating success (Petrie et al. 1991; Petrie and Halliday 1994; Loyau, Saint Jalme, and Sorci 2005) and that this trait honestly signals male quality (Møller and Petrie 2002; Loyau, Saint Jalme, Cagniant, and Sorci 2005). Yet, the role played by the structural color of the eyespots in mate choice has not been documented.
Color perception is greatly affected by the ambient light (Gomez and Théry 2007), the background, and the color sensitivity of the receiver (Håstad et al. 2005). Therefore, the use of physiological models of color vision may provide a more objective representation of the individual perception of colors compared with the direct use of classical physical properties of a colored patch and have been widely used recently (e.g., Chittka 2001; Théry and Casas 2002; Heiling et al. 2003; Théry et al. 2005; Gomez and Théry 2007). Because both achromatic (intensity related) and chromatic (wavelength related) signals are important for object detection (e.g., for birds: Osorio, Miklosi, and Gonda 1999; Osorio, Vorobyev, and Jones 1999; Schaefer et al. 2006), it is important to analyze colors using a physiological model of vision that incorporates both aspects of color. Such a model computes 2 types of visual contrasts with respect to the background: the brightness contrast (intensity related) and the color contrast (wavelength related).
Here, we test the idea that the eyespot feather is a color ornament whose components (hue, brightness, chroma, and iridescence) affect male detection and selection by females independently of eyespot number and/or density. According to sexual communication theories (for a review, see Maynard Smith and Harper 2003), preferred males are expected to exhibit a more conspicuous plumage, with brighter, more colorful, and more iridescent eyespots. They are expected to be more easily detected by females. Therefore, more visited males are expected to display a higher visual contrast against the background. We also predicted that better quality males with large number of eyespots, high eyespot density, and high display rate are able to produce more colorful and iridescent eyespots. To explore the overall signaling function of the eyespots, we first investigated the eyespot reflectance properties at normal light incidence and reflectance to mimic an observer facing the male. Second, we assessed the iridescent properties of the eyespot by varying the reflectance angle to mimic the male turning movement during the courtship. The morphological and physiological characteristics of the peafowl's eye being known (Hart 2002), we computed them into a physiological model of color vision to obtain a reliable representation of peahen vision.
METHODS
Behavioral observations and feather collection
During the breeding season 2003, we monitored a population of peafowl in the Parc Zoologique de Clères (France) where birds were marked with numbered and colored metallic rings. The park of 13 ha was located in Northern France (01°06′N, 49°36′W) and consisted of lawns surrounded by bushes and woodlands. The source and number of birds were unknown because the population was already present in the park when the National Museum of Natural History acquired it 35 years ago. Peafowls were free ranging and were not used to be caught or manipulated but were acclimated to humans visiting the park. They fed by foraging on natural resources, and by food supplementation provided twice daily. Their breeding behavior was not restricted.
We performed 300 h of focal observations to record the female visitation rate and the number of copulations obtained by 22 males. Observation sequences were performed from 14 April to 07 July, between 0900 and 1730, with a mean length of about 2 h per sequence. All males were territorial, that is, they defended small territories where they displayed and mated, and displayed in the same lek. The lek was monitored from 3 different sites (i.e., 100 h of observation per site), with up to 8 males simultaneously observed. A female visit was defined as a female interacting with a displaying male to assess a potential mate. The sequences of events were described by Petrie et al. (1992). We calculated the female visitation rate as the number of visits a male received divided by the duration of the observation sequence. For each male, we calculated the mean female visitation rate over the observation period. The male mating success corresponds to the total number of copulations obtained by a given male over the observation period. Both female visitation rate and number of copulations gained by a male showed a Poisson distribution. Few females copulated repeatedly with the same male. The results obtained were identical when we used the number of copulating females instead of the total number of copulations gained by a male. We used the total number of copulations gained by a male as an index of male mating success to be consistent with a previous study (Loyau, Saint Jalme, and Sorci 2005).
Each male was photographed with its train fully displayed using a digital camera. The photographs were used to count the number of eyespots. The individuals were caught to measure the train length (from the base of the tail to the tip of the longest feather) and to collect an eyespot feather. Eyespots were carefully plucked from the same location of the train (i.e., 20 cm from the base of the tail along the longitudinal axis) and were stored in separate envelopes until spectrometric analyses were conducted. We computed the eyespot density as the eyespot number divided by the surface of the train, assuming that the train has a semicircle shape with a radius equal to train length (Loyau, Saint Jalme, and Sorci 2005).
Measurements at normal incident and reflected light angles
Measurements were conducted at fixed incident and reflected light angles perpendicular to the feather surface, mimicking a receiver placed in front of the peacock. This means that both the illumination and reflectance angles were 90° from the feather surface.
Spectral data were recorded at the CNRS UMR 7179 (Brunoy, France) with a spectroradiometer (Avantes AvaSpec-2048) calibrated between 290 and 838 nm, blindly to feather origin. Wavelength calibration was checked before and after the experiment with an Ocean Optics Mercury Argon light source HG-1. Reflectance was measured relative to a Spectralon white standard (Labsphere, Congleton, UK) and to the dark noise using a 1.5-mm-diameter fiber optic sensor (FCR-7UV200-2-1.5 × 100) inserted in a miniature black chamber (Théry et al. 2005). Feathers laid on an adjustable mounting stand and on black felt to eliminate stray reflection from the background. The tip of the sensor was fixed at 2.3 mm and 90° from the feather surface. The coaxial probe was also fixed at 90° from the feather surface. Illumination was provided with a deuterium–halogen light source (DH-2000 Ocean Optics) emitting between 215 and 1500 nm. The reading area location was in the green–blue part of the eyespot and chosen to allow similar measurements across the individuals (Figure 1). To assess the repeatability of measurements, we measured each eyespot feather 5 times.
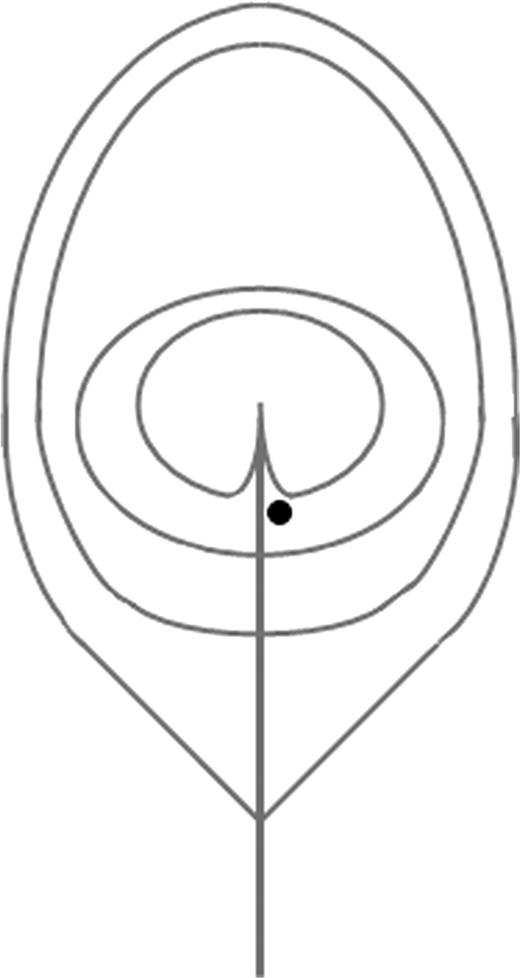
Measurement location on the eyespot. The black dot shows the location of the measurement spot.
We computed hue, brightness, and chroma as reflectance spectra shape descriptors. Those variables are commonly used to quantify color. Brightness is the total reflectance over the wavelength 300–700 nm (Endler 1990; Andersson et al. 1998; Örnborg et al. 2002; Shawkey et al. 2005). Hue is the location in wavelength of the maximal reflectance over this range (e.g., Andersson et al. 1998; Örnborg et al. 2002; Delhey et al. 2003; Shawkey et al. 2005). Chroma was computed as Abs [(Rmax − Rmin)/Rav]with Rmax being the maximal reflectance, Rmin the minimal reflectance, and Rav the average reflectance over the range 300–700 nm (Örnborg et al. 2002; Delhey et al. 2003).
Measurements of iridescence
Measurements were performed at the University of Bristol (Bristol, UK). To investigate iridescence, the variation in reflectance due to change in the angle of observation, we used separate fiber optic cables for transmitting incident and reflected light. The illuminating fiber optic was held at 45° to normal, and the measuring fiber was held by a Zeiss GK 21 goniometer to enable variation of the reflectance angle. We recorded reflectance at angles of 45°, 50°, 55°, 60°, 65°, 70°, 75°, 80°, 85°, and 90° relative to the incident light. This means that a 45° angle relative to the incident beam corresponds to a 90° reflectance angle relative to the feather surface. Prior to measurement, we mounted each feather on black velvet. We recorded reflectance spectra with a Zeiss MCS 500 spectrophotometer sensitive within the range 300–810 nm, relative to a Spectralon white standard (Labsphere), and under illumination by a Zeiss CLX Xenon lamp within 220–1000 nm. A dark current reading was taken before each spectral measurement, and reflectance was measured from an approximately 2–mm-diameter area as in earlier studies (e.g., Bennett et al. 1997; Cuthill et al. 1999; Langmore and Bennett 1999). Again, the sample area location was in the green-blue part of the eyespot. We computed hue, brightness, and chroma as described above.
To assess the iridescence perceived by the females when the males rotate their trains, we calculated, for each individual, the difference between the maximal value and the minimal value of hue, brightness, and chroma. Such a difference provides an estimation of the maximal variation across viewing angles that a given eyespot can transmit to the receiver, that is, an estimate of iridescence. We thereafter refer to those differences as maximal change in hue, maximal change in brightness, and maximal change in chroma. This method of calculation implies that the angles involved in calculation may vary across individuals.
Color contrast and brightness contrast

In the studied area, peacocks perform their courtship displays in grasslands. The ground was flat with a slight slope. In the park, some peacocks displayed in depressions in the ground but none of them were included in the study. We took a large gap irradiance spectrum to describe the ambient light environment. In addition, we averaged the reflectance spectra of 10 herbs randomly chosen in temperate grassland to obtain a mean background reflectance spectrum (Figure 2). Spectra for single and double cones spectral sensitivity were obtained using microspectrophotometry (Hart 2002).
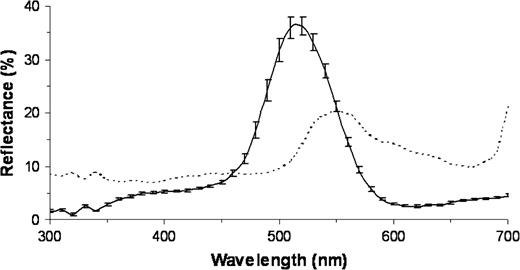
Mean reflectance spectrum of the structural coloration of the eyespots measured at 90° to the reading surface (solid line) and of the background (broken line). The general height of the curve for the eyespot varies depending on the angle at which the eyespot is analyzed. Bars represent standard errors.
We computed color and brightness contrasts for reflectance measurements of both normal incidence and iridescence.
Statistical analysis
Repeatability of brightness, hue, chroma, color contrasts, and brightness contrasts were assessed on one eyespot feather from the overall sampled individuals repeated 5 times with Kendall's coefficient of concordance (De Rosa et al. 2003). Each sequence of the individuals was randomly chosen. For all other analyses, we first averaged the 5 reflectance spectra taken for each eyespot to obtain a mean reflectance spectrum that was then analyzed using the visual model. Colinearity between the variables was investigated with Pearson correlations using sequential Bonferroni corrections for multiple tests (Rice 1989) to assess their significance (SAS Institute 1999).
We first investigated whether the structural coloration of the eyespot influences female visitation rate and male mating success at normal incidence and reflectance. The influence of brightness, hue, chroma, color contrast, and brightness contrast was investigated using generalized linear models (proc GENMOD, SAS Institute 1999) with Poisson distribution of error terms and log as the corresponding link function. We conducted a stepwise procedure with a backward elimination on a 5% level. Female visitation rate or male mating success was entered as the dependent variable. We constructed 2 models. The “shape model” involved variables derived from the shape of the spectrum (i.e., brightness, hue, and chroma), whereas the “physiological model” involved contrasts derived from incorporation of the vision model (i.e., color contrast and brightness contrast). Brightness, hue, chroma, number of eyespots, and displaying rate were entered as independent variables in the shape model, and color contrast, brightness contrast, number of eyespots, and displaying rate were the independent variables in the physiological model. To retain the overall information contained in the hue, chroma, and brightness variables, we did not use principal component analysis (PCA). Indeed, it is common that the axes of the PCA do not load on chroma, leading to a loss of this information (for a discussion of the different statistical methods, see Endler and Mielke 2005). Some variables included in the models as independent factors were correlated to each other. However, in most of the models, only one variable per model was statistically significant. In one case, 2 variables were statistically significant, and we additionally ran separate models with the 2 variables to check for a type II error.
We examined the role played by the iridescence of eyespots. We similarly used multiple generalized linear models (proc GENMOD, SAS Institute 1999) with Poisson distribution of error terms and log as the corresponding link function and a backward elimination procedure. Female visitation rate and male mating success were the dependent variables. In the shape model, maximal change in brightness, maximal change in hue, maximal change in chroma, number of eyespots, and displaying rate were the independent variables. In the physiological model, the independent variables were maximal change in color contrast, maximal change in brightness contrast, number of eyespots, and displaying rate.
Finally, to investigate together the effects of the variables under normal incidence and under various incidences, we included in the same model the variables that were significantly associated with female visitation rate and male mating success.
RESULTS
Normal incident and reflected light angles
Shape model
The green–blue coloration of the eyespot feather did not exhibit any UV reflectance peak (Figure 2). Hue, brightness, and chroma were highly repeatable (hue: degrees of freedom [df] = 21, W = 0.93, χ2 = 97.36, P < 0.001; brightness: df = 21, W = 0.74, χ2 = 78.18, P < 0.001; chroma: df = 21, W = 0.73, χ2 = 76.51, P < 0.001). These variables were not correlated with the eyespot number or the eyespot density in the train (all P values > 0.05). The brightness was correlated with both the hue and the chroma (respectively: r = −0.49, P = 0.012; r = 0.57, P = 0.006; n = 22). The display rate was positively correlated with the brightness (r = 0.49, P = 0.022, n = 22), negatively correlated with the hue (r = −0.59, P = 0.004, n = 22), and was not correlated with the chroma (r = 0.18, P = 0.410, n = 22).
The female visitation rate experienced by a male was explained by the hue alone (Table 1). Females preferentially visited males with a hue shifted toward shorter wavelengths, showing a reflectance peak in the 505–515 nm range. The male mating success was positively predicted by the brightness alone with females preferring to mate with the brightest males (Table 1, Figure 3).
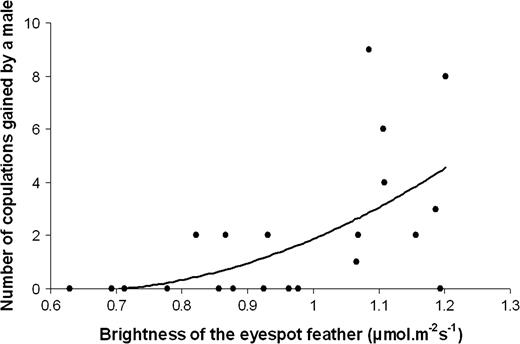
Positive correlation between the number of copulations obtained by a male and the brightness of the eyespot feather. Total brightness (spectral intensity) is a measure of the total photon flux reflected between 300 and 700 nm. This parameter is expressed in micromoles per square meter per second, relative to an incident light of 10 μmol m−2.s−1.
Backward generalized linear models for the eyespot coloration at normal incident and reflected light angles
| Dependent variable | Independent variable | df | Estimate | Standard error | F | P | |
| Female visitation rate | Shape model | Brightness | 1,18 | 0.0015 | 0.0010 | 2.62 | 0.1230 |
| Hue | 1,20 | −0.1291 | 0.0473 | 9.25 | <0.01 | ||
| Chroma | 1,19 | −0.8757 | 1.0785 | 0.65 | 0.4290 | ||
| Number of eyespots | 1,17 | 0.1020 | 0.0689 | 2.67 | 0.1206 | ||
| Displaying rate | 1,16 | 0.9148 | 0.6323 | 2.12 | 0.1647 | ||
| Physiological model | Color contrast | 1,19 | −0.1940 | 0.1503 | 1.96 | 0.1774 | |
| Brightness contrast | 1,17 | −0.0275 | 0.3619 | 0.01 | 0.9401 | ||
| Number of eyespots | 1,18 | 0.0847 | 0.0735 | 1.51 | 0.2349 | ||
| Displaying rate | 1,20 | 1.1178 | 0.4558 | 5.25 | <0.05 | ||
| Male mating success | Shape model | Brightness | 1,20 | 0.0015 | 0.0005 | 12.93 | <0.01 |
| Hue | 1,16 | −0.0122 | 0.0477 | 0.07 | 0.8011 | ||
| Chroma | 1,19 | −1.4132 | 1.1358 | 1.52 | 0.2321 | ||
| Number of eyespots | 1,17 | 0.0260 | 0.0444 | 0.35 | 0.5635 | ||
| Displaying rate | 1,18 | 0.2601 | 0.4431 | 0.33 | 0.5711 | ||
| Physiological model | Color contrast | 1,18 | 0.0667 | 0.1041 | 0.40 | 0.5352 | |
| Brightness contrast | 1,17 | 0.0109 | 0.3375 | 0.00 | 0.9746 | ||
| Number of eyespots | 1,19 | 0.0294 | 0.0502 | 0.36 | 0.5529 | ||
| Displaying rate | 1,20 | 0.6746 | 0.4284 | 2.22 | 0.1522 |
The bold values indicate that P is significant at the 0.05 level.
Physiological model
Color contrast and brightness contrast were found highly repeatable (color contrast: df = 21, W = 0.85, χ2 = 88.89, P < 0.001; brightness contrast: df = 21, W = 0.48, χ2 = 50.34, P < 0.001). Color contrast was correlated with hue and chroma (respectively: r = −0.48, P = 0.025; r = 0.72, P = 0.001; n = 22), whereas brightness contrast was not correlated with brightness (r = −0.37, P = 0.091, n = 22). Color contrast, brightness contrast, eyespot density, and number of eyespots were not correlated with each other (all P values > 0.05). Interestingly, the display rate was positively correlated with the color contrast (r = 0.45, P = 0.034, n = 22) and not correlated with the brightness contrast (r = 0.02, P = 0.934, n = 22). The female visitation rate and the number of copulations obtained by a male were not explained by the color contrast or the brightness contrast (Table 1).
Iridescence
Shape model
Maximal change in chroma was not correlated with maximal change in hue or maximal change in brightness (all P values > 0.05), but maximal change in hue and maximal change in brightness were positively correlated with each other (r = 0.61, P = 0.0026, n = 22). None of these variables was correlated with the eyespot number, the eyespot density in the train, or the display rate (all P values > 0.05).
The female visitation rate was explained by the display rate alone (Table 2); the males exhibiting the highest display rate being the most visited by the females. Female mate choice was not explained by maximal changes in chroma, hue, or brightness (Table 2).
Backward generalized linear models for the eyespot iridescence
| Dependent variable | Independent variable | df | Estimate | Standard error | F | P | |
| Female visitation rate | Shape model | Brightness | 1,19 | 3.8284 | 2.2027 | 2.56 | 0.1260 |
| Hue | 1,16 | −0.0073 | 0.2122 | 0.00 | 0.9728 | ||
| Chroma | 1,17 | 1.8748 | 4.0575 | 0.22 | 0.6434 | ||
| Number of eyespots | 1,18 | 0.0826 | 0.0715 | 1.50 | 0.2361 | ||
| Displaying rate | 1,20 | 1.1178 | 0.4558 | 5.25 | <0.05 | ||
| Physiological model | Color contrast | 1,19 | 0.8597 | 0.3218 | 9.40 | <0.01 | |
| Brightness contrast | 1,19 | −0.2567 | 0.1187 | 4.54 | <0.05 | ||
| Number of eyespots | 1,18 | 0.0476 | 0.0579 | 0.73 | 0.4035 | ||
| Displaying rate | 1,17 | −0.3842 | 0.6204 | 0.39 | 0.5385 | ||
| Male mating success | Shape model | Brightness | 1,16 | 1.5639 | 3.9733 | 0.15 | 0.7082 |
| Hue | 1,19 | −0.1241 | 0.1125 | 1.22 | 0.2832 | ||
| Chroma | 1,17 | 2.1902 | 2.9816 | 0.57 | 0.4605 | ||
| Number of eyespots | 1,18 | 0.0580 | 0.0539 | 1.28 | 0.2730 | ||
| Displaying rate | 1,20 | 0.6746 | 0.4284 | 2.22 | 0.1522 | ||
| Physiological model | Color contrast | 1,20 | 0.5343 | 0.2421 | 5.76 | <0.05 | |
| Brightness contrast | 1,18 | 0.0828 | 0.1973 | 0.19 | 0.6722 | ||
| Number of eyespots | 1,17 | 0.0044 | 0.0464 | 0.01 | 0.9255 | ||
| Displaying rate | 1,19 | 0.3119 | 0.4135 | 0.56 | 0.4645 |
The bold values indicate that P is significant at the 0.05 level.
Physiological model
Maximal changes in color contrast and brightness contrast were negatively correlated (r = −0.47, P = 0.0258, n = 22). Maximal change in color contrast was not correlated with maximal changes in hue or chroma, and maximal change in brightness contrast was not correlated with maximal change in brightness (all P values > 0.05). Maximal change in color contrast was not correlated with eyespot density, number of eyespots, or display rate (all P values > 0.05), whereas maximal change in brightness contrast was negatively correlated with the display rate (r = −0.67, P = 0.0006, n = 22). Maximal change in color contrast significantly explained the female visits and male mating success (Table 2, Figure 4), whereas maximal change in brightness contrast did not explain any of those variables (Table 2).
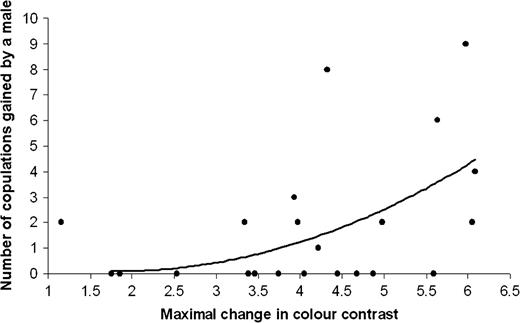
Positive correlations between the number of copulations obtained by a male and the maximal change in color contrast of the eyespot feather.
Normal incidence and iridescence
When hue, maximal change in color contrast, and maximal change in brightness contrast were included in the same model, the female visitation rate was explained by the maximal change in color contrast alone (hue: F1,18 = 2.57, P = 0.1265; maximal change in color contrast: F1,18 = 5.41, P = 0.0319; maximal change in brightness contrast: F1,18 = 2.97, P = 0.1020).
Male mating success was positively explained by both the brightness and the maximal change in color contrast when these 2 variables were included in the same model (brightness: F1,19 = 12.36, P = 0.0023; maximal change in color contrast: F1,19 = 5.53, P = 0.0296). The results of this last model show that male mating success was independently correlated with brightness and maximal change in color contrast.
DISCUSSION
Our results suggest that females use the maximal change in color contrast, which is produced by iridescence, and the hue of male eyespot feathers to detect potential mates and visit them. In addition, the brightness of the eyespot feather, their maximal change in color contrast, and their maximal change in brightness contrast were good predictors of male mating success. As the brightness and the maximal change in color contrast were independent of eyespot number and density, iridescent structural coloration per se has the potential to affect mating decision in the peafowl.
To understand how females detect and choose their mates, we took the peafowl visual sensitivity into account and computed the brightness and the color contrasts using a physiological model. The model suggests that at least the differences in maximal change in color contrast between males are well perceived by the females and may constitute a signal for mate choice. An experimental approach is nevertheless needed to confirm that females are able to perceive interindividual variation in hue and brightness and use them for mate choice.
Male mating success was predicted by iridescence, in particular the maximal change in color contrast, indicating that females are able to perceive and to use the chromatic variations in iridescence between males to choose their mate. On the other hand, when examining the “static display,” the shape descriptors (hue, brightness, and chroma) tended to better explain female preferences than the color and the brightness contrasts. Indeed, unlike hue, color contrast did not explain female visits or mate choice. Moreover, brightness contrast was not correlated with female visits or mate choice, unlike brightness. Most differences between peafowl plumage colors occur in the range 470–570 nm, whereas peafowl double cones have a maximal absorption near 570 nm in the green. As a consequence, double cones may not capture the main variation in brightness and hue that exists between colors. However, we cannot discard the possibility that the perception of subtle variation in brightness and in hue may be biologically relevant. In line with this idea, we found that females prefer to visit males with eyespots with a hue shifted toward shorter wavelengths (505–515 nm, i.e., bluer), suggesting that they seem to avoid males with greener eyespots (above 515 nm). This preference may play a role in species recognition, preventing females P. cristatus to mate with males of the close-related Green peafowl Pavo muticus in nature. Indeed, distribution areas of the 2 species were sympatric in Northern–Eastern India before P. muticus disappearance from this area (Hennache and Ottaviani 2006).
The use of physiological models of color vision is expected to provide a more objective representation of the individual perception of colors than the shape descriptors (Chittka 2001; Théry and Casas 2002; Théry et al. 2005; Gomez and Théry 2007). However, the representation used in the present study is restricted to certain circumstances, against a specific background and under particular light condition that vary in the field, consequently restricting the natural variations that the females actually perceive in the static display. Given the correlative nature of the present study and the small sample size, an experimental approach is needed to better understand the nature of the signal perceived by the females and used for mate choice.
Female preference for males with greater UV reflectance is well documented and has been found in an increasing number of bird species (zebra finch Taeniopygia guttata: Bennett et al. 1996; starling Sturnus vulgaris: Bennett et al. 1997; bluethroat Luscinia s. svecica: Andersson and Amundsen 1997; Johnsen et al. 1998; blue tit Parus caeruleus: Hunt et al. 1999; Sheldon et al. 1999; budgerigar Melopsittacus undulatus: Pearn et al. 2001, 2003; black-capped chickadee Poecile atricapillus: Woodcock et al. 2005; red grouse Lagopus lagopus scoticus: Mougeot et al. 2005) and some fish (guppy Poecilia reticulata: Kodric-Brown and Johnson 2002; Smith et al. 2002; amarillo Girardinichthys multiradiatus: Macías Garcia and de Perera 2002; 3-spined stickleback Gasterosteus aculeatus: Rick et al. 2006), whereas evidence of female preferences for nonultraviolet structural color is lacking. To our knowledge, the present study is the first to show the possible influence of such a structural color lacking UV reflectance on mate choice. Furthermore, the ability for the males of many bird species to produce a color varying with the angle of observation (i.e., iridescence) has a long history in fascinating scientists (Hooke 1665 in Kinoshita and Yoshioka 2005; Newton 1704; Darwin 1871) and is thought to be a sexually selected trait (Darwin 1871; Cuthill et al. 1999). Our results suggest, for the first time, that iridescence may play a specific role in shaping female preferences.
In the peacock, multiple traits are under intersexual selection. Females value both a behavioral trait, the display activity, and a morphological trait, the eyespot number/density, to choose a mate (Petrie et al. 1991; Petrie and Halliday 1994; Loyau, Saint Jalme, and Sorci 2005). The expression of the behavioral trait amplifies the expression of the morphological trait because the eyespot density or number can only be assessed by females when males display their train during the courtship (Loyau, Saint Jalme, Cagniant, and Sorci 2005). The present study reveals that the assessed signal may be more complex than previously thought. The train appears to be a multiple trait composed of eyespot density and structural iridescent coloration, one potentially increasing the detectability of the other one (Hasson 1989; Rowe 1999). Moreover, different components of the eyespot coloration, the eyespot brightness perceived from a “normal angle” perspective, and the eyespot iridescence perceived from varying angles of observation are potentially involved in mate choice, suggesting that the eyespot itself may be a multiple trait.
The peafowl is a lekking species. Therefore, females are expected to value male quality before mating because males provide nothing but gametes. Supporting this idea, females produce offspring with higher survival prospects when mated with more ornamented males (Petrie 1994). The peacock train is thought to be costly to produce and maintain (Petrie et al. 1991), and the eyespot number has been shown to be an honest indicator of male health status and ability to cope with an immune challenge (Loyau, Saint Jalme, Cagniant, and Sorci 2005). The different components of the peacock train (eyespot density, eyespot “static” color, and eyespot iridescence) may reflect different properties of male quality or may signal the same redundant information on male quality (Møller and Pomiankowski 1993). However, whether eyespot color and iridescence honestly advertise male condition remains unknown. Studies in other bird species revealed a relationship between male quality and the expression of structural colors, especially plumage brightness (Keyser and Hill 2000; Doucet 2002; Doucet and Montgomerie 2003; Siefferman and Hill 2003). McGraw et al. (2002) and Siefferman and Hill (2005a) subjected, respectively, male brown-headed cowbirds Molothrus ater and female eastern bluebirds Sialia sialis to stressful nutritional conditions. They found that the expression of structurally based colors was affected by the nutritional stress. Moreover, male eastern bluebirds with experimentally increased parental effort reduced their plumage brightness the subsequent year compared with males with decreased parental effort (Siefferman and Hill 2005b). Altogether, these results suggest that structural color patches can be honest signals of condition. Hill et al. (2005) provided the first experimental evidence of the suppression of the expression of iridescence by inoculation of male wild turkeys Meleagris gallopavo with parasites. Even if not quantifying iridescence by variation of the incidence or reflectance angles, this work strongly highlights that plumage iridescence may reliably signal the health of an individual. The handicap indicator theory states that a signal has to be costly to be reliable (Zahavi 1975; Grafen 1990). The costs of producing structural color patches are less obvious than for pigment-based colors but are thought to rely on the ontogenetic costs of growing a complex and precise microstructure of melanin granules and/or air vacuoles enclosed in keratin (Fitzpatrick 1998). Therefore, structural colors may constitute an indicator of developmental stability. Moreover, structural colors being vulnerable to damage and abrasion, especially when situated in the bird tail feathers like in the peacock, are thought to reveal feather quality (Fitzpatrick 1998).
In short, we provide the first evidence that structural coloration and iridescence of the eyespots of the peacock's train may have evolved under intrasexual selection. Females potentially use the maximal change in color contrast (i.e., a feature of the iridescence) of the eyespots to detect males at longer distance and to choose to visit them. Furthermore, they may use the brightness of the eyespots and the maximal change in color contrast at shorter range to assess potential mates. However, more work is needed to investigate the signaling function of structural color in this species.
FUNDING
CNRS (UMR 5561, 5173, 7179); MNHN; Conseil Général de Seine Maritime; BBSRC and Leverhulme Trust (A.T.D.B.).
We would like to thank M.E. Hauber, L. Siefferman, and an anonymous reviewer for helpful comments and suggestions. This is a publication of the Behavioural Ecology Research Group CNRS Groupement de Recherche 2155.
