Decentralized Valorization of Residual Flows as an Alternative to the Traditional Urban Waste Management System: The Case of Peñalolén in Santiago de Chile


Abstract
:1. Introduction
2. Methodology
2.1. Overall Approach
2.2. Material Flow Analysis
2.3. System Evaluation
2.4. Baseline Description
2.4.1. Nutrient Inputs
2.4.2. OSW Production and Characterization
2.4.3. Current Resource (Re) Use Practices
2.4.4. Resource Demand
2.5. Resource Recovery Options
2.5.1. Organic Residues Treatment
2.5.2. Urine Treatment
3. Results
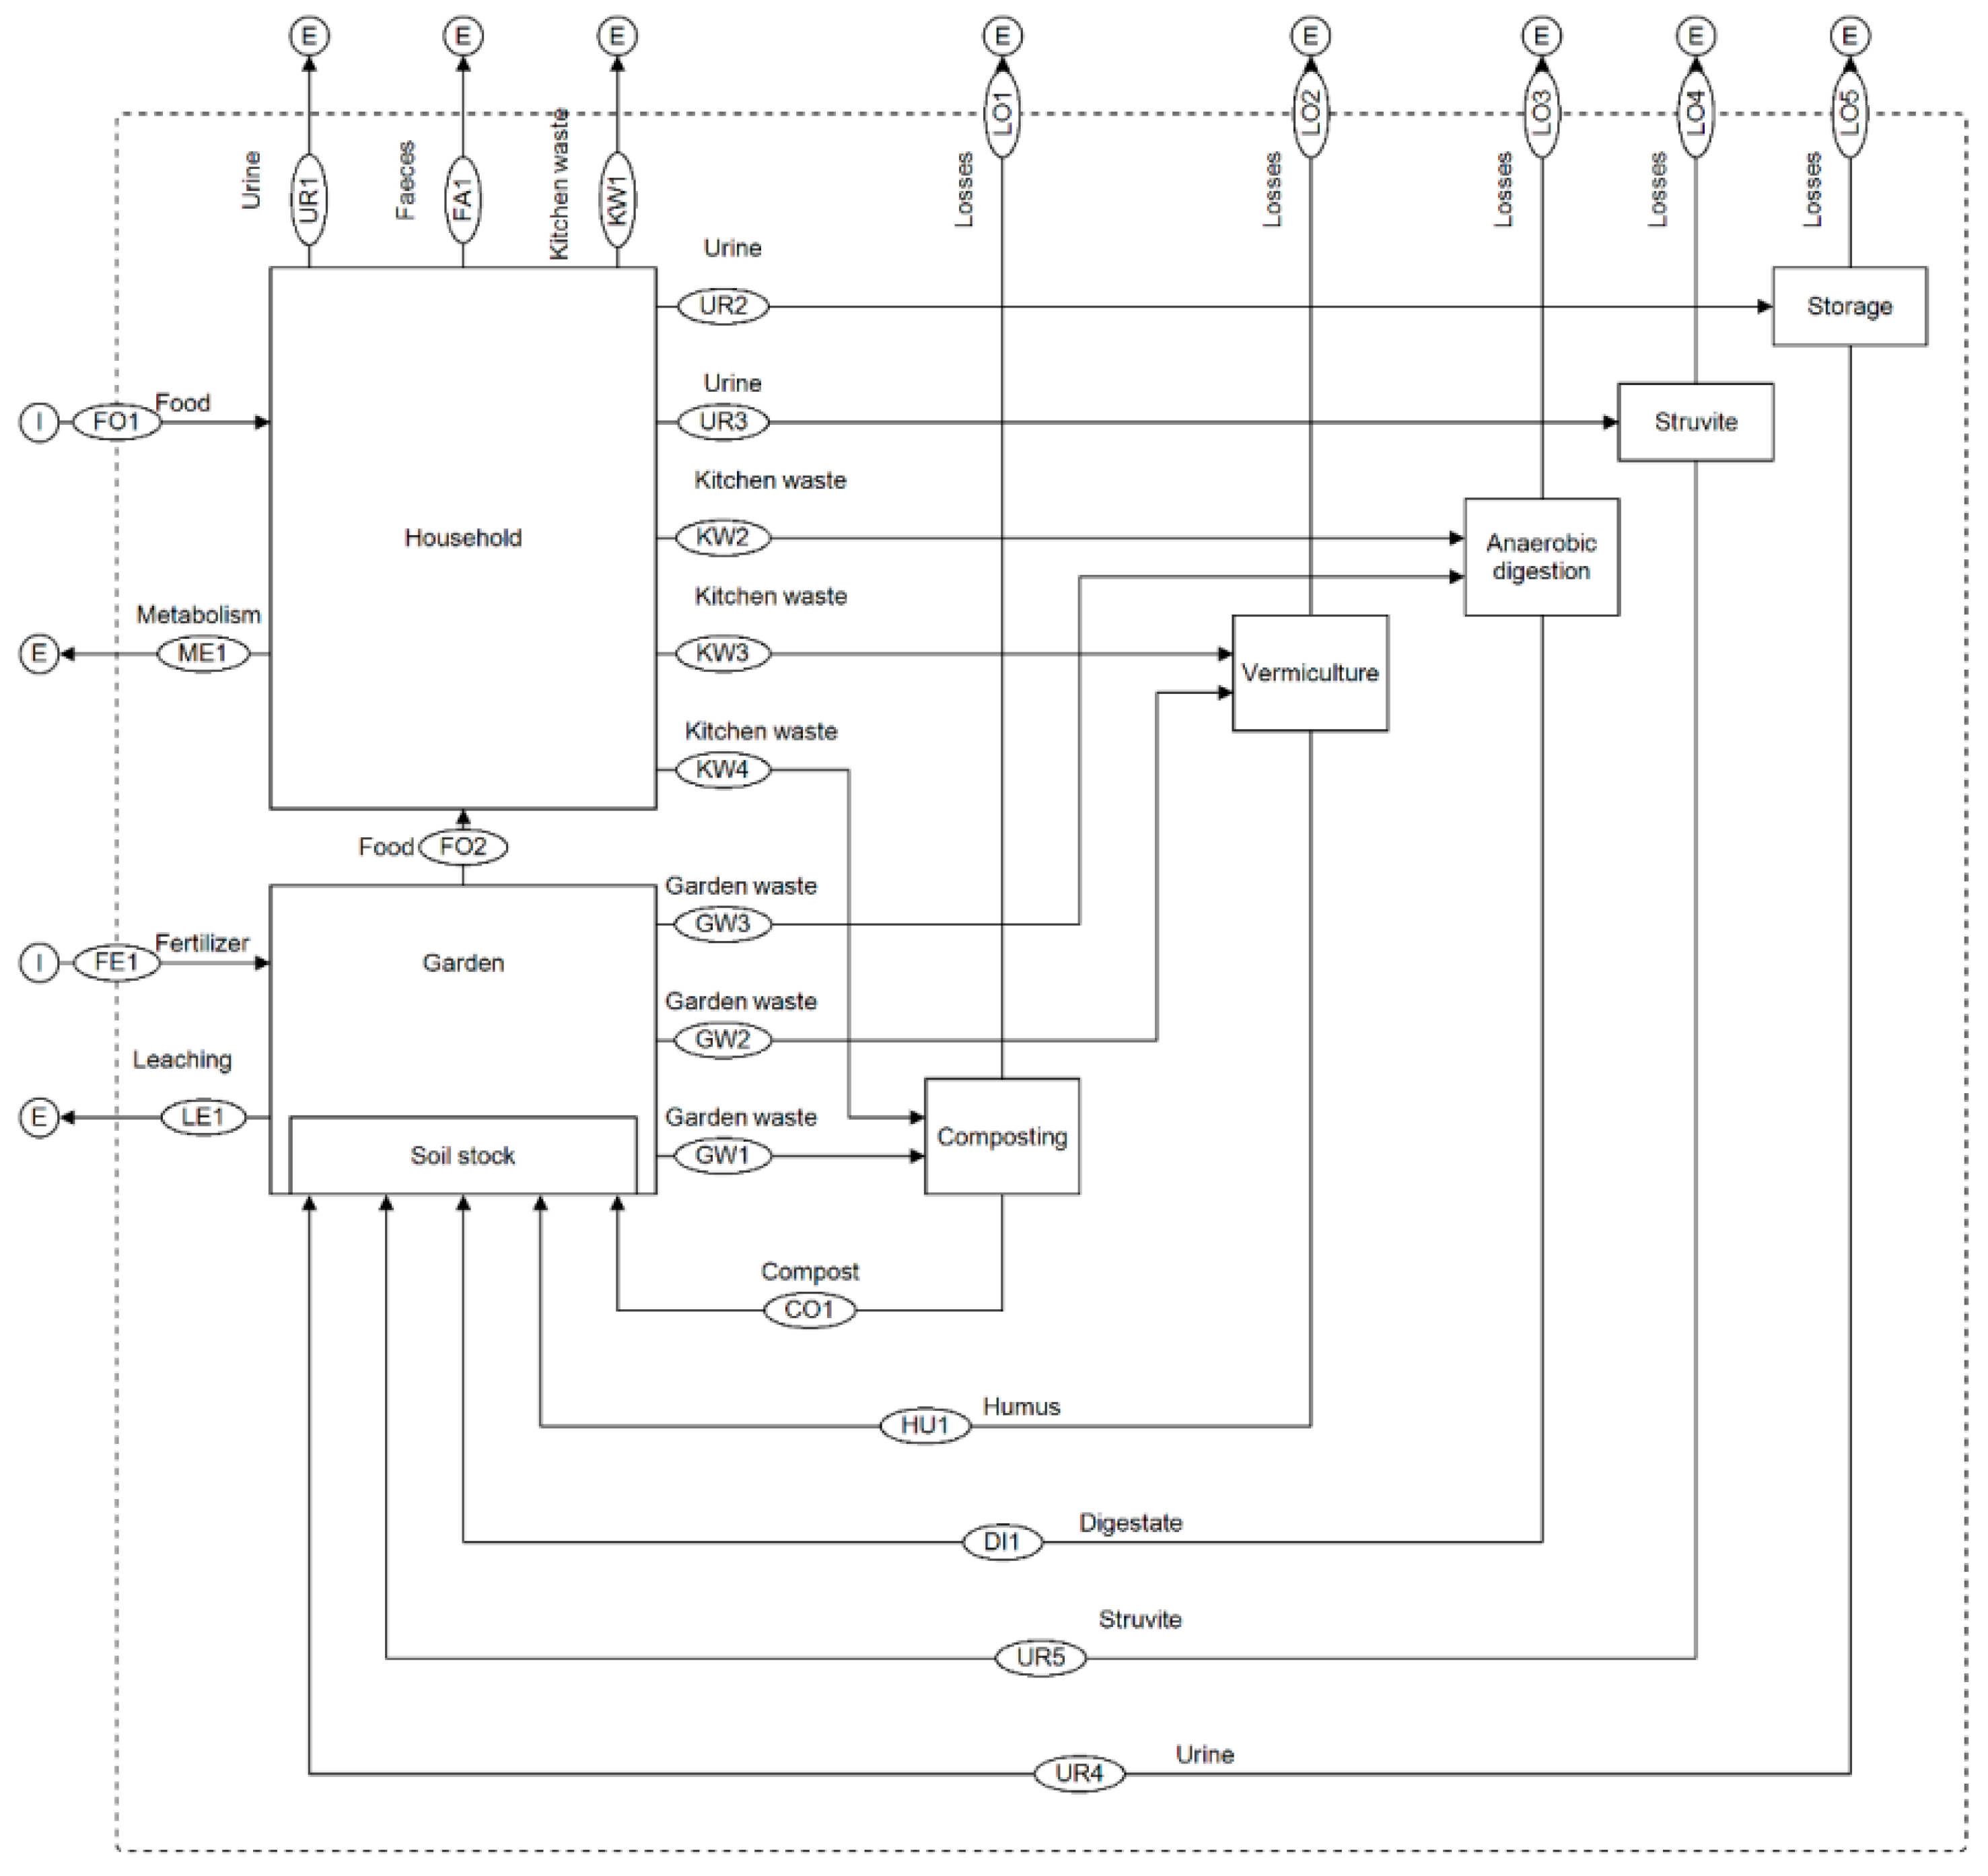
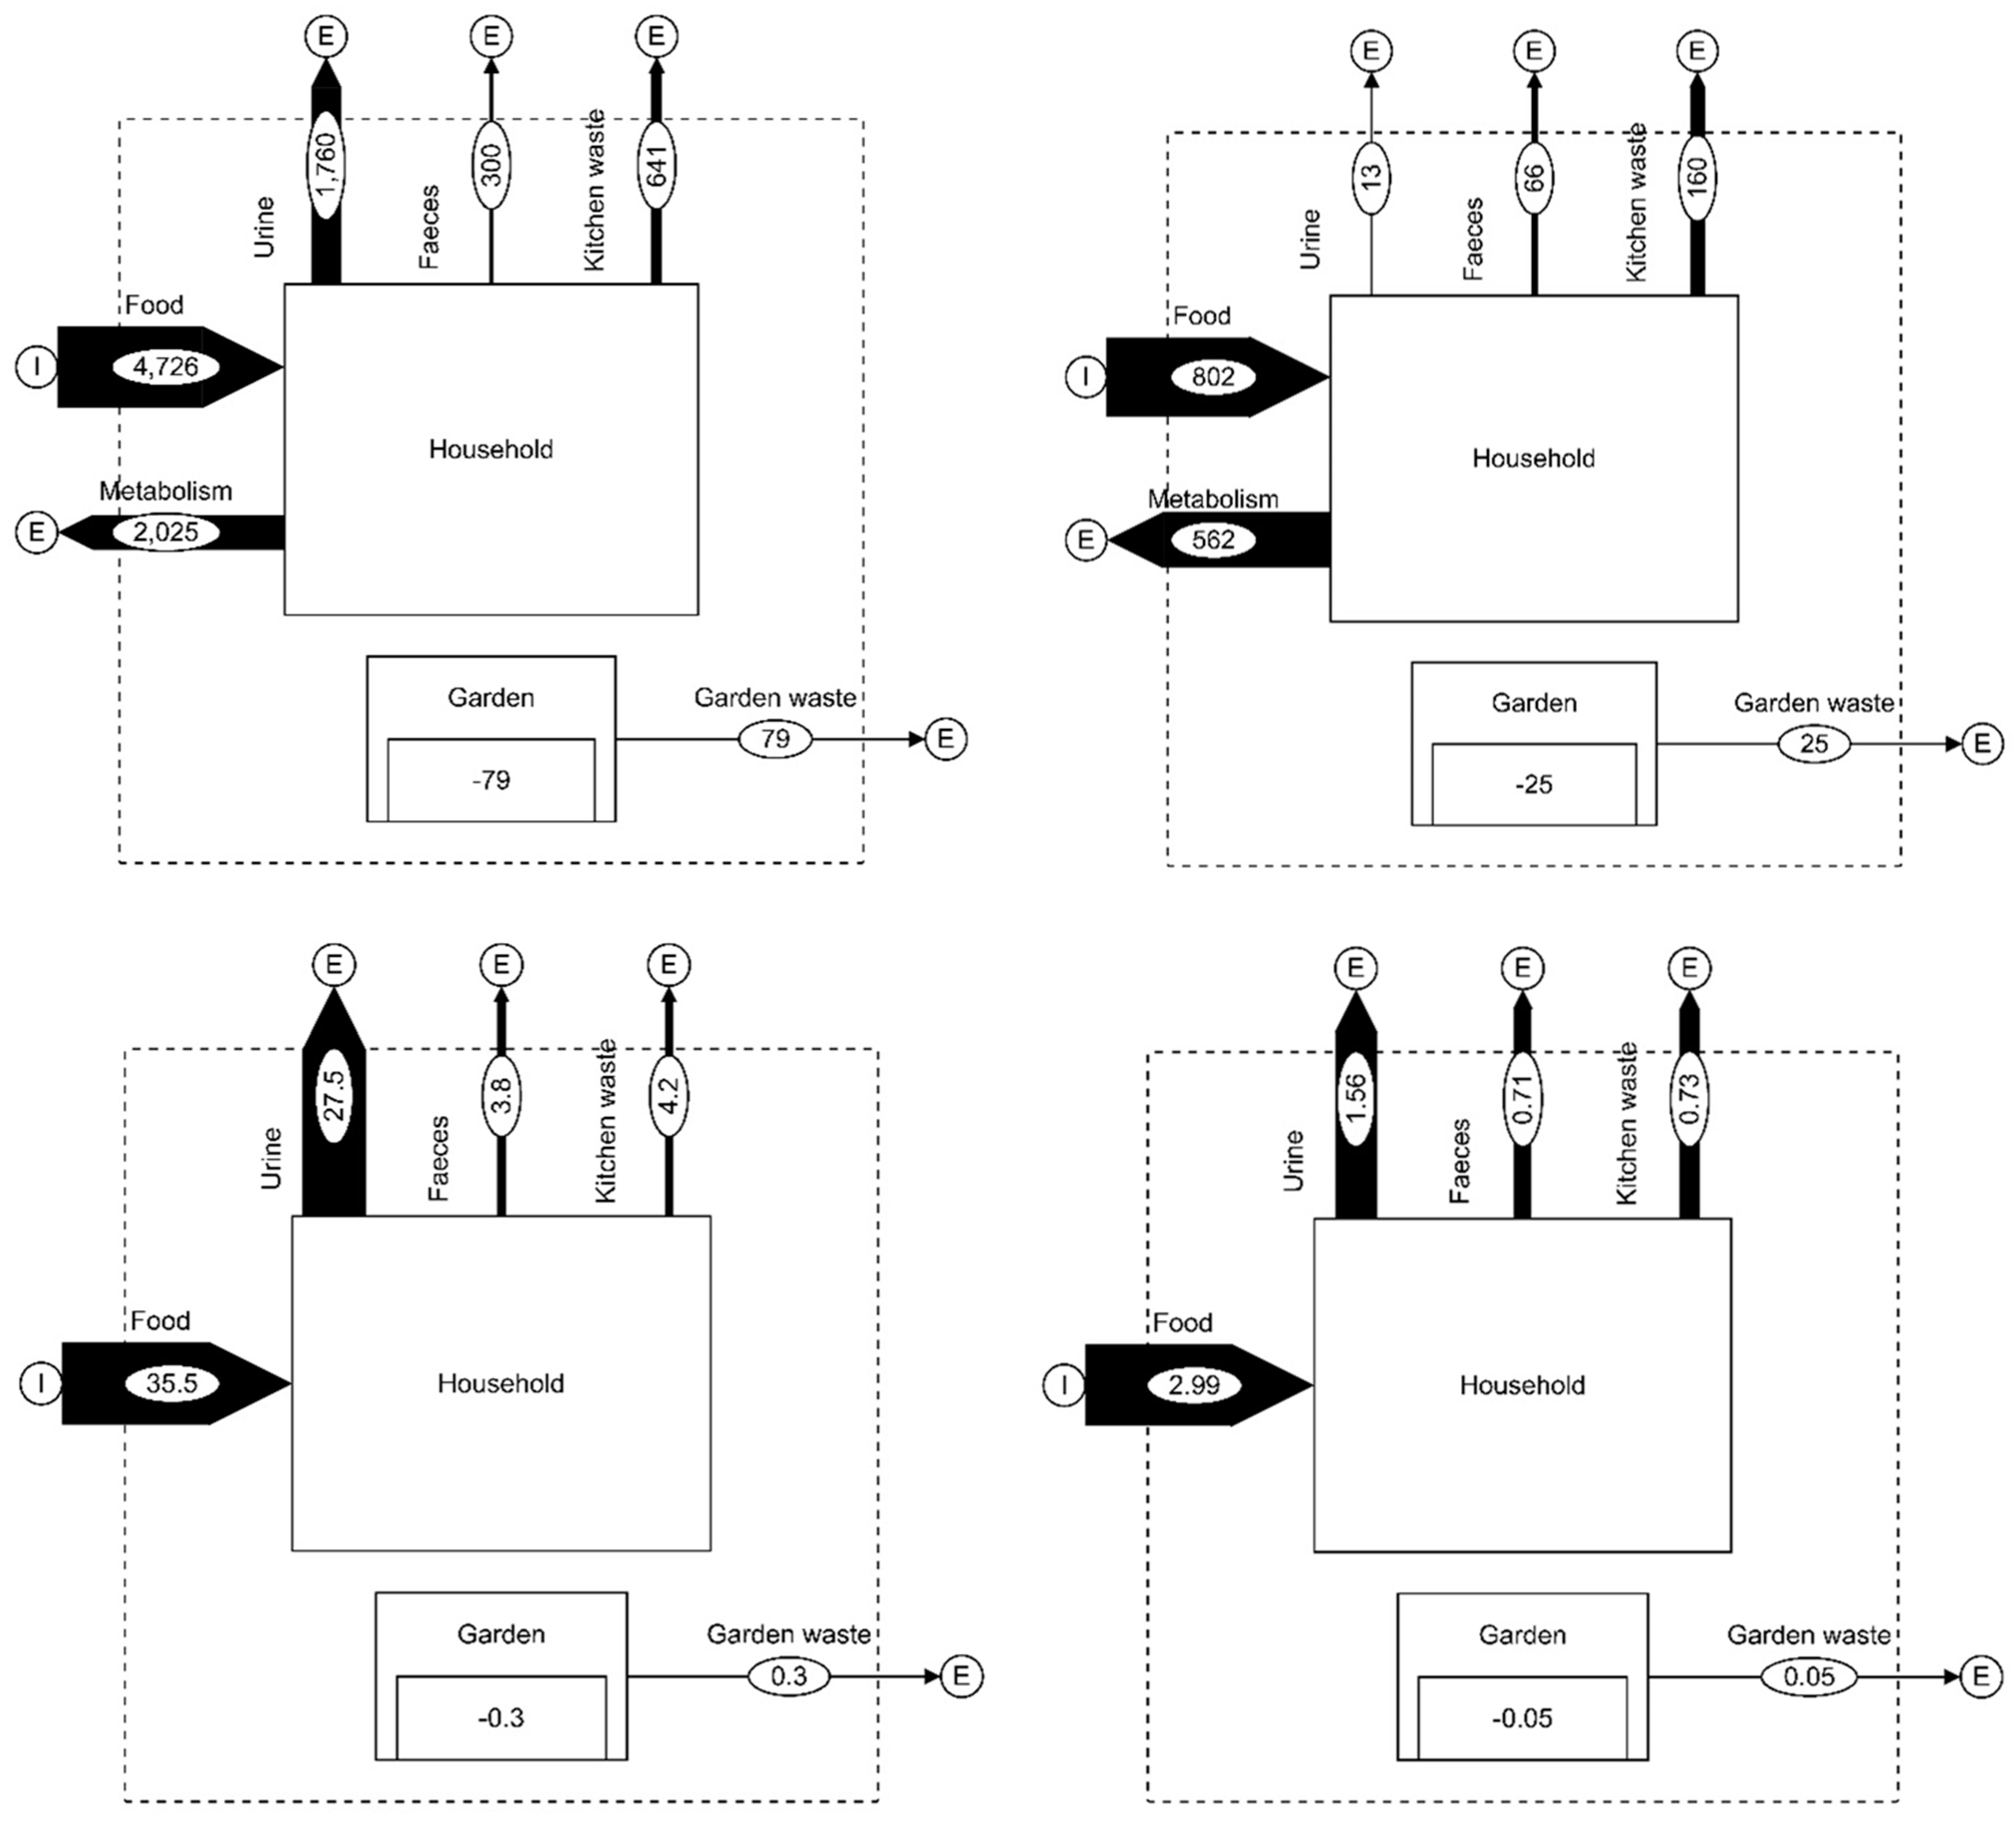
3.1. Baseline MFA
3.2. Alternative Scenarios
3.2.1. Household on-Site Scenarios
3.2.2. Municipality Scenarios
3.3. Scenario Performance
3.3.1. Self-Sufficiency Index (SSI)
3.3.2. Resource Export Index (REI)
3.3.3. Waste Output Index (WOI)
3.4. Economic Analysis
4. Discussion
4.1. Feasibility of Achieving Nutrient Circularity through Decentralized OSW Solutions
4.2. On the Social Benefits of Decentralized Valorization of Residual Flows
5. Conclusions
Author Contributions
Funding
Acknowledgments
Conflicts of Interest
List of Abbreviations
| AD | Anaerobic Digestion |
| Av N | Available N |
| Av P | Available P |
| C | Carbon |
| CF | Cash Flow |
| CLP | Chilean Peso |
| COD | Chemical Oxygen Demand |
| D | Demand |
| DFI | Daily Food Intake |
| DVRF | Decentralized Valorization of Residual Flows |
| Er | Exportable resources |
| EUR | Euro |
| GR | Garden Residues |
| Ip | Internal Production |
| K | Potassium |
| KW | Kitchen Waste |
| MFA | Material Flow Analysis |
| MRS | Metropolitan Region of Santiago |
| Mstruvite | Struvite Mass |
| MSW | Municipal Solid Waste |
| MWMAP | Molecular Weight of Struvite |
| N | Nitrogen |
| NPV | Net Present Value |
| OM | Organic Matter |
| OSW | Organic Solid Waste |
| P | Phosphorus |
| PP | Payback Period |
| Qu | Urine Flow |
| R | Recycled |
| REI | Resource Export Index |
| SEG | Socio-Economic Group |
| SSI | Self-Sufficiency Index |
| Ti | Total Input |
| TUWMS | Traditional Urban Waste Management System |
| UA | Urban Agriculture |
| UHA | Urban Harvest Approach |
| USD | United States Dollar |
| VS | Volatile Solids |
| WE | Waste exported |
| WOI | Waste Output Index |
| WWTP | Waste Water Treatment Plant |
| ΔCPO4-P | Difference in Phosphorus concentration between the influent and the effluent |
Appendix A. Calculations
Vermicomposting
Size of Vermicomposter
- Kitchen waste and garden residue production is 719 kg per household per year
- A worm bin measuring 1 ft3 (= 1⁄35 m3) can process 1 pound (= 0.454 kg) of kitchen waste per week (Angima et al., 2011)
- length vermicomposter is 1.5 m (common balcony depth)
- height vermicomposter is 0.90 m (common counter and balcony rail height)
Volumetric Efficiency
- 50% volume reduction is achieved after the treatment
Nutrient Efficiency
- 49% of N is left after the process, of this 24% is in its mineralized available form
- 97% of P remains in the final product, of this 50% is in its mineralized available form
Composting
Amount of Carbon Rich Material to Add
- Assumptions used regarding waste composition for the equation are:
- Target C/N ratio of compost mixture R is 30
- Kitchen Waste: Moisture = 69%; N% = 3%; C/N = 15
- Garden Residues: Moisture = 15%; N% = 3.5%; C/N = 35
- Amount of KR = 721 kg/hh/y or 125 ton/yr for the whole municipality
- Extra carbon rich material to add daily is 35 tons of GR
Size of Composting Facility
- Assumptions:
- KR production in Peñalolen is 125 ton/d
- Bulk density KR = 350 kg/m3
- Extra GR to add is 35 ton/d
- Bulk density GR = 250 kg/m3
- Retention time for compost maturation: 6 months
- Height of the compost pile is 1.2 m
- Extra area needed for composting facilities: 200%
Volumetric Efficiency
Nutrient Efficiency
Municipal Biodigester
Size of Biodigester
- A sequential batch biodigester of 910 m3 can process 36.5 ton OSW/day and needs a floor area of 1070 m2 including operations [25]
- Domestic OSW production in Peñalolén is 125 ton/day
- OSW density is 350 Kg/m3
- Hidraulic Retention time is 8.7 days
- Digester height: 2 m
- Total area needed including operations is 235% of reactor area
Biogas Production
Nutrient Efficiency
Urine Storage
Storage Volume
Nutrient Efficiency
Struvite
Struvite Production
- Urine production is 4.8 L per household per day, containing 4.28 g phosphorus per household per day
- Molecular weight of P is 31 g/mol
- 75% of urine produced can be captured for struvite production
- 85% of phosphorus in urine can be recovered
- Molecular weight of struvite is 245 g/mol
- The theoretical struvite mass can be calculated with the formula:
Area Requirement
- Urine production is 4.8 L per household per day
- Average household size in Peñalolén is 4 people
- Population of Peñalolén is 253,175 people
- 75% of urine produced can be captured for struvite production
- 0,2 m2/m3 struvite
- 60 d storage time
References
- Dijst, M.; Worrell, E.; Böcker, L.; Brunner, P.; Davoudi, S.; Geertman, S.; Harmsen, R.; Helbich, M.; Holtslag, A.A.M.; Kwan, M.; et al. Exploring urban metabolism—towards an interdisciplinary perspective. Resour. Conserv. Recycl. 2018, 132, 190–203. [Google Scholar]
- Kennedy, C.; Pincetl, S.; Bunje, P. The study of urban metabolism and its applications to urban planning and design. Environ. Pollut. 2011, 159, 1965–1973. [Google Scholar]
- Scholz, R.W.; Ulrich, A.E.; Eilittä, M.; Roy, A. Sustainable use of phosphorus: A finite resource. Sci. Total Environ. 2013, 461, 799–803. [Google Scholar] [CrossRef] [PubMed]
- Vaneeckhaute, C.; Meers, E.; Michels, E.; Buysse, J.; Tack, F.M.G. Ecological and economic benefits of the application of bio-based mineral fertilizers in modern agriculture. Biomass Bioenergy 2013, 49, 239–248. [Google Scholar] [CrossRef] [Green Version]
- Zeeman, G.; Kujawa-Roeleveld, K. Resource recovery from source separated domestic waste (water) streams; full scale results. Water Sci. Technol. 2011, 64, 1987–1992. [Google Scholar] [PubMed]
- de Haan, J.J.; van Geel, W.C.A. Adviesbasis Voor de Bemesting van Akkerbouwgewassen: Samenstelling Commissie. 2013. Available online: https://www.researchgate.net/publication/283398521_Adviesbasis_voor_de_bemesting_van_akkerbouwgewassen (accessed on 1 November 2019).
- Wielemaker, R.C.; Weijma, J.; Zeeman, G. Harvest to harvest: Recovering nutrients with New Sanitation systems for reuse in Urban Agriculture. Resour. Conserv. Recycl. 2018, 128, 426–437. [Google Scholar] [CrossRef] [Green Version]
- MMA. Política Nacional de Economía Circular. Available online: https://mma.gob.cl/economia-circular/ (accessed on 14 August 2019).
- CONAMA RM. Primer Reporte Sobre Manejo de Residuos Sólidos en Chile; CONAMA RM: Santiago, Chile, 2010. [Google Scholar]
- MMA. 2015 ESTRATEGIA REGIONAL DE RESIDUOS SÓLIDOS REGIÓN METROPOLITANA DE SANTIAGO 2017–2021. Available online: https://mma.gob.cl/wp-content/uploads/2018/03/PUBLIC-Estrategia-Reg-Residuos-Solidos-Digital.pdf (accessed on 3 October 2017).
- SUBDERE. 2017, Gobierno Regional Metropolitano de Santiago. Available online: http://www.subdere.cl/división-administrativa-de-chile/gobierno-regional-metropolitano-de-santiago (accessed on 14 December 2017).
- MMA. Gestión y Valorización de Residuos Sólidos en la Región Metropolitana; MMA: Santiago de Chile, Chile, 2012. [Google Scholar]
- Baurier Manuel. Aguas Andinas: de plantas de tratamiento de aguas servidas a biofactorías. Seminario Regional de Bioeconomía en America Latina y el Caribe, 2018. Available online: http://conferencias.cepal.org/bioeconomia_AL/Miercoles%2024/Pdf/Manuel%20Baurier.pdf (accessed on 15 August 2019).
- Hernández, F. Municipalidad de Peñalolén. Environmental Office, Personal Interview: Santiago de Chile, Chile. 2017. [Google Scholar]
- Kujawa-Roeleveld, K.; Zeeman, G. Anaerobic Treatment in Decentralised and Source-Separation-Based Sanitation Concepts. Rev. Environ. Sci. Bio/Technol. 2006, 5, 115–139. [Google Scholar] [CrossRef]
- AIM Chile, 2008. Grupos Socioeconómicos, Asociación Chilena de Empresas de Investigación de Mercados. Santiago de Chile. Available online: http:// https://documentop.com/grupos-socioeconomicos-aim-chile_5a0c3b291723dd06d9562903.html (accessed on 15 September 2017).
- PLADECO. Diagnóstico Comunal Pladeco 2013–2016 Ilustre Municipalidad de Peñalolén; PLADECO: Peñalolén, Chile, 2015. [Google Scholar]
- Hendriks, C.; Obernosterer, R.; Müller, D.; Kytzia, S.; Baccini, P.; Brunner, P.H. Material flow analysis: a tool to support environmental policy decision making. Case-studies on the city of Vienna and the Swiss lowlands. Local Environ. 2000, 5, 311–328. [Google Scholar]
- Agudelo-Vera, C.M.; Mels, A.; Keesman, K.; Rijnaarts, H. The Urban Harvest Approach as an Aid for Sustainable Urban Resource Planning. J. Ind. Ecol. 2012, 16, 839–850. [Google Scholar] [CrossRef]
- Atkinson, G.; Braathen, N.A.; Mourato, S.; Groom, B. Cost Benefits Analysis and the Environment: Further Developments and Policy Use; Organisation for Economic Co-operation and Development: Paris, France, 2018. [Google Scholar]
- WRAP. Anaerobic Digestate—Partial Financial Impact Assessment of the Introduction of a Quality Protocol for the Production and Use of Anaerobic Digestate; WRAP: Banbury, UK, 2009. [Google Scholar]
- van Haaren, R. Large Scale Aerobic Composting of Source Separated Organic Wastes: A Comparative Study of Environmental Impacts, Costs, and Contextual Effects; Columbia University: New York, NY, USA, 2009. [Google Scholar]
- Hebda, C.; Gaustad, G.; Williamson, A.; Trabold, T. Determining economically optimal household organic material management pathways. Resour. Conserv. Recycl. 2016, 108, 88–96. [Google Scholar] [CrossRef]
- Ishii, S.K.; Boyer, T.H. Life cycle comparison of centralized wastewater treatment and urine source separation with struvite precipitation: Focus on urine nutrient management. Water Res. 2015, 79, 88–103. [Google Scholar] [CrossRef] [PubMed]
- Pabón-Pereira, C.P.; López, L. Informe de prefactibilidad para la valorización de residuos orgánicos en la Comuna de Independencia en la Región Metropolitana de Santiago de Chile. 2016. Available online: http://www.minenergia.cl/autoconsumo/wp-content/uploads/2018/06/Informe-Final-Estudio-WTE-RM-2018.pdf (accessed on 1 November 2019).
- Muñoz, O.; Bastias, J.M.; Araya, M.; Morales, A.; Orellana, C.; Rebolledo, R.; Velez, D. Estimation of the dietary intake of cadmium, lead, mercury, and arsenic by the population of Santiago (Chile) using a Total Diet Study. Food Chem. Toxicol. 2005, 43, 1647–1655. [Google Scholar] [CrossRef] [PubMed]
- Voedingscentrum. Groente en Fruit. Available online: https://www.voedingscentrum.nl/nl/gezond-eten-met-de-schijf-van-vijf/hoeveel-en-wat-kan-ik-per-dag-eten-/groente-en-fruit.aspx (accessed on 17 November 2016).
- INE. Número DE Jefes DE Hogar Y DE Otros Miembros Del Hogar Por Relación DE Parentesco Con El Jefe DE Hogar Según Division Politico Administrativa Area Urbana-Rural Sexo Y Grupos DE Edad Del Jefe DE Hogar. Santiago de Chile. Available online: http://www.ine.cl/cd2002/index.php (accessed on 3 October 2017).
- USDA. National Nutrient Database for Standard Reference Release 28, 2016. Available online: https://ndb.nal.usda.gov/ndb/search/list?fgcd=&manu=&lfacet=&count=&max=&sort=&qlookup=&offset=&format=Abridged&new=&measureby=&ds=Standard+Reference&order= (accessed on 30 November 2016).
- FAO. Food Energy—Methods of Analysis and Conversion Factors; FAO: Rome, Italy, 2003. [Google Scholar]
- Milton, K.; Dintzis, F.R. Nitrogen-to-Protein Conversion Factors for Tropical Plant Samples. Biotropica 1981, 13, 177. [Google Scholar] [CrossRef]
- Bouallagui, H.; Touhami, Y.; Ben Cheikh, R.; Hamdi, M. Bioreactor performance in anaerobic digestion of fruit and vegetable wastes. Process. Biochem. 2005, 40, 989–995. [Google Scholar] [CrossRef]
- Cavinato, C.; Fatone, F.; Bolzonella, D.; Pavan, P. Thermophilic anaerobic co-digestion of cattle manure with agro-wastes and energy crops: Comparison of pilot and full scale experiences. Bioresour. Technol. 2010, 101, 545–550. [Google Scholar] [CrossRef]
- Cho, J.K.; Park, S.C.; Chang, H.N. Biochemical methane potential and solid state anaerobic digestion of Korean food wastes. Bioresour. Technol. 1995, 52, 245–253. [Google Scholar] [CrossRef]
- Jiang, Y.; Heaven, S.; Banks, C. Strategies for stable anaerobic digestion of vegetable waste. Renew. Energy 2012, 44, 206–214. [Google Scholar] [CrossRef] [Green Version]
- Kabouris, J.C.; Tezel, U.; Pavlostathis, S.G.; Engelmann, M.; Todd, A.C.; Gillette, R.A. The anaerobic biodegradability of municipal sludge and fat, oil, and grease at mesophilic conditions. Water Environ. Res. 2008, 80, 212–221. [Google Scholar] [CrossRef]
- Kaparaju, P.; Rintala, J. Anaerobic co-digestion of potato tuber and its industrial by-products with pig manure. Resour. Conserv. Recycl. 2005, 43, 175–188. [Google Scholar] [CrossRef]
- Mshandete, A.; Kivaisi, A.; Rubindamayugi, M.; Mattiasson, B. Anaerobic batch co-digestion of sisal pulp and fish wastes. Bioresour. Technol. 2004, 95, 19–24. [Google Scholar] [CrossRef]
- Saddoud, A.; Hassaïri, I.; Sayadi, S. Anaerobic membrane reactor with phase separation for the treatment of cheese whey. Bioresour. Technol. 2007, 98, 2102–2108. [Google Scholar] [CrossRef] [PubMed]
- Steffen, R.; Szolar, O.; Braun, R. Feedstocks for Anaerobic Digestion. Available online: https://pdfs.semanticscholar.org/293e/a2a9a8d8315548b8d749f60e4b28378d9dfa.pdf (accessed on 1 November 2019).
- Veeken, A.; Hamelers, B. Effect of temperature on hydrolysis rates of selected biowaste components. Bioresour. Technol. 1999, 69, 249–254. [Google Scholar] [CrossRef]
- Universidad Adolfo Ibáñez. EcoParque Peñalolén-UAI. Santiago de Chile. 2018. Available online: https://ingenieria.uai.cl/ecoparque (accessed on 16 November 2018).
- Magid, J.; Eilersen, A.; Wrisberg, S.; Henze, M. Possibilities and barriers for recirculation of nutrients and organic matter from urban to rural areas: A technical theoretical framework applied to the medium-sized town Hillerød, Denmark. Ecol. Eng. 2006, 28, 44–54. [Google Scholar] [CrossRef]
- Baky, A.; Eriksson, O. Systems Analysis of Organic Waste Management in Denmark; Danish Environmental Protection Agency: Copenhagen, Denmark, 2003. [Google Scholar]
- Banks, C.J.; Chesshire, M.; Heaven, S.; Arnold, R. Anaerobic digestion of source-segregated domestic food waste: Performance assessment by mass and energy balance. Bioresour. Technol. 2011, 102, 612–620. [Google Scholar] [CrossRef] [Green Version]
- CONAMA RM. Estudio de Caracterización de Residuos Domiciliarios en La Región Metropolitana; CONAMA RM: Valparaiso, Chile, 2006. [Google Scholar]
- El-Mashad, H.M.; Zhang, R. Biogas production from co-digestion of dairy manure and food waste. Bioresour. Technol. 2010, 101, 4021–4028. [Google Scholar] [CrossRef]
- Sundberg, C.; Franke-Whittle, I.H.; Kauppi, S.; Yu, D.; Romantschuk, M.; Insam, H.; Jönsson, H. Characterisation of source-separated household waste intended for composting. Bioresour. Technol. 2011, 102, 2859–2867. [Google Scholar] [CrossRef] [Green Version]
- Zhang, R.; Elmashad, H.; Hartman, K.; Wang, F.; Liu, G.; Choate, C.; Gamble, P. Characterization of food waste as feedstock for anaerobic digestion. Bioresour. Technol. 2007, 98, 929–935. [Google Scholar] [CrossRef]
- Boldrin, A.; Christensen, T.H. Seasonal generation and composition of garden waste in Aarhus (Denmark). Waste Manag. 2010, 30, 551–557. [Google Scholar] [CrossRef] [Green Version]
- Conama, R.M. Sistemas de Reciclaje, Estudio de Casos en la Región Metropolitana; CONAMA RM: Santiago, Chile, 2005. [Google Scholar]
- Fink, M.; Feller, C.; Scharpf, H.-C.; Weier, U.; Maync, A.; Ziegler, J.; Paschold, P.-J.; Strohmeyer, K. Nitrogen, phosphorus, potassium and magnesium contents of field vegetables—Recent data for fertiliser recommendations and nutrient balances. J. Plant Nutr. Soil Sci. 1999, 162, 71–73. [Google Scholar] [CrossRef]
- Rose, C.; Parker, A.; Jefferson, B.; Cartmell, E. The Characterization of Feces and Urine: A Review of the Literature to Inform Advanced Treatment Technology. Crit. Rev. Environ. Sci. Technol. 2015, 45, 1827–1879. [Google Scholar] [CrossRef] [Green Version]
- Observatorio de Ciudades. Formulación Sello de Eficiencia Hídrica en el Paisaje; DGA: Santiago, Chile, 2009. [Google Scholar]
- Beegle, D.B.; Durst, P.T. Managing Phosphorus for Crop Production. Penn State University, 2002. Available online: https://extension.psu.edu/programs/nutrient-management/educational/soil-fertility/managing-phosphorus-for-crop-production/extension_publication_file (accessed on 15 March 2017).
- Cornell Waste Management Institute. Compost Chemistry. 1996. Available online: http://compost.css.cornell.edu/chemistry.html (accessed on 15 March 2017).
- Andersen, J.K.; Boldrin, A.; Christensen, T.H.; Scheutz, C. Mass balances and life-cycle inventory for a garden waste windrow composting plant (Aarhus, Denmark). Waste Manag. Res. 2010, 28, 1010–1020. [Google Scholar] [CrossRef] [PubMed]
- Benito, M.; Masaguer, A.; Moliner, A.; Arrigo, N.; Palma, R.M. Chemical and microbiological parameters for the characterisation of the stability and maturity of pruning waste compost. Biol. Fertil. Soils 2003, 37, 184–189. [Google Scholar]
- Eklind, Y.; Kirchmann, H. Composting and storage of organic household waste with different litter amendments. II: Nitrogen turnover and losses. Bioresour. Technol. 2000, 74, 125–133. [Google Scholar] [CrossRef]
- Fornes, F.; Mendoza-Hernández, D.; García-De-La-Fuente, R.; Abad, M.; Belda, R.M. Composting versus vermicomposting: A comparative study of organic matter evolution through straight and combined processes. Bioresour. Technol. 2012, 118, 296–305. [Google Scholar] [CrossRef] [PubMed]
- Michel, F.C.; Reddy, C.A.; Forney, L.J. Yard Waste Composting: Studies Using Different Mixes of Leaves and Grass in a Laboratory Scale System. Compos. Sci. Util. 1993, 1, 85–96. [Google Scholar] [CrossRef]
- Sierra, J.; Desfontaines, L.; Faverial, J.; Loranger-Merciris, G.; Boval, M. Composting and vermicomposting of cattle manure and green wastes under tropical conditions: Carbon and nutrient balances and end-product quality. Soil Res. 2013, 51, 142–151. [Google Scholar] [CrossRef]
- Frederickson, J.; Butt, K.R.; Morris, R.M.; Daniel, C. Combining vermiculture with traditional green waste composting systems. Soil Boil. Biochem. 1997, 29, 725–730. [Google Scholar] [CrossRef]
- Rijksoverheid. Mestbeleid 2014–2017 Tabellen; Rijksoverheid: The Hague, The Netherlands, 2014. [Google Scholar]
- RÖBEN, Eva. Manual de compostaje para municipios. Available online: http://www.resol.com.br/Cartilha7/ManualCompostajeparaMunicipios.pdf (accessed on 1 November 2019).
- Othman, N. Vermicomposting of food waste. Int. J. Integr. Eng. 2012, 4, 39–48. [Google Scholar]
- Kothari, R.; Pandey, A.; Kumar, S.; Tyagi, V.; Tyagi, S. Different aspects of dry anaerobic digestion for bio-energy: An overview. Renew. Sustain. Energy Rev. 2014, 39, 174–195. [Google Scholar] [CrossRef]
- Pabón-Pereira, C.; De Vries, J.; Slingerland, M.; Zeeman, G.; Van Lier, J. Impact of crop–manure ratios on energy production and fertilizing characteristics of liquid and solid digestate during codigestion. Environ. Technol. 2014, 35, 2427–2434. [Google Scholar] [CrossRef]
- Jönsson, H. Urine separating sewage systems–environmental effects and resource usage. Water Sci. Technol. 2002, 46, 333–340. [Google Scholar] [CrossRef] [PubMed]
- Lind, B.-B.; Bán, Z.; Bydén, S. Nutrient recovery from human urine by struvite crystallization with ammonia adsorption on zeolite and wollastonite. Bioresour. Technol. 2000, 73, 169–174. [Google Scholar] [CrossRef]
- Ganrot, Z.; Dave, G.; Nilsson, E. Recovery of N and P from human urine by freezing, struvite precipitation and adsorption to zeolite and active carbon. Bioresour. Technol. 2007, 98, 3112–3121. [Google Scholar] [CrossRef] [PubMed]
- Tilley, E.; Atwater, J.; Mavinic, D. Recovery of struvite from stored human urine. Environ. Technol. 2008, 29, 797–806. [Google Scholar]
- Morales, N.; Boehler, M.; Buettner, S.; Liebi, C.; Siegrist, H. Recovery of N and P from urine by struvite precipitation followed by combined stripping with digester sludge liquid at full scale. Water 2013, 5, 1262–1278. [Google Scholar]
- Münch, E.V.; Barr, K. Controlled struvite crystallisation for removing phosphorus from anaerobic digester sidestreams. Water Res. 2001, 35, 151–159. [Google Scholar] [CrossRef]
- Zamora, P.; Georgieva, T.; Salcedo, I.; Elzinga, N.; Kuntke, P.; Buisman, C.J. Long-term operation of a pilot-scale reactor for phosphorus recovery as struvite from source-separated urine. J. Chem. Technol. Biotechnol. 2016, 92, 1035–1045. [Google Scholar] [CrossRef]
- Ronteltap, M.; Maurer, M.; Gujer, W. The behaviour of pharmaceuticals and heavy metals during struvite precipitation in urine. Water Res. 2011, 41, 1859–1868. [Google Scholar]
- Decrey, L.; Udert, K.M.; Tilley, E.; Pecson, B.M.; Kohn, T. Fate of the pathogen indicators phage ΦX174 and Ascaris suum eggs during the production of struvite fertilizer from source-separated urine. Water Res. 2011, 45, 4960–4972. [Google Scholar]
- Angima, S.; Noack, M.; Noack, S. Composting with Worms; Oregon State University Extension Service Seal Rock: Newport, RI, USA, 2011. [Google Scholar]
- HomeBiogas. The HomeBiogas System. Available online: https://homebiogas.com/shop/buy-the-homebiogas-system/ (accessed on 3 September 2017).
- Traesure. 2019, Biodigestor doméstico Compact-2. Available online: www.traesure.com/compact-2 (accessed on 11 October 2019).
- International Energy Agency. Chile: Natural gas for 2014. Available online: https://www.iea.org/statistics/statisticssearch/report/?year=2014&country=Chile&product=NaturalGas (accessed on 1 September 2017).
- CNE. Precio Del Gas Natural; CNE: Santiago, Chile, 2017; Available online: https://www.cne.cl/estadisticas/hidrocarburo/ (accessed on 7 February 2017).
- Lombrices Californianas. Nuestros productos de lombricultura; lombrices—Vermicomposteras. Available online: http://lombricescalifornianas.cl/tienda/productos.html (accessed on 3 October 2017).
- Sodimac. 2017b, Humus 3 Kilos. Available online: http://www.sodimac.cl/sodimac-cl/product/512230/Humus-3-kilos/512230 (accessed on 3 October 2017).
- Sodimac. 2017c, Tierra Biológica 80 Litros. Available online: http://www.sodimac.cl/sodimac-cl/product/462004/Tierra-biologica-80-litros/462004 (accessed on 3 October 2017).
- Sodimac. 2017d, Bidón Plástico 25lts. Rojo. Available online: http://www.sodimac.cl/sodimac-cl/product/1611739/Bidon-plastico-25-litros-rojo/1611739 (accessed on 3 October 2017).
- Sodimac. 2017a, Bidón 60 lts. Transparente. Available online: http://www.sodimac.cl/sodimac-cl/product/161861X/Bidon-60-lts.-transparente/161861X (accessed on 3 October 2017).
- Separett. 2011, Urine-diverting Product Line. Available online: http://www.urinediverting.com/index.php/urine-diverting-product-line (accessed on 3 October 2017).


| Unit | Food | Urine | Faeces | KW | GR | |
|---|---|---|---|---|---|---|
| mass | kg/hh/d | 12.8 | 4.8 | 0.84 | 1.76 | 0.2 |
| TN | g/hh/d | 97.2 | 75.2 | 10.4 | 11.6 | 0.8 |
| TP | g/hh/d | 8.2 | 4.28 | 1.92 | 2 | 0.16 |
| OM | g/hh/d | 2196 | 35.2 | 180 | 440 | 68 |
| Unit | Mass | TP | av. P | TN | av. N | OM | |
|---|---|---|---|---|---|---|---|
| Digestate | kg/hh/y | 600 | 0.75 | 0.34 | 4.3 | 0.8 | 45 |
| Vermicompost | kg/hh/y | 345 | 0.73 | 0.37 | 2.1 | 0.5 | 58 |
| Urine storage | kg/hh/y | 1320 | 1.17 | 1.17 | 20.6 | 20.6 | 0 |
| Unit | Mass | TP | av. P | TN | av. N | OM | |
|---|---|---|---|---|---|---|---|
| Digestate | kg/hh/y | 600 | 0.75 | 0.34 | 4.3 | 0.8 | 58 |
| Compost | kg/hh/y | 345 | 0.73 | 0.37 | 2.4 | 0.2 | 120 |
| Struvite | kg/hh/y | 8 | 0.99 | 0.99 | 0.4 | 0.4 | 0 |
| Self-Sufficiency Index (SSI) | Resource Export index (REI) | Waste Output Index (WOI) | |||||||||||
|---|---|---|---|---|---|---|---|---|---|---|---|---|---|
| TN | av. N | TP | av. P | OM | TN | av. N | TP | av. P | OM | TN | TP | OM | |
| Scenario 1. Household anaerobic digestion | –12 | –1.4 | –14 | –5.5 | –8.4 | 7 | 0.4 | 7 | 2 | 4.0 | –0.88 | –0.76 | –0.77 |
| Scenario 2. Household vermicomposting | –5.5 | –0.54 | –13 | –6.1 | –11 | 3 | –0.1 | 6 | 3 | 5.3 | –0.94 | –0.76 | –0.74 |
| Scenario 3. Household urine storage and reuse | –63 | –63 | –22 | –22 | 1 | 63 | 62.5 | 12 | 22 | –1.0 | –0.42 | –0.62 | –0.99 |
| Scenario 4. Municipal anaerobic digestion | 6.6 | 0.40 | 6.6 | 2.4 | 4 | –0.88 | –0.76 | –0.77 | |||||
| Scenario 5. Municipal composting | 3.2 | –0.58 | 6.4 | 2.7 | 12.8 | –0.93 | –0.76 | –0.54 | |||||
| Scenario 6. Municipal struvite | –0.30 | –0.30 | 9.0 | 9.0 | –0.99 | –0.68 | –1.00 | ||||||
| Unit | Landfill 1 | Household Anaerobic Digestion 2 | Household Vermin-Composting 3 | Municipal Composting 4 | Municipal Anaerobic Digestion 5 | ||
|---|---|---|---|---|---|---|---|
| Costs | Operation | $/hh/y | 0 | 0 | 0 | 14 | 312 |
| Transport | $/hh/y | 256 | 0 | 0 | 256 | 256 | |
| fees | $/hh/y | 103 | 0 | 0 | 0 | 0 | |
| Total costs | $/hh/y | 359 | 0 | 0 | 270 | 568 | |
| Benefits | Compost | $/hh/y | 0 | 0 | 0 | 36 | 0 |
| Vermicompost | $/hh/y | 0 | 0 | 586 | 0 | 0 | |
| Digestate | $/hh/y | 0 | 6 | 0 | 0 | 7 | |
| Biogas | $/hh/y | 0 | 128 | 0 | 0 | 128 | |
| Total benefits | $/hh/y | 0 | 135 | 586 | 36 | 135 | |
| Profit | $/hh/y | –359 | 135 | 586 | –234 | –432 | |
| Capital Investment | $/hh | – | 1.506 | 186 | 120 | 1.237 | |
| Unit | Household Urine Storage 1 | Municipality Struvite 2 | ||
|---|---|---|---|---|
| Costs | Operation | $/hh/y | - | 0 |
| Transport | $/hh/y | - | 39 | |
| Fees | $/hh/y | - | - | |
| Total costs | $/hh/y | - | 39 | |
| Benefits | Stored urine | $/hh/y | 33 | - |
| Struvite | $/hh/y | - | 3 | |
| Total benefits | $/hh/y | 33 | 3 | |
| Profit | $/hh/y | 33 | –36 | |
| Capital Investment | $/hh | 50 | 1.177 | |
| $ | Household AD | Household Vermin-Composting | Municipal Composting | Municipal AD |
|---|---|---|---|---|
| CostTUWMS | 359 | 359 | 359 | 359 |
| CostDVRF | 0 | 0 | 270 | 568 |
| BenfDVRF | 135 | 586 | 36 | 135 |
| Investment | 1506 | 186 | 120 | 1237 |
| N | 12,659 | 12,659 | 31,647 | 31,647 |
| NPV (per household) | 1809 | 6155 | 719 | –1734 |
| NPV (social) | $22,896,987 | $77,915,255 | $22,746,603 | –$54,861,531 |
| PP (years) | 4 | 1 | 2 | - |
© 2019 by the authors. Licensee MDPI, Basel, Switzerland. This article is an open access article distributed under the terms and conditions of the Creative Commons Attribution (CC BY) license (http://creativecommons.org/licenses/by/4.0/).
Share and Cite
de Kraker, J.; Kujawa-Roeleveld, K.; J. Villena, M.; Pabón-Pereira, C. Decentralized Valorization of Residual Flows as an Alternative to the Traditional Urban Waste Management System: The Case of Peñalolén in Santiago de Chile. Sustainability 2019, 11, 6206. https://doi.org/10.3390/su11226206
de Kraker J, Kujawa-Roeleveld K, J. Villena M, Pabón-Pereira C. Decentralized Valorization of Residual Flows as an Alternative to the Traditional Urban Waste Management System: The Case of Peñalolén in Santiago de Chile. Sustainability. 2019; 11(22):6206. https://doi.org/10.3390/su11226206
Chicago/Turabian Stylede Kraker, Jeltsje, Katarzyna Kujawa-Roeleveld, Marcelo J. Villena, and Claudia Pabón-Pereira. 2019. "Decentralized Valorization of Residual Flows as an Alternative to the Traditional Urban Waste Management System: The Case of Peñalolén in Santiago de Chile" Sustainability 11, no. 22: 6206. https://doi.org/10.3390/su11226206