Measuring the Reduction of the Confinement along the Evolution of a Burn Cut


1
DIATI, Politecnico di Torino, 10133 Torino, Italy
2
Faculty of Engineering and Sciences, Universidad Adolfo Ibáñez, 7910000 Región Metropolitana, Chile
*
Author to whom correspondence should be addressed.
Appl. Sci. 2019, 9(23), 5013; https://doi.org/10.3390/app9235013
Submission received: 11 October 2019
/
Revised: 14 November 2019
/
Accepted: 16 November 2019
/
Published: 21 November 2019
(This article belongs to the Special Issue Modelling, Simulation and Data Analysis in Acoustical Problems Ⅱ)
Abstract
:We provide an analysis of a tunnel opening cut in a tunnel face. In particular, we focus on the effect of a “burn cut,” which is a typical parallel hole cut. As the evolution of the opening consists of an increase in the volume of the cut prism and the consequent reduction of confinement of the holes along the initiation sequence, we analyze such an evolution using photographic documentation, as well as evaluating the reduction of confinement by measuring the energy transferred from the explosive charge to the rock mass. The energy was estimated by monitoring and analyzing the vibrations induced by the blasting at three different points. We adopted low-cost shock sensors for monitoring the effect of the detonation times at short distance from the blast (about 10 m). The results show an evident reduction of the shock transfer to the rock mass (i.e., a reduction of confinement) with the increase of the cavity opening. Nevertheless, when only the response of the piezometric sensors was considered, a disparity in behavior among the sensors was noted. On the other hand, when the sensor response was integrated over time, the behavior of all sensors normalized, showing the need to focus both on the oscillation and the duration to properly address the shock effect.
1. Introduction
The main objective of this research was to document and analyze the evolution of a tunnel opening cut. The concept of the opening cut in a tunnel face is as old as the blasting science itself. One of its first definitions by Langefors and Kihilström [1] reads: “The first holes in the sequence aim at creating an opening towards which the rest of the rock is successively blasted. This opening, the cut, is the key that opens the rock.” Cuts come in a wide range of schemes and conceptual breaking mechanisms. Nevertheless, it is common to adopt a general division into two main groups [2,3,4]:
- i.
- Parallel hole cut: cuts with holes parallel to the axis of the tunnel and uncharged relief (“dummy”) holes.
- ii.
- Inclined hole cut: cuts with the hole inclined in some fashion with respect to the axis of the tunnel.
The present work analyzed the effect of a “burn cut” [1,5], which falls into the parallel holes cut category. Langefors and Kihilström defined the burn cut as a parallel hole cut that “operate[s] with empty holes of the same diameter as the charged ones.” The burn cut specifically employed in the present study is defined by Langefors and Kihilström [1] as a “Grönlund cut”: a central charged hole surrounded by a square of dummy, empty holes that create the hollow prism for the expansion of the rock broken by the subsequent squares of the cut.
The evolution of the opening consists of the increase in volume of the cut prism and the consequent reduction of confinement of the holes along the initiation sequence. To analyze such an evolution, this research focused on two aspects:
- Provide photographic documentation, in high definition, of the evolution of an opening cut.
- Evaluate the reduction of confinement by measuring the energy transferred from the explosive charge to the rock mass.
Regarding the first aspect, this is a rare opportunity. To document the hole-by-hole evolution of a blast via photographs, especially underground, one has to shoot one hole at a time as part of a heavily time-consuming operation. Such an activity can only be performed in a dedicated research facility, since no production operation would allow such a time-demanding task. In fact, the few pictures available in the literature of an evolving cut are present in out-of-date textbooks, such as Langefors and Kihilström, and are in black and white.
Regarding the energy transferred to the rock mass: normally it is evaluated by considering the blast-generated vibration velocity. Many scientific works deal with this subject; in the last year alone, the subject has been covered by several authors [6,7,8,9,10,11,12,13,14]. Also, national and international regulations deal with the peak particle velocity of blast-generated ground vibrations (such as BS6472-2:2008 in Great Britain [15], NZS/ISO 2631-2:1989 in New Zealand [16], DIN 4150-3:1999 in Germany [17], and USBM RI 8507 in the United States [18]).
The present work intended to investigate the same energy phenomenon, but under a different point of view, focusing on the shock energy. Other authors have dealt with different ways of looking at blast-generated shockwaves [19,20].
We focus on the employment of a low-cost monitoring system. Particularly, we collected the vibrations by adopting low-cost shock sensors. The adoption of shock sensors was justified by the requirements to place the sensor very close to the blast face to minimize the impact of the effect of seismic propagation in heterogeneous materials. The vibrations induced by the blasting have been processed in both the time and frequency domains in order to estimate the most useful parameters and to establish relationships with the blasting performance. Information about the peak amplitude, duration of phenomena, and energy of the signal have been extracted.
2. Materials and Methods
2.1. Blast Configuration
The blast test was performed as follows:
- The opening cut was designed with a burn-cut configuration: a central charged hole, surrounded by four relief holes that were not charged. The rest of the cut evolved with two concentric squares. Ten holes in the opening cut were shot in total.
- Each hole was drilled with a pull p = 80 cm.
- Each hole was charged with the same charge: four emulsion cartridges 1” × 8” (119 g each, for a total hole charge q = 476 g), primed with a fire cap and ignited using a fuse.
- Each hole was charged and shot independently.
- After each detonation, ventilation was allowed, then pictures of the whole face and zoomed-in pictures of the cavity created were taken.
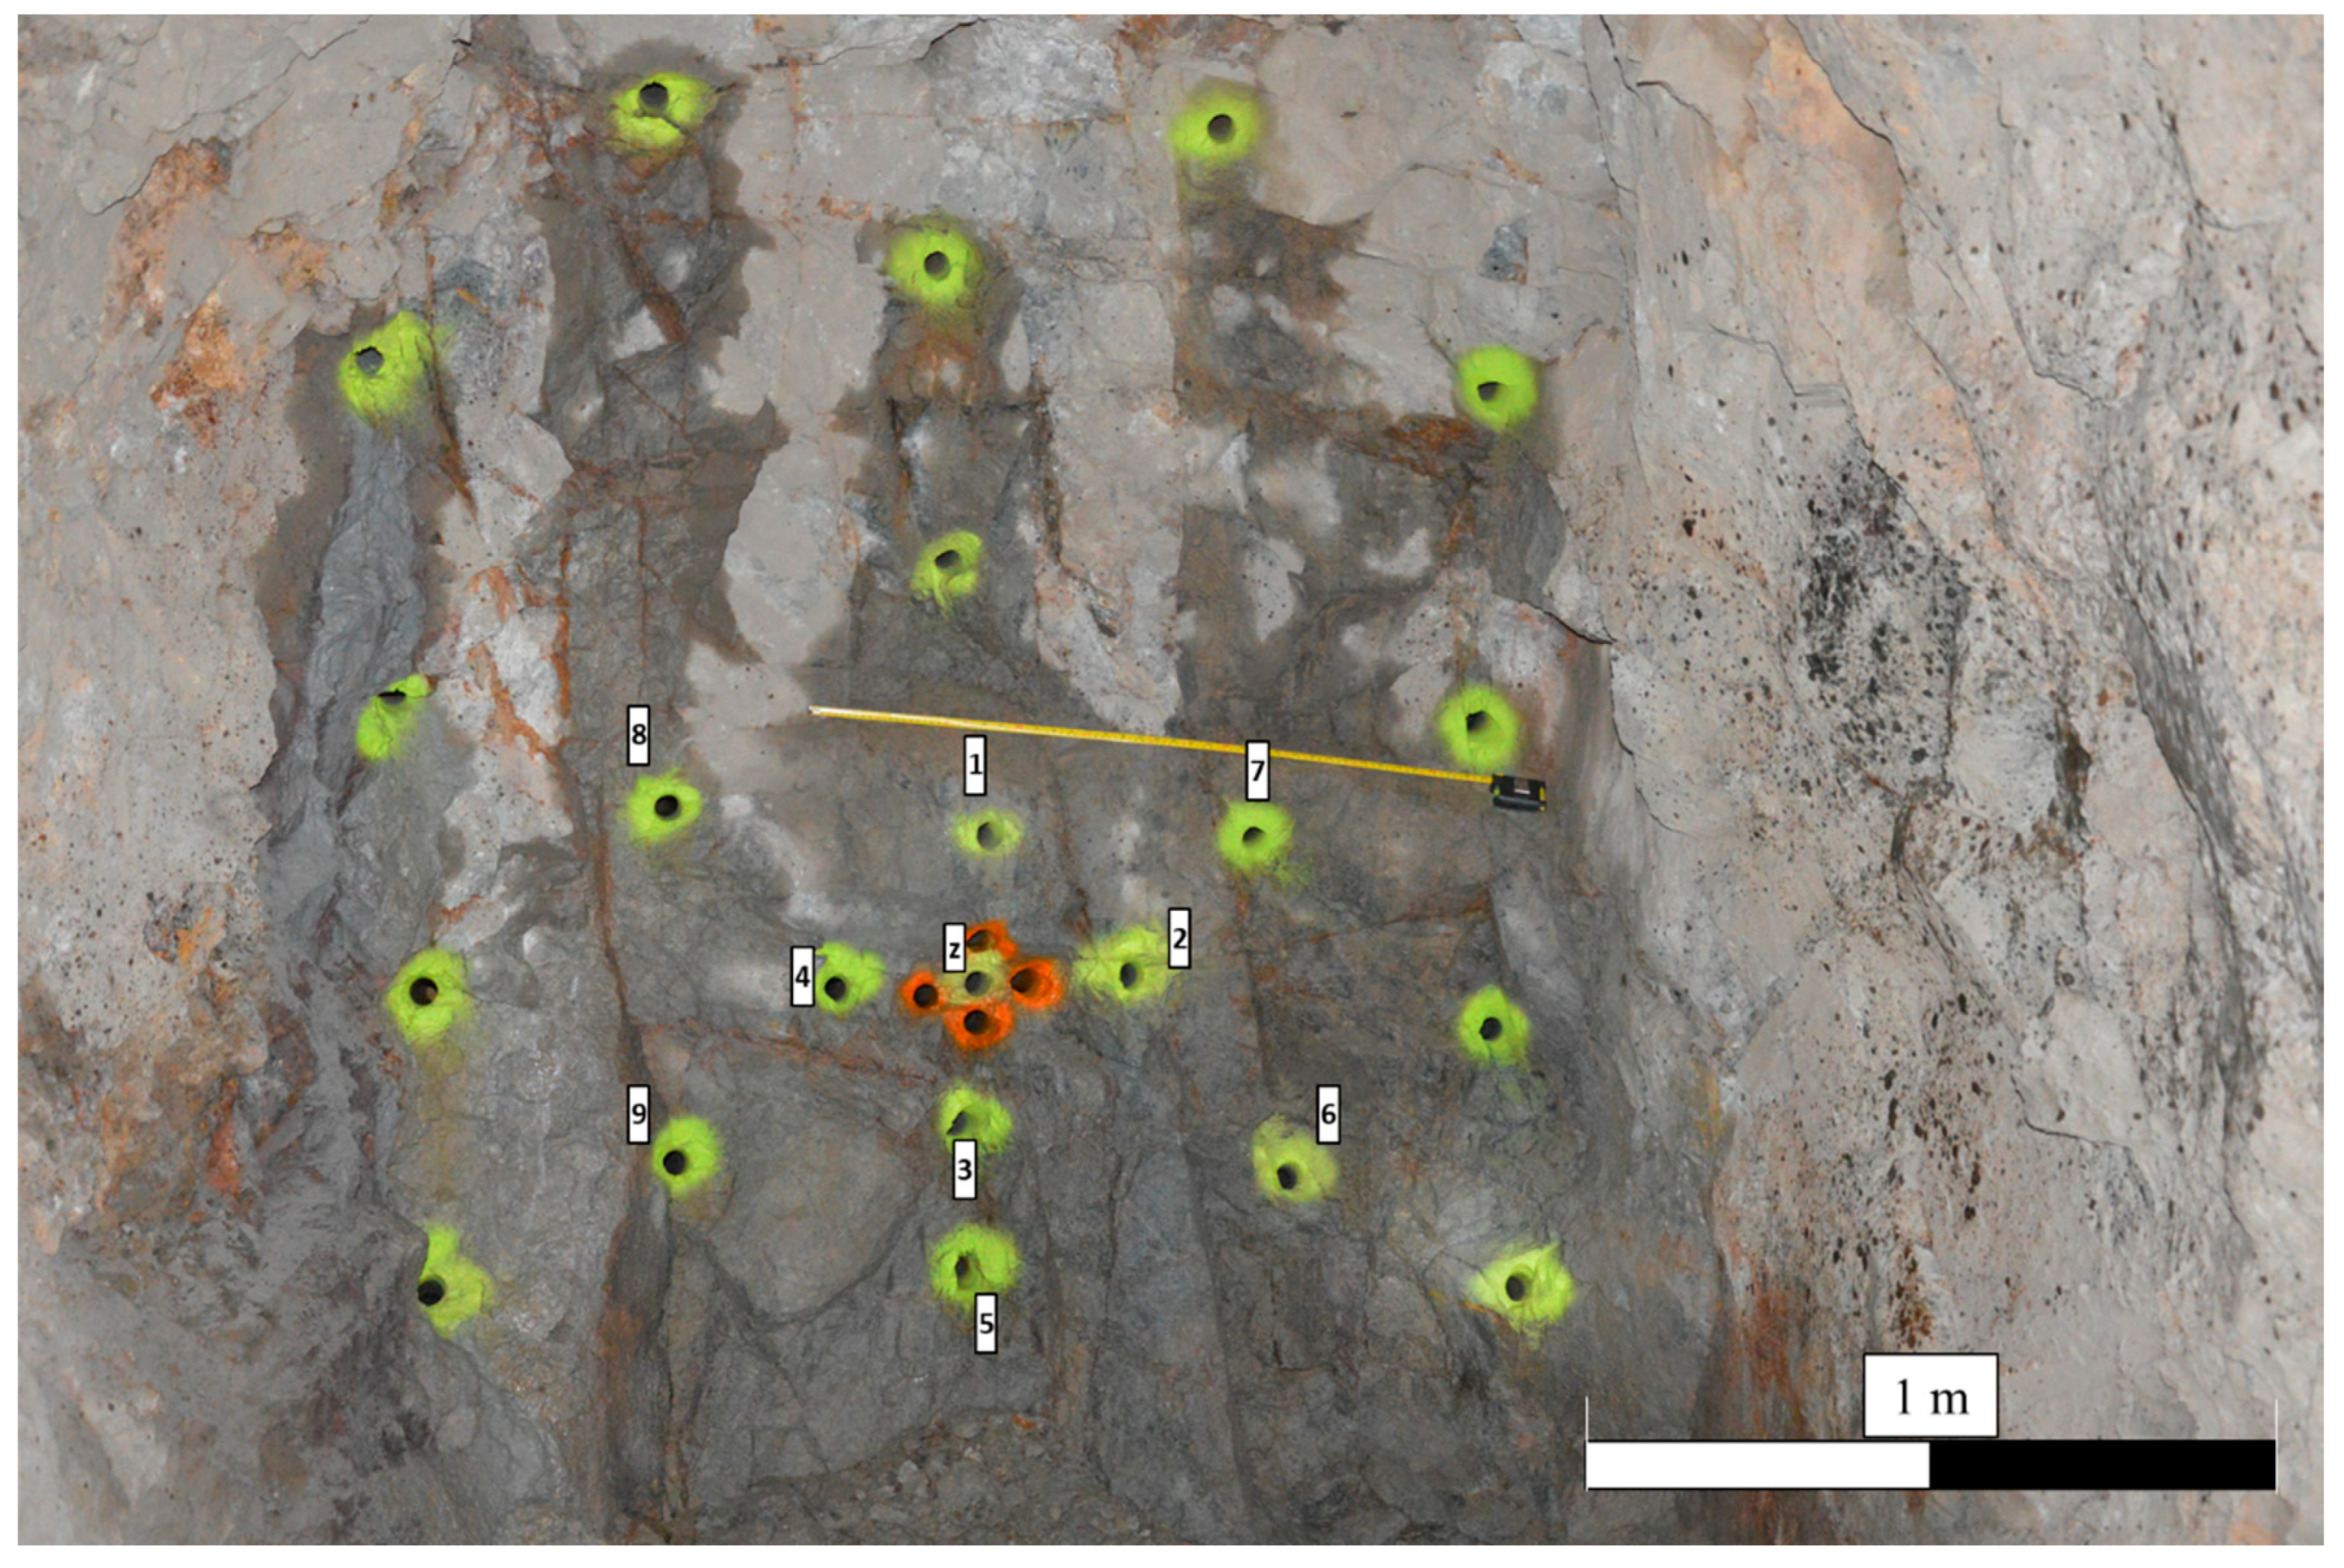
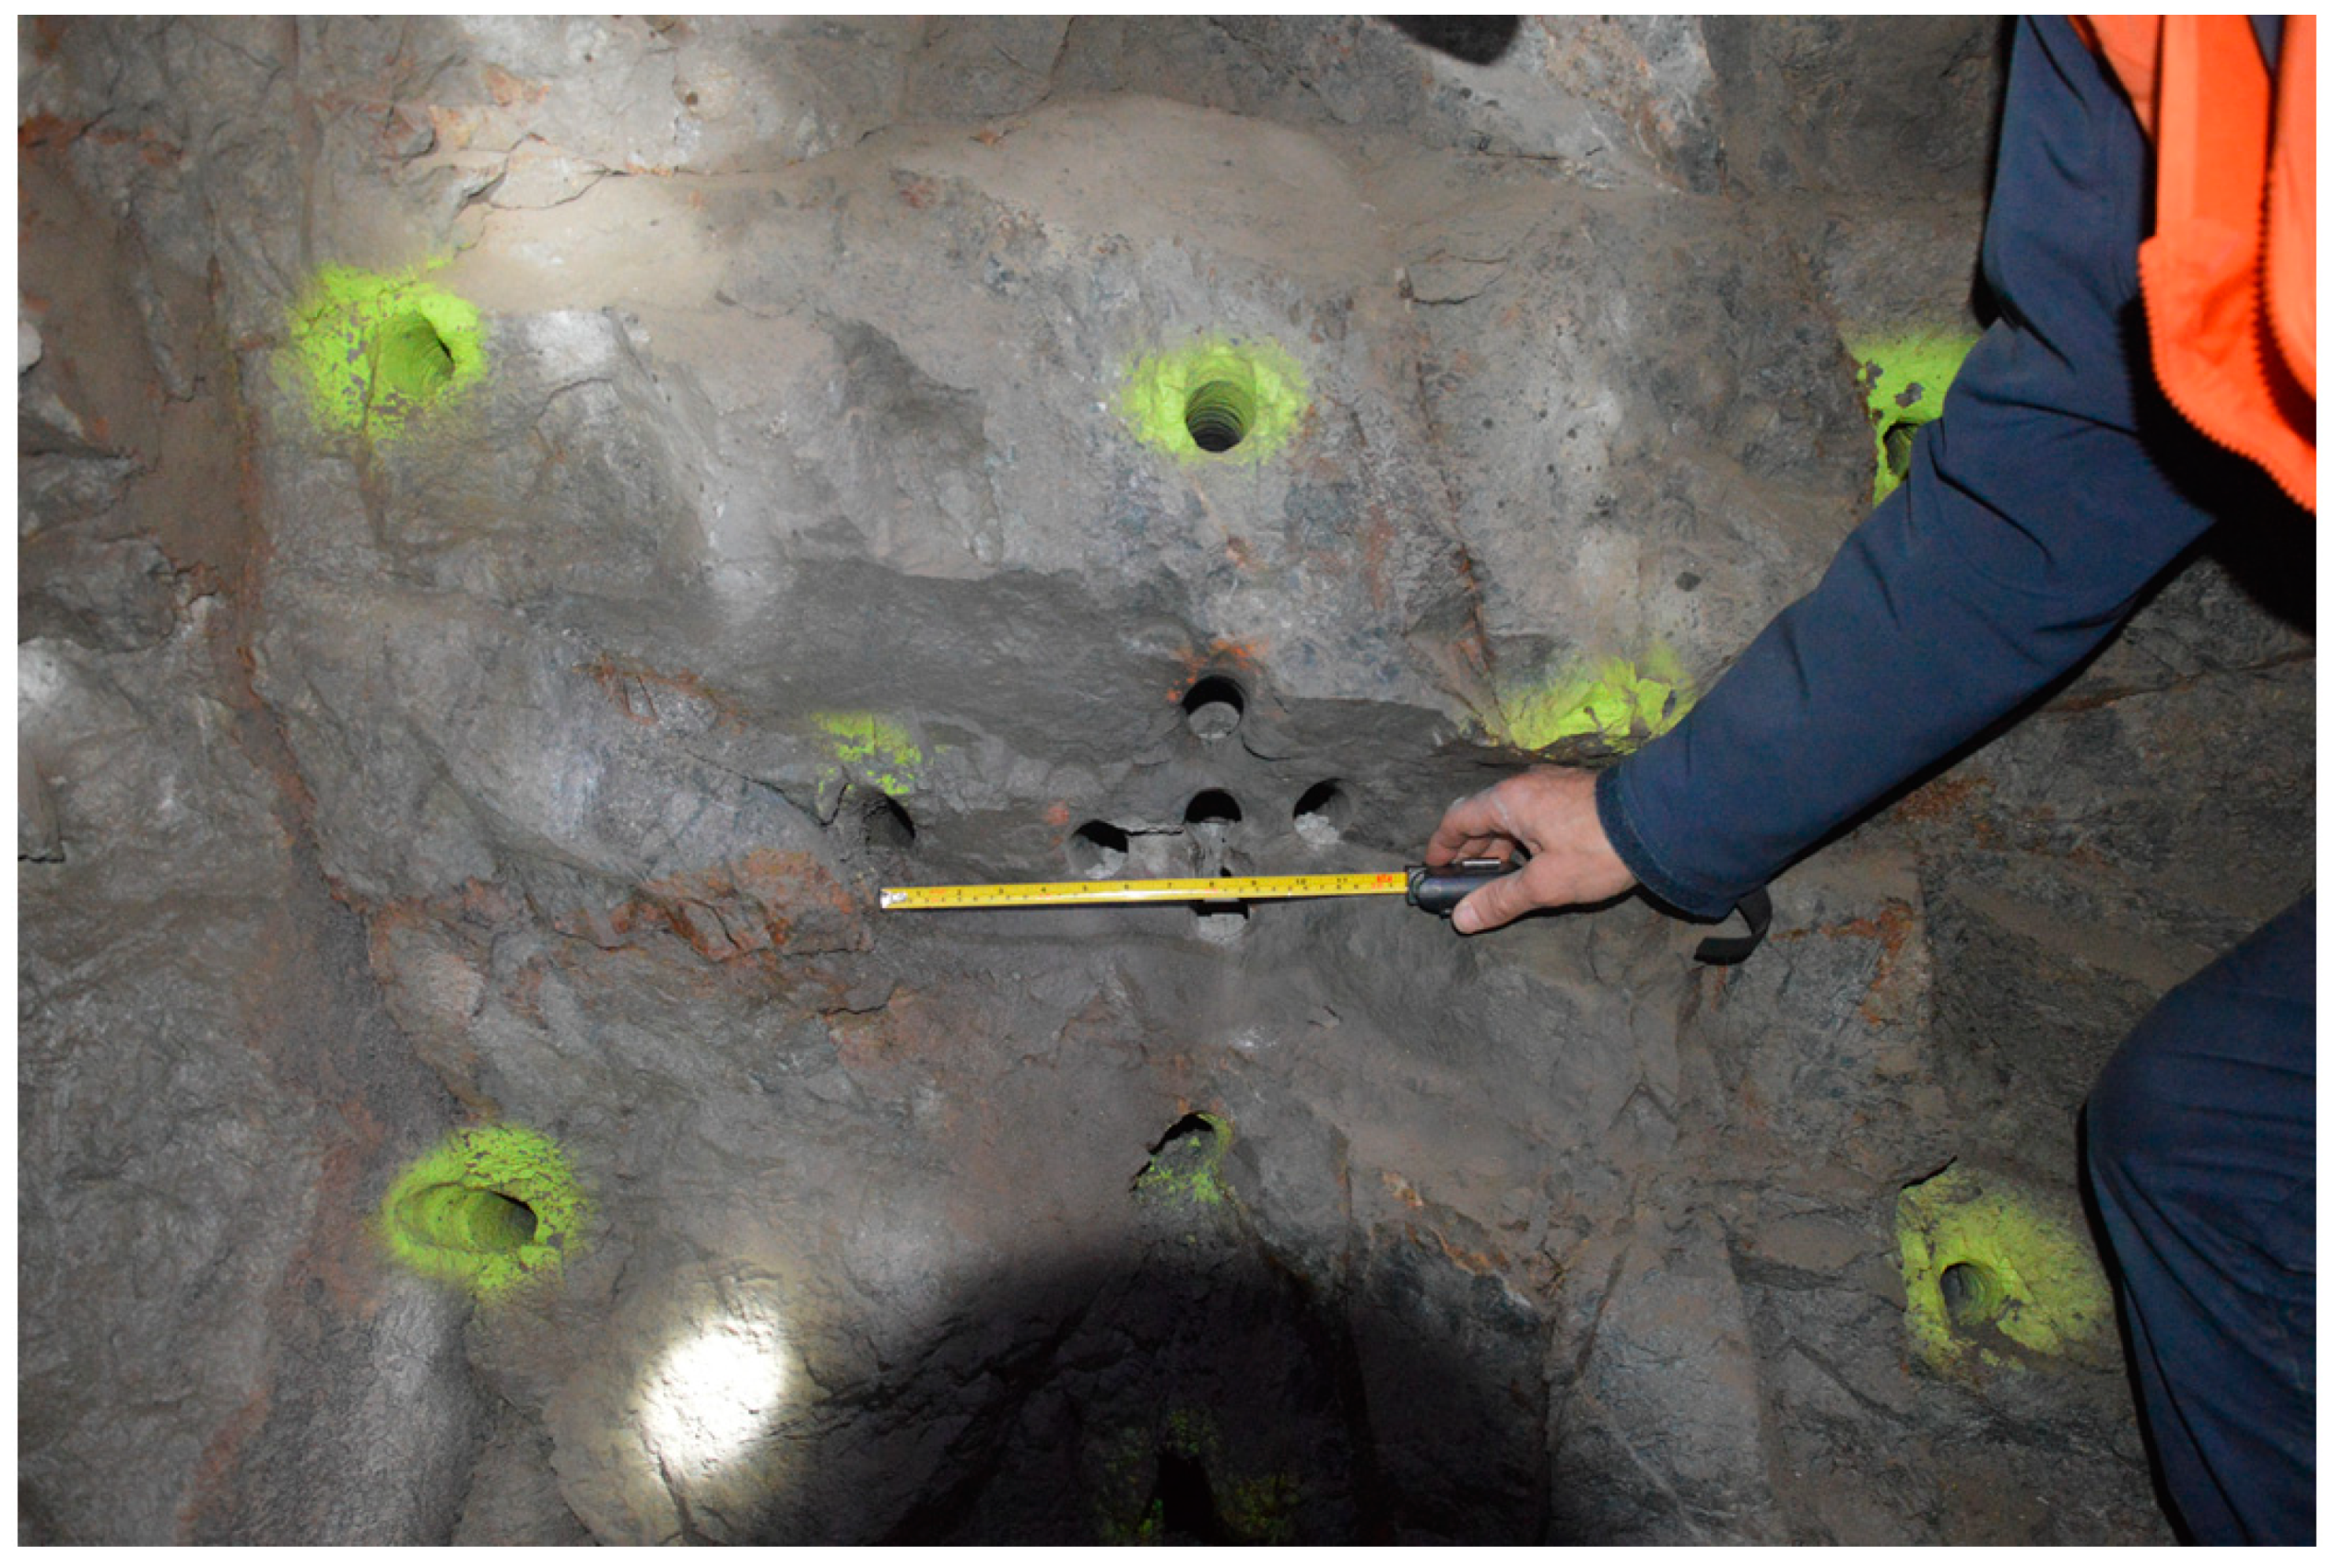
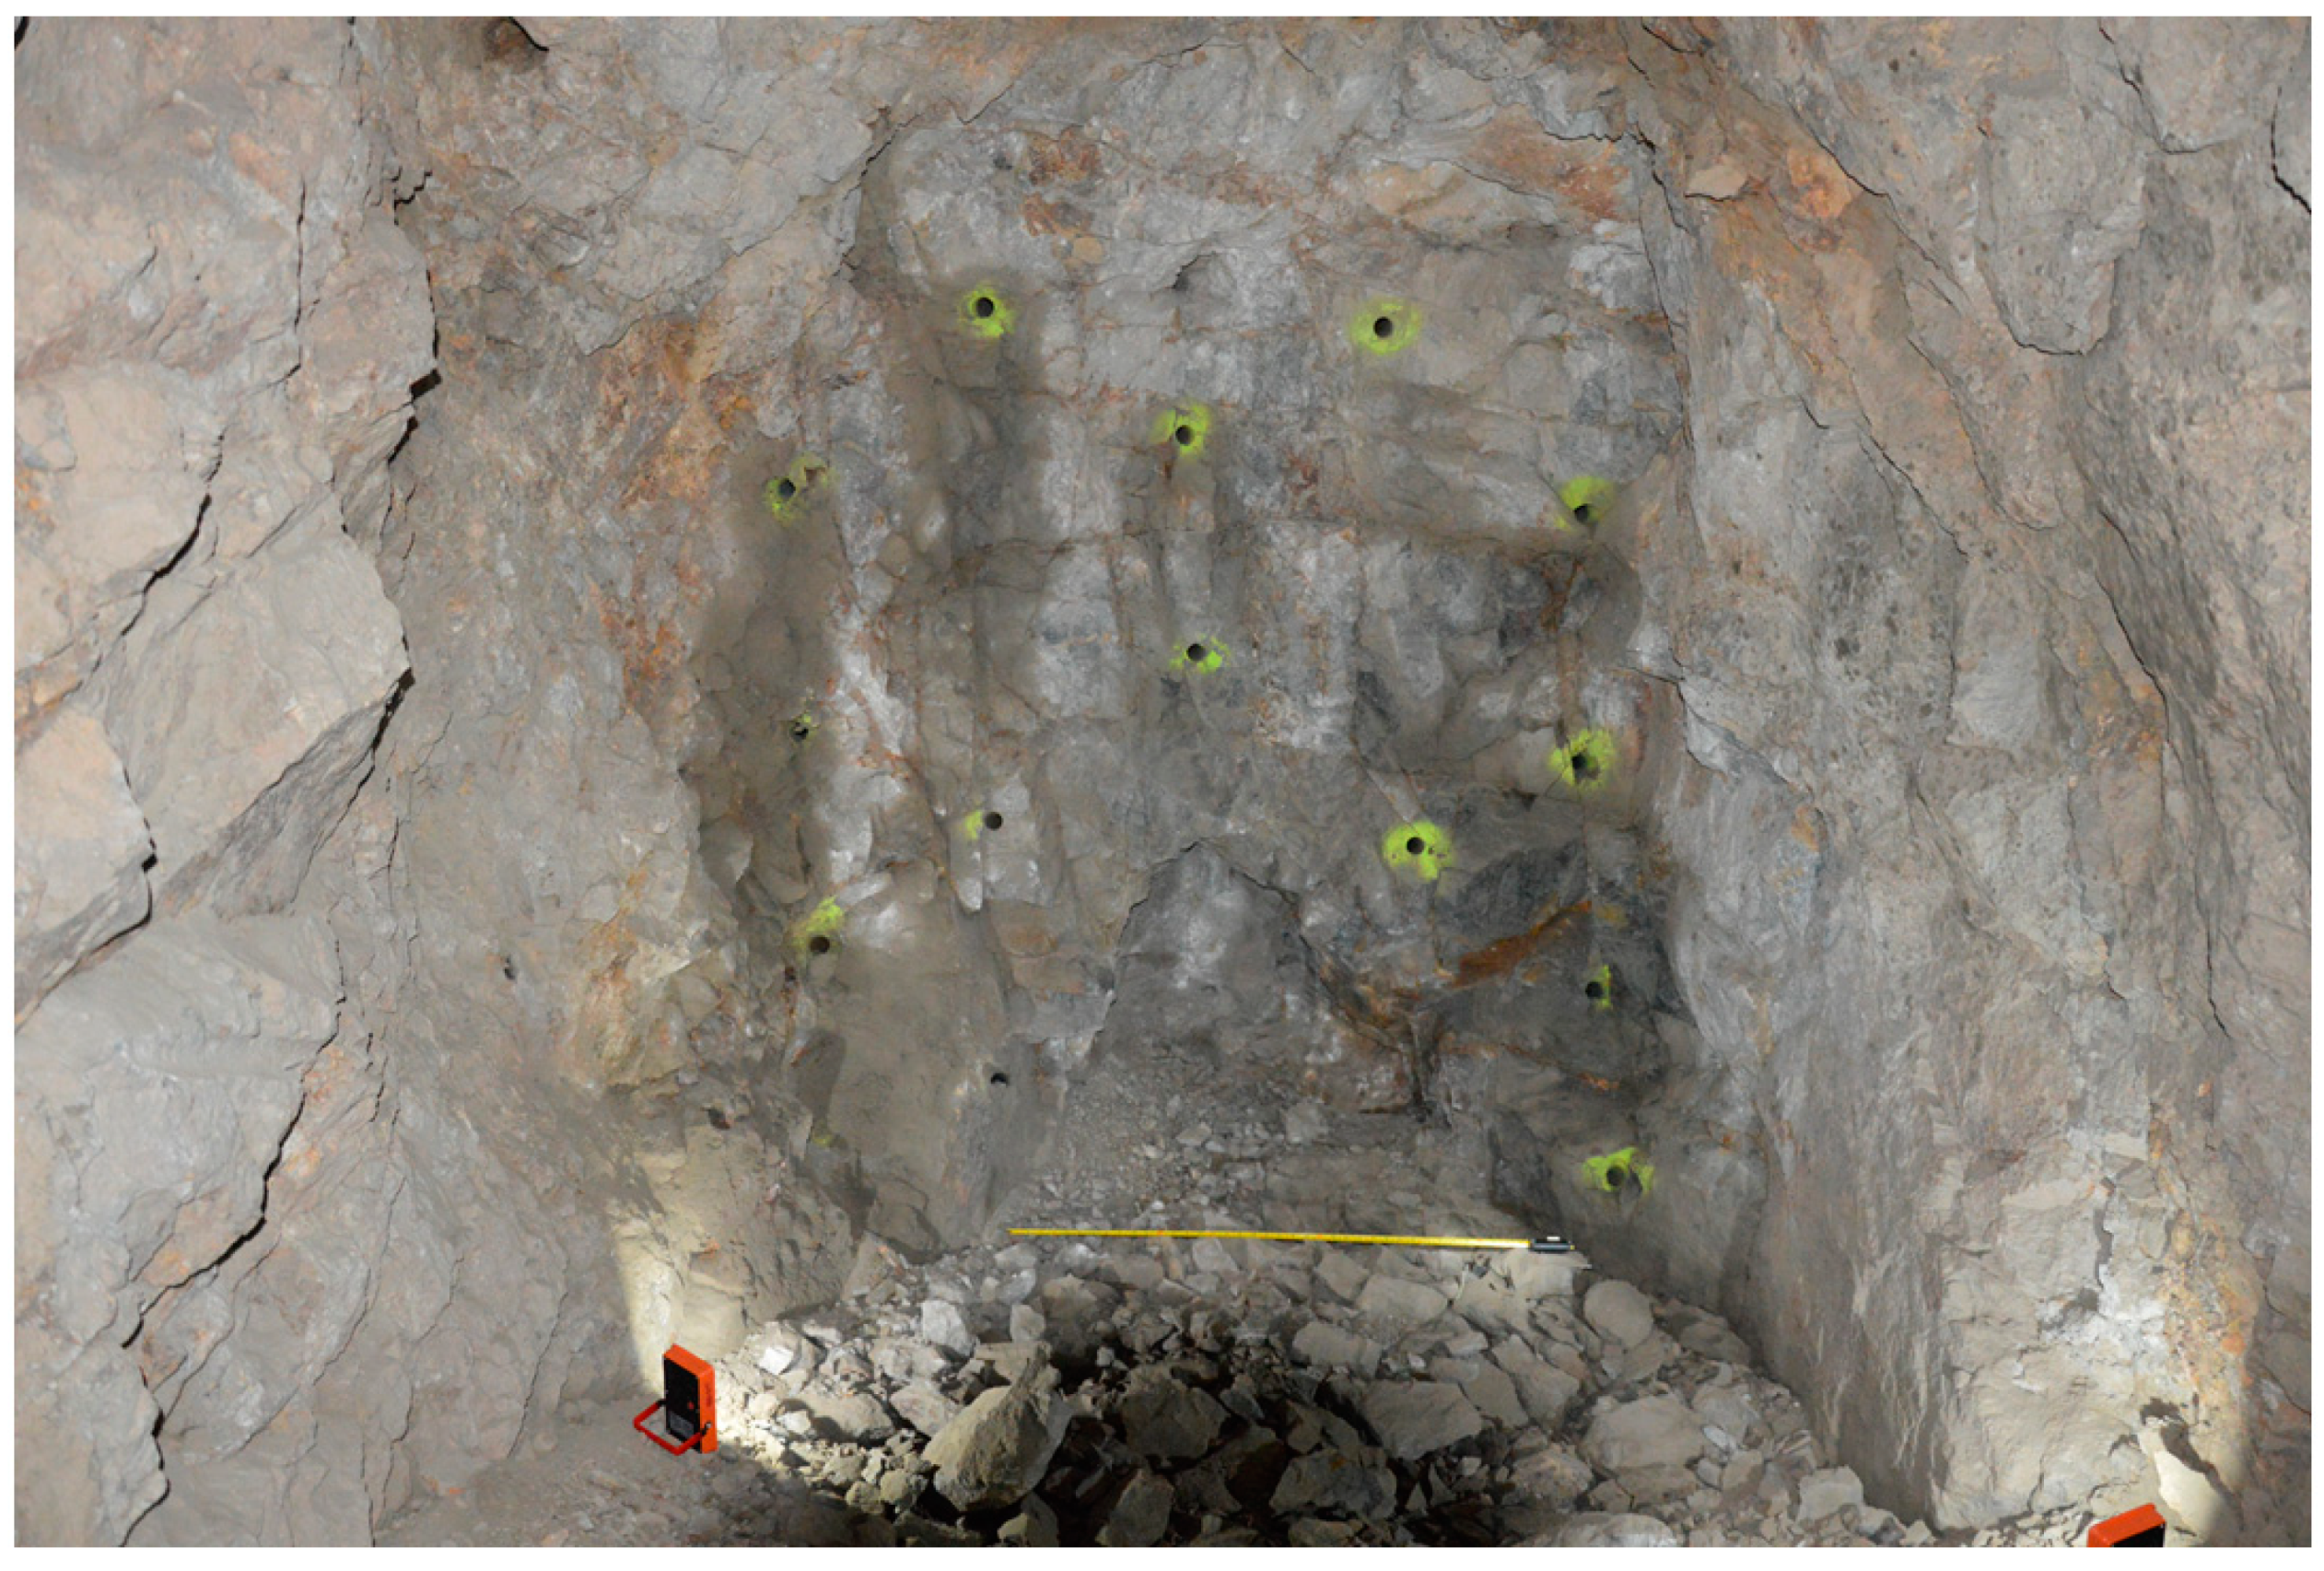
Figure 1 shows the configuration of the blast face as drilled: 21 charged holes and 4 dummy holes are visible. During the test, only the first ten holes (whose sequence is reported in Figure 1) were measured. Such holes represent the opening cut and were the objective of the research. The other 11 production and contour holes were charged and shot separately in a single blast due to operational constraints.
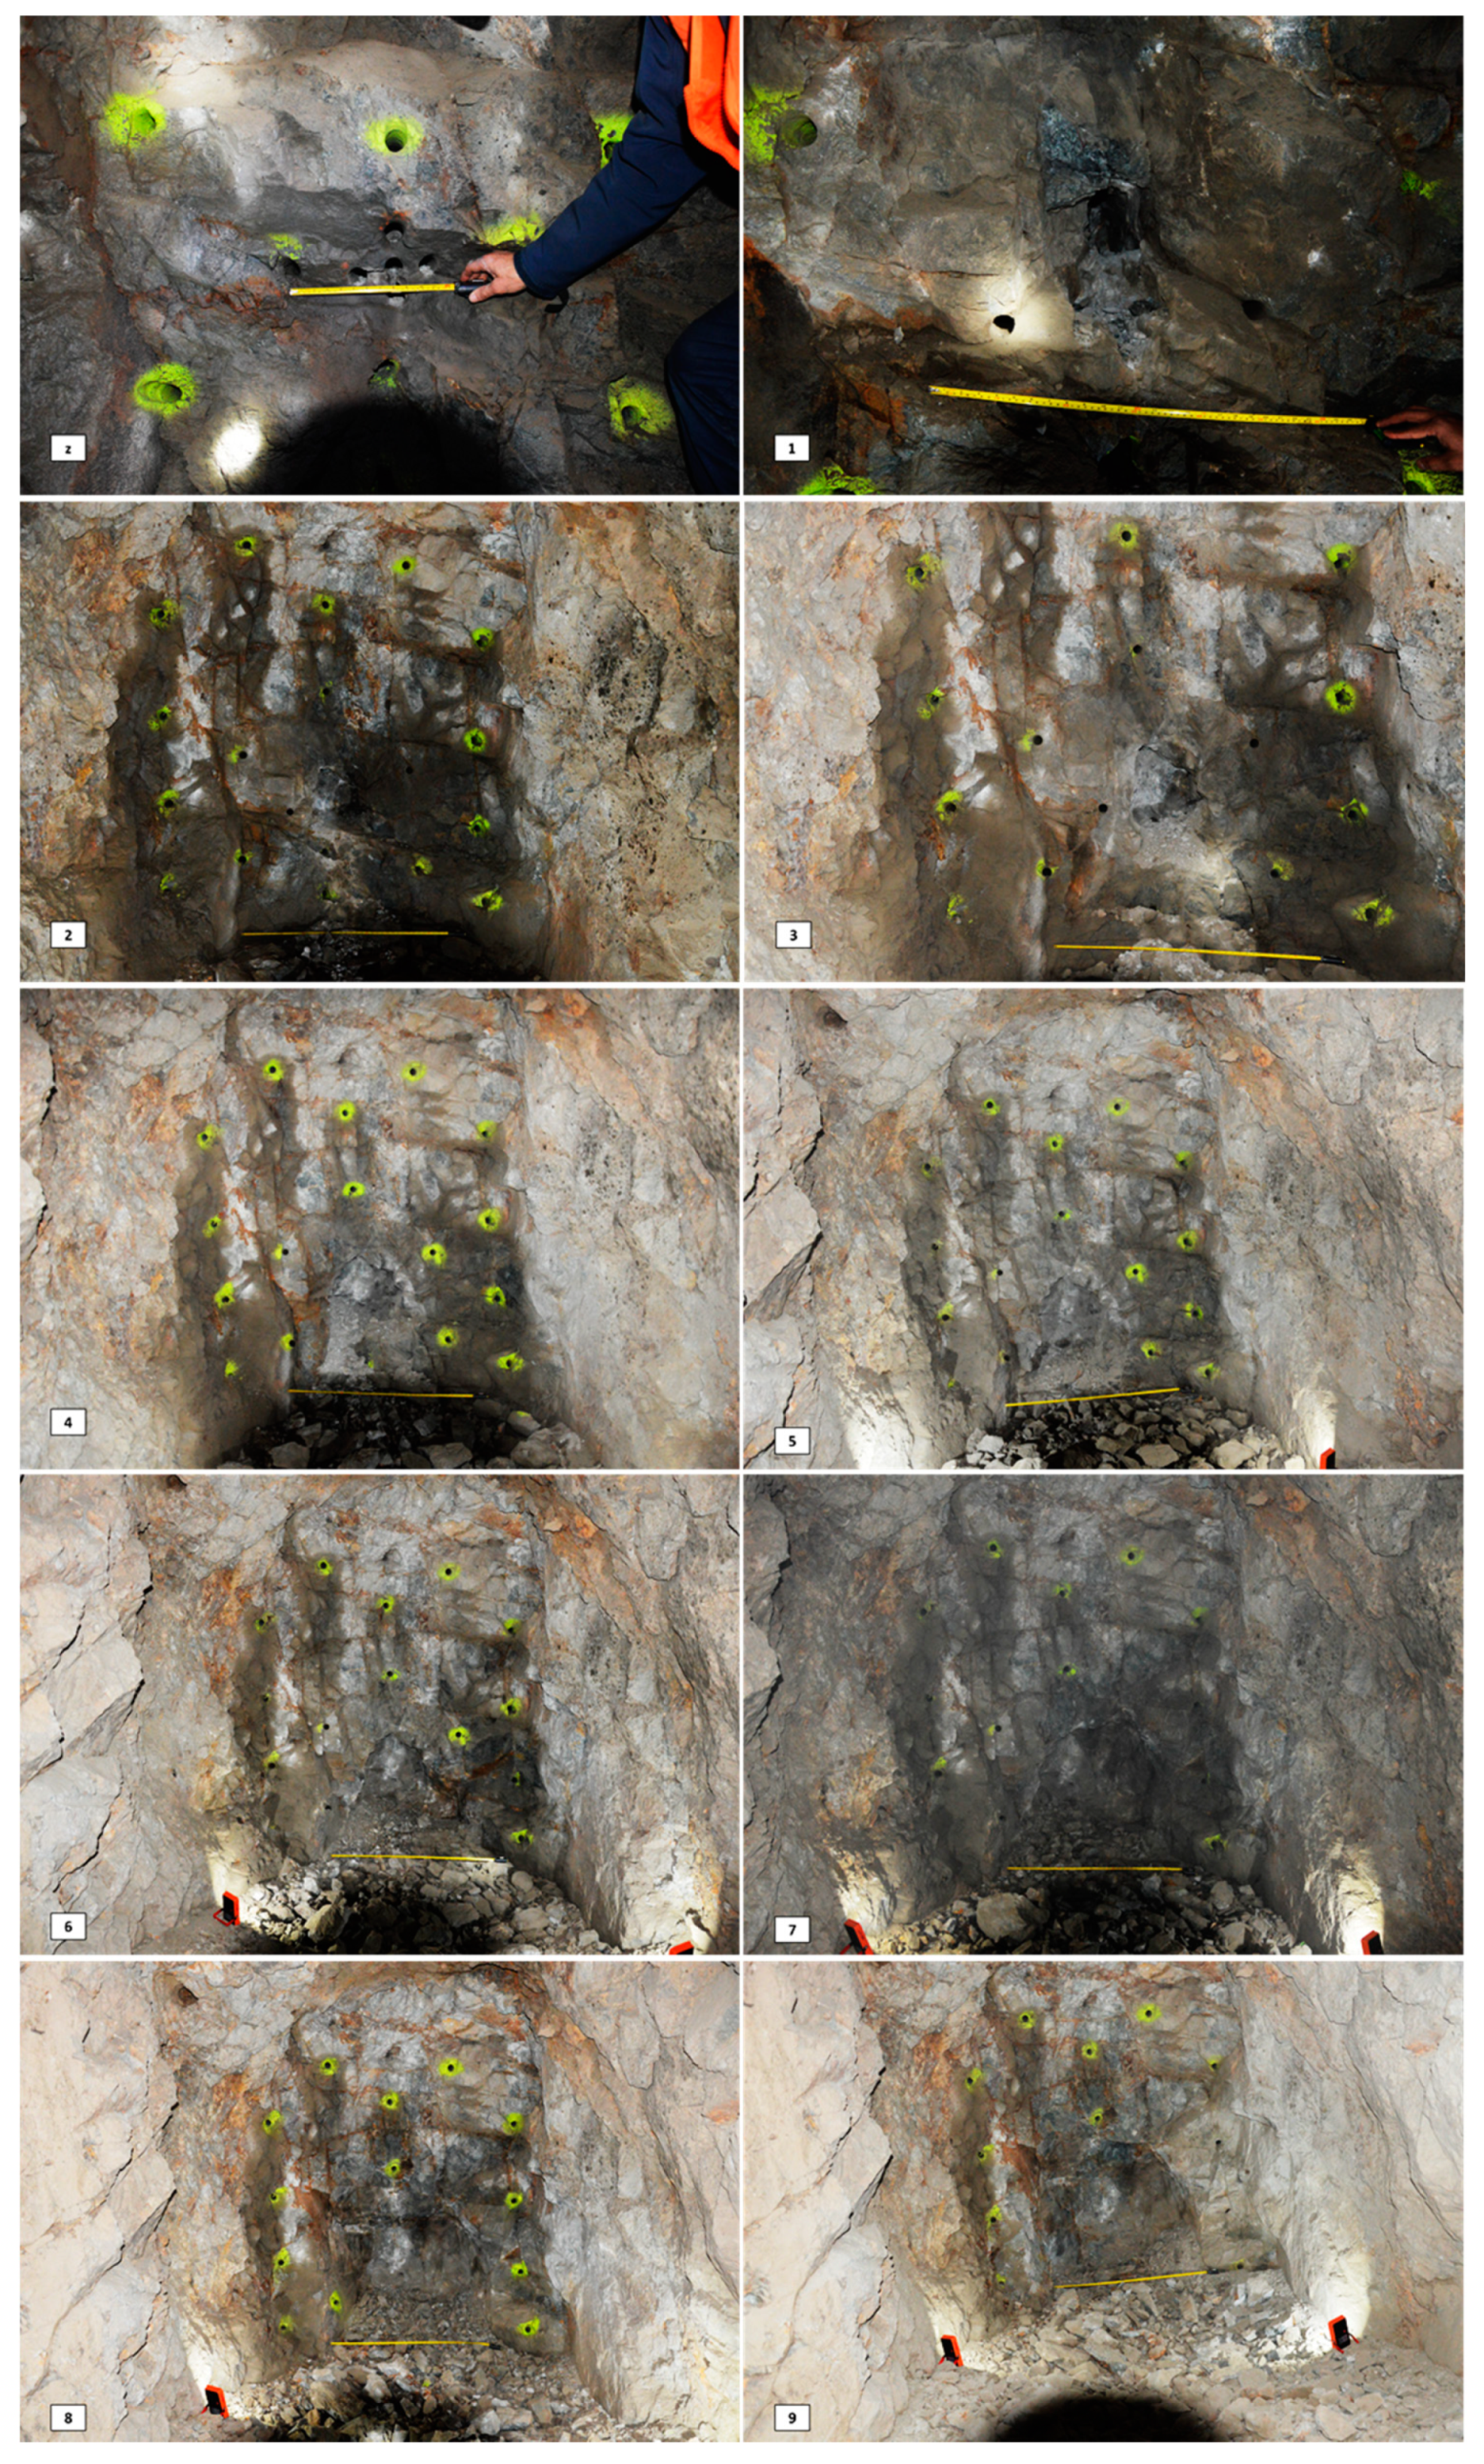
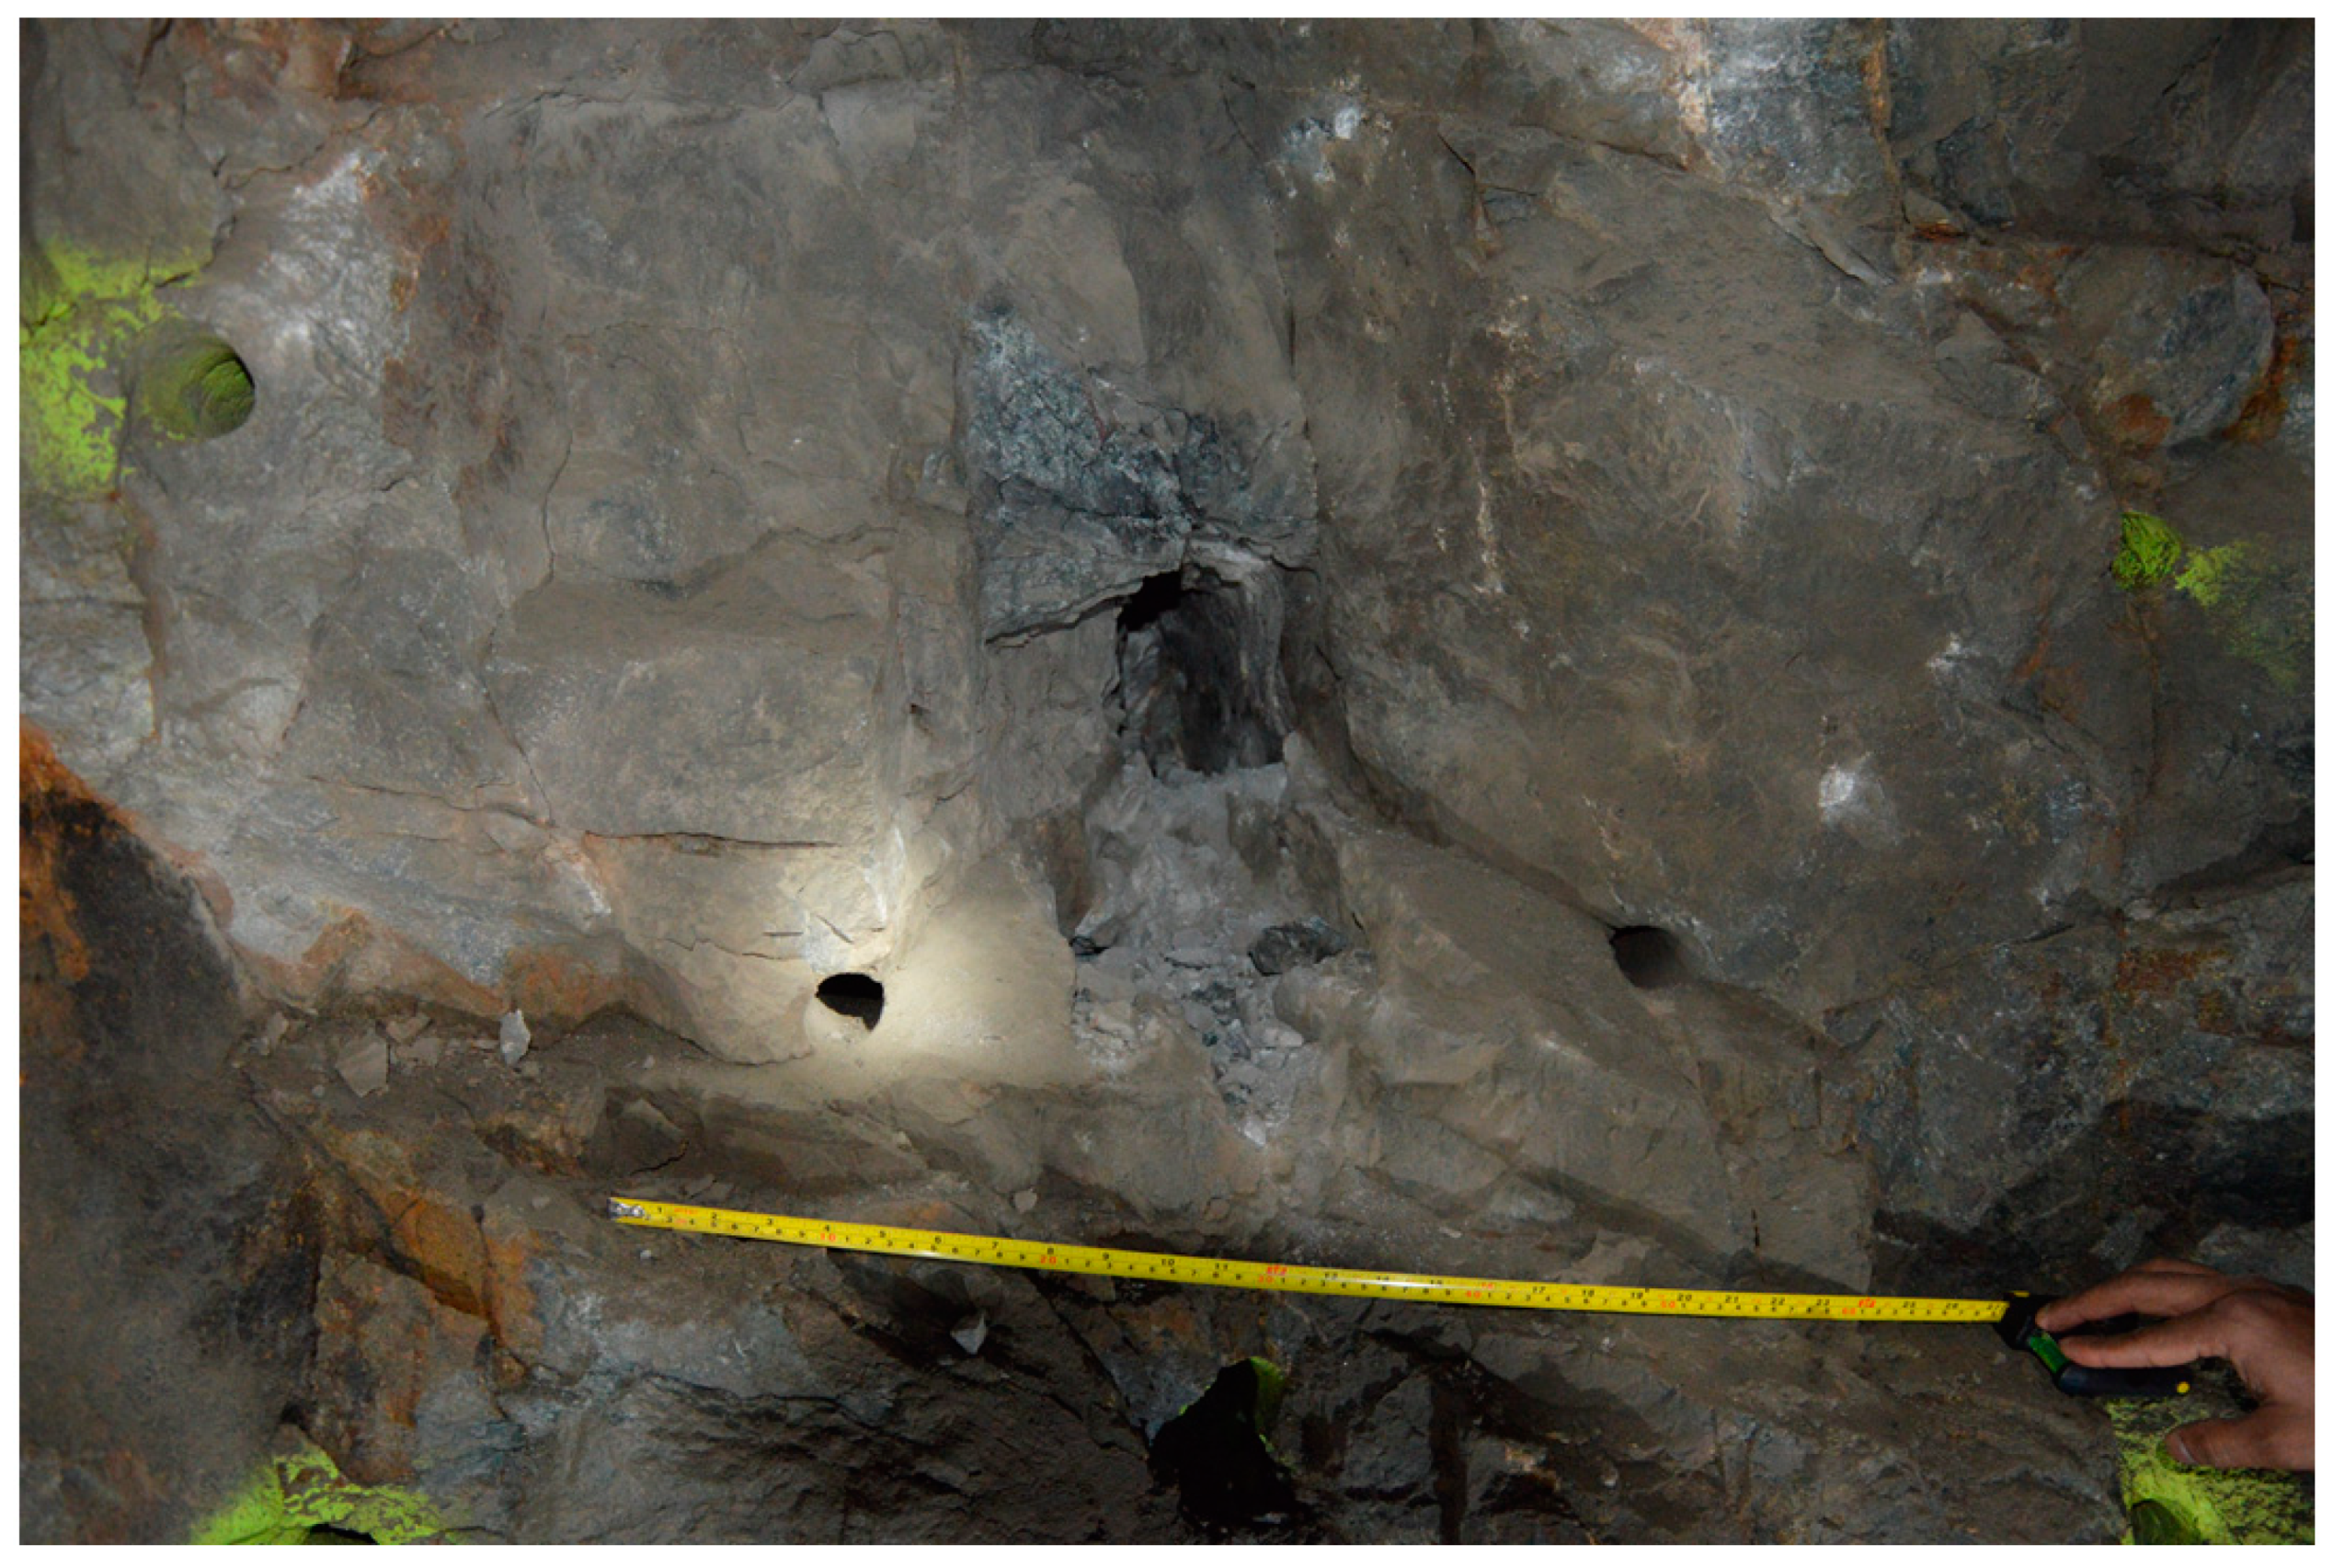
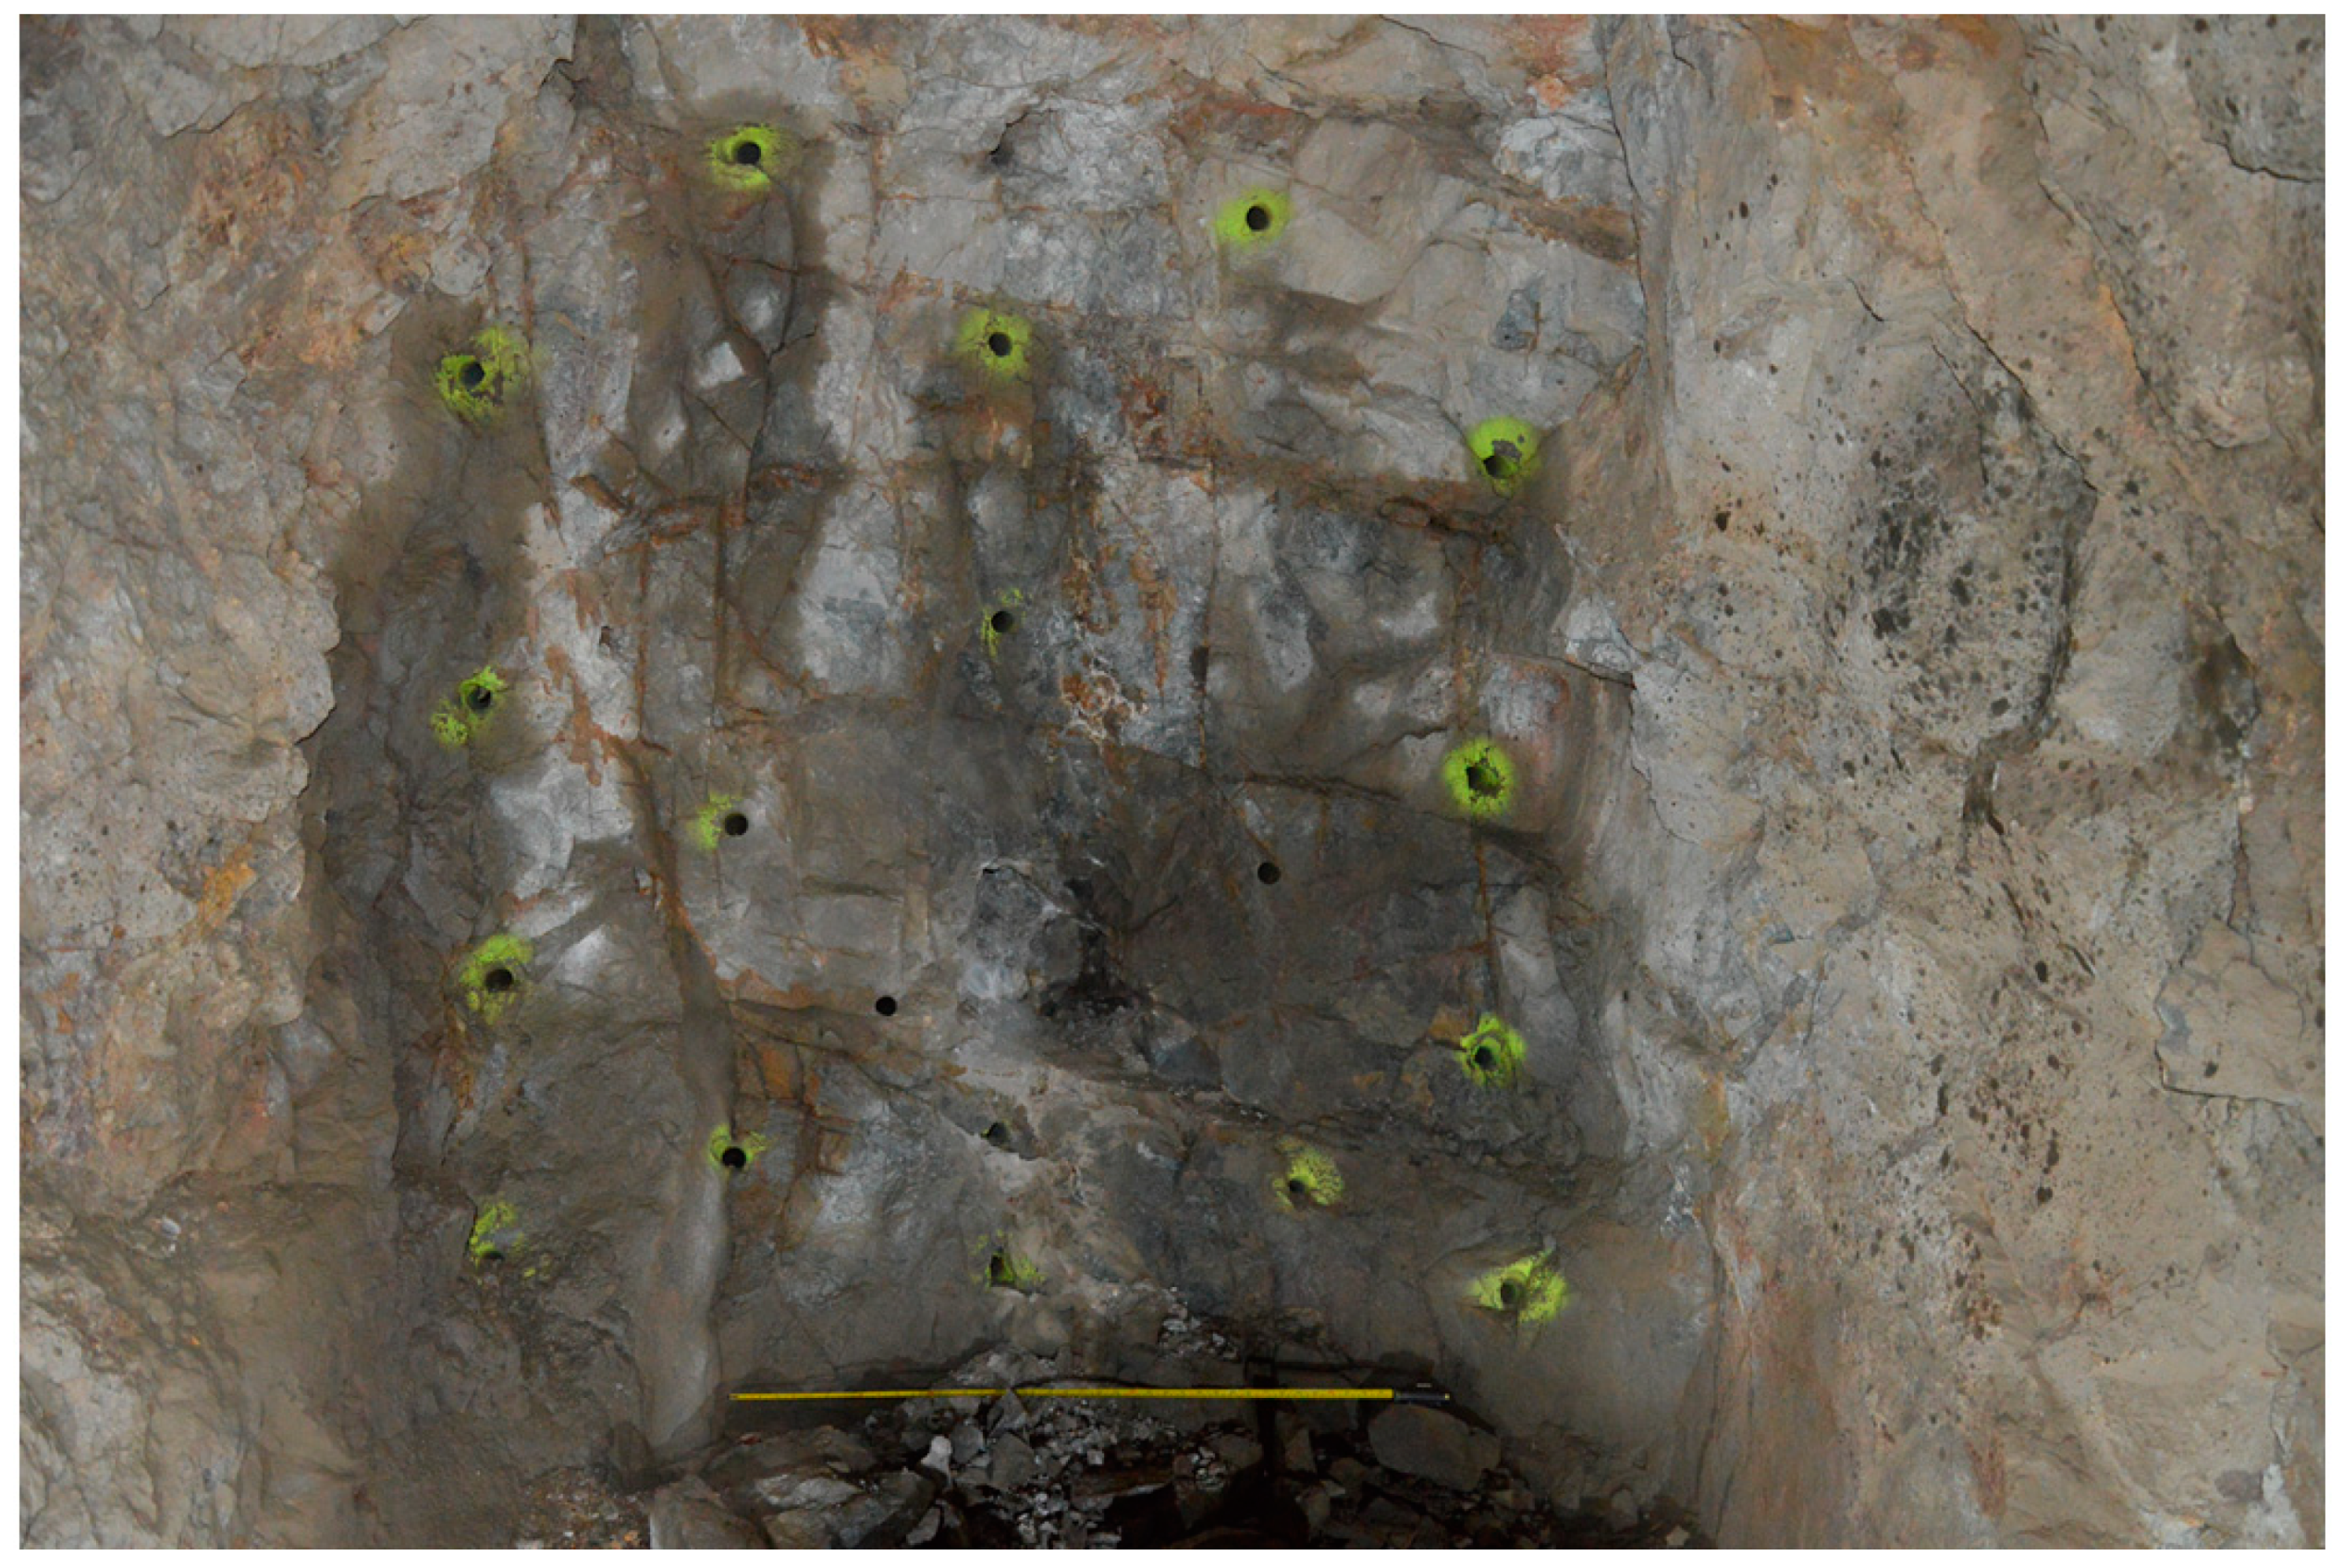
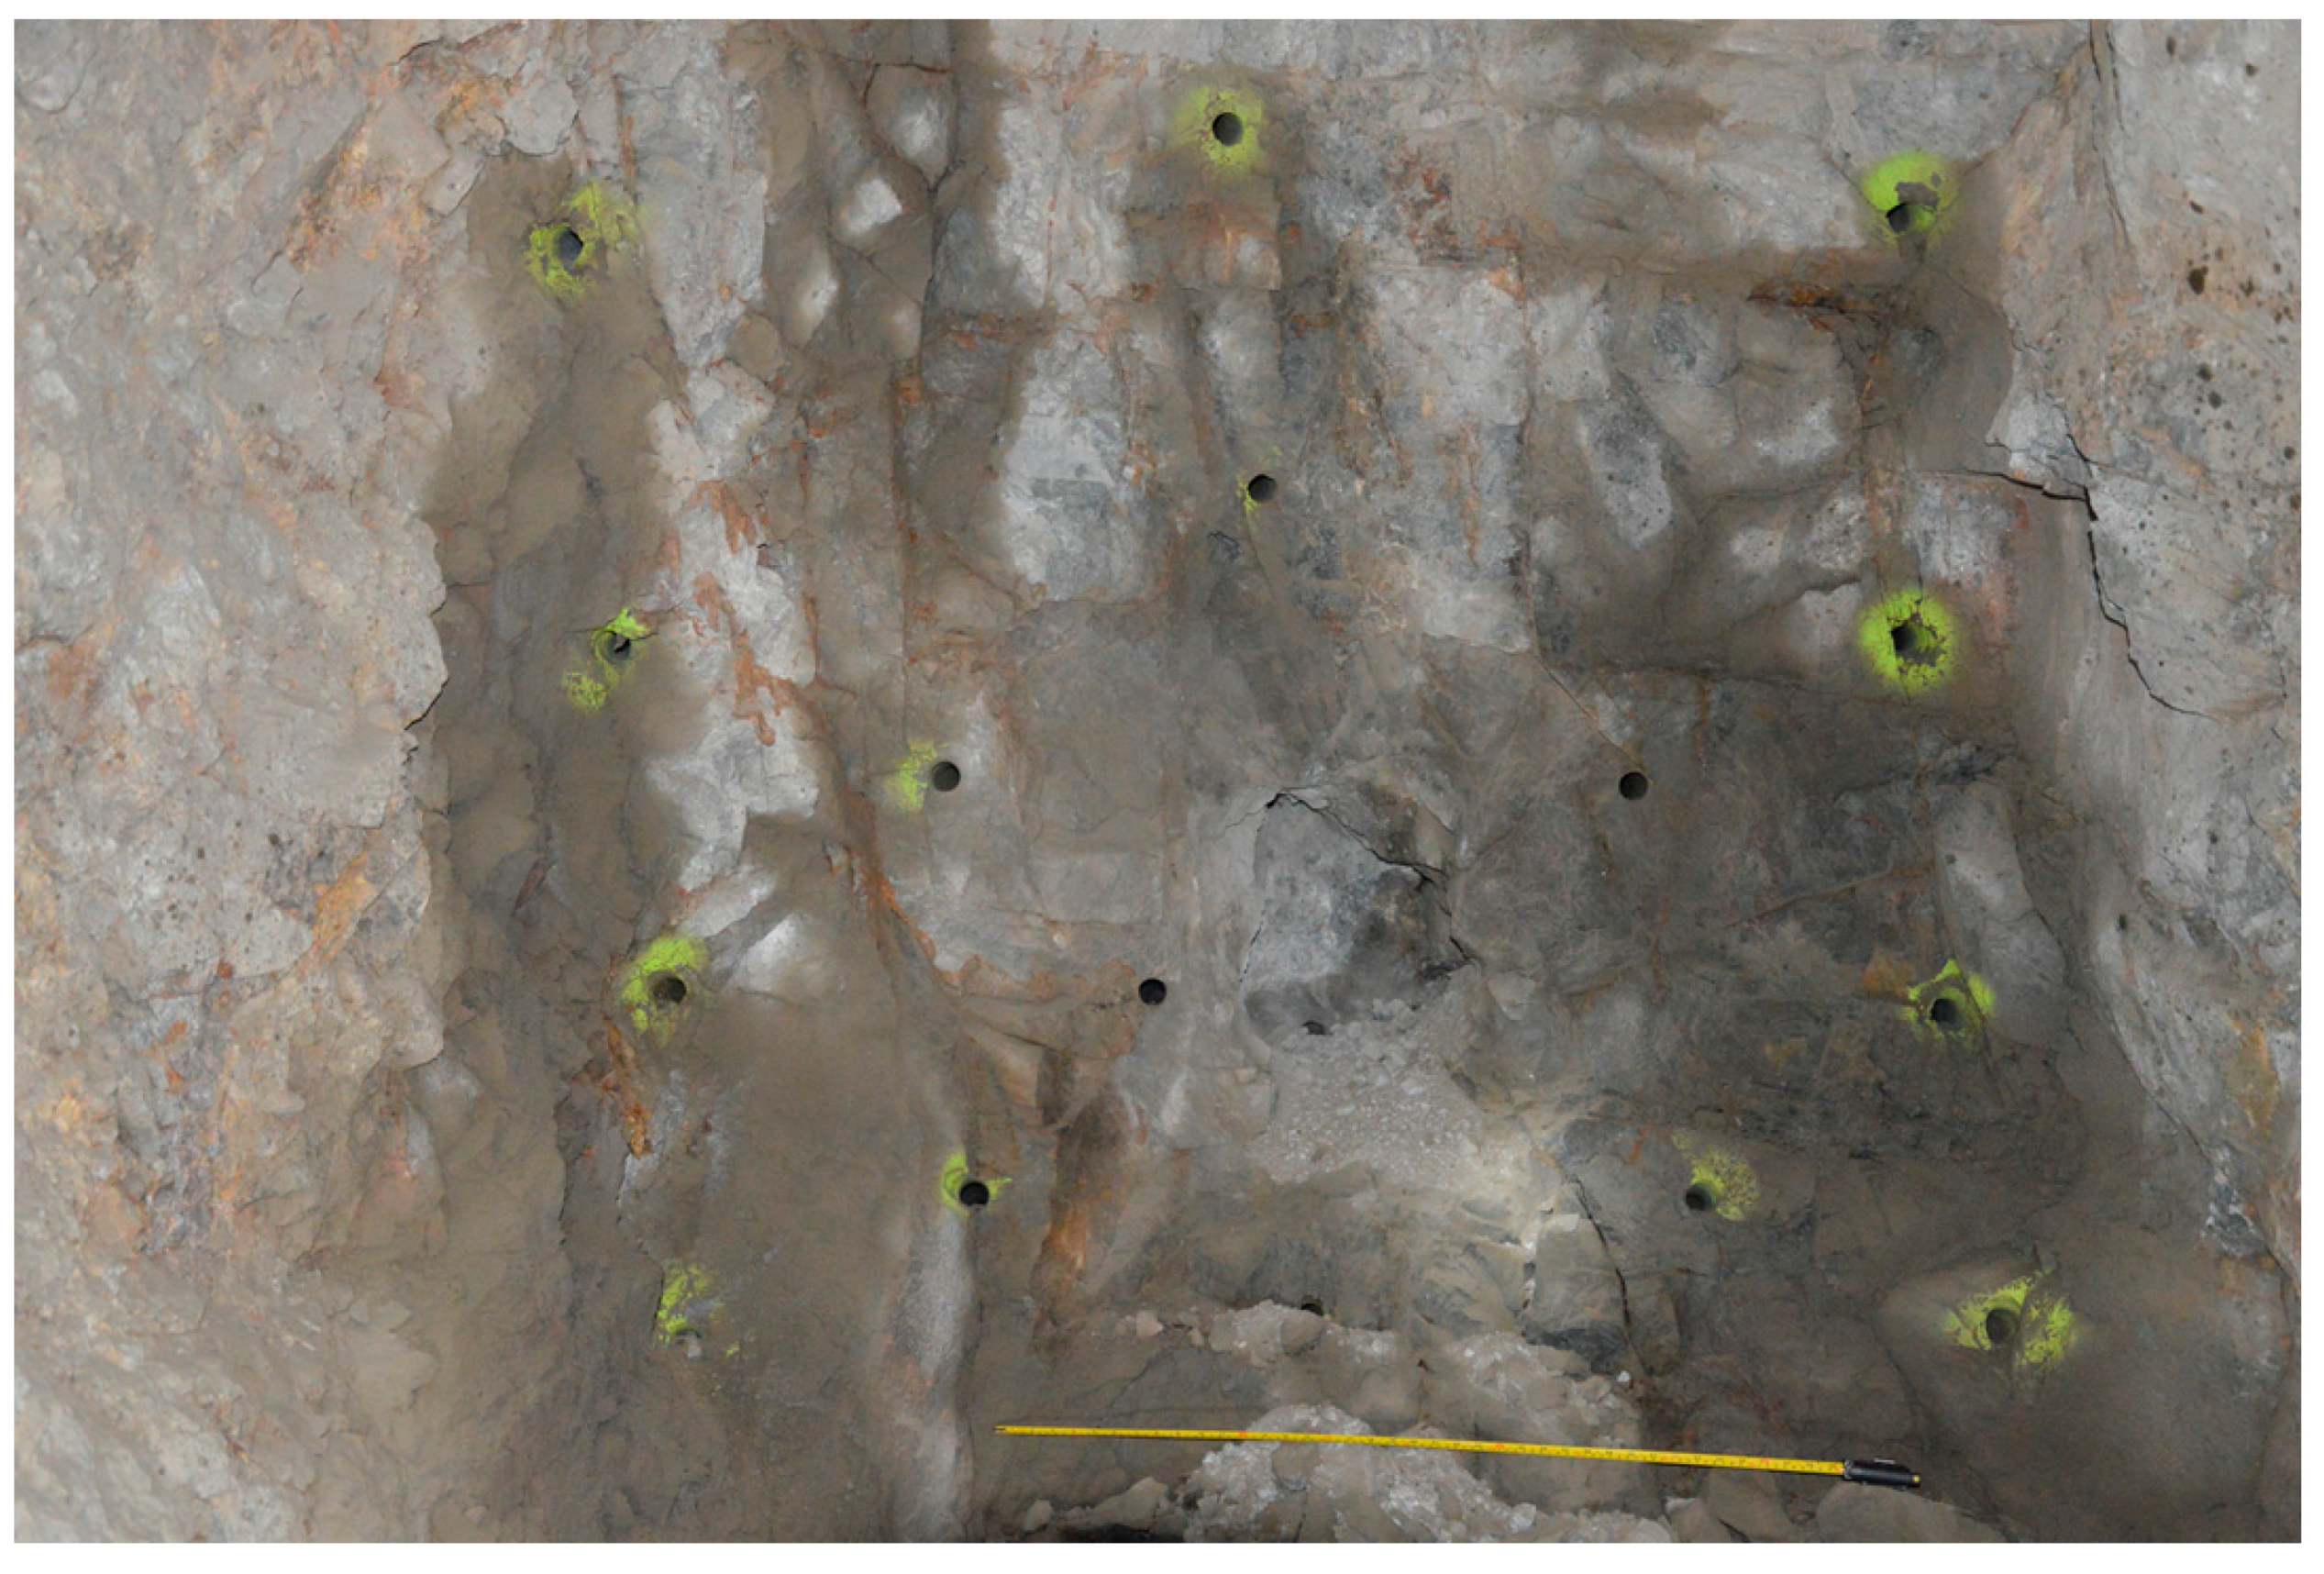
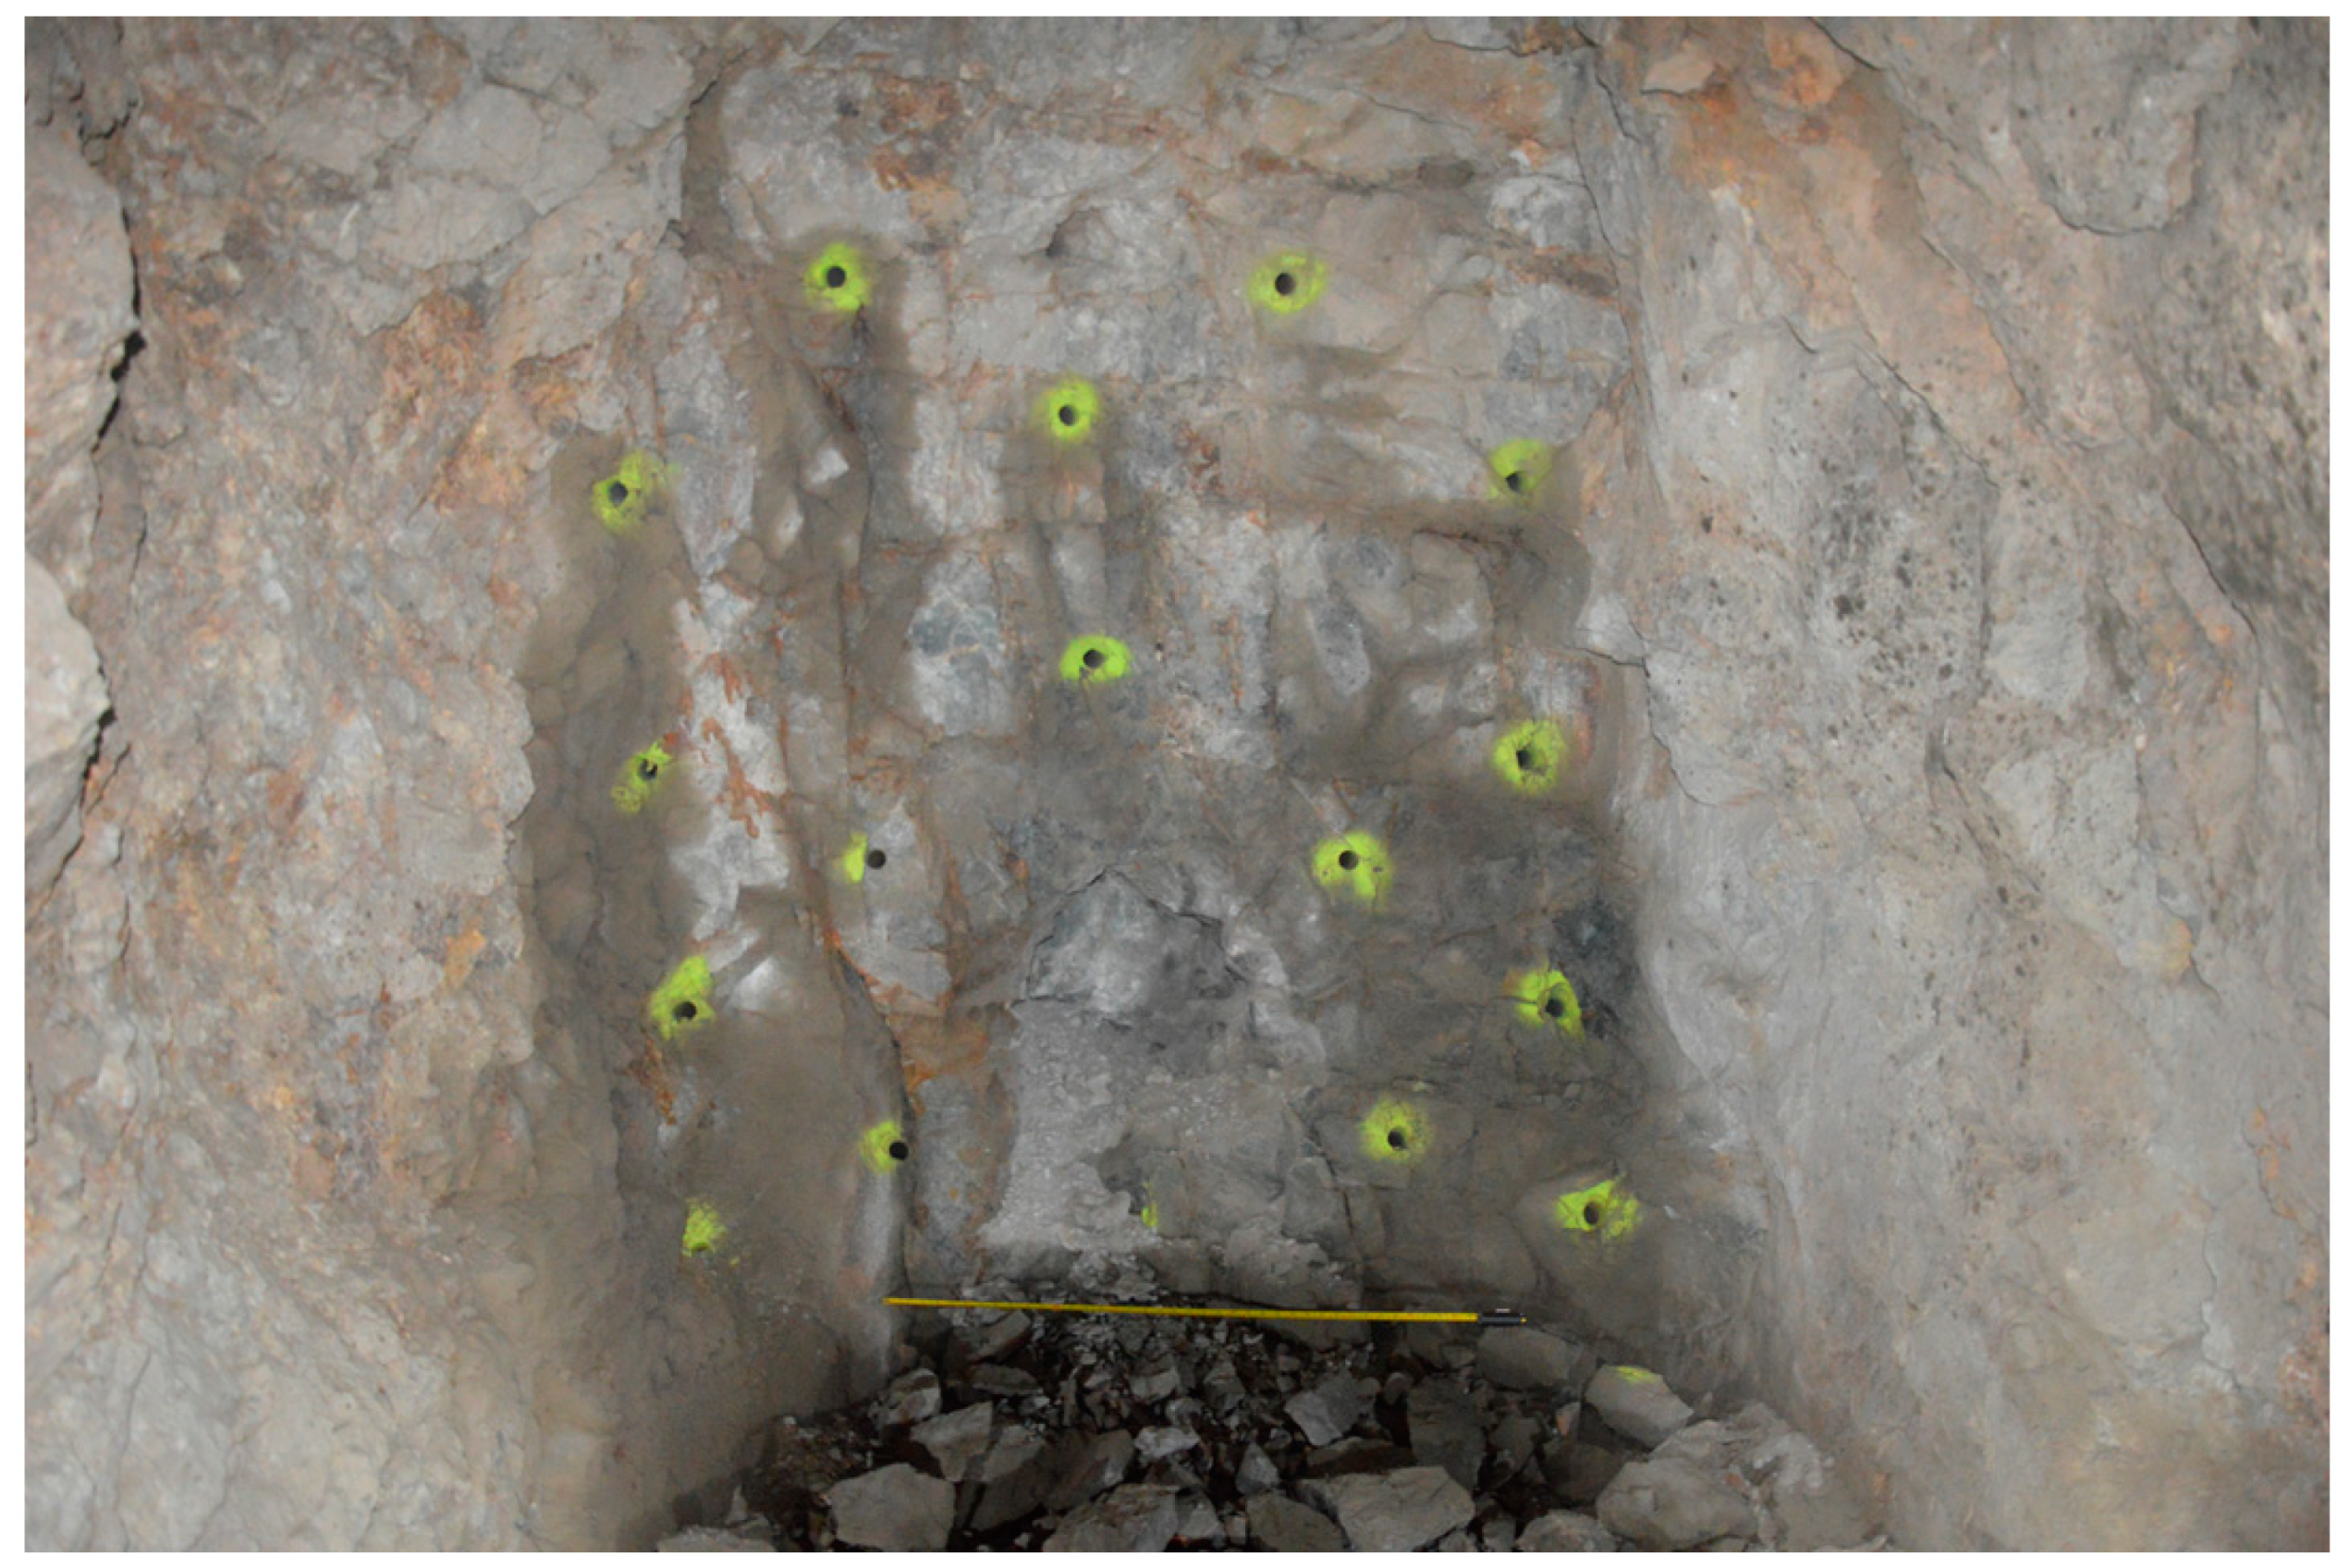
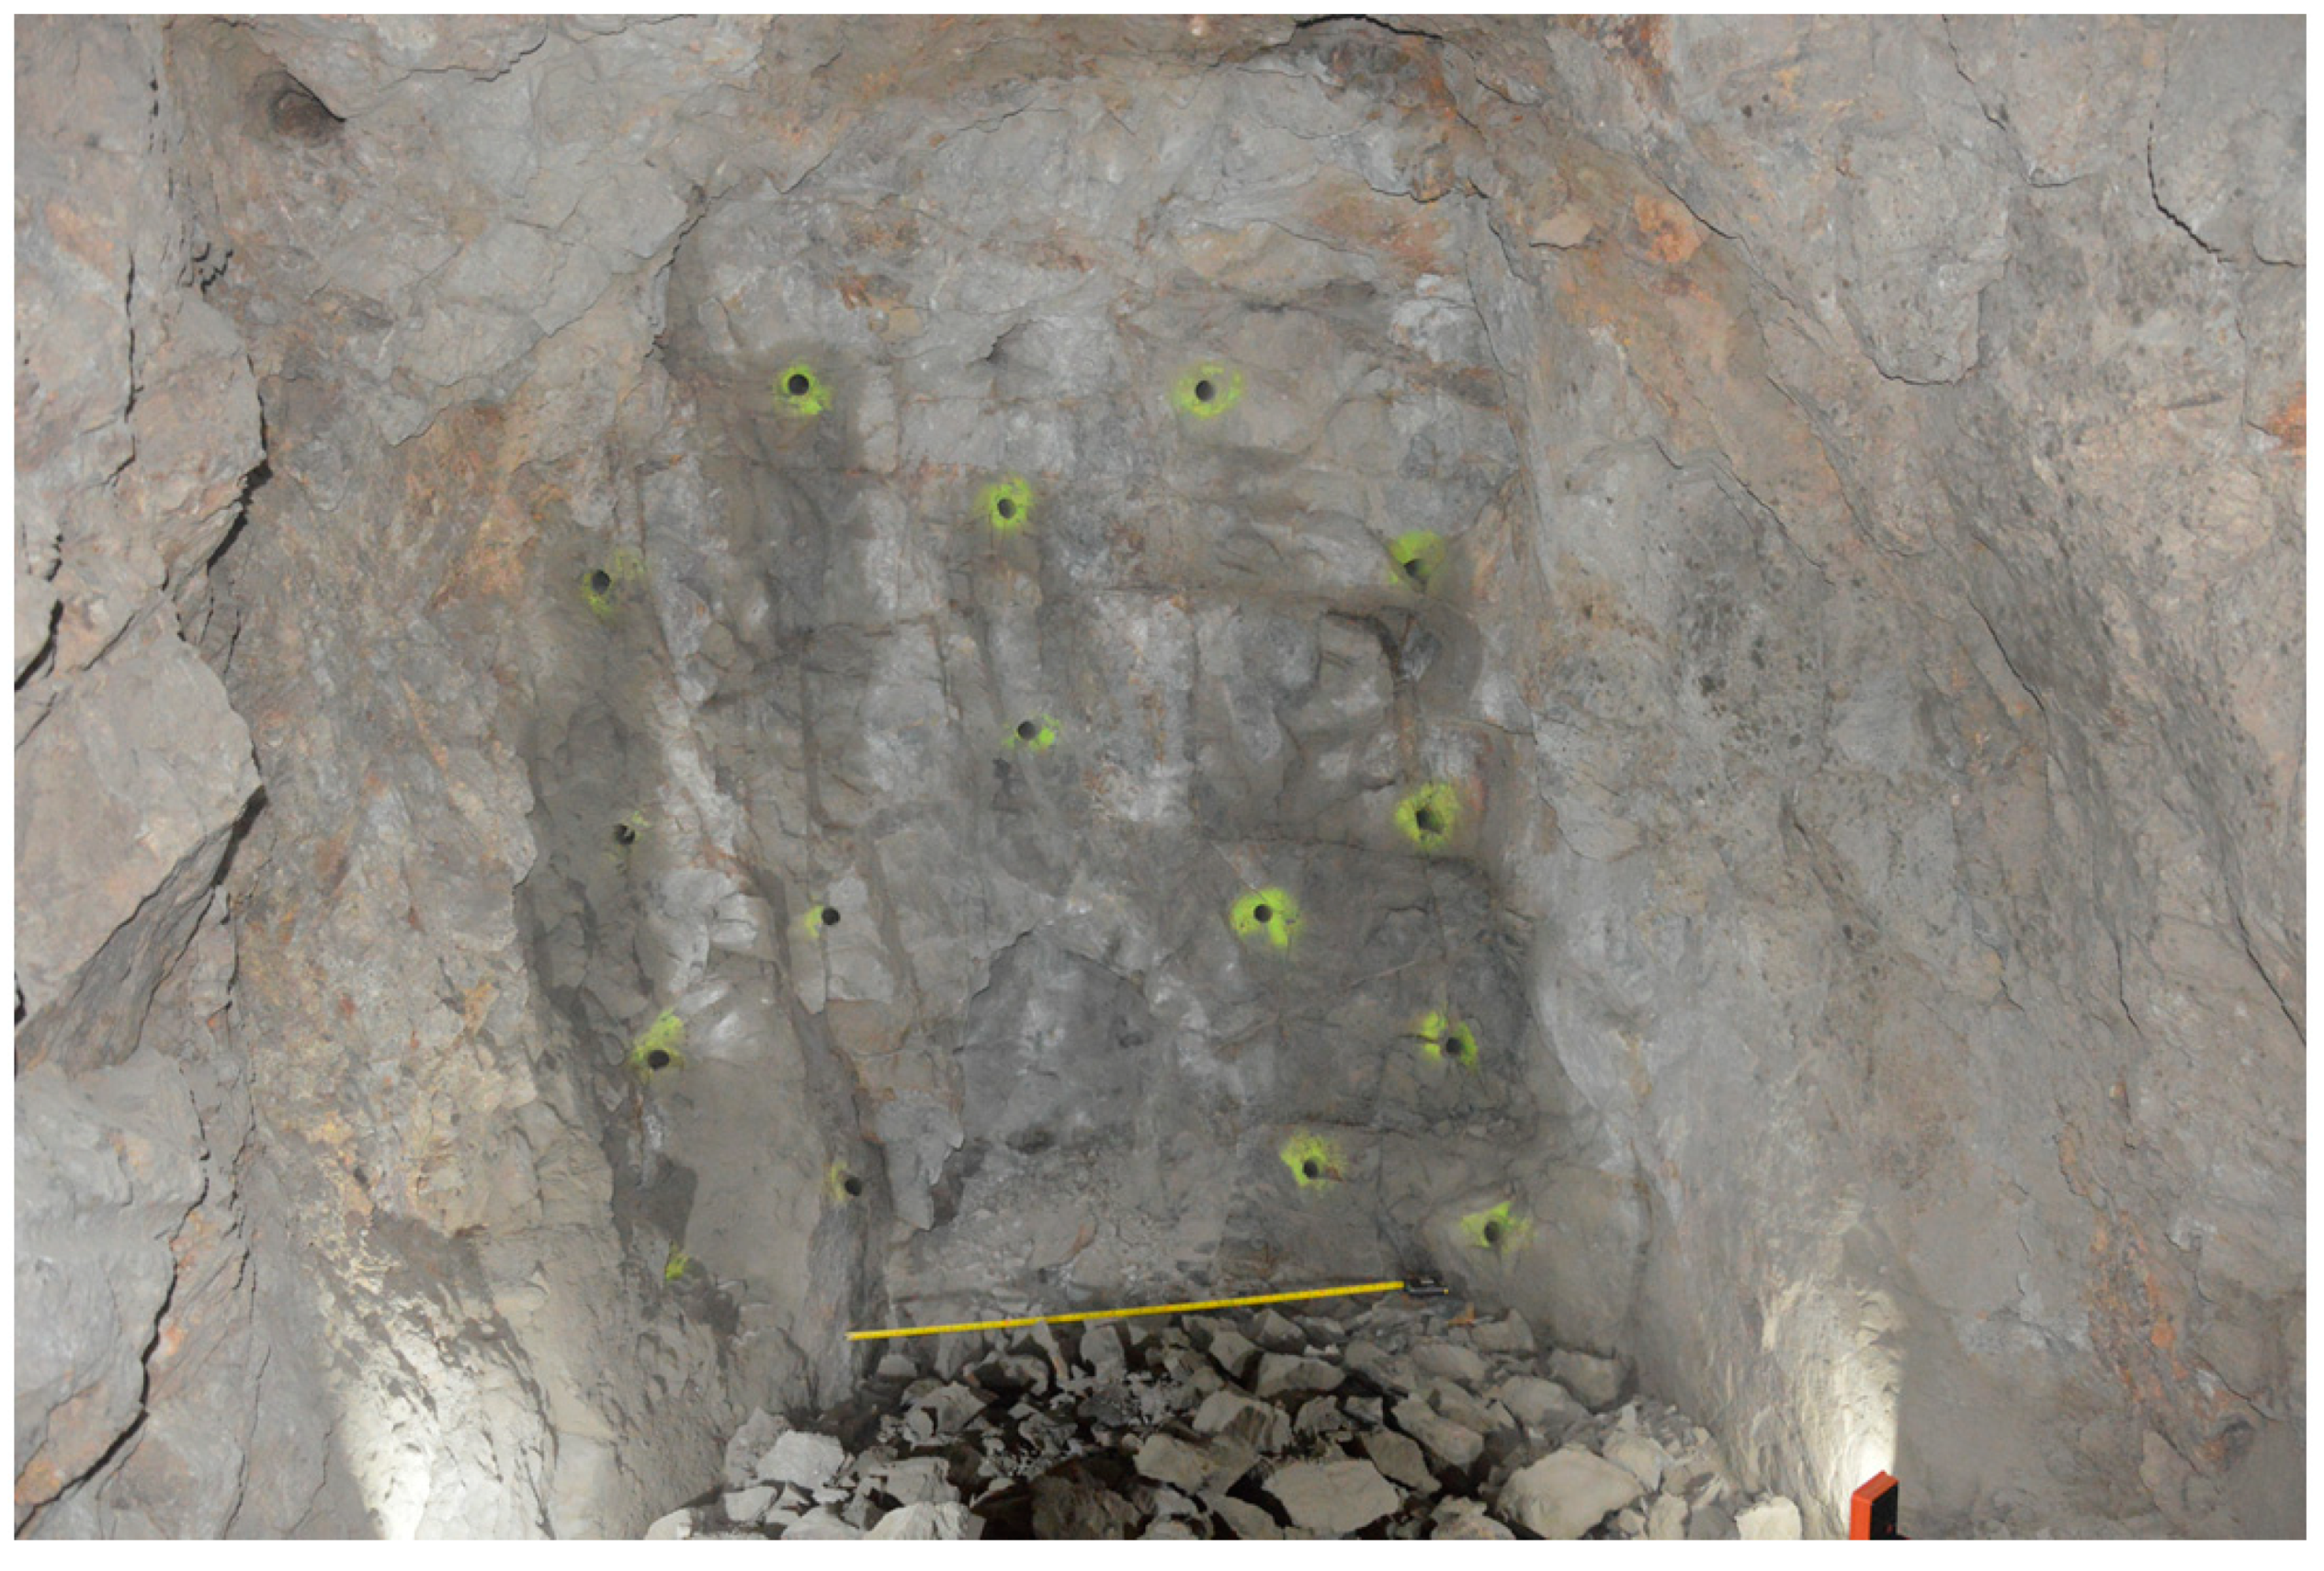
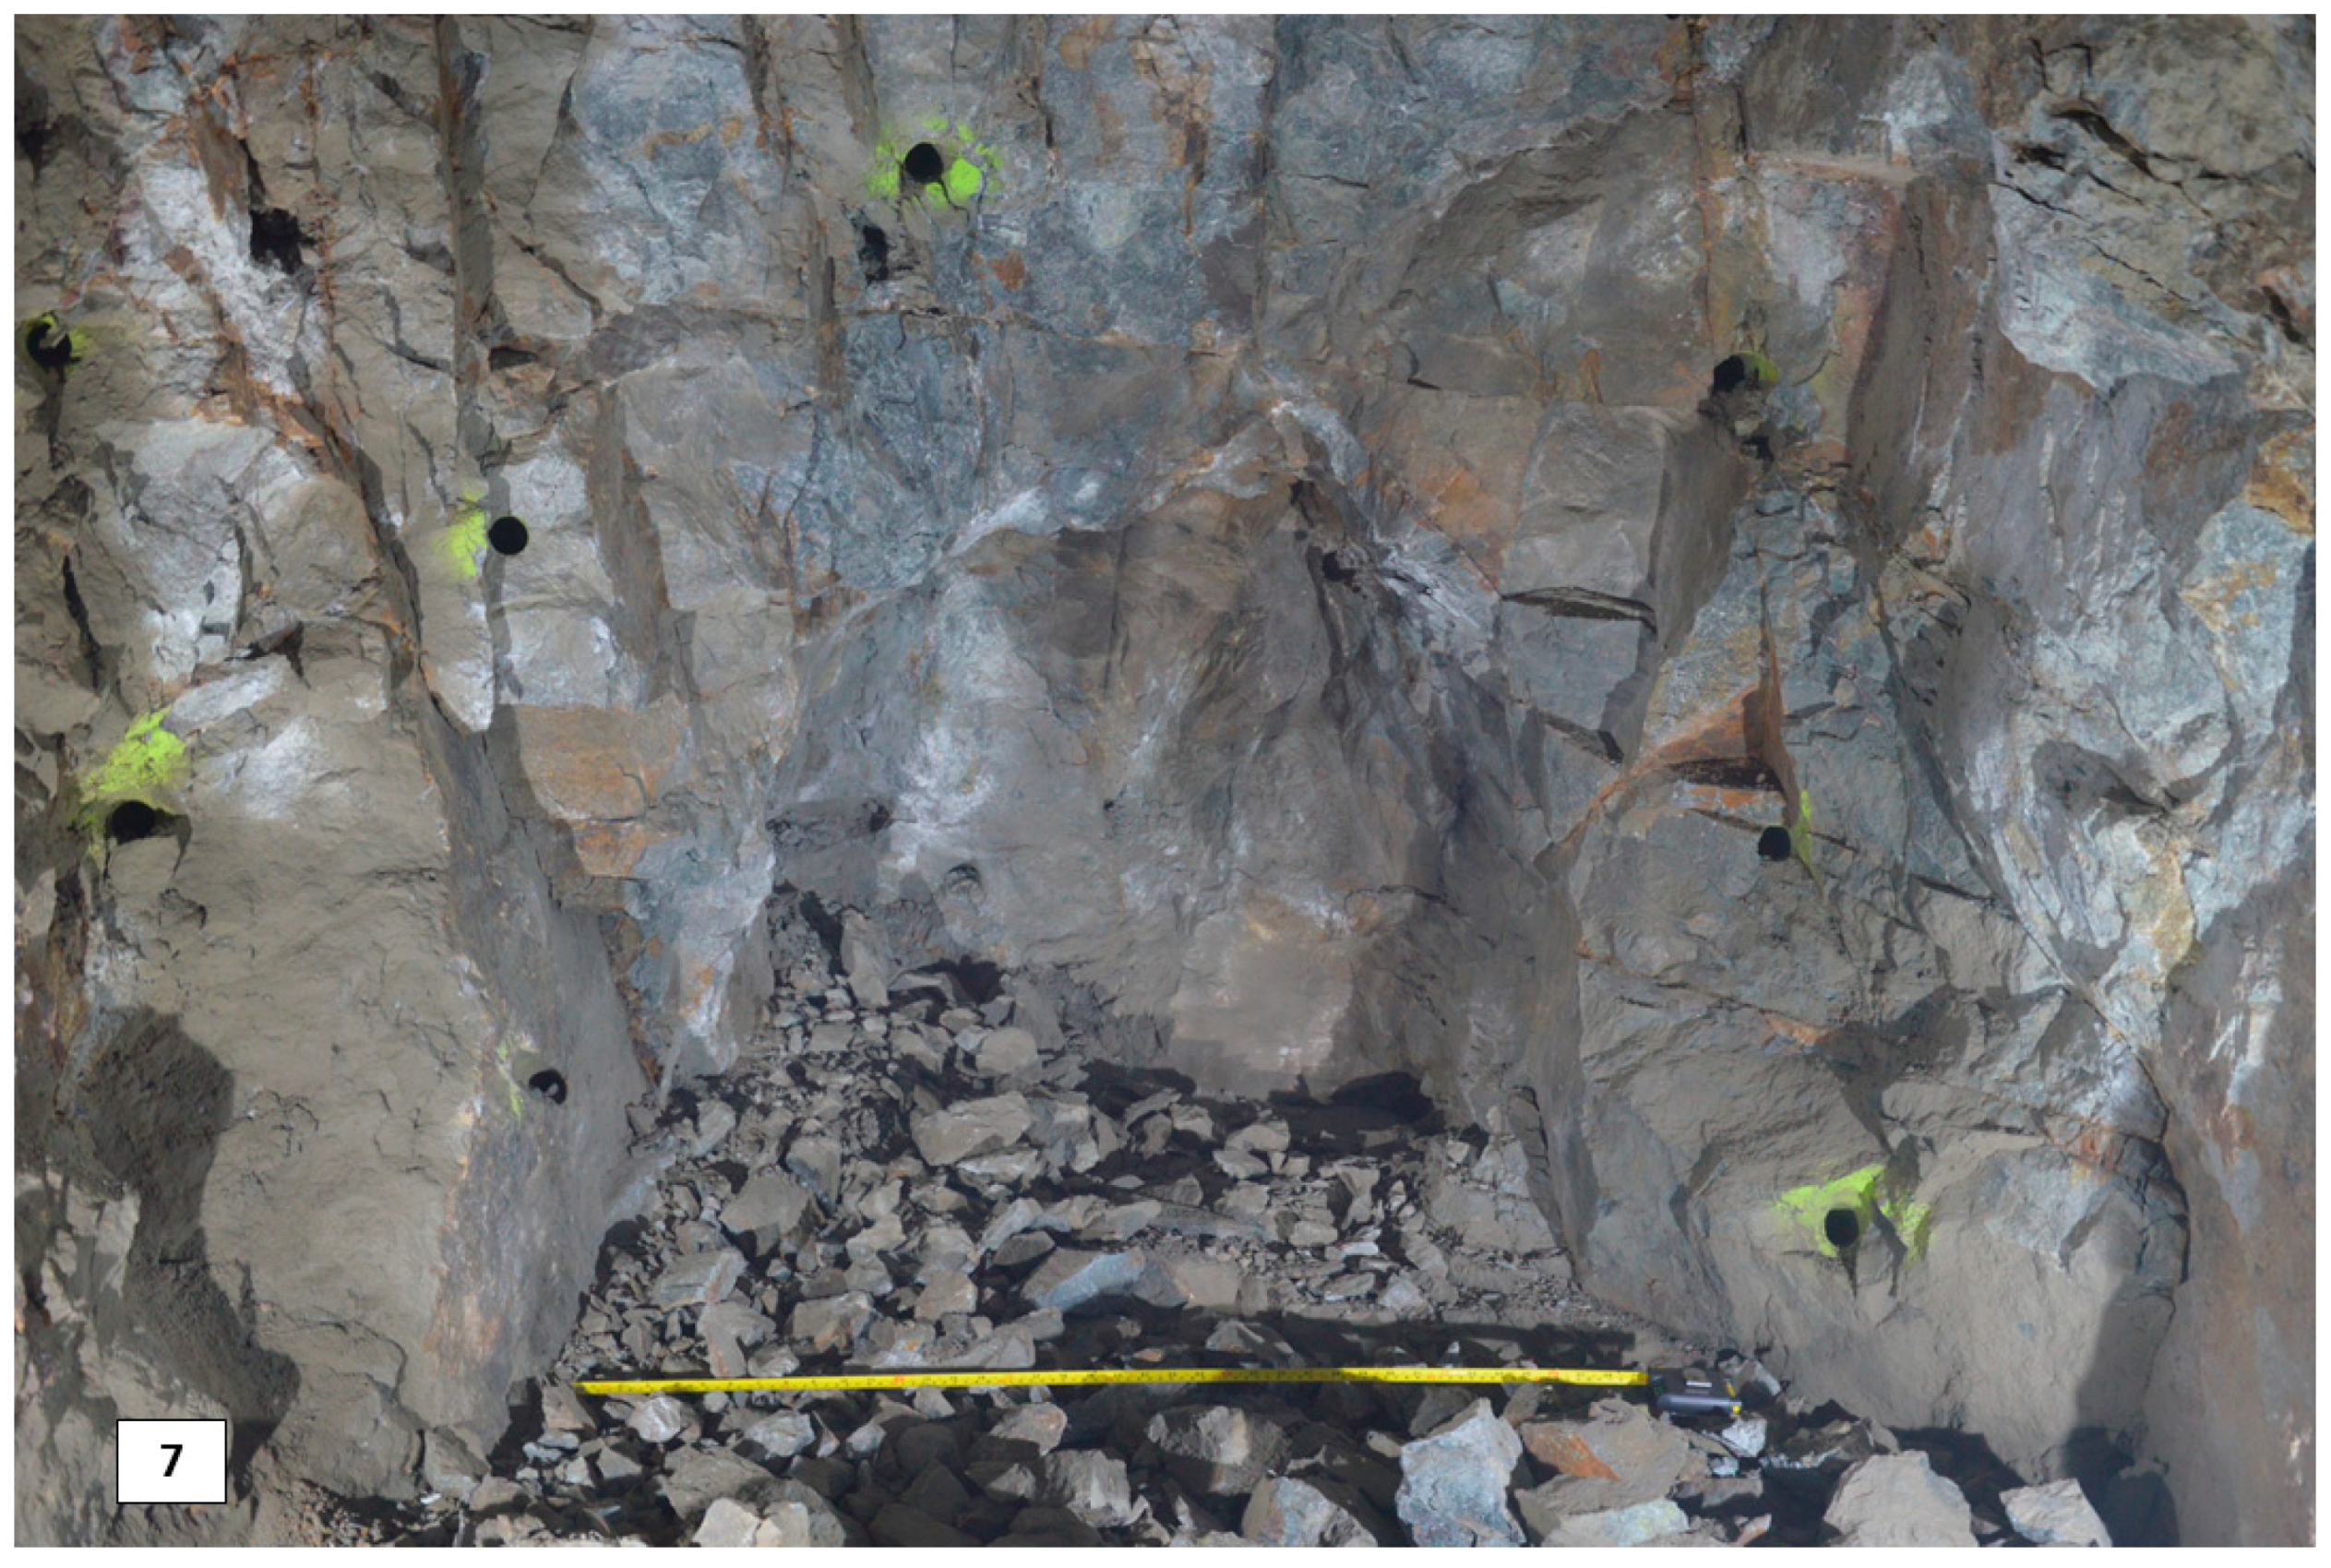
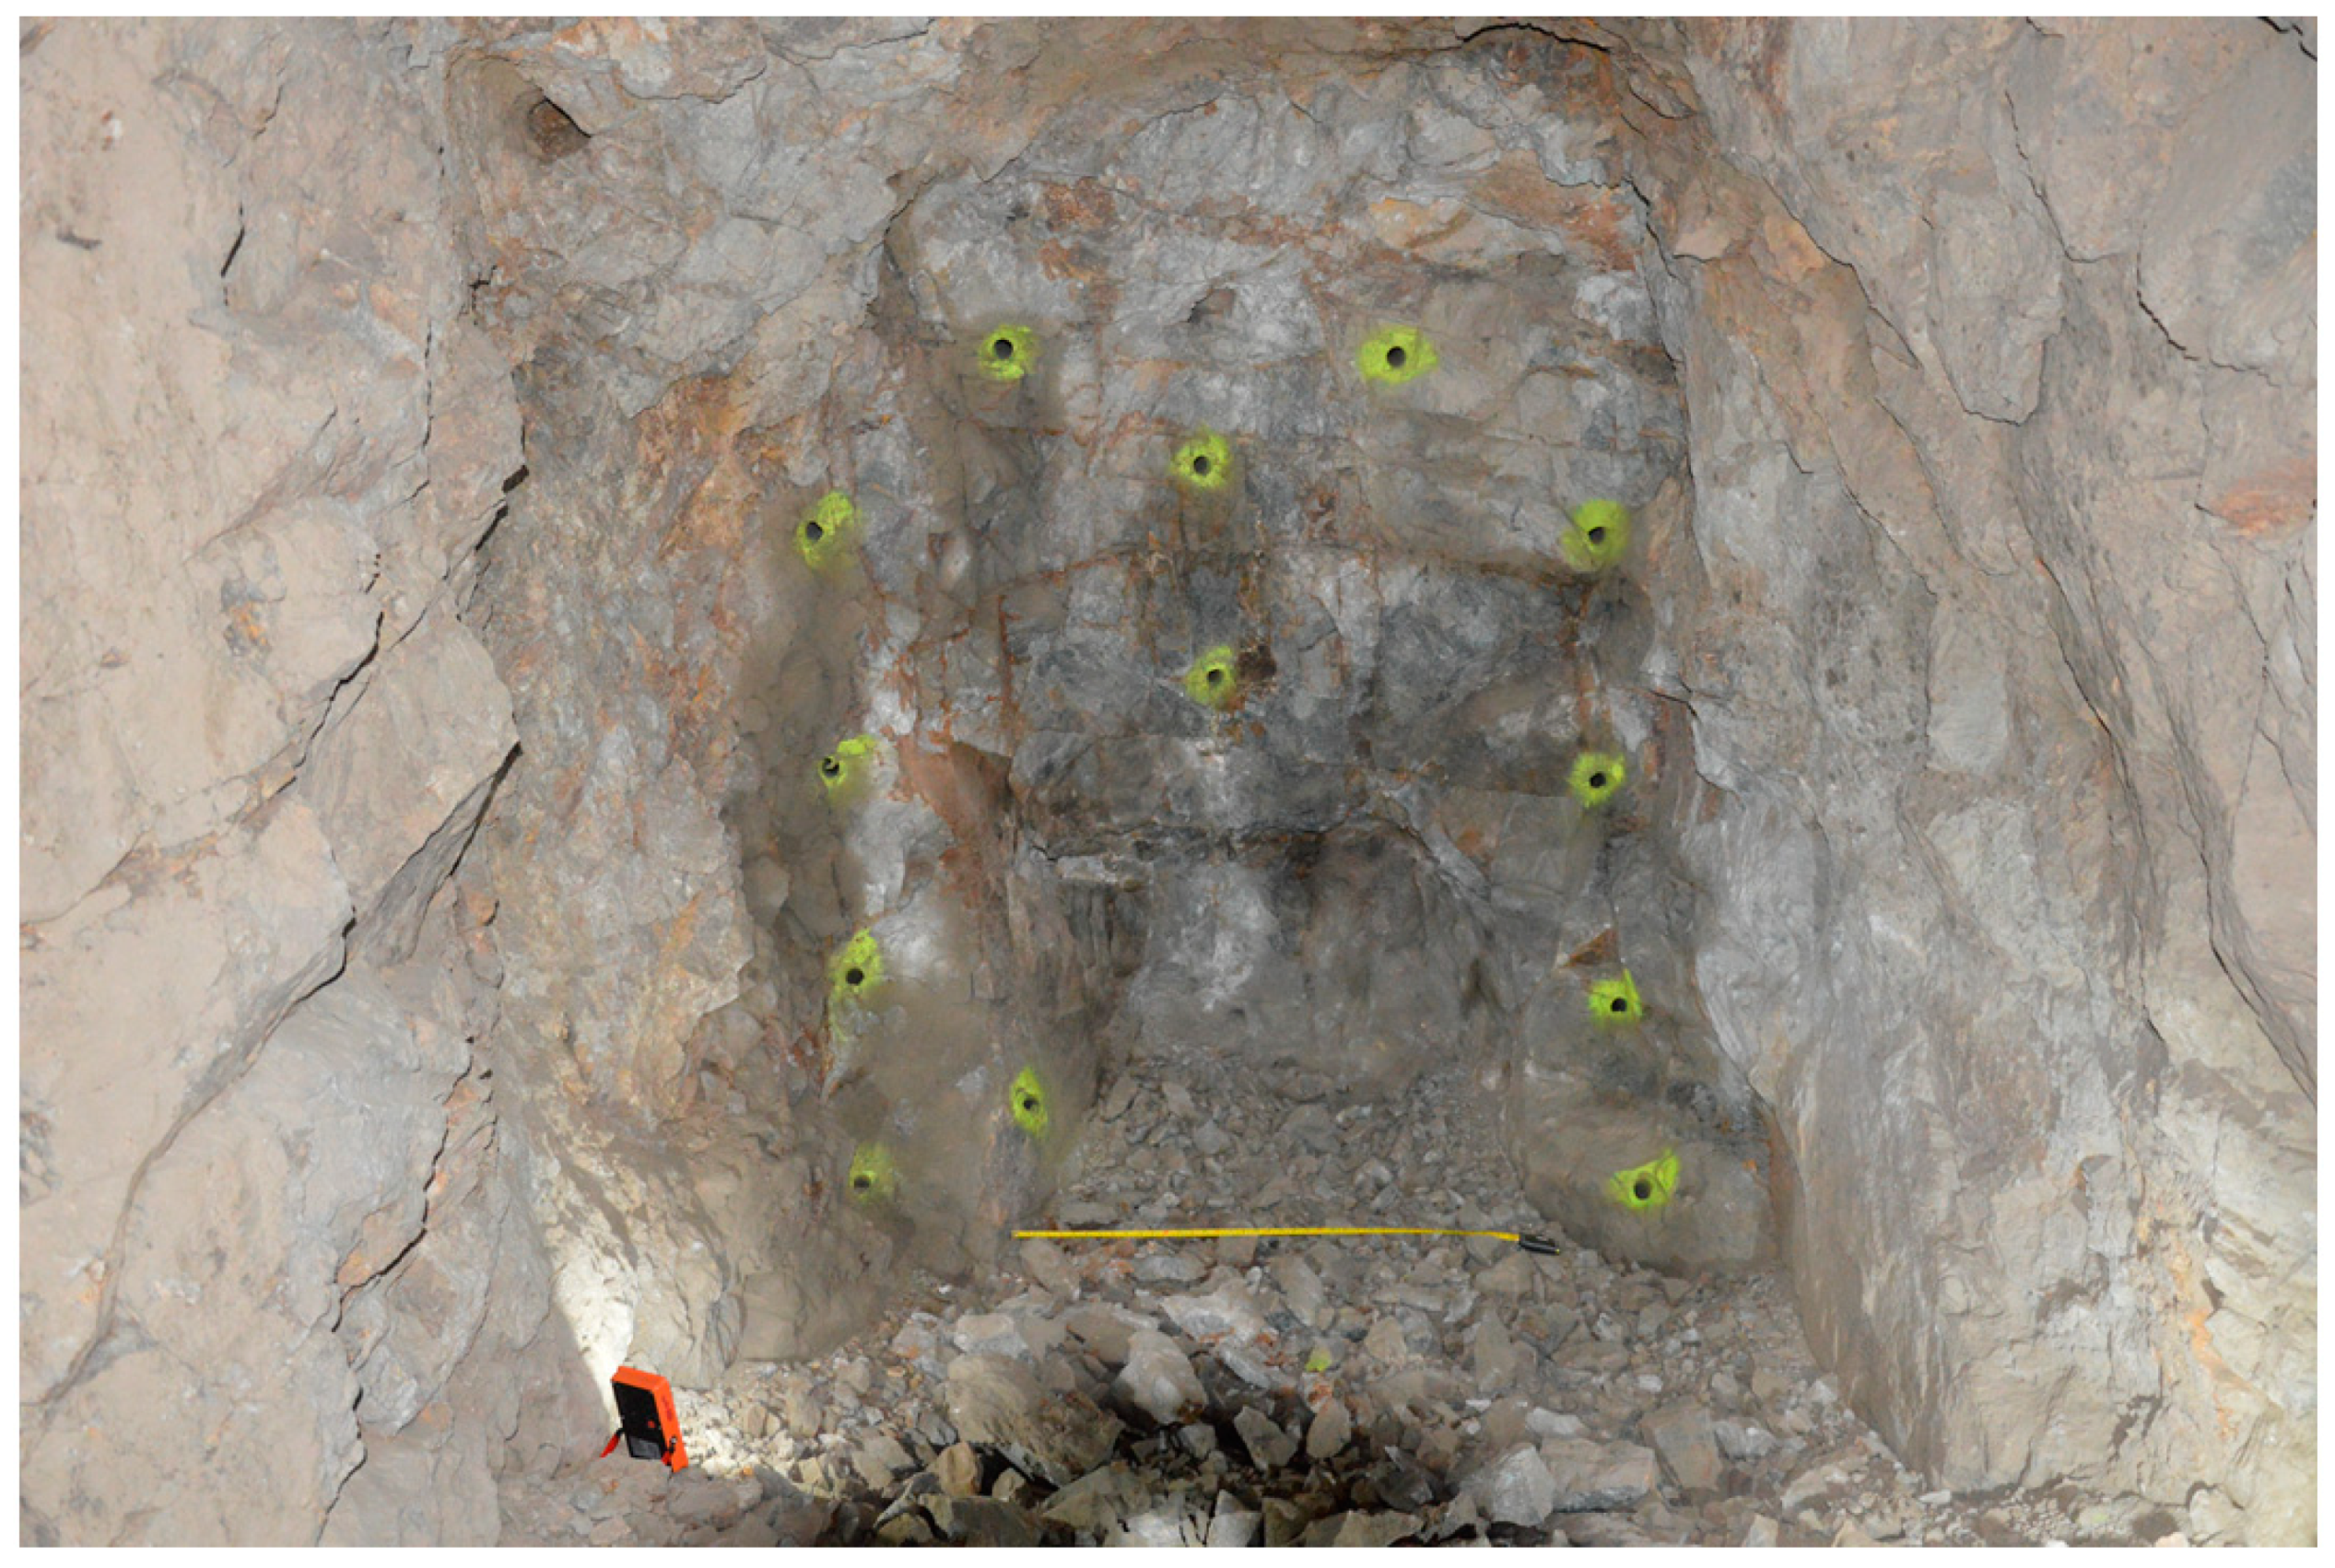
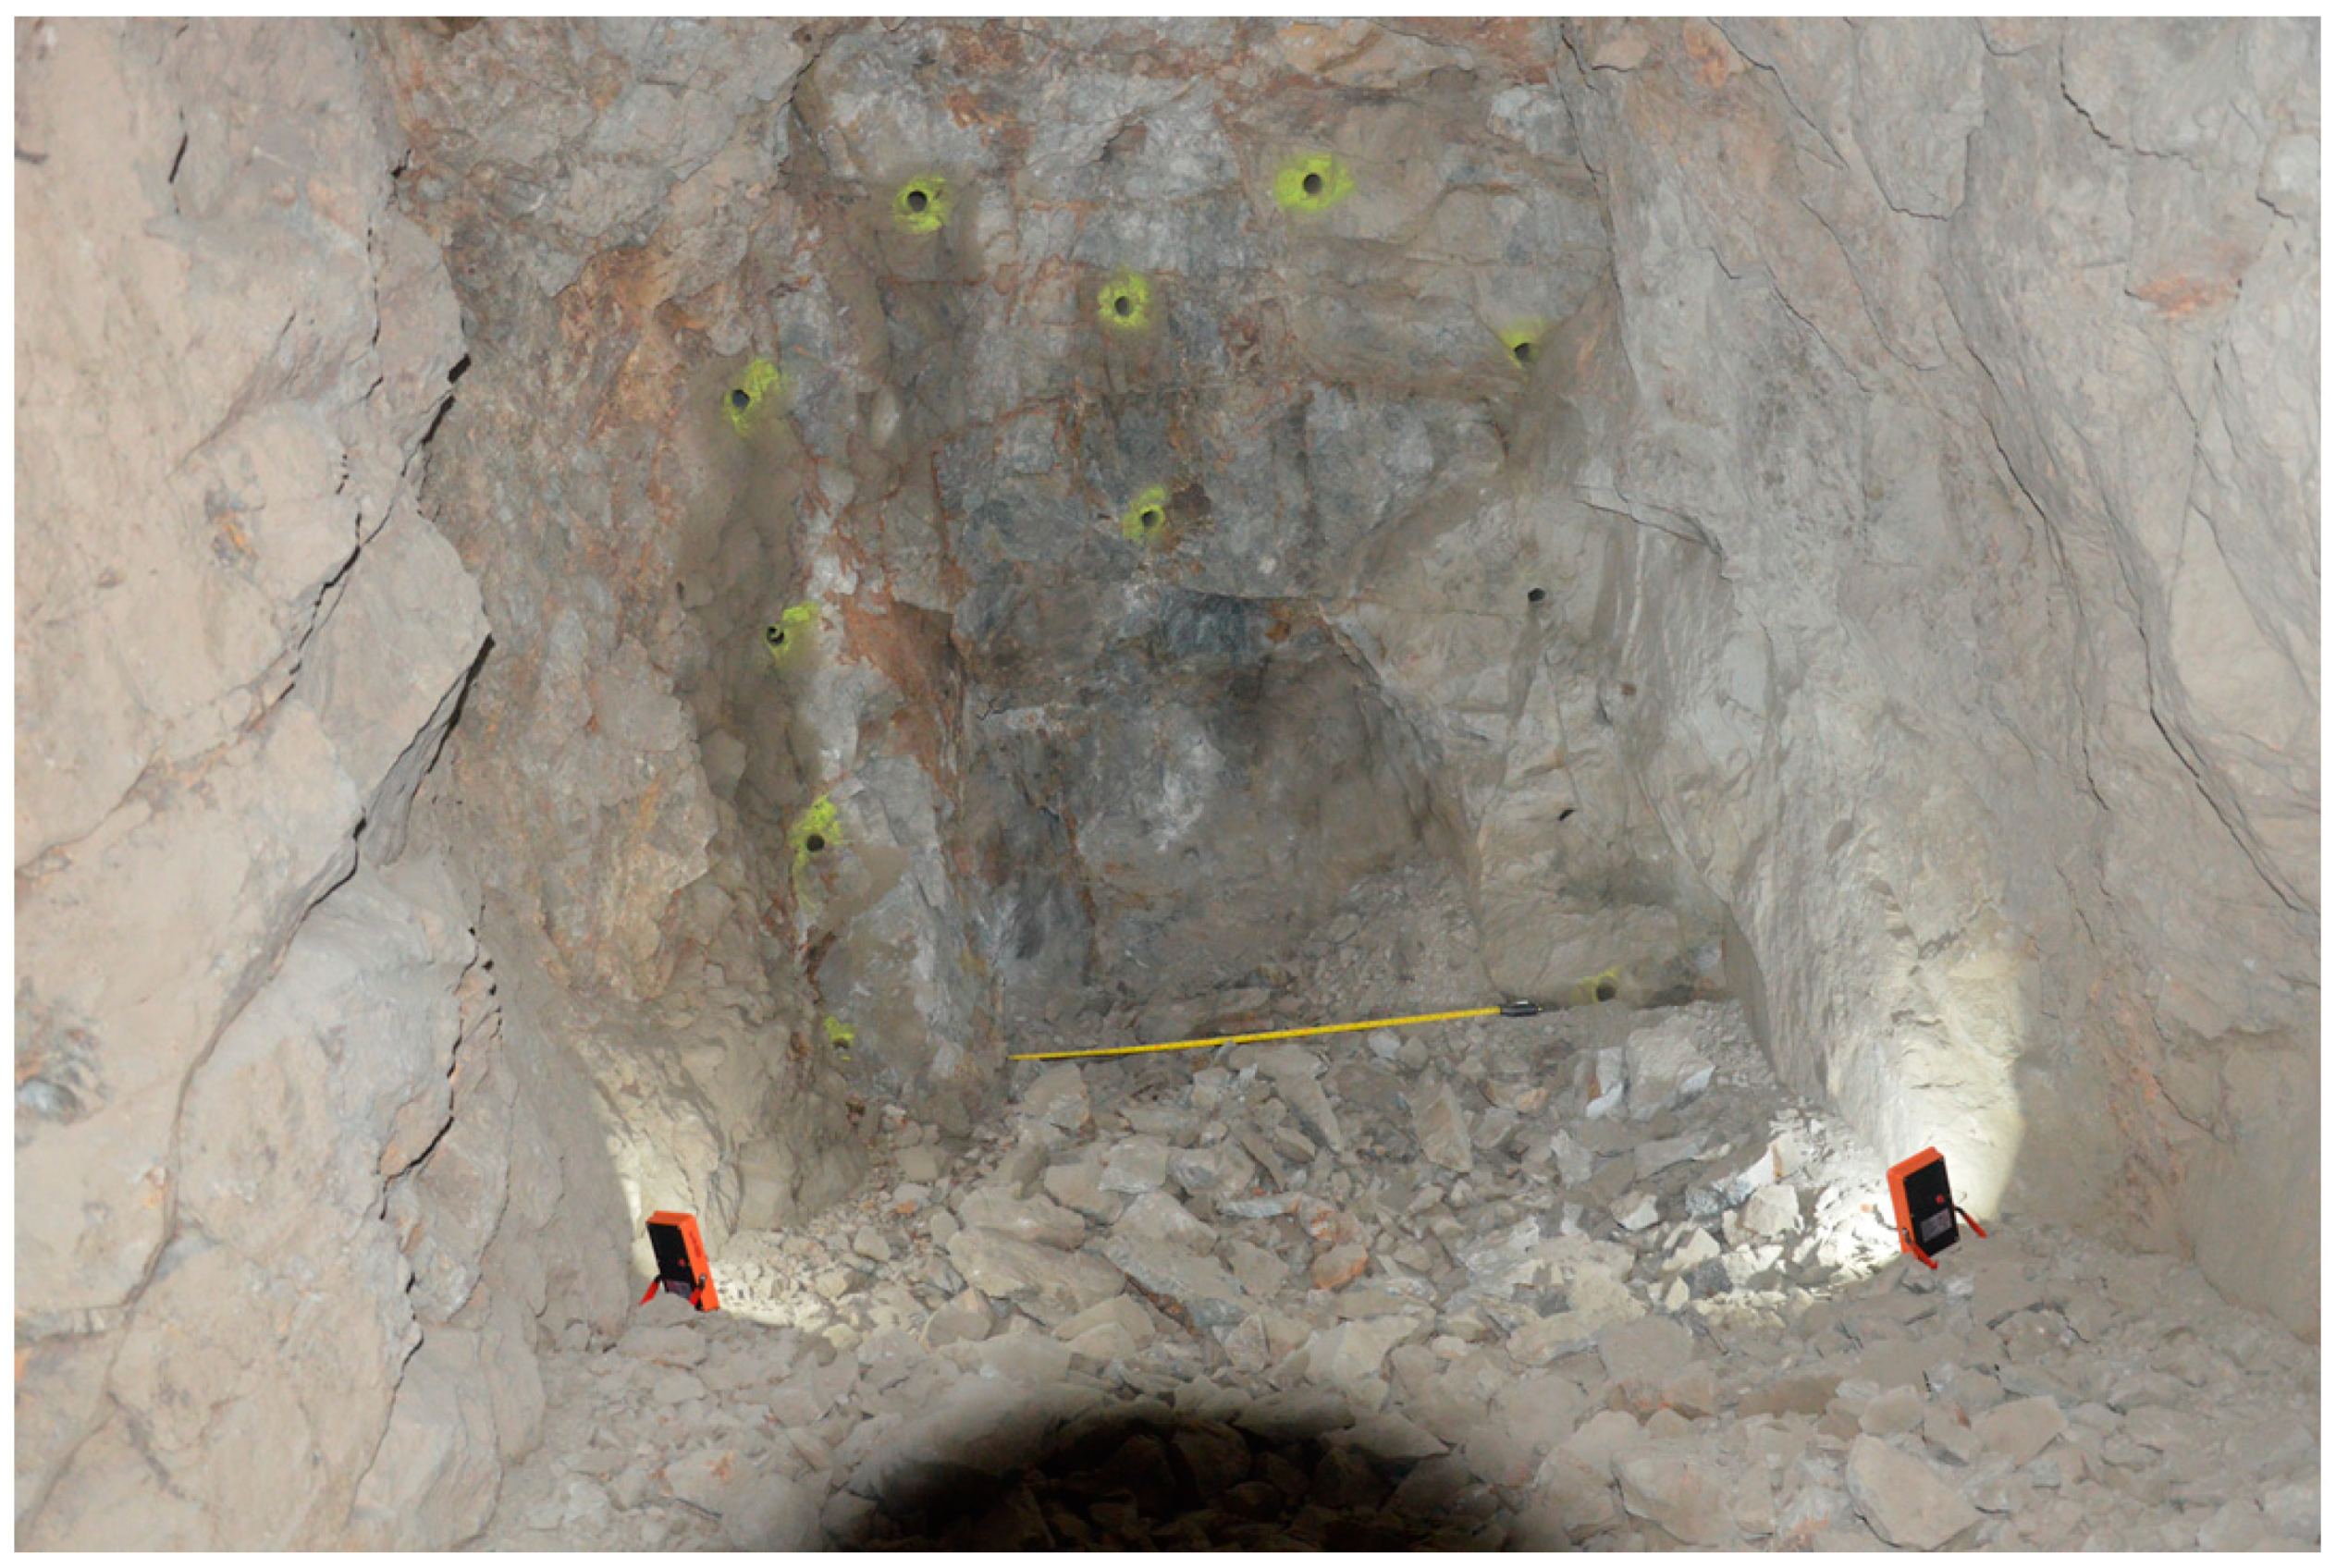
Figure 2 shows the evolution of the cavity formed by the holes of the opening cut, high resolution images of the cavities are reported in Appendix A. One can observe the following mechanism:
- Delay “0”: Detonation of the central hole of the burn cut. Due to the high confinement, the rock was fragmented but not ejected. A clean fracture was visible between the central hole and the dummy hole to its right.
- Delay 1: The detonation of this hole created the first visible cavity, which was a prism that joined the detonated hole with the dummy holes at the extremes of the burn cut. The angle of breakage of the prism was about 40 degrees.
- Delay 2: The created that prism that was ejected was wider and it joined the detonated hole with the extremes of the previous cavity. Confinement was reduced and the angle of the prism was about 60 degrees.
- Delays 3–9: The cavity was well defined and regularly increased in size for each hole. The angles of breakage of the prisms tended toward 90 degrees. A larger and larger free surface was available at each detonation, and confinement continued to decrease.
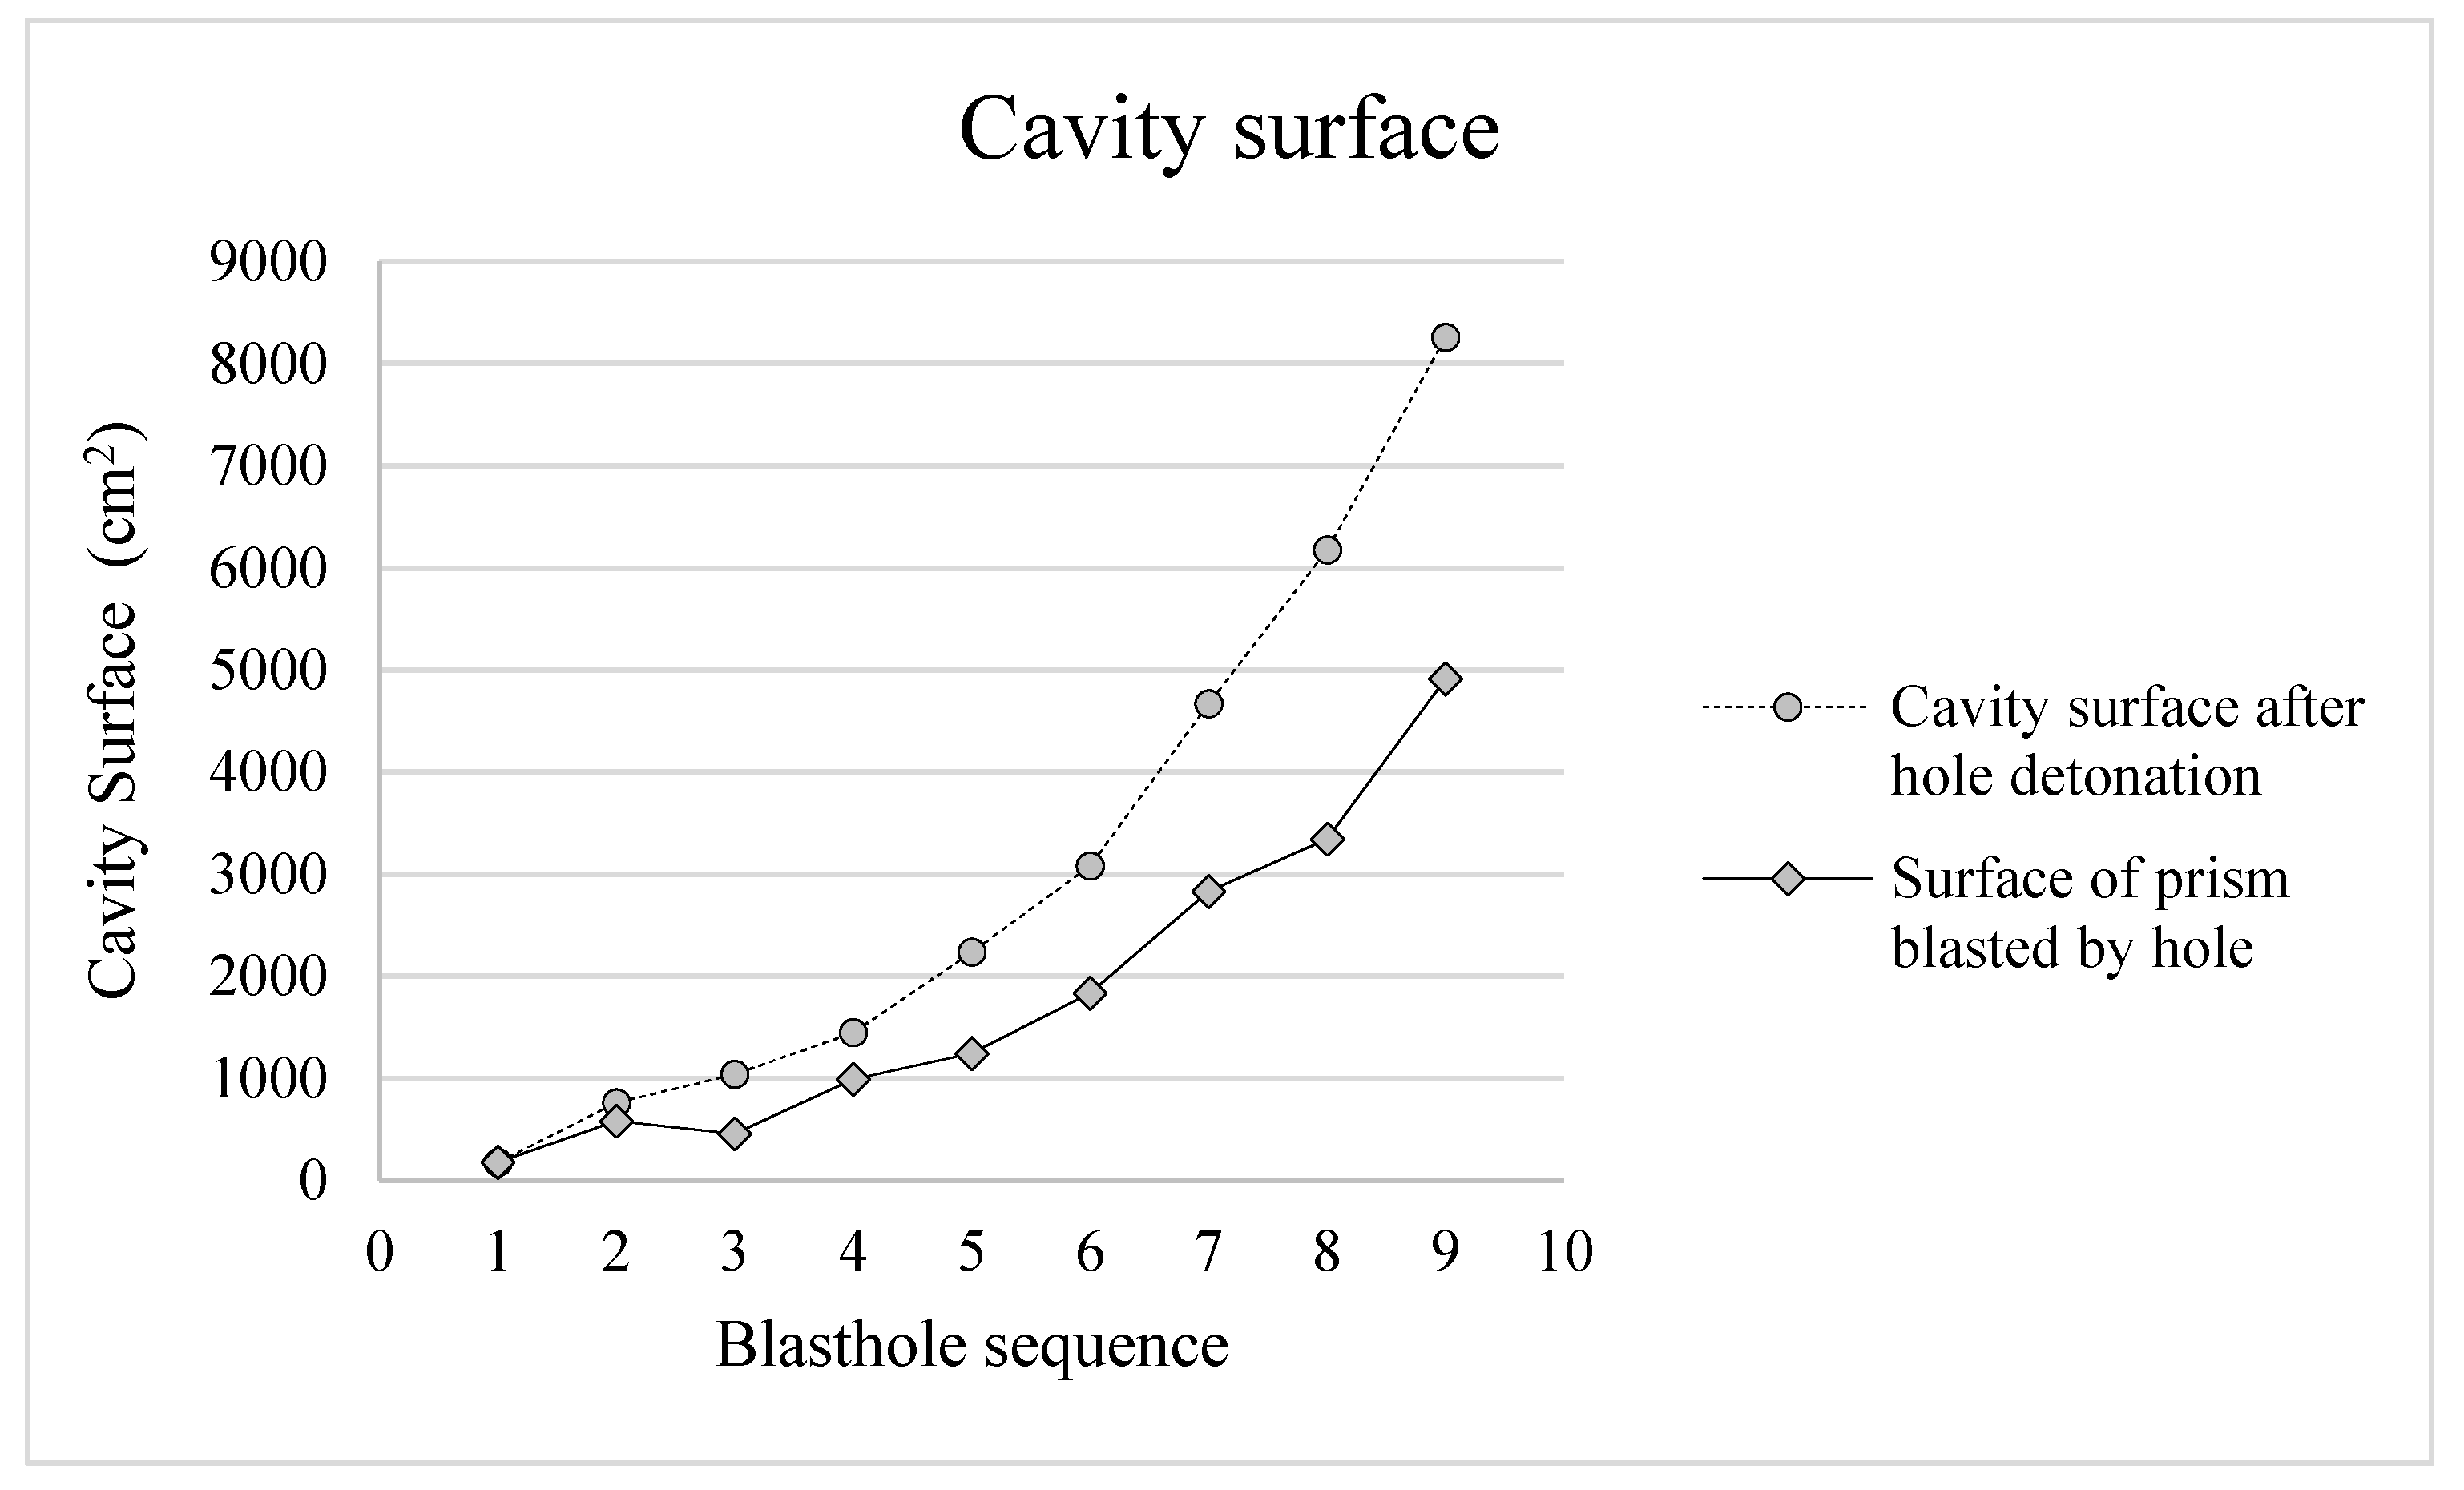
Although irregular, the cavities formed followed the mechanism of the ejection of prisms, at whose extremities lay the detonated hole and the extremes of the previously created free surface. The surface of each cavity created (corresponding to the surface of the prism ejected) was measured using software image analysis (Plot digitizer v. 2.6.8—Free Software Foundation, Inc., 59 Temple Place—Suite 330, Boston, MA 02111-1307, USA) via pictures with a scale metric reference. Results are shown in Figure 3, which plots the evolution of the surface of the cavity formed by each hole along the experiment.
Figure 3 shows the evolution of the surface of the cavity formed by each hole along the experiment. Such a section was the one measured on the cross-face of the tunnel, and when multiplied by the drill length, it gives the volume of the cavity. The dashed line indicates the total surface of the cavity after the detonation of each hole. The difference between the surface cavity measured after the detonation of hole n − 1 and the cavity measured after hole n gave the surface of the actual prism broken by hole n. Considerations regarding the burden as seen to be measurable on the drill pattern were neglected on purpose in order to focus on the real amount of rock broken by each hole, which was given by the surface of the actual prism ejected.
2.2. Shock Measurements and Image Analysis
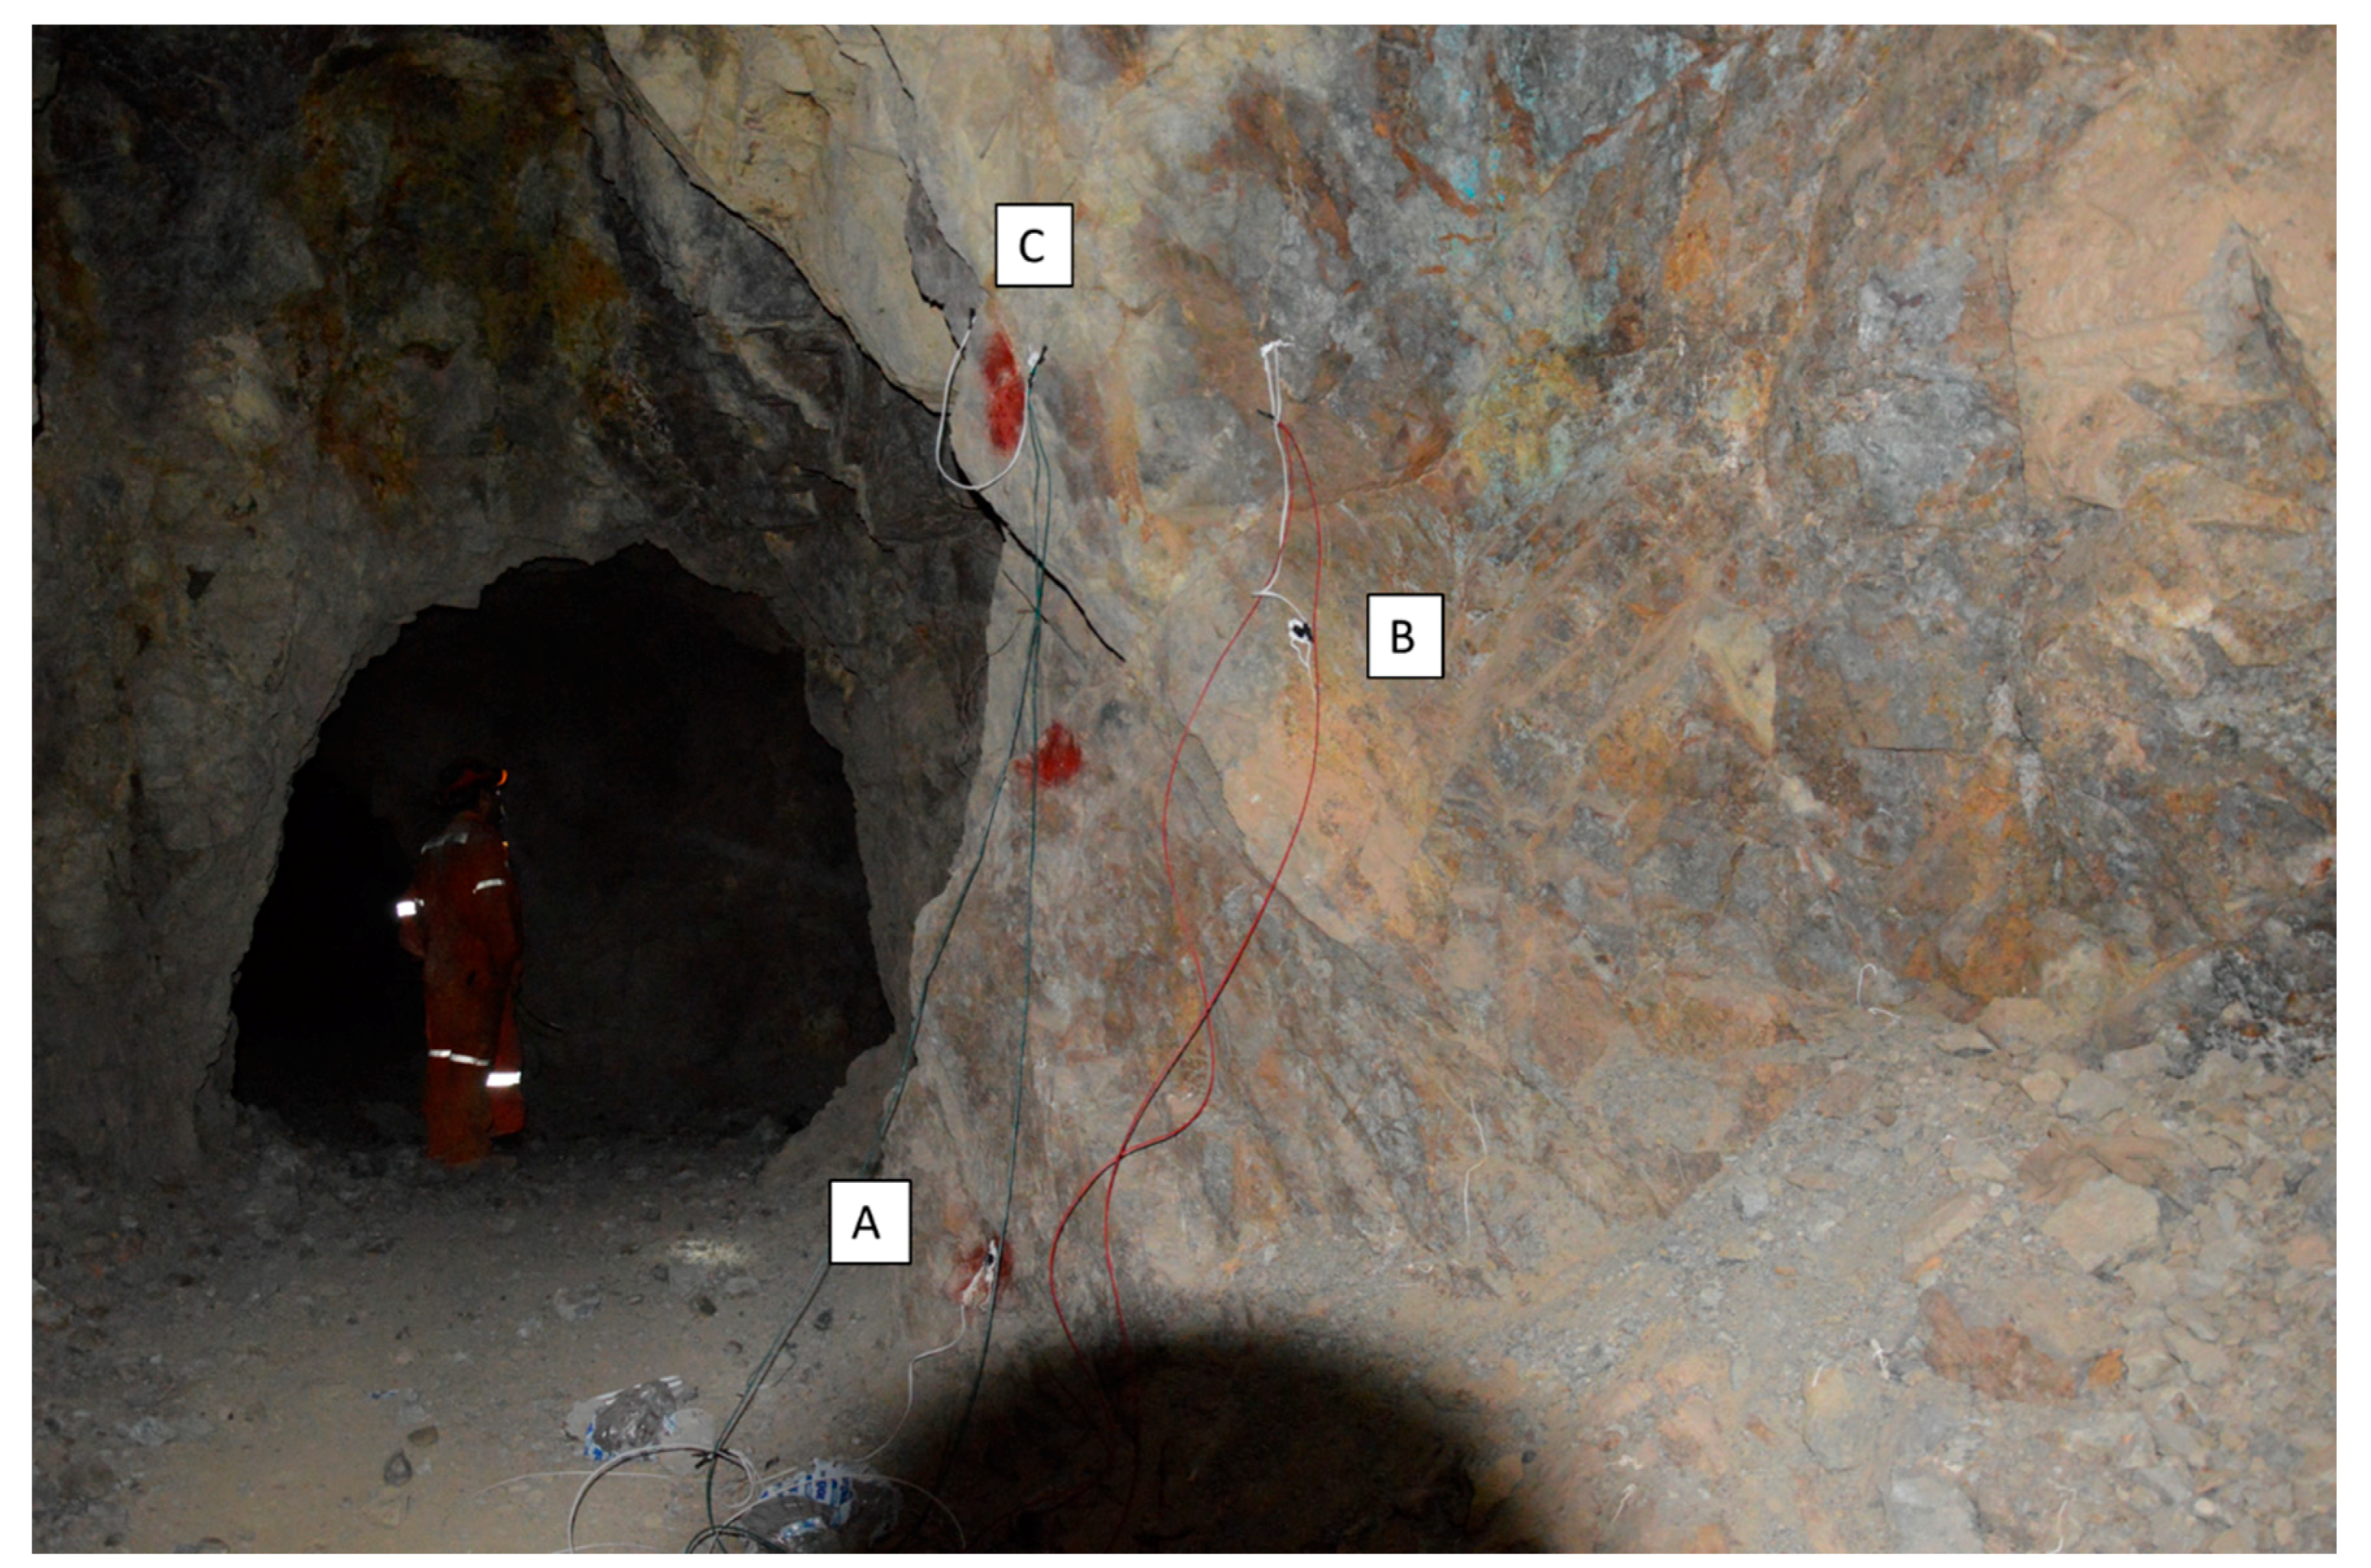
Shock measurements were realized using three low-cost, easy-to-install piezoelectric shock sensors. The sensors were installed as close as possible to the blast face, while taking the precaution of installing them around the first corner in order to avoid damage from projected fragments. Sensors were installed at three different heights, and on three different sets of joints of the rock mass, roughly perpendicular among themselves, as shown in Figure 4. One of the advantages of the shock sensors was their rather low sensitivity and therefore the capability to capture a signal at a very high amplitude, avoiding the kind problems related to the saturation of the recording device. The adopted sensors were verified with a rather accurate response in the frequency range between 5 and 500 Hz, which was suitable for the vibration blasting recording. The average sensitivity of the sensor was approximately in the range of 10–15 mV/mm∙s.
The choice to use shock sensors was made in order to operate with low-cost, easy to install equipment. With the sensors being close (less than 10 m) to the blast, using easily replaceable measuring equipment would pose no problems in the case of being struck by ricocheting fragments coming from the blast. Future research is planned using blasting geophones.
2.3. Vibration Data Processing
The processing of vibration data involved the following steps:
- Signal shift correction: this procedure involved the subtraction from the signal amplitudes of a constant value to remove the constant shift; basically, the value to be subtracted was the arithmetic average of the amplitude signal calculated over the whole signal duration.
- Peak analysis (positive and negative) and peak-to-peak analysis: we only considered the maximum and minimum relative values.
- Duration of the oscillation: this analysis considered only the first part of the signal and skipped the low-frequency latter part of the signal that is often affected by wow noise, where wow noise is an inherent, nonlinear electromagnetic interference of the signal that must be filtered out.
- The frequency analysis was performed according to the Hilbert–Huang transform, as described in the following section.
Figure 5 shows a typical reading of the response of a shock sensor. The values considered, being the voltage peak and the duration of the oscillation, are highlighted. The duration of the oscillation was measured by filtering out the noise that was readable after the clean waveform of the real shock oscillation.
The signal processing technique for blasting was focused on the analysis of the energetic content of the signal; this can be related to the amount of kinetic energy that is released during the blasting, and in particular, this deals with the fraction of energy that is converted into elastic energy. The energy propagates within the rock mass according to seismic wave propagation in several forms (basically P-waves, S-waves, and Rayleigh waves). The Hilbert–Huang transform (HHT) has been recently developed by Huang et al. [21,22,23]. The data processing involves a new signal analysis technique based on the decomposition of a signal in terms of the empirical modes and on their representation. It consists of two parts: empirical mode decomposition (EMD) and Hilbert spectral analysis (HSA). The EMD adaptively decomposes the recorded signal to separate it into its own characteristic oscillations, where each of them is defined in a narrow-banded frequency range. This process is based on the direct extraction of energy associated with various intrinsic time scales. In the second step, the Hilbert transformation (HT) is applied to each of the decomposed oscillations, providing the amplitude spectra with the analysis of the instantaneous frequencies. The Hilbert spectra are not conditioned by constraints compared to other conventional signal processing techniques when defining a more precise representation of particular events in time–frequency space, and also provide a more physically suitable interpretation of the dynamic processes. A description of the method, including a more detailed mathematical background, is given in Huang et al. [22].
3. Results
Figure 8 shows the peak voltage measurements from each sensor, along with the duration of the oscillations. One notes that sensor C systematically measured a lower peak voltage but a longer duration of the oscillations with respect to the other two. This aspect will be addressed below.
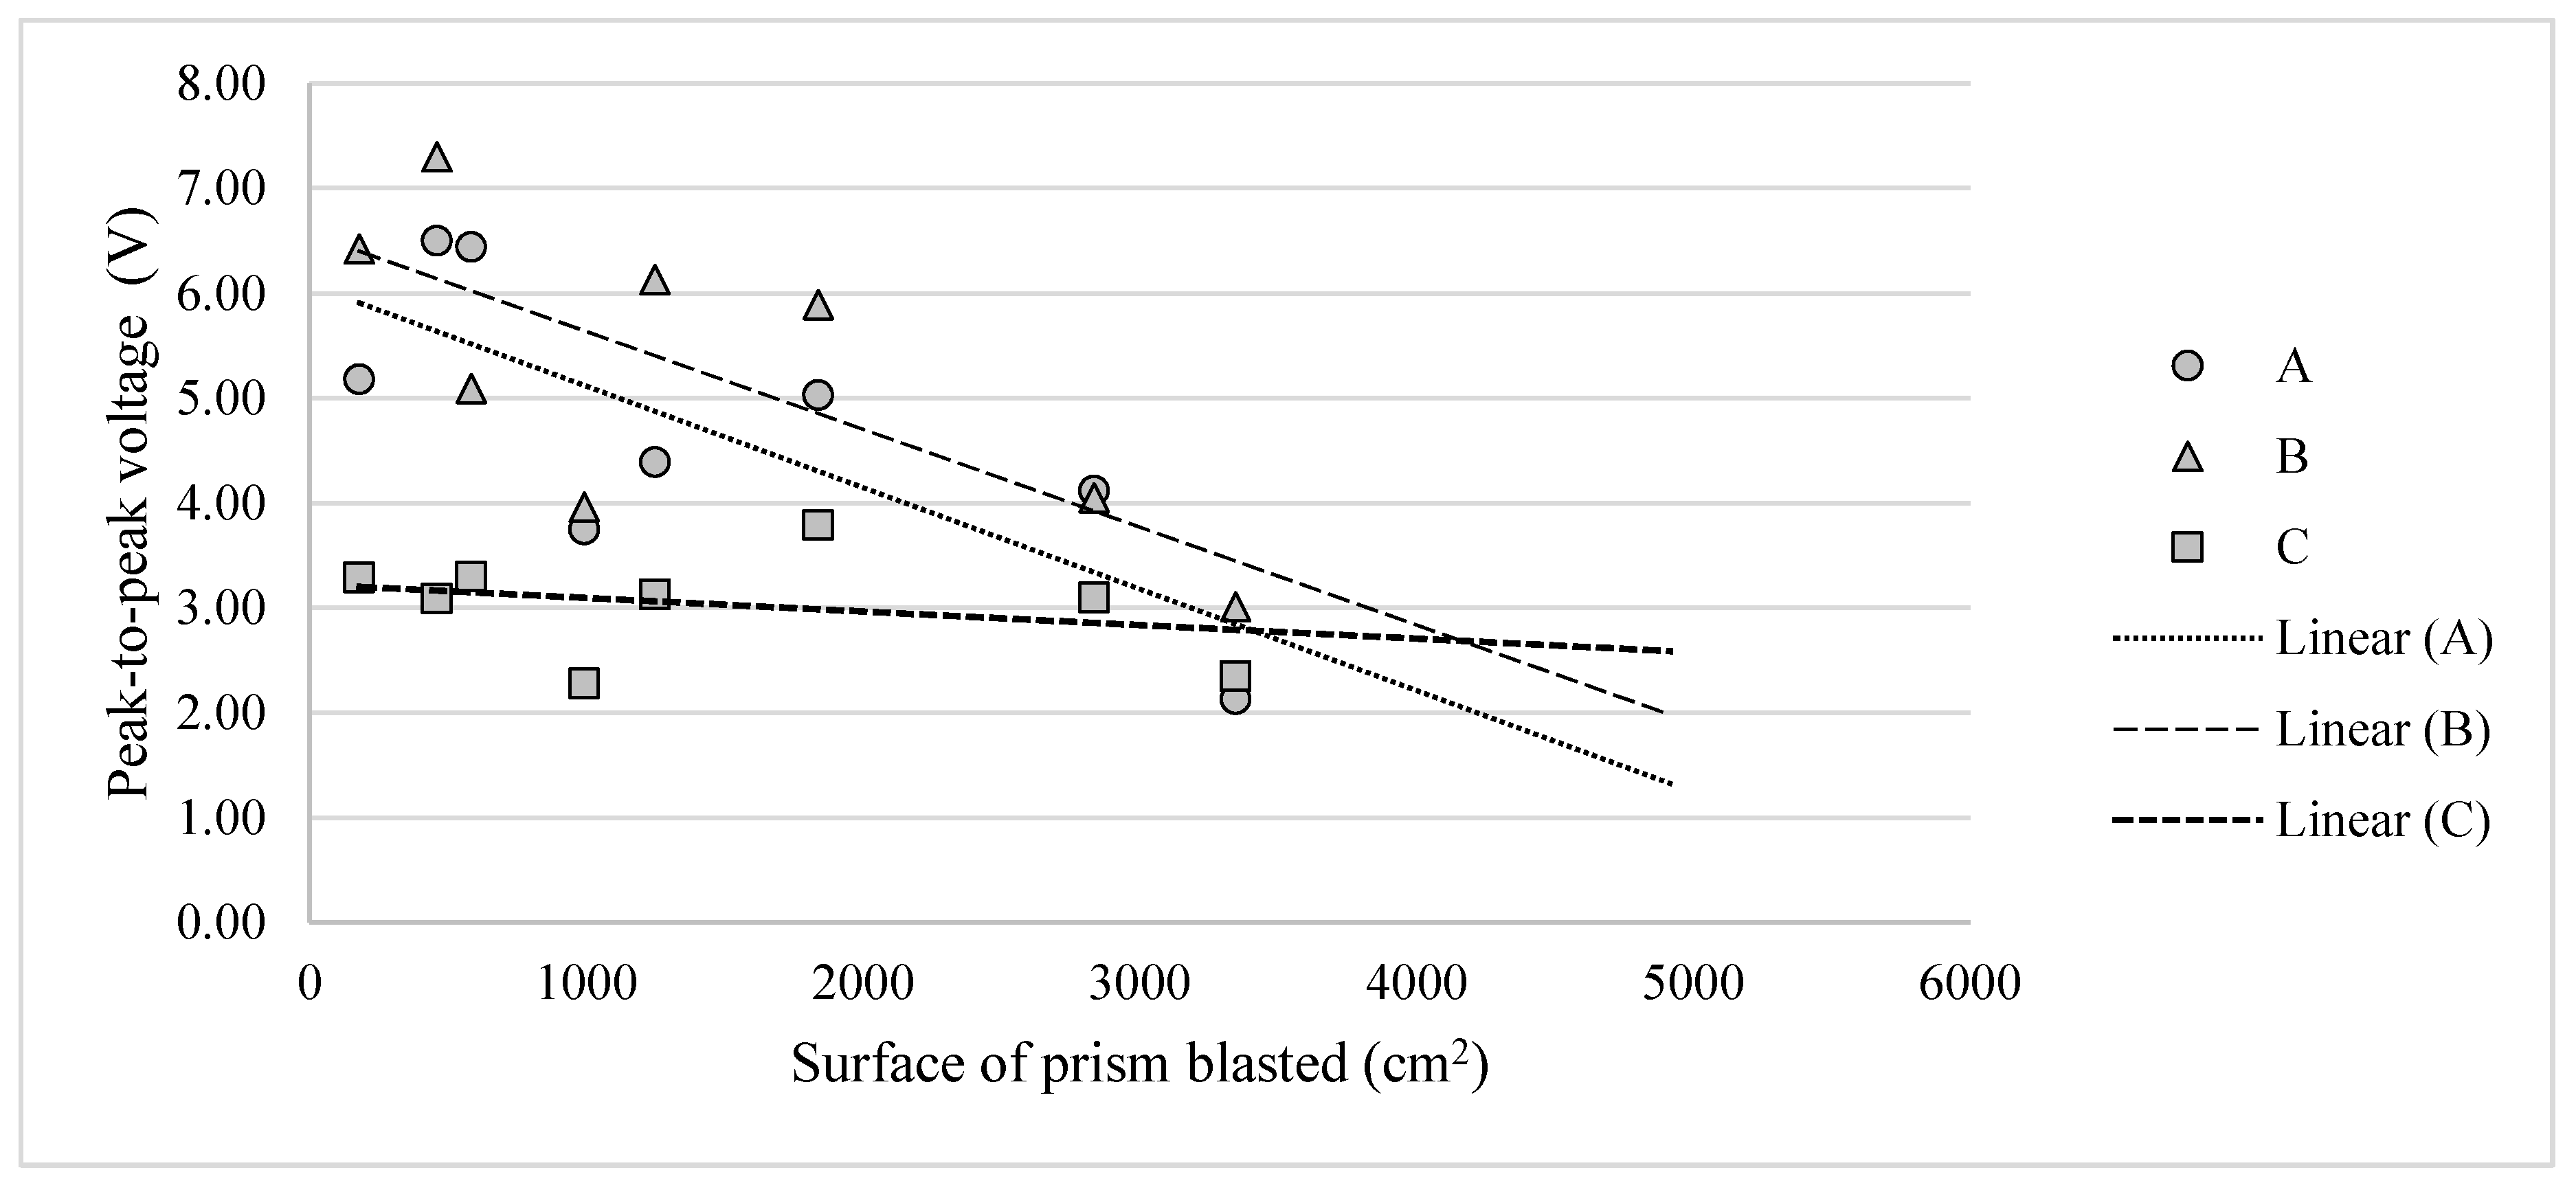
Figure 9 shows the evolution of the peak voltage measured by the shock sensors at the increase of the cavity opening. It is evident that there was a decrease of shock voltage with an increase of the available free surfaces. Nevertheless, sensor C showed a shock behavior that was drastically different from the other two. To consider the combined effect oscillation voltage and the duration of the oscillations, the voltage can be integrated along the duration of the oscillations:
where the energy E is proportional to the integral of the square of the detected voltage (V).
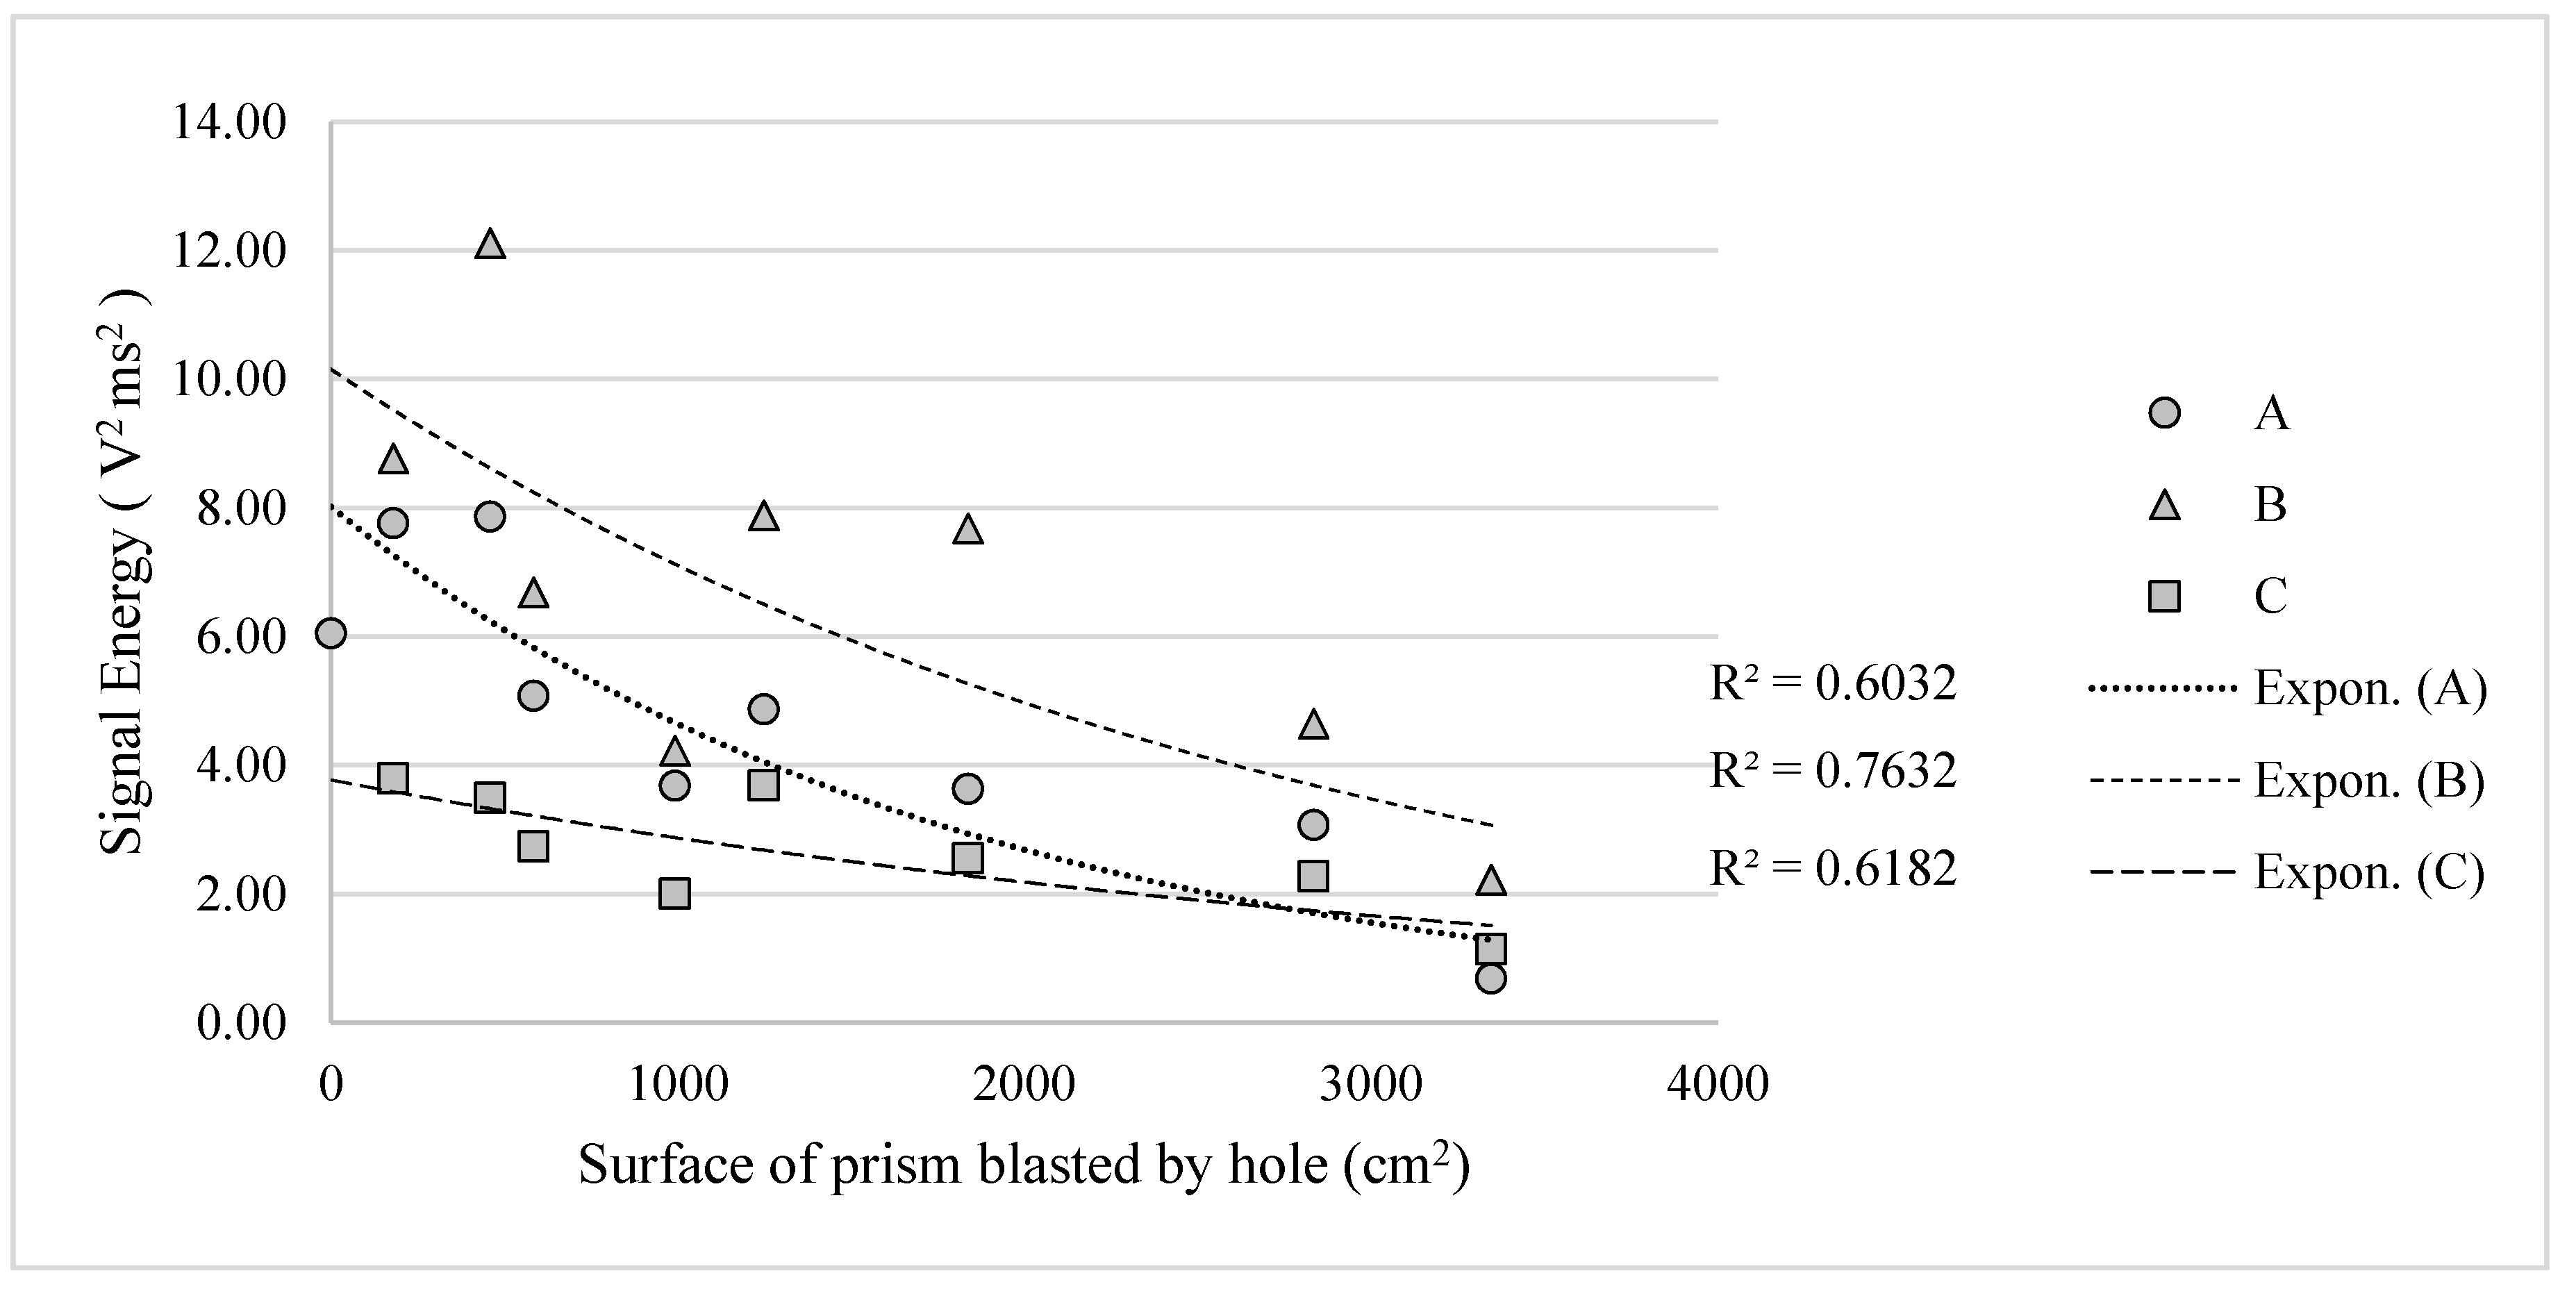
Equation (1) gives the value of shock energy. Figure 10 shows the energy plotted against the surface of the blasted prism of each hole. In this case, the disparity between the measurements of sensor C versus the other two sensors disappeared; by combining the displacement component and the time component of the shock measurement, it normalized the behavior of the sensors’ responses. It is still visible that there was a clear reduction of shock with an increase of the available free surface. It must be noted that Figure 9 and Figure 10 show only eight measurements out of the ten blasted holes. This is because the first hole in the burn cut did not generate a visible cavity (the rock was not ejected), and the last measurement registered outlying values, probably due to fragments ricocheting and hitting the rock in proximity to the sensors, exciting them out of scale.
4. Discussion
The experiment regarding the evolution of a tunnel cut known as a “burn cut” has been performed with the intention to provide high-definition photographic documentation of the evolution of the cavity of the cut and to evaluate the reduction of confinement by measuring the shock energy transferred to the rock mass. Pictures are shown in the paper and attached in a larger size at the end of the document.
The shock measurements were performed with low-cost, easy-to-install sensors. Farnfield and Adcock [20] show peculiar similarities with the present work: they employed low-cost shock sensors for remote monitoring of the detonation times in tunnel blasting of shock-wave arrival times at a free-face in bench blasting and of an inter-hole shock transient with bulk emulsion explosives.
The new signal analysis technique herein adopted consisted of two parts: empirical mode decomposition (EMD) and Hilbert spectral analysis (HSA). We demonstrated that the method was effective for nonlinear and nonstationary data analysis, especially for time–frequency–energy representations. It gave results that were much sharper than those from any of the traditional analysis methods for time–frequency–energy representations. Particularly, one of the main advantages of the HHT is that it is adaptive and it can extract the main characteristics of the signal change and is suitable for the analysis of blasting vibration signal, which has the features of fast mutation and attenuation [24]. Compared with the traditional wavelet transform, it can effectively filter out the effects of a high-frequency noise signal, where the identification accuracy is high, is not limited by wavelet scale, and is adaptable. In such a scenario, the adoption of a developed version of the HHT [25] for calculating the energy spectrum of a blast wave signal with nonlinear, non-stationary, and noisy properties could offer new insight about the signal processing.
Our results show a clear correlation: an evident reduction of shock transfer to the rock mass (i.e., reduction of confinement) with an increase of the cavity opening. Nevertheless, when only the displacement of the piezometric sensors was considered, a disparity in behavior among the sensors was noted. On the other hand, when the displacement component was integrated with respect to time, the behavior of all sensors normalized, showing the need to focus both on the oscillation displacement and duration to properly address the shock effect. Similar results have been achieved by Lu et al. [26]; they demonstrated the non-linear relationship between the increasing number of free surfaces and the peak particle velocity, and pointed out that if the blasting geometry parameters and charge weight were the same in each blast delay in the same row, the explosive detonated in the first delay always produced a higher vibration compared to the following delays.
5. Conclusions
The experimental activity was focused on demonstrating the reliability of a low-cost approach to observing the sequence and the efficiency of a burn cut in underground tunneling. The low-cost shock sensors (a few dollars each) could be easily installed on the rock wall and connected with a portable high-rate sampling data-logger. We demonstrated the good performance of the sensors in terms of sensitivity and frequency response, as they worked properly according to the intensity and frequency content of the recorded signal.
The main interesting results of the experimental activity refer to the clear correlation between the reduction of the shock transfer to the rock mass (i.e., reduction of confinement) and the increase of the cavity opening. Future research will address similar measurements with different drilling patterns (specially focusing on the angles of breakage) and charge configurations to evaluate the variation of confinement.
Author Contributions
Conceptualization, J.S.; methodology, J.S. and A.G.; software, J.S. and A.G.; validation, J.S. and A.G.; formal analysis J.S. and A.G.; investigation, J.S.; resources, J.S.; data curation, J.S. and A.G.; writing—original draft preparation, J.S. and A.G.; writing—review and editing, J.S. and A.G.; visualization, J.S. and A.G.; supervision, J.S.; project administration, J.S.; funding acquisition, J.S. and A.G.
Funding
This work has been developed during the Project “ENERBLAST: Energy in Blasting and Comminution,” financed by Politecnico di Torino within the “Joint Project for the internationalization of Research” program. The experimental part was developed in the framework of the “Mine-Plant School Project” (Proyecto Escuela Mina Planta), IDI 30487869-0, financed by the regional government of the Bernardo O’Higgins Region, Chile, and executed by the Adolfo Ibanez University (Santiago de Chile).
Conflicts of Interest
The authors declare no conflict of interest. The funders had no role in the design of the study; in the collection, analyses, or interpretation of data; in the writing of the manuscript, nor in the decision to publish the results.
Appendix A. High Resolution Images of the Blast
Figure A1.
Burn cut after detonation of central hole with sequence number zero.

Figure A2.
Cavity after detonation of hole with sequence number 1.

Figure A3.
Cavity after detonation of hole with sequence number 2.

Figure A4.
Cavity after detonation of hole with sequence number 3.

Figure A5.
Cavity after detonation of hole with sequence number 4.

Figure A6.
Cavity after detonation of hole with sequence number 5.

Figure A7.
Cavity after detonation of hole with sequence number 6.

Figure A8.
Cavity after detonation of hole with sequence number 7.

Figure A9.
Cavity after detonation of hole with sequence number 8.

Figure A10.
Cavity after detonation of hole with sequence number 9.

References
- Langefors, U.; Kihlstrom, B. The Modern Technique of Rock Blasting, 2nd ed.; Almqvist & Wiksells, Ed.; Almqvist & Wiksells: Stockholm, Sweden, 1964; 405p. [Google Scholar]
- Mancini, R.; Gaj, F.; Cardu, M. Atlas of Blasting Rounds for Tunnel Driving; Politeko: Torino, Italy, 1998; 337p. [Google Scholar]
- Cardu, M.; Seccatore, J. Quantifying the difficulty of tunnelling by drilling and blasting. Tunn. Undergr. Sp. Technol. 2016, 60, 178–182. [Google Scholar] [CrossRef]
- Seccatore, J.; Cardu, M. On the influence of breaking angles in the pull efficiency of tunneling by drill and blast. In Proceedings of the XIII Jornada de Voladura, Viña del Mar, Chile, 17–19 October 2018; ASIEX–Chilean Association of Explosives Engineers: Santiago, Chile, 2018; pp. 76–80. [Google Scholar]
- Allen, M.; Worsey, P. Burn cut pull optimization through varying relief hole depths. In Proceedings of the 41st Annual Conference on Explosives and Blasting Technique, New Orleans, LA, USA, 1–4 February 2015. [Google Scholar]
- Bollinger, G.A. Blast Vibration Analysis; Courier Dover Publications: Mineola, NY, USA, 2018. [Google Scholar]
- Chen, C.; Wu, L.; Chen, X.; Li, B.; Peng, Y. The Improvement and Comparison of Blast Vibration Velocity Prediction Method. Geotech. Geol. Eng. 2018, 36, 1673–1681. [Google Scholar] [CrossRef]
- Chen, G.; Li, Q.Y.; Li, D.Q.; Wu, Z.Y.; Liu, Y. Main frequency band of blast vibration signal based on wavelet packet transform. Appl. Math. Model. 2019, 74, 569–585. [Google Scholar] [CrossRef]
- Das, A.; Sinha, S.; Ganguly, S. Development of a blast-induced vibration prediction model using an artificial neural network. J. South. Afr. Inst. Min. Metall. 2019, 119, 187–200. [Google Scholar] [CrossRef]
- Emad, M.Z.; Mitri, H.; Kelly, C. Dynamic model validation using blast vibration monitoring in mine backfill. Int. J. Rock Mech. Min. Sci. 2018, 107, 48–54. [Google Scholar] [CrossRef]
- Haibo, W.; Heng, P.; Qi, Z. Research on Vibration Characteristics of Different Blasting Mode in Coal Mine Rock Drift. Chin. J. Undergr. Sp. Eng. 2018, 2, 34. [Google Scholar]
- Himanshu, V.K.; Roy, M.P.; Mishra, A.K.; Paswan, R.K.; Panda, D.; Singh, P.K. Multivariate statistical analysis approach for prediction of blast-induced ground vibration. Arab. J. Geosci. 2018, 11, 460. [Google Scholar] [CrossRef]
- Himanshu, V.K.; Roy, M.P.; Singh, P.K. Dynamic simulation approach to assess the influence of charging parameters on blast induced vibration. J. Min. Met. Fuels 2019, 67, 299–306. [Google Scholar]
- Man, K.; Xiaoli, L.; Wang, J.; Wang, X. Blasting Energy Analysis of the Different Cutting Methods. Shock Vib. 2018, 2018, 9419018. [Google Scholar] [CrossRef]
- BS6472-2 Guide to Evaluation of Human Exposure to Vibration in Buildings, Blast Induced Vibration; British Standards Institution: London, UK, 2008.
- NZS/ISO 2631-2:1989 Evaluation of Human Response Exposure to Whole Body Vibration–Part 2: Continuous and Shock Induced Vibrations in Buildings (1 to 80 Hz), New Zealand.
- DIN 4150-3 1999 Structural Vibration–Part 3: Effects of Vibration on Structures, Germany.
- USBM RI 8507 Structure Response and Damage Produced by Ground Vibration from Surface Mine Blasting, USA.
- Habenicht, H.; Scott, J.J. The Influence of Shock Waves on The Stability of Rock-Bolt Anchorage. Trans. Proc. Soc. Min. Eng. USA 1967, 1, 113–117. [Google Scholar]
- Farnfield, R.; Adcock, C. The Field Application of a Low-Cost Shock Sensor. In Proceedings of the Thirty-First Annual Conference on Explosives and Blasting Technique, Orlando, FL, USA, 6–9 February 2005. [Google Scholar]
- Huang, N.E.; Long, S.R.; Shen, Z. The mechanism for frequency down-shift in nonlinear wave evolution. Adv. Appl. Mech. 1996, 32, 59–111. [Google Scholar]
- Huang, N.E.; Shen, Z.; Long, S.R.; Wu, M.C.; Shih, H.H.; Zheng, Q.; Yen, N.-C.; Tung, C.C.; Liu, H.H. The empirical mode decomposition and the Hilbert spectrum for nonlinear and non-stationary time series analysis. Proc. R. Soc. Lond. 1998, 454, 903–995. [Google Scholar] [CrossRef]
- Huang, N.E.; Shen, Z.; Long, S.R. A new view of water waves–The Hilbert spectrum. Annu. Rev. Fluid Mech. 1999, 31, 417–457. [Google Scholar] [CrossRef]
- Li, D.; Xiang, F.; Liu, H.Q.; Guo, T.; Wu, G.H. Blasting Vibration Signal Analysis Based on Hilbert-Huang Transform. Key Eng. Mater. 2011, 474–476, 2279–2285. [Google Scholar] [CrossRef]
- Li, L.; Wang, F.; Shang, F.; Jia, Y.; Zhao, C.; Kong, D. Energy spectrum analysis of blast waves based on an improved Hilbert–Huang transform. Shock Waves 2017, 27, 487–494. [Google Scholar] [CrossRef]
- Lu, W.; Leng, Z.; Hu, H.; Chen, M.; Wang, G. Experimental and numerical investigation of the effect of blast-generated free surfaces on blasting vibration. Eur. J. Environ. Civ. Eng. 2018, 22, 1374–1398. [Google Scholar] [CrossRef]
Figure 1.
Drilling mesh on the blast face. Numbers indicate the firing sequence (“z” indicating zero). Light green: charged holes, orange: dummy holes. The metric scale is visible.
Figure 1.
Drilling mesh on the blast face. Numbers indicate the firing sequence (“z” indicating zero). Light green: charged holes, orange: dummy holes. The metric scale is visible.

Figure 2.
Evolution of the opening cut cavity. Numbers indicate the sequence number of the last hole that was detonated. The first picture shows the result of the first hole, where the rock was fragmented but not ejected. Ejection of the rock broken by the first hole happened at the detonation of the second hole.

Figure 3.
Evolution of the cross-section surface of the cavity generated by the evolution of the opening cut (dashed) and surface of each prism detached by the corresponding blasthole.
Figure 3.
Evolution of the cross-section surface of the cavity generated by the evolution of the opening cut (dashed) and surface of each prism detached by the corresponding blasthole.

Figure 4.
Installation of the sensors on the tunnel walls. Each sensor lay on a joint belonging to a different set of discontinuities.
Figure 4.
Installation of the sensors on the tunnel walls. Each sensor lay on a joint belonging to a different set of discontinuities.

Figure 5.
Example of a reading of a shock sensor with a positive measurement of voltage.

Figure 6.
Example of the signal after filtering out the shift removal and the low-frequency noise (dewowing).
Figure 6.
Example of the signal after filtering out the shift removal and the low-frequency noise (dewowing).

Figure 7.
Example of the frequency data analysis according to the Hilbert–Huang transform (HHT) transform; on the x-axis is the elapsed time of the signal and along the y-axis the frequency, and the color scale refers to the signal amplitude at that given frequency and time signal.
Figure 7.
Example of the frequency data analysis according to the Hilbert–Huang transform (HHT) transform; on the x-axis is the elapsed time of the signal and along the y-axis the frequency, and the color scale refers to the signal amplitude at that given frequency and time signal.

Figure 8.
(a) Peak-to-peak recorded voltage for the blasthole sequence number. (b) Oscillation time for each blasthole sequence number; sensor C systematically measured lower peak voltages but for a longer duration of the oscillation.
Figure 8.
(a) Peak-to-peak recorded voltage for the blasthole sequence number. (b) Oscillation time for each blasthole sequence number; sensor C systematically measured lower peak voltages but for a longer duration of the oscillation.

Figure 9.
Considering only the peak-to-peak voltage, sensor C showed a shock behavior that was drastically different from the other two.
Figure 9.
Considering only the peak-to-peak voltage, sensor C showed a shock behavior that was drastically different from the other two.

Figure 10.
Considering the signal energy, by integrating the voltage values of the oscillation along the duration of the same oscillations, all three sensors showed the same shock behavior.
Figure 10.
Considering the signal energy, by integrating the voltage values of the oscillation along the duration of the same oscillations, all three sensors showed the same shock behavior.

© 2019 by the authors. Licensee MDPI, Basel, Switzerland. This article is an open access article distributed under the terms and conditions of the Creative Commons Attribution (CC BY) license (http://creativecommons.org/licenses/by/4.0/).
Share and Cite
MDPI and ACS Style
Godio, A.; Seccatore, J. Measuring the Reduction of the Confinement along the Evolution of a Burn Cut. Appl. Sci. 2019, 9, 5013. https://doi.org/10.3390/app9235013
AMA Style
Godio A, Seccatore J. Measuring the Reduction of the Confinement along the Evolution of a Burn Cut. Applied Sciences. 2019; 9(23):5013. https://doi.org/10.3390/app9235013
Chicago/Turabian StyleGodio, Alberto, and Jacopo Seccatore. 2019. "Measuring the Reduction of the Confinement along the Evolution of a Burn Cut" Applied Sciences 9, no. 23: 5013. https://doi.org/10.3390/app9235013
Note that from the first issue of 2016, this journal uses article numbers instead of page numbers. See further details here.