Meta-Estimation of Araucanian Herring, Strangomera bentincki (Norman, 1936), Biological Indicators in the Central-South Zone of Chile (32°–47° LS)
 Antonio Aranis1*
  Rolando de la Cruz2
  Carlos Montenegro1
  Marlene Ramírez1
  Leonardo Caballero1 Alejandra Gómez1
  Karen Walker1
- 1Instituto de Fomento Pesquero (IFOP), Valparaíso, Chile
- 2Faculty of Engineering and Sciences, Universidad Adolfo Ibáñez, Santiago, Chile
Araucanian herring, Strangomera bentincki, is ecologically and economically important. Its complexity, like that of other pelagic fish, arises from seasonal population changes related to distribution with different spatial dynamics and demographic fractions, subject to strong environmental and fishing exploitation variations. This implies the necessity for a thorough understanding of biological processes, which are interpreted with the help of various activities, and directly or indirectly allow to infer and deliver adequate indicators. These activities facilitate a correct technical analysis and consistent conclusions for resource management and administration. In this context, the present study identified and addressed the need to integrate information on Araucanian herring lengths made available in historical series from commercial fleet fishing and sources such as special monitoring, hydroacoustic cruises, and monitoring during closed seasons. The study focused on methodologies widely used in biostatistics that allow analyzing the feasibility of integrating data from different origins, focused on evaluating the correct management of size structures that vary by origin, sample size, and volumes extracted. We call this tool meta-estimation. It estimates the integration of biological-fishery size indicators that originated mainly from commercial fishing and research fisheries for central-south pelagic fishery with data of catch between January and July 2018.
1 Introduction
The Humboldt Current System (HCS) in the South Pacific Ocean (SPO) is among the most productive in the world (Gilly et al., 2013). Chile has a continental coastline of around 4,200 km with a north–south orientation, crossing different environmental conditions strongly associated with latitude, and whose atmospheric circulation is forced by the Pacific anticyclone.
This system, characterized by its high climatic variability, makes small pelagic populations fluctuating, with alternating inter- and intra-annual preponderance leading to relatively dense shoal formations with a marked daily cycle. Shoalings are highly aggregated during the day and dispersed at night together with less dense surface aggregations (Castillo et al., 2009). Catches show marked seasonality with maximums between February and May, supported by the annual summer season recruitment impulse (Cubillos et al., 2002). This incorporation of juveniles, dominated by the zero age group, defines the highest catches for the first half of the year (Aranis et al., 2016). This links the activity closely to recruitments, which are highly variable and vulnerable, as growing and maturing individuals are mostly removed from the population (Aranis et al., 2015). These high recruitment fluctuations make these populations especially difficult to manage, further complicated by environmental conditions that play an important role in all stages of their life cycle and in determining the success of reproduction and recruitment (Hjort, 1914; Lasker, 1975; Iles and Sinclair, 1982; Cury and Roy, 1989; Yáñez et al., 1990; Bakun, 1996; Cubillos, 1999; Cubillos and Arcos, 2002; Arcos et al., 2004; Castillo-Jordán et al., 2010).
These small pelagic species have a coastal distribution within 50 nautical miles (nm) from the coast. Biological productivity is generally high due to seasonal upwelling events, mainly from mid-September to March, the austral spring–summer period (Arcos and Navarro, 1986; Arcos, 1987; Cubillos et al., 2001). Spatial expression of spawning (eggs and larvae) does not exceed 20 nm and 20–30 nm in the case of juveniles and adults, mainly on the continental shelf, whose catches do not exceed 500-m depth in the water column, preferably between 3 and 80 m (Castillo et al., 1995; Frimodt, 1995; Cubillos et al., 2007; Castillo et al., 2009). Araucanian herring, Strangomera bentincki (Norman, 1936), and anchovy, Engraulis ringens (Jenyns, 1842), are more abundant within the first 5–10 nm associated with upwelling foci and the mouth of rivers (Cubillos and Arancibia, 1993). Industrial and artisan catches are clearly focused on the continental shelf, mainly in the Biobío Region (62%) and secondarily in the Araucanía and Los Ríos Regions (35%). From an environmental, oceanographic, and biological perspective, differences exist between both areas. North of Punta Lavapié (37° 08' 57"S, 73° 35' 00"W), the coastline tends toward the northwest, platform width is greater than 130 nm, cut by the Biobío Canyon, the Itata Canyon, the Arauco Gulf, and the Concepción and Coliumo Bays.
Administratively, extraction has been regulated since 2001 through fishing quotas and biological reproductive and recruitment periods since 1996. Although these measures strongly regulate fishing, they also led to periods of different intensities both in the industrial and artisan sectors (Aranis et al., 2015).
Total pelagic landings in the zone were sustained for some 15 years by Araucanian herring stock, a resource that spurs fishing operations mixed with anchovy. The average catch from 2010 to 2016 was 479,000 t, mainly by the artisan fleet (78%). A hegemonic presence of the species is evidenced in artisan fishery, partly reflecting the magnitude ratio of biomass and assigned quotas.
Recruitment or entry processes of juvenile Araucanian herring have been detected since 1999 using hydroacoustic methods (Castillo et al., 2010), while spawning biomass has been evaluated since 2002 via the daily egg production method (Cubillos et al., 2007), which incorporates reproductive dynamics and egg production. Such studies have yielded data on Araucanian herring spatial distribution of different developments in the southern region, as well as abundance quantifications, spatial spawning, and recruitment characterization (Castro et al., 1997; Castillo et al., 2010).
Size structure is a key biological trait of the population. To be contrasted correctly with other structures of different strata, it requires weighing upon capture. Hence, frequency-to-size measurements expand from catch in weight or number, representing the biomass or abundance by size class. This procedure requires the concurrence of the three main sampling components, catch or landing, length, and weight of the specimens. However, the imbalance of catch magnitudes affects the correct representation and entails uncertainty about the correct decision when integrating data that can vary spatially, temporally, and in relation to origin (artisan-industrial). In this context, average weights are not always available, though these data are essential for estimating various indices, functions, and statistics. To solve this problem, it is necessary to establish decision criteria regarding the feasibility of finding or obtaining alternative information and assessing another potential and representative solution that replaces the missing one. Lacking any of these estimates implies that significant volumes of catch or fraction landed cannot be processed, with potentially important consequences for the assessment of population structure, demographic fractions, and state of the fisheries. This has led to the need to define criteria for a different estimate of the length–weight relationship, first allowing to resolve the relevance of integrating data and second to offer the best solution for correct integration and representation. In sum, to set a goal for evaluating the validity of integrating pelagic fish length information from samples obtained from various sources, exploring, designing a statistical procedure that allows integrating different data sources or clusters, and incorporating the meta-analysis approach (Pearson, 1904; Plackett, 1958; O’Rourke, 2007; Nordmann et al., 2012) to estimate size distribution by combining catch data from commercial vessels and research fisheries are key. However, to integrate information from commercial and artisan vessels in order to apply the meta-analysis to estimate size distribution, we need to face zero-probability estimates due to non-catch of certain lengths, since zero probability does not indicate the non-existence of a specific length. To solve this issue before the meta-analysis, we carried out a Bayesian estimation of the capture probability for each length. To our knowledge, this is the first study using the meta-analysis technique to estimate the length distribution of Araucanian herring, integrating samples of different types of vessels. This procedure can be used in other fish species sampled in the catch.
2 Materials and Methods
In this section, we introduce the data set and study area where the samples have been collected. Afterward, we present the Bayesian procedure to estimate the probability of catch of each length and describe the meta-analysis method to estimate the length distribution. Finally, we present the meta-regression used to test whether there are significant differences between vessel types for each length.
2.1 Data and Study Area
The maritime space of Chile’s central-south is immersed in the Humboldt System, home to highly diverse pelagic species. Among the species with coastal distribution, Araucanian herring and anchovy stand out. In latitudinal extension, pelagic fishing in the zone is taking place in the area between 32°10'S (Punta Molles, north of Valparaíso Region) and 47°00'S (Punta Armando, Aysén Region), including inland waters of Los Lagos and Aysén Regions. Also in latitudinal terms, Araucanian herring and anchovy habitats extend approximately 1,600 km. In longitudinal terms, both species are distributed between the coast and 30 nm on the continental shelf, bathymetrically living up to 50 m, moving to the surface at night due to nictemeral migration. The natural habitat of pelagic species corresponds to relatively shallow waters, 50–100 m deep. Surface fishing, together with the high density of shoalings of commercial interest, means that these fisheries generate intense activity.
The study area included the maritime area from (lat-long) to (lat-long), 200 nm from the coast. Biological data came from routine samplings of the main central-south pelagic fisheries monitoring program, developed by the Fisheries Development Institute [Instituto de Fomento Pesquero (IFOP)]. The research was carried out with the help of artisan and industrial fleets in the ports of San Antonio (Valparaíso Region), Talcahuano, San Vicente, Lota and Coronel (Biobío), Valdivia (Araucanía), and Corral (Los Ríos), as detailed in Figure 1 and Tables 1, 2.
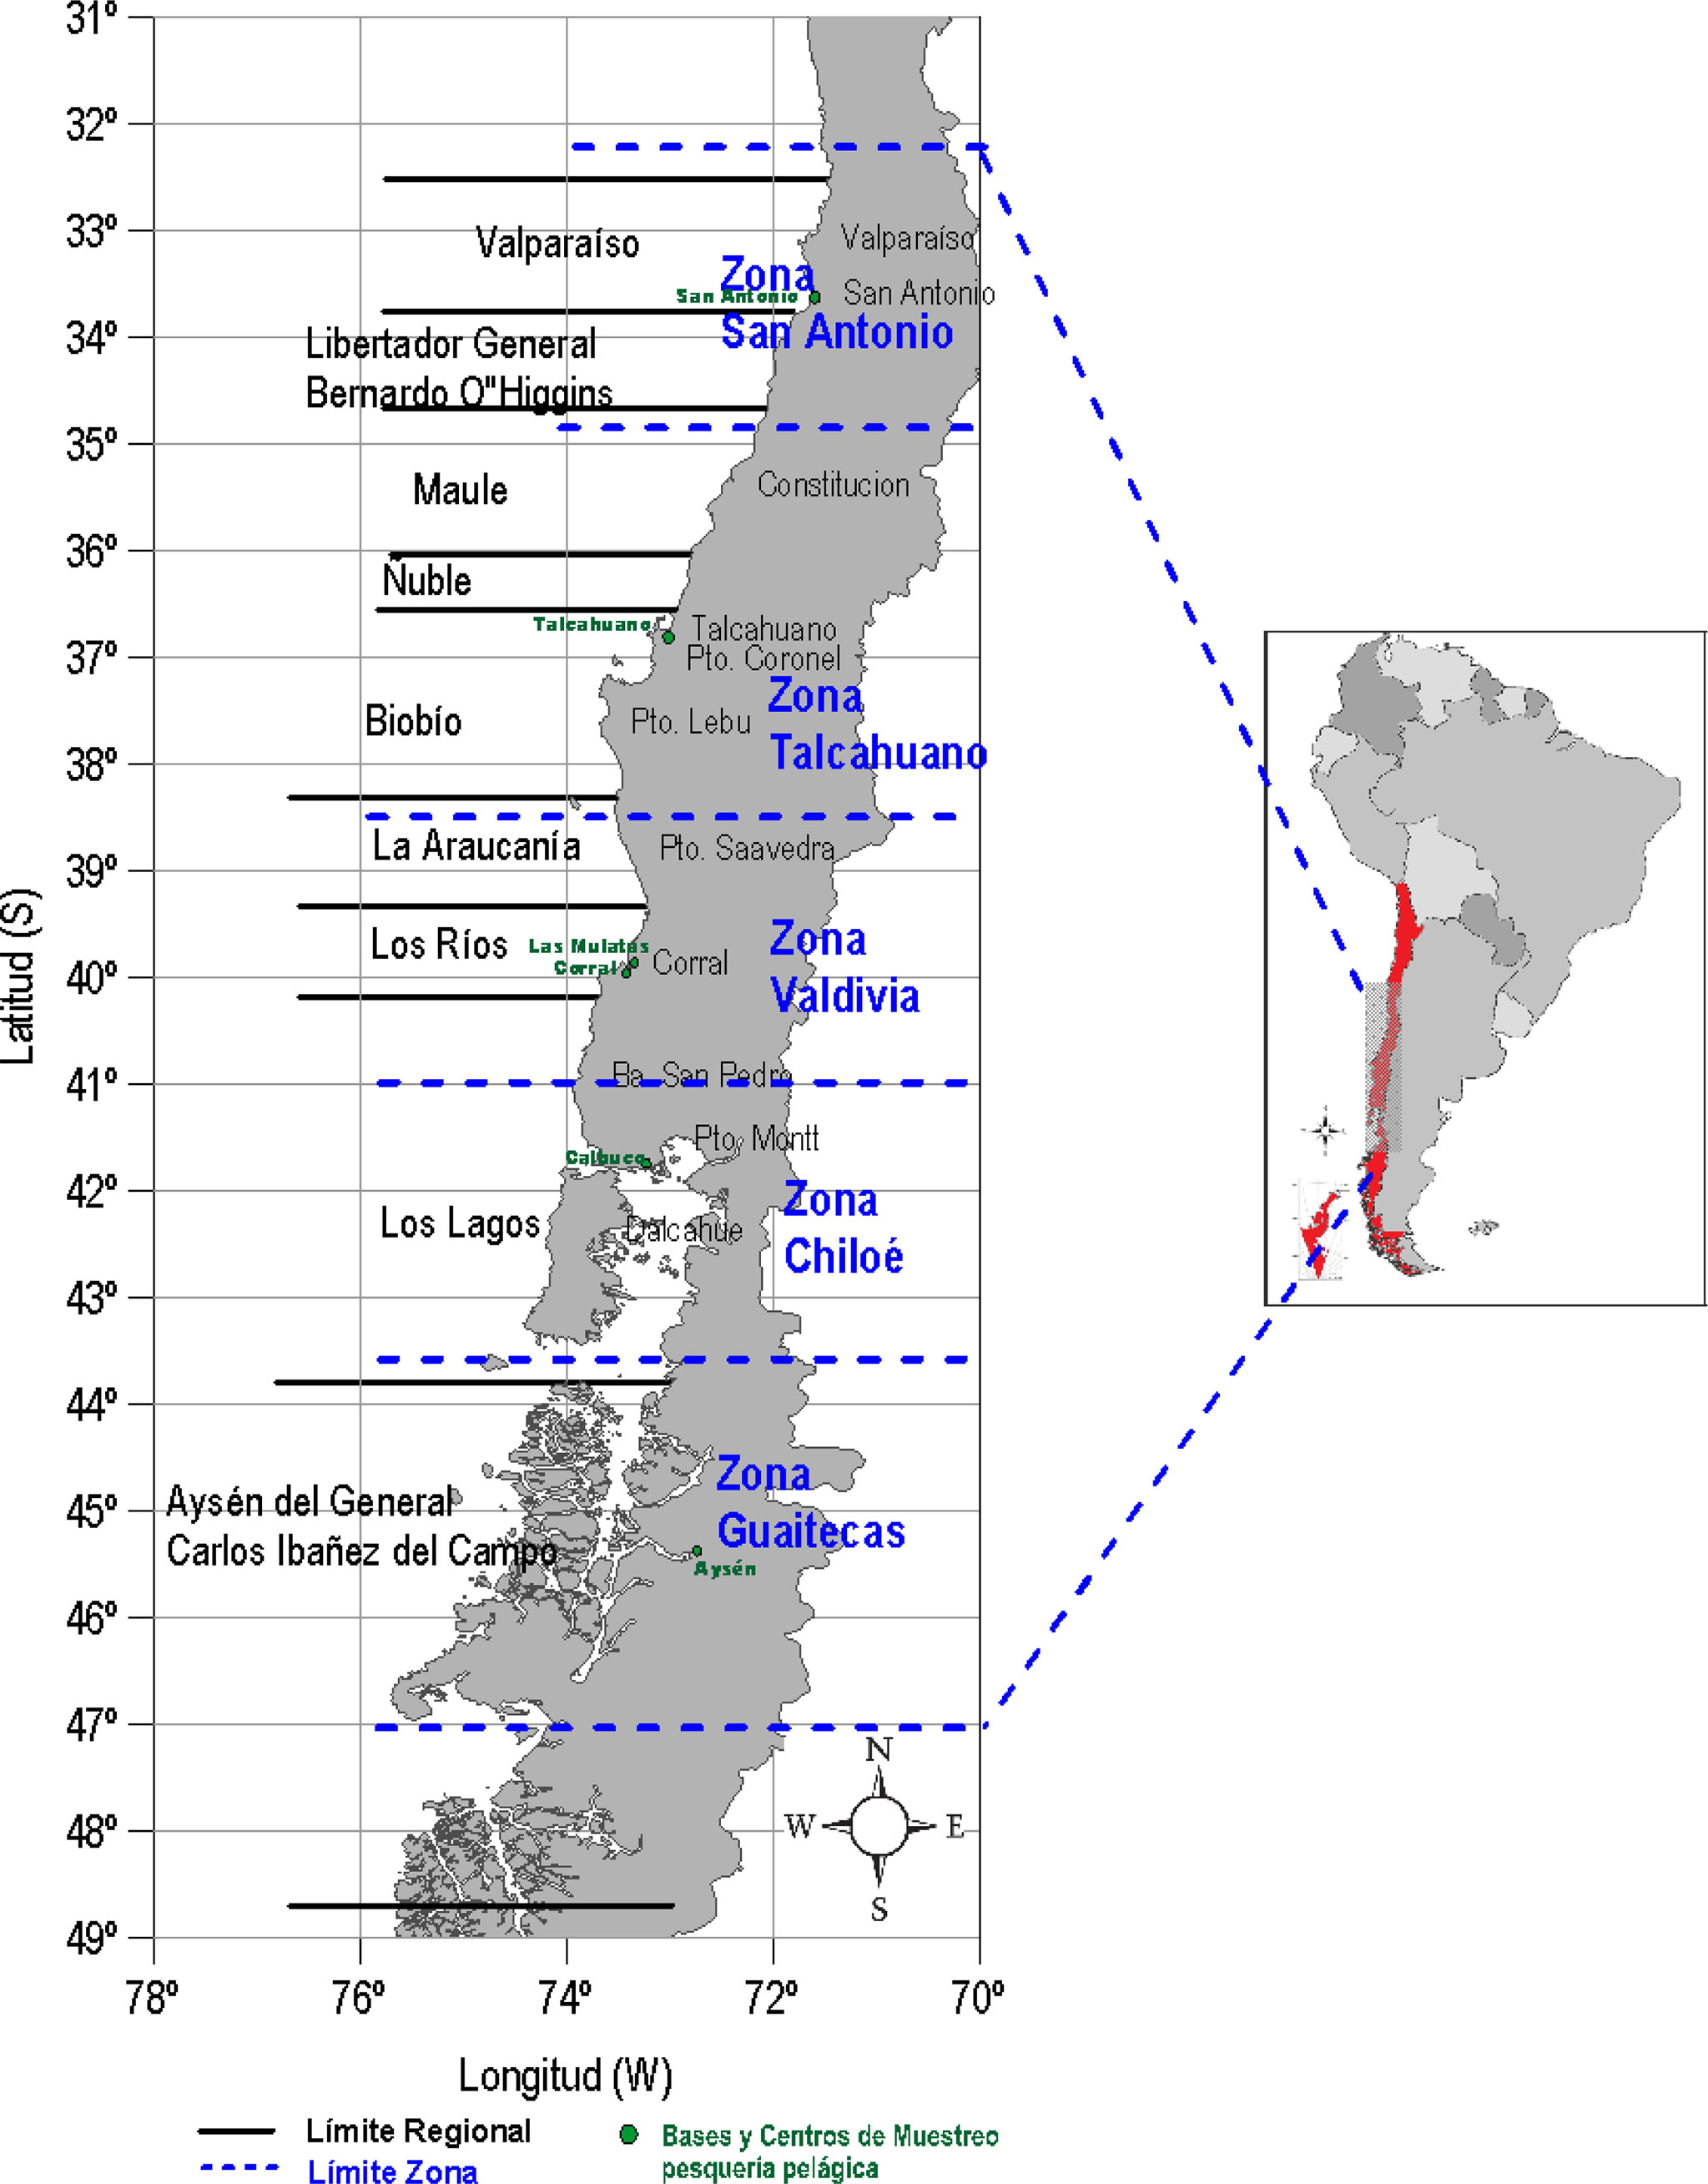
Figure 1 Fishing zones and administrative regions of central-south Chile (31°–49° LS).
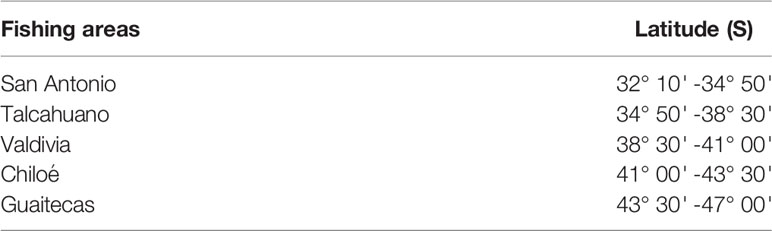
Table 1 Fishing area in the central-south macrozone.
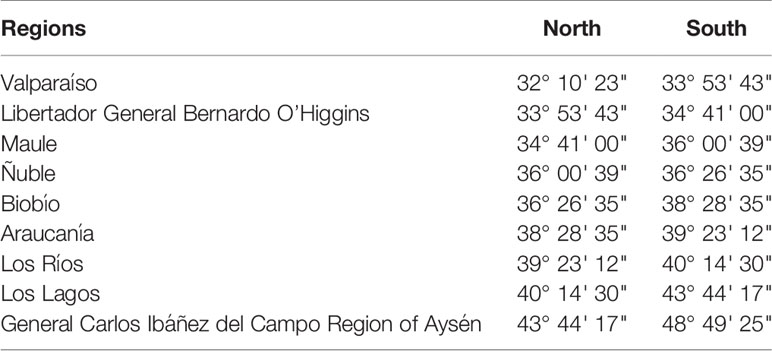
Table 2 Regional coastal limits for catch analysis and industrial and artisan landings.
Catches of Araucanian herring were preferably obtained in a normal fishing environmental period in summer–autumn in coastal and protected areas, favorable to upwelling and greater availability of food, such as the Gulf of Arauco and the Bay of Concepción, frequent areas of fishing for the commercial fleet and special monitoring in which during the summer period concentrations of chlorophyll greater than 1 µg/l are normally found. In areas adjacent to the coast, with higher primary productivity (>1 µg/l) and food, which leads to a higher concentration of zooplankton, such as euphausiids and copepods (Aranis et al., 2019).
Biological data comprise lengths of sampled individuals that originated mainly from commercial fishing (high-catch vessels) and research fisheries (low-catch vessels) catch between January and July 2018. The nets widely used in this small pelagic fishery are virtually the same in terms of length and mesh size of the 12.7-mm fine bodies, which is the most frequent. We used the meta-analysis technique to estimate the distribution of Araucanian herring catch length with data from 18 vessels, three commercial fishing (high-catch vessels) and 15 research fisheries (low-catch vessels). The data set is presented in Table 3.
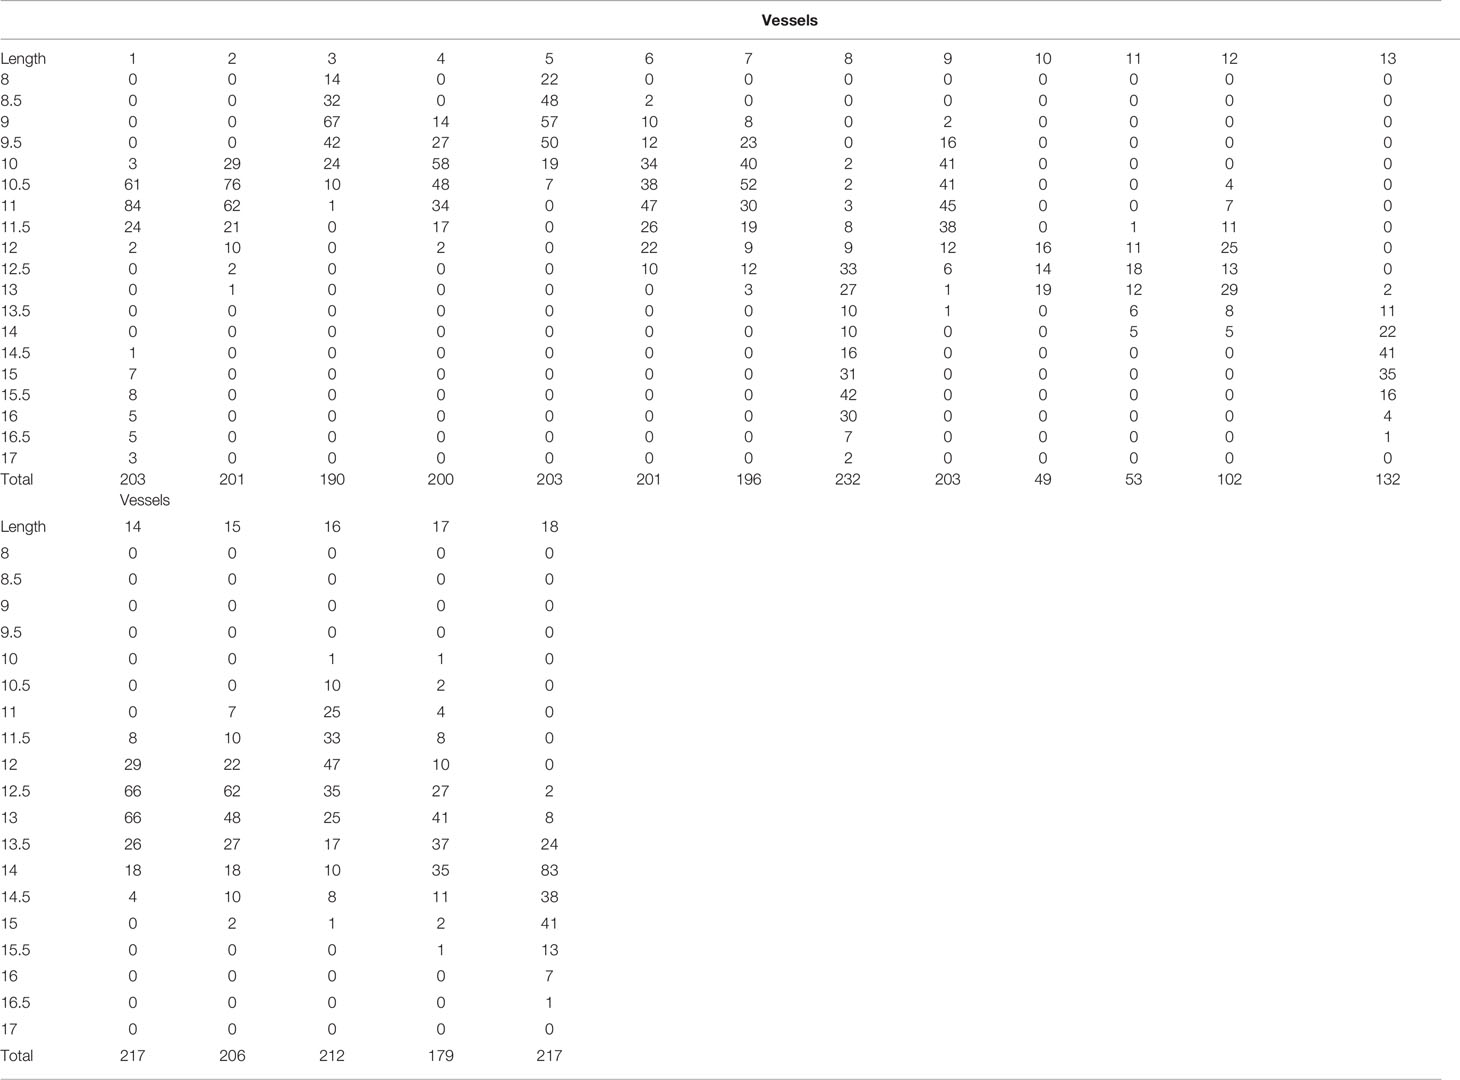
Table 3 Biological data of commercial fishing (vessels 13, 16, and 17) and research fisheries. For each vessel and length, the number of sample individuals is reported.
Usually, the sampling design to estimate the size structure corresponded to two-stage random stratified sampling, where the stratum represented the port or fishing area and the month (Gulland, 1966). The stages in this case corresponded to a selection of trips and copies obtained during the trips (Miller et al., 2007).
The sampling design associated with landing size structure corresponded to a two-stage design within a study stratum or domain. First-stage units were from trips, and second-stage units were from samples. The size structure of catches sampled onboard corresponded to a three-stage design, in which first-stage units were from trips, second-stage units were from sets, and third-stage units were specimens (Aranis et al., 2017).
The fishing platforms are operating under similar designs, which are similar for both activities (structural characteristics and fishing power). This made it possible to have comparative information without bias and supported by extensive institutional technical experience.
2.2 Bayesian Estimation of Probability of Catch
Before the meta-estimation process, we first modeled the random vector (X1, X2, … , X19) that represented the quantity of Araucanian herring caught per vessel for each of the 19 lengths, 8.5, 9, 9.5, … , 16.5, 17. We assumed that the random vector X described above has a multinomial distribution with parameter p =( p1, p2, … p19), that is
with pi ≥0, , ( p1, p2, …, p19) is the vector of capture probabilities for lengths, 8.5, 9, 9.5, … ,16.5, 17 cm and . The maximum likelihood estimator of pi is (Casella and Berger, 2002). If X = 0, for any i = 1, 2, , …, 19, then , which is a limitation, since we would be estimating that the probability of catching Araucanian herring for unobserved length i is 0. But only because Araucanian herring of a certain length has not been observed does not mean individuals of that length do not exist. To avoid estimations , we considered a Bayesian approach to estimate the vector parameters ( p1, p2, …, p19) of the multinomial distribution and their corresponding variances. The Bayesian formulation of the model is represented by:
that is, the X│p distribution is a multinomial distribution, and the priori distribution of the vector of parameters p is the Dirichlet distribution of parameter α = (α1, α2, …, α19). Then, the posterior distribution of p│X is given by:
We had a closed expression for the posterior distribution of vector p. Then, using the properties of the Dirichlet distribution, we got:
and
When α1=α2=⋯=α19=1, which meant using a non-informative priori distribution for p ,we obtained:
and
We calculated the variance of each parameter pi│X using samples from that posterior distribution for each vessel with a sample size of 10,000 from the posterior Dirichlet distribution (1).
After carrying out the Bayesian estimation, we obtained a probability matrix P = (pij), i = 1, …,19, and j = 1, …,18. The rows of matrix P represent the 19 lengths, and the columns represent the 18 vessels. Associated with matrix P, there is a matrix D = (dij), i = 1, …,19 and j = 1, …,18, where dij represents the variances of each pij calculated using a simulation of the posterior distribution (1). Below, we use the notation dij = Var(pij).
2.3 Meta-Estimation
We used the meta-analysis technique proposed by DerSimonian and Laird (1986) in each of the rows of matrix pij with its corresponding variances dij to obtain a global estimate of pi, which represented the meta-estimation of the probability of catching Araucanian herring of length i, i = 1,2, … ,19. Doing the analysis by rows was pertinent because we combined the estimates of each vessel for specific length i.
The meta-analysis integrated data from 18 vessels to generate a common estimate for each length i . That is, the process was repeated for each value of i = 1,2, … ,19. For simplicity, we dispensed with subscript i that denotes the i-th length and we defined pj as the probability that vessel j, j = 1, … , J = 18, caught Araucanian herring of any length. For any length pj, j = 1, …,18, was considered to have three components:
Where p is the common estimate we were seeking for any length (that is, the probability of catch for a length of Araucanian herring) using the catch information of J = 18 vessels, τj is the effect to be estimated in the j-th vessel, measuring the variation between vessels assumed to have normal distribution with mean 0 and variance τ2, and ⋲j is the error made in the estimation with normal distribution of mean 0 and variance dj. Also, we assume that τj and ⋲j are independent random variables. Model (2) is a random-effects model, and the vessels, j = 1, … , J = 18, in the estimate constituted a random sample of vessels.
To estimate the variance τ2 of model (2), there are several methods. One that is relatively easy to implement, since it does not require an iterative process or complex calculations, is the estimator by the moment method proposed by DerSimonian and Laird (1986) that estimated τ2 as:
The global effect was estimated as weighted average of each vessel’s individual estimators, where weights were calculated as the inverse of the sum of the variance of the individual vessel plus the variance between vessels, that is,
with .The variance of is given by . A 95% confidence interval for p is given by . In the estimator , Q is the heterogeneity statistic, which is obtained by:
To obtain the estimate of for each length i = 1, … ,19, we repeat the process 19 times corresponding to the 19 lengths considered in the study.
2.4 Meta-Regression
Meta-regression (Higgins and Thompson, 2004) can be used to study if heterogeneity between the catch of different vessels is related to specific characteristics of these vessels; however, there are other characteristics that affect catches (environment, seasonality, behavior, and demography of the resource, gear, operation, and fishing area), but in this study, samples were selected that avoided this problem and that these effects were not relevant. These characteristics can be included in model (2) as covariates and can be both continuous and categorical. They can be used to explain the heterogeneity of the effects between vessels. Crucially, because of residual heterogeneity, it was problematic to explain all of the heterogeneity (Thompson and Higgins, 2002). If we denote as the vector containing information from a set of k covariates (including the constant term for the global mean) for each vessel, model (2) can be expressed as:
with distributional assumptions τj ~ N(0, τ2) and independent . All model (3) parameters can be estimated using methods for random-effects models such as restricted maximum likelihood (Thompson and Sharp, 1999). In this study, we include a covariate indicating the type of vessel taking value 1 for research fisheries and 0 for commercial fishing (vessels 13, 16, and 17). Our objective is to test whether there are statistically significant differences between vessel types (commercial vs. research) for each fish length.
All analyses were performed with the R programming language using the MCMCpack and metafor packages. The code is available upon request from the authors.
3 Results
The data used to estimate Araucanian herring catch for 19 lengths for each of the 18 vessels through meta-estimation are detailed in Table 3. Of the 18 vessels, three (13, 16, and 17) were commercial fishing. Many lengths exhibited zero captures. Due to the presence of 0 values (Table 3), the probability of capture for each length of each vessel was estimated through the Bayesian methods. The variance of each estimate was calculated using a sample size of 10,000 from the posterior distribution for each vessel.
After obtaining the Bayesian estimates for each length {8, 8.5, 9, … ,16.5, 17}, the estimates for each of the 18 vessels were combined using the previously described meta-analysis methodology. The process was repeated 19 times for each length. The meta-estimate was first performed by separating the data from the samples obtained by each type of vessel (commercial and research ones). Then, a meta-estimate was performed considering the samples jointly from both types of vessels. Figure 2 shows the distribution of the probability estimate for each length for research (Figure 2A), commercial (Figure 2B), and research and commercial (Figure 2C) vessels. Differences in the estimation of some probabilities between the research and commercial catch vessels are evidenced.
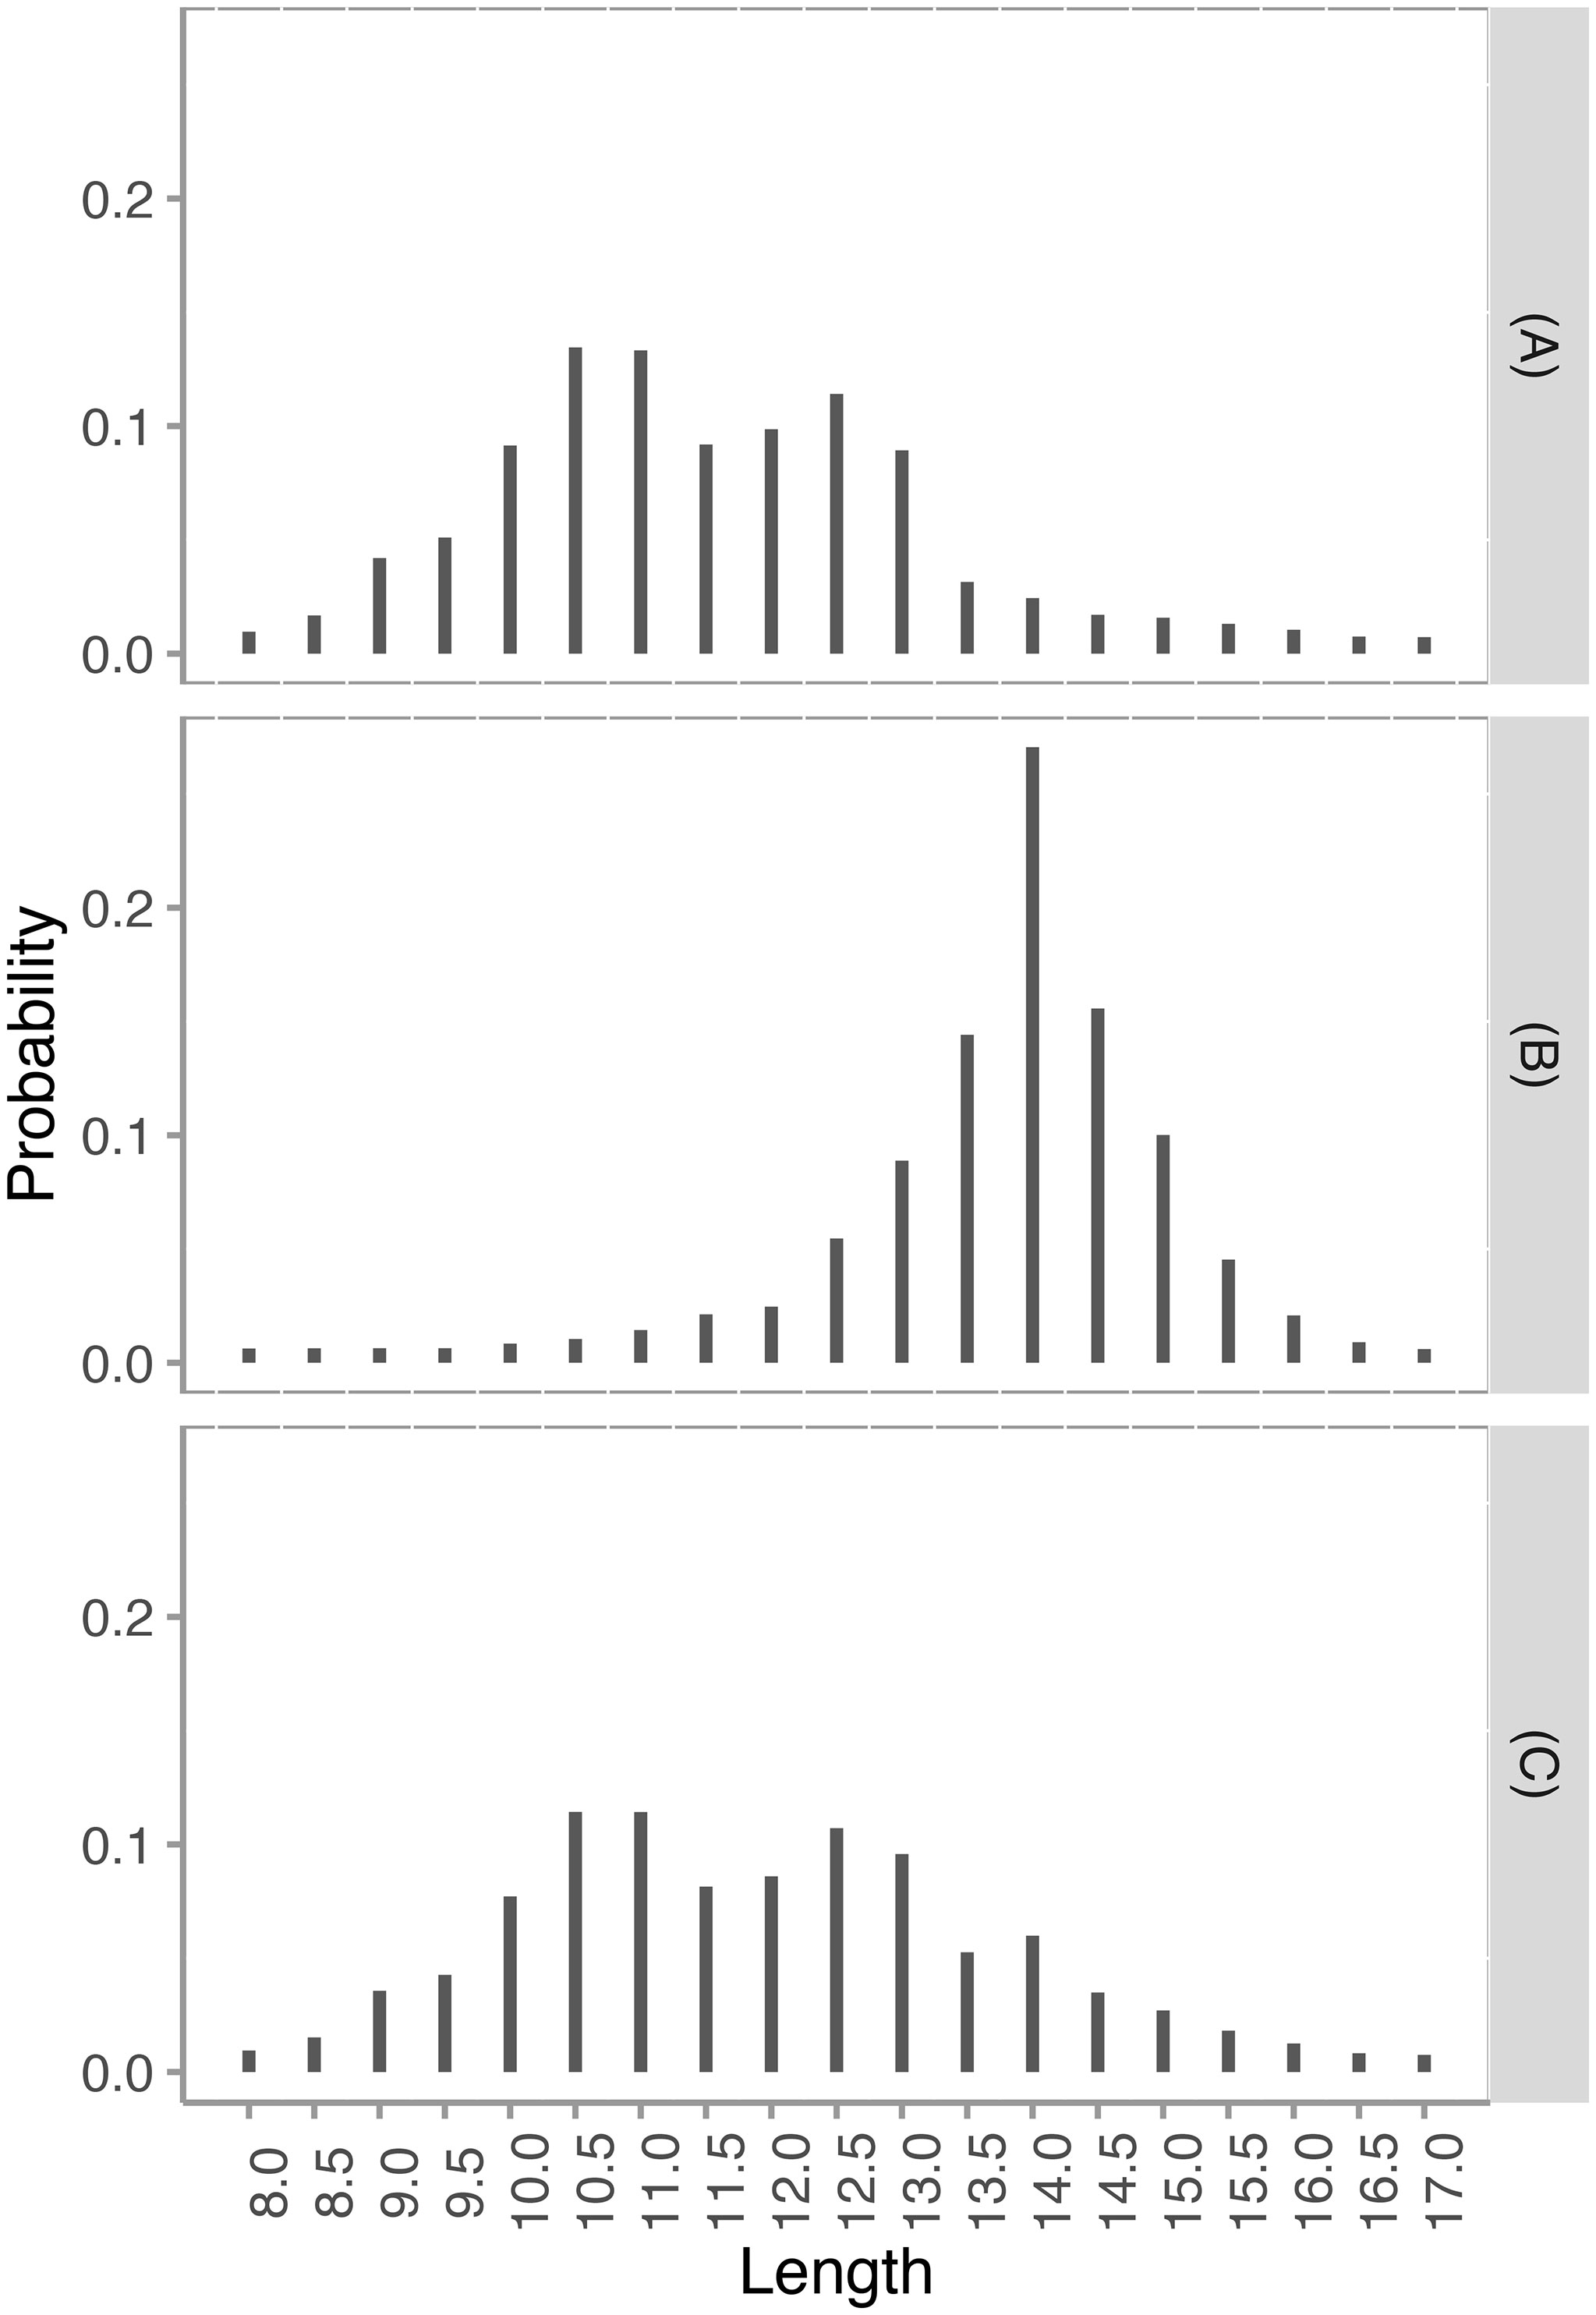
Figure 2 Meta-estimation of the length distribution for research (A), commercial (B), and research and commercial (C) vessels.
Research catch vessels showed a higher probability of catching Araucanian herring of lengths ranging from 9 to 13 cm. Commercial catch vessels showed a higher probability of catching Araucanian herring of lengths from 12.5 to 15.5 cm. To verify the existence of statistically significant differences in the probability of capture for the different lengths, a meta-regression was used considering a covariate that indicated the type of vessel. Figure 3 shows the contrast p-values for each length. Statistically significant differences in the estimation of capture probability were evidenced for 11 lengths (light blue dot).
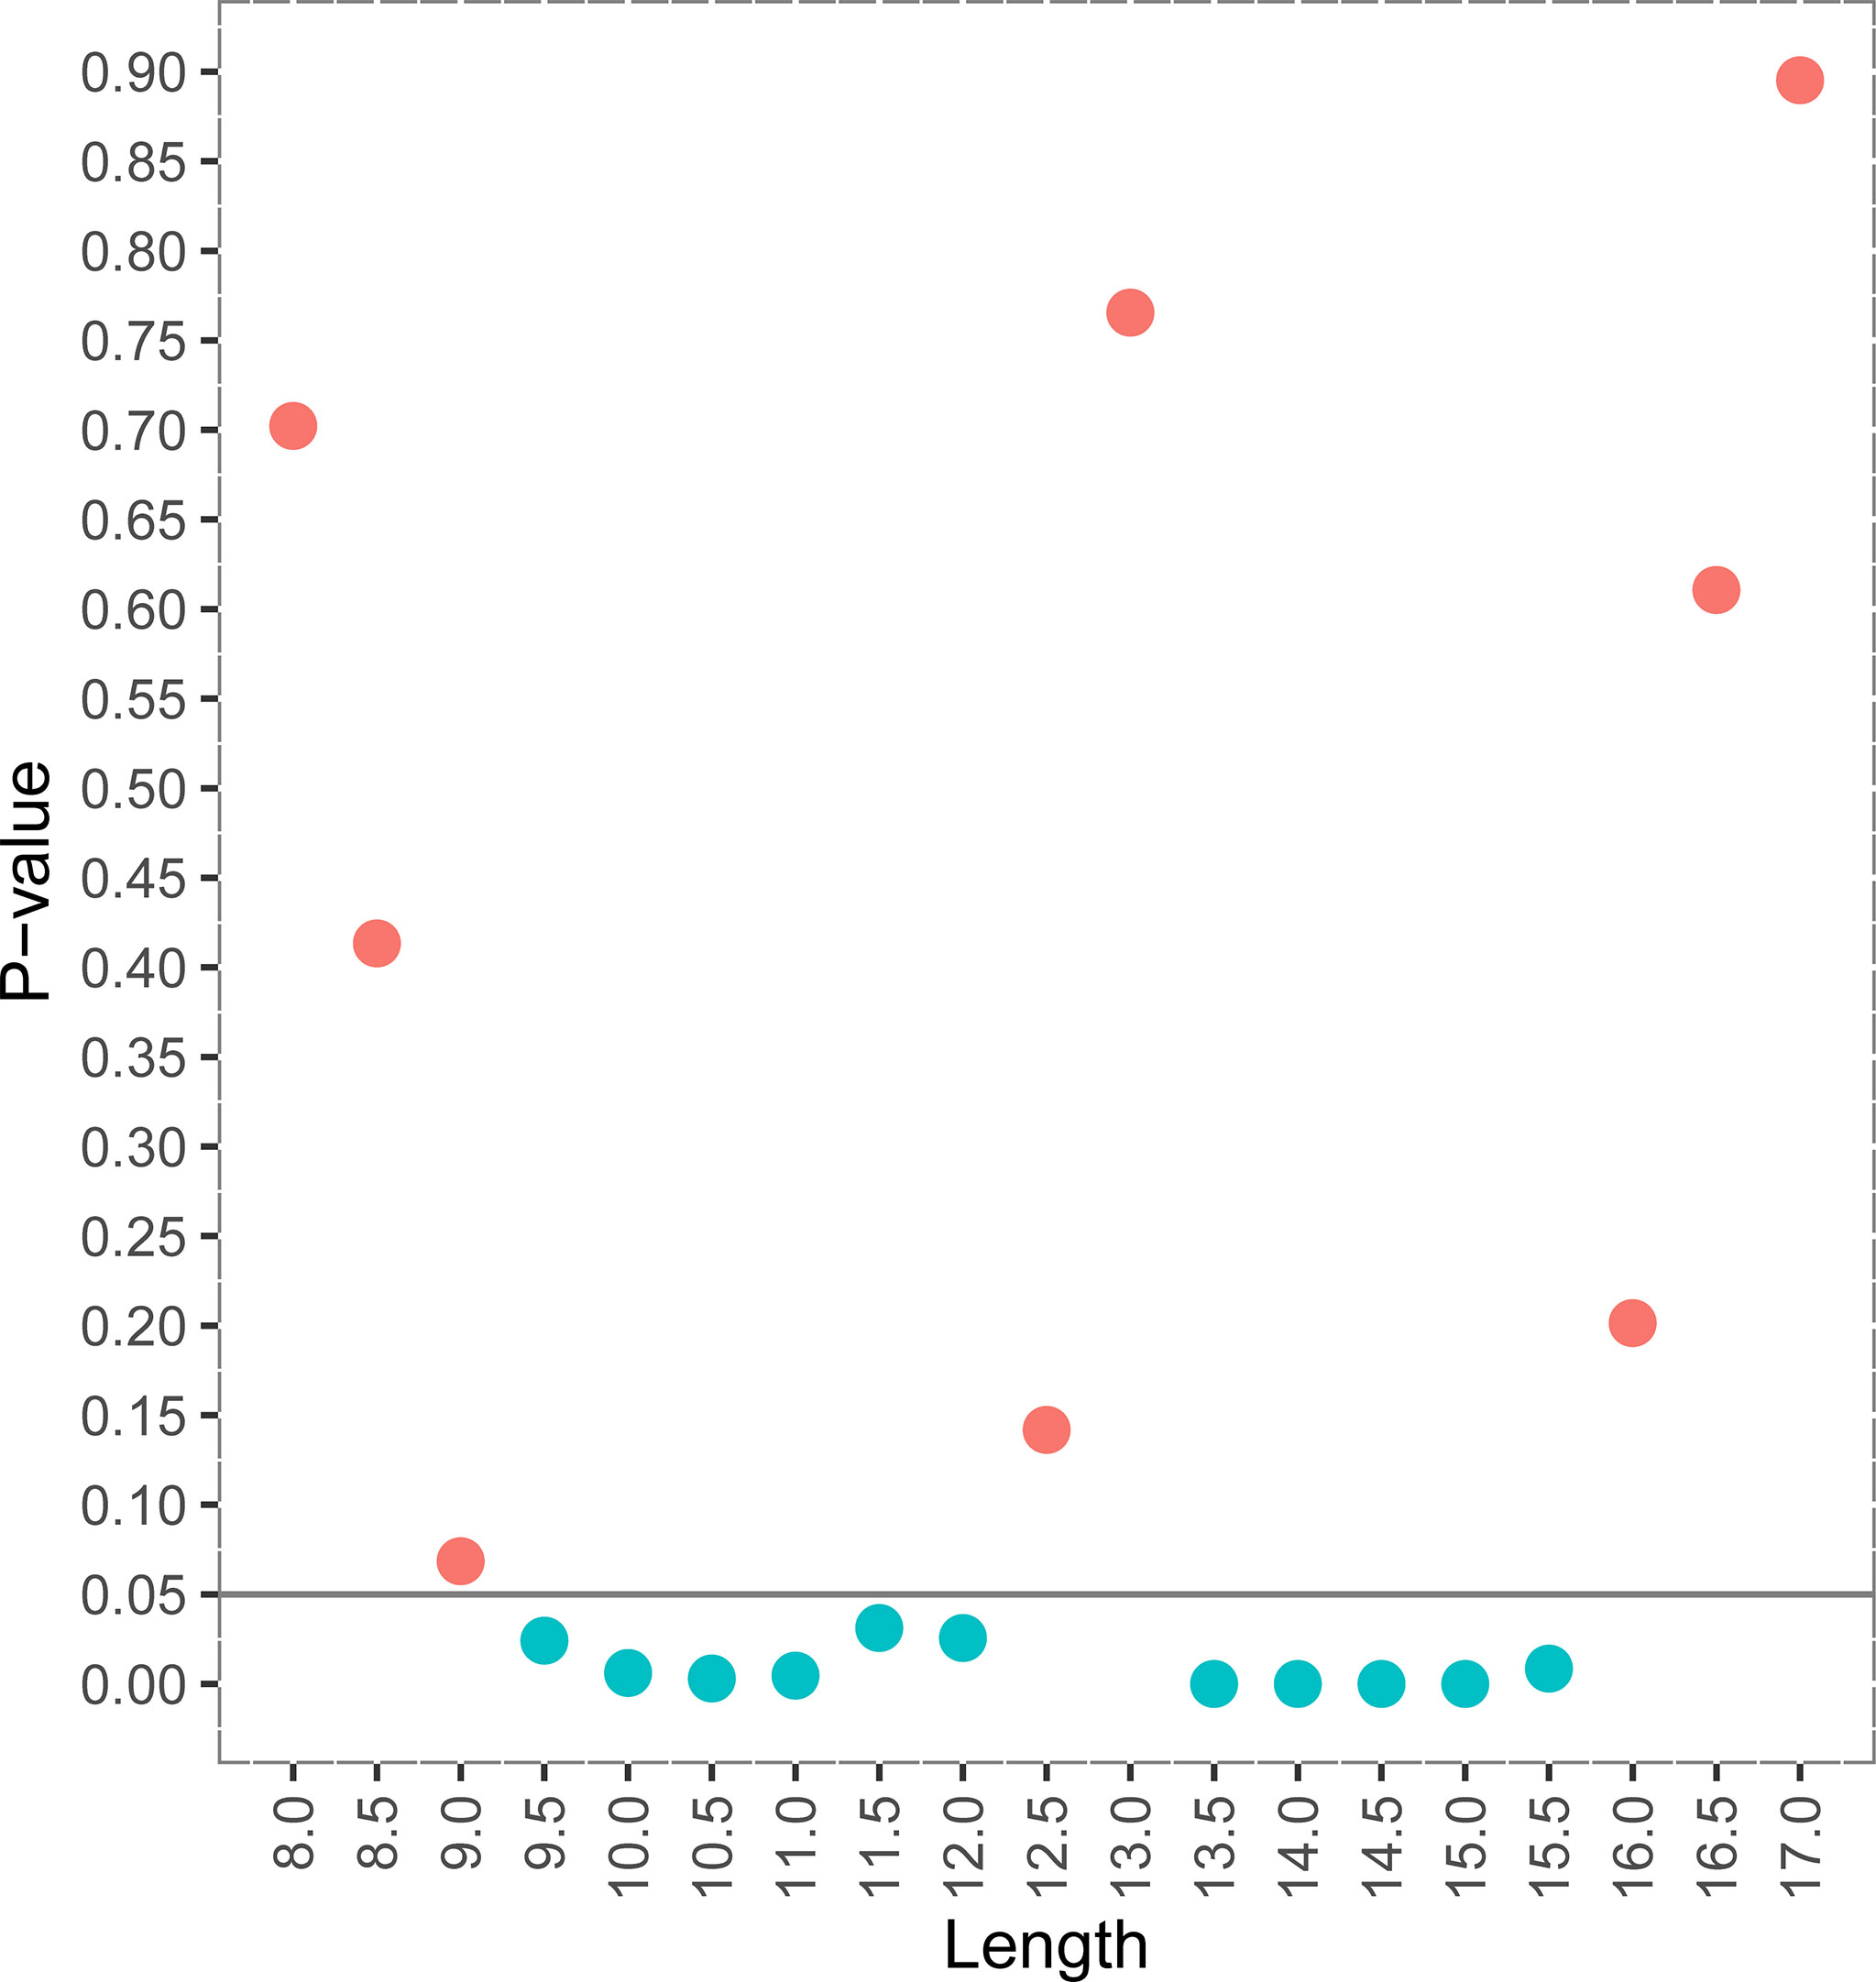
Figure 3 p-values of the hypothesis test that the probability of catch at each length between research catch and commercial catch vessels is equal (red dot, not significant; light blue dot, significant).
Results show differences in the distribution of Araucanian herring length between fishing with commercial and research catch levels for certain sizes.
4 Discussion
The meta-analysis methodology combined with Bayesian methods provides a framework to integrate information on Araucanian herring lengths from commercial and research catch vessels in order to estimate the size distribution structure. Our findings were applied in the reports that are delivered to the undersecretary of fisheries and its scientific committee in order to define the modifications of the biological closures of recruitment. According to the results, there are differences in the distribution of Araucanian herring length between commercial and research catch fishing related to certain sizes.
The correct application of a method that overcomes the feasible integration difficulties of sizes in pelagic fish will allow solving a technical issue. Results will also be applied in practical terms for better data interpretation and management, especially for recruitment processes in which diverse population components coexist, making analysis and result difficult. In sum, these results allow to improve, integrate, or segregate information under an objective statistical criterion. For example, this has been applied to the commercial fishing activity and studies under design and scientific methods; it also allows verifying the correct use of information from different vessels, fleets, and fishing gear.
Particular attention should be paid to data corresponding to oceanographic thermal anomalies that could alter biological conditions, especially average specimen weights. It is important to be careful with successive approximations when data are inserted in studies during a warm event (El Niño), when biological processes change strongly, probably resulting in weight decreases of some species. Additionally, care must be taken to exclude years with abnormal processes or estimates.
The practical application can be useful for similar studies of fishery analysts or of another nature, in which there must be contrasted levels of information that are very dissimilar in terms of the size of the sample or universe that they represent, being relevant a priori to see the real feasibility of integrating that information or not.
Data Availability Statement
The original contributions presented in the study are included in the article. Further inquiries can be directed to the corresponding author.
Author Contributions
Conceived and designed the study: AA, RDLC, and CM. Data curation: AA, MR, LC, AG, and KW. Analyzed the data: RDLC. Interpreted the data and wrote the paper: AA, RDLC, CM, MR, LC, AG, and KW. All authors reviewed the article. All authors contributed to the article and approved the submitted version.
Conflict of Interest
The authors declare that the research was conducted in the absence of any commercial or financial relationships that could be construed as a potential conflict of interest.
Publisher’s Note
All claims expressed in this article are solely those of the authors and do not necessarily represent those of their affiliated organizations, or those of the publisher, the editors and the reviewers. Any product that may be evaluated in this article, or claim that may be made by its manufacturer, is not guaranteed or endorsed by the publisher.
References
Aranis A., Gómez A., Caballero L., Ramírez M., Eisele G., González M., et al. (2016). “Informe Final, Investigación Situación Pesquería Pelágica Zona Centro-Sur 2015,” in Seguimiento Del Estado De Situación De Las Principales Pesquerías Nacionales. Subsecretaría De Pesca, Inst. Fom. Pesq (Valparaíso, Chile: Inst. Fom. Pesq.).
Aranis A., Gómez A., Caballero L., Ramírez M., Eisele G., González M., et al. (2017). “Informe Final, Investigación Situación Pesquería Pelágica Zona Centro-Su,” in Seguimiento Del Estado De Situación De Las Principales Pesquerías Nacionales. Subsecretaría De Pesca, Inst. Fom. Pesq (Valparaíso, Chile: Inst. Fom. Pesq.).
Aranis A., Gómez A., Caballero L., Ramírez M., Eisele G., González M., et al. (2015). “Informe Final, Investigación Situaci’on Pesquería Pelágica Zona Centro-Sur,” in Seguimiento Del Estado De Situación De Las Principales Pesquerías Nacionales. Subsecretaría De Pesca, Inst. Fom. Pesq (Valparaíso, Chile: Inst. Fom. Pesq.), 198 p.
Aranis A., Gómez A., Walker K., Ramírez M., Caballero L., Eisele G., et al. (2019). “Informe Final, Investigación Situación Pesquería Pelágica Zona Centro-Sur 2018,” in Seguimiento Del Estado De Situación De Las Principales Pesquerías Nacionales. Subsecretaría De Pesca, Inst. Fom. Pesq (Valparaíso, Chile: Inst. Fom. Pesq.).
Arcos D. F. (1987). Seasonal and Short Time Scale Variability in Copepod Abundance and Species Composition in an Upwelling Area Off Concepción Coast, Chile. Ph. D. Thesis (New York, USA: State University of New York, Stony Brook), 203 p.
Arcos D., Cubillos L., Núñez S. (2004). “Efectos De El Niño 1997-1998 Sobre Las Principales Pesquerías Pelágicas De La Zona Centro-Sur De Chile,” in El Niño-La Niña 1997-2000, Sus Efectos En Chile. Eds. Avaria S., Carrasco J., Rutllant J., y Yañez E. (Valparaíso, Chile: Comité Oceanográfico Nacional (CONA).
Arcos D., Navarro N. (1986). Análisis De Un Índice De Surgencia Para La Zona De Talcahuano, Chile (Lat. 37°s). Invest. Pesq. (Chile). 33, 91–98.
Bakun A. (1996). “Patterns in the Ocean: Ocean Process and Population Dynamics,” in California Sea Grant/CIB La Paz, Mexico: Centro de Investigaciones Biológicas del Noroeste.
Castillo J., Córdova J., Lillo S., Barbieri M., Osses J., Barria P. (1995) Estimación Del Reclutamiento De Anchoveta En Las Regiones I Y II. Valparaíso, Informe Final. Proyecto FIP-IT/95-02. Available at: http://www.fip.cl/FIP/Archivos/pdf/informes/IT/%2095-02.pdf.
Castillo-Jordán C., Cubillos L., Navarro E. (2010). Inter-Cohort Growth Rate Changes of Common Sardine (Strangomera Bentincki) and Their Relationship With Environmental Conditions Off Central Southern Chile. Fish. Res. 105, 228–236. doi: 10.1016/j.fishres.2010.05.012
Castillo J., Saavedra A., Hernández C., Leiva F., Lang C., Letelier J., et al. (2009). “Informe Final Proyecto Evaluación Acústica De La Biomasa, Abundancia, Distribución Espacial, Caracterización De Cardúmenes De Anchoveta Y Sardina Común En La Zona Centro-Sur Durante El Verano Del 2009,” in Fondo De Investigación Pesquera - FIP 2008-03 (2da Licitación). Inst. Fom. Pesq(Valparaíso, Chile: Inst. Fom. Pesq.).
Castillo J., Saavedra A., Leiva F., Reyes H., Hernández C., Espíndola F., et al. (2010). “Informe Final Proyecto Evaluación Del Reclutamiento De Anchoveta Y Sardina Común Entre La V Y X Regiones. Año 2010,” in Fondo De Investigación Pesquera - FIP 2009-04, Inst. Fom. Pesq (Valparaíso, Chile: Inst. Fom. Pesq.), 308 p.
Castro L., Quiñones R., Arancibia H., Figueroa D., Roa R., Sobrazo M., et al. (1997). Áreas De Desove De Anchoveta Y Sardina Común En La Zona Central. Inform. Técnico. FIP-IT/96-11., 115 p.
Cubillos L. (1999). “Estrategia Reproductiva, Crecimiento Y Reclutamiento De Strangomera Bentincki (Norman 1936) En El Sistema De Surgencia De La Zona Centro-Sur De Chile,” in Tesis De Grado Magíster En Ciencias Mención Oceanografía (Concepción, Chile: Universidad de Concepción), 180.
Cubillos L., Arancibia H. (1993). Análisis De La Pesquería De Sardina Común (Strangomera Bentincki) Y Anchoveta (Engraulis Ringens) Del Área De Talcahuano, Chile. Invest. Mar. 21, 3–21.
Cubillos L. A., Arcos D. F. (2002). Recruitment of Common Sardine (Strangomera Bentincki) and Anchovy (Engraulis Ringens) Off Central-South Chile in the 1990s and the Impact of the 1997–1998 El Niño. Aquat. Liv. Resour. 15, 87–94. doi: 10.1016/S0990-7440(02)01158-0
Cubillos L. A., Arcos D. F., Bucarey D. A., Canales M. T. (2001). Seasonal Growth of Small Pelagic Fish Off Talcahuano (37°S-73°W), Chile: A Consequence of Their Reproductive Strategy to Seasonal Upwelling? Aquat. Liv. Resour. 14. 2, 115–124. doi: 10.1016/S0990-7440(01)01112-3
Cubillos L. A., Bucarey D. A., Canales M. (2002). Monthly Abundance Estimation for Common Sardine Strangomera Bentincki and Anchovy Engraulis Ringens in the Central-Southern Area Off Chile (34°-40°s). Fish. Res. 57, 117–130. doi: 10.1016/S0165-7836(01)00340-X
Cubillos L. A., Ruiz P., Claramunt G., Gacitúa S., Nuñez S., Castro L., et al. (2007). Spawning, Daily Egg Production, and Spawning Stock Biomass Estimation for Common Sardine (Strangomera Bentincki) and Anchovy (Engraulis Ringens) Off Central Southern Chile in 2002. Fish. Res. 86, 228–240. doi: 10.1016/j.fishres.2007.06.007
Cury P., Roy C. (1989). Optimal Environmental Window and Pelagic Fish Recruitment Success in Upwelling Areas. Can. J. Fish. Aquat. Sci. 46, 670–680. doi: 10.1139/f89-086
DerSimonian R., Laird N. (1986). Meta-Analysis in Clinical Trials. Controlled Clin. Trial. 7. 3, 177–188. doi: 10.1016/0197-2456(86)90046-2
Frimodt C. (1995). “Multilingual Illustrated Guide to the World’s Commercial Coldwater Fish,” in Fishing News Books (Fishing News Books Ltd., Oxford UK:Osney Mead, Oxford).
Gilly W. F., Beman J. M., Litvin S. Y., Robison B. H. (2013). Oceanographic and Biological Effects of Shoaling of the Oxygen Minimum Zone. Annu. Rev. Mar. 5. Sci. 1, 393–420. doi: 10.1146/annurev-marine-120710-100849
Gulland J. A. (1966). Manual of Sampling and Statistical Methods for Fisheries Biology. Part 1. Sampling. Methods FAO Man. Fish. Sci. 3), 87 p.
Higgins J. P., Thompson S. G. (2004). Controlling the Risk of Spurious Findings From Metaregression. Stat Med. 23, 1663–1682. doi: 10.1002/sim.1752
Hjort J. (1914). Fluctuations in the Great Fisheries of Northern Europe Viewed in the Light of Biological Research. Rapp. Procès-Verbaux. Des. Rèunions. Du. Conseil. Permanent. Int. Pour. l’Exploration. La. Mer. 20, 1–228.
Iles T. D., Sinclair M. (1982). Atlantic Herring: Stock Discreteness and Abundance. Science 215, 627–633. doi: 10.1126/science.215.4533.627
Lasker R. (1975). Field Criteria for Survival of Anchovy Larvae: The Relation Between Inshore Chlorophyll Maximum Layers and Successful First Feeding. Fish. Bull. 73, 453–462.
Miller T. J., Skalski J. R., Ianelli J. N. (2007). Optimizing a Stratified Sampling Design When Faced With Multiple Objectives. ICES. J. Mar. Sci. 64, 97–109. doi: 10.1093/icesjms/fsl013
Nordmann A. J., Kasenda B., Briel M. (2012). Meta-Analyses: What They can and Cannot do. Swiss. Med. Weekly. 142, , w13518. doi: 10.4414/smw.2012.13518
O’Rourke K. (2007). An Historical Perspective on Meta-Analysis: Dealing Quantitatively With Varying Study Results. J. R. Soc. Med. 100, 579–582. doi: 10.1177/0141076807100012020
Pearson K. (1904). Report on Certain Enteric Fever Inoculation Statistics. BMJ 2, 1243–1246. doi: 10.1136/bmj.2.2288.1243
Plackett R. L. (1958). Studies in the History of Probability and Statistics: Vii. The Principle of the Arithmetic Mean. Biometrika 45, 130–135. doi: 10.1093/biomet/45.1-2.130
Thompson S. G., Higgins J. P. (2002). How Should Meta-Regression Analyses Be Undertaken and Interpreted? Stat Med. 21, 1559–1573. doi: 10.1002/sim.1187
Thompson S. G., Sharp S. J. (1999). Explaining Heterogeneity in Meta-Analysis: A Comparison of Methods. Stat Med. 18, 2693–2708. doi: 10.1002/(SICI)1097-0258(19991030)18:20<2693::AID-SIM235>3.0.CO;2-V
Yáñez E., Barbieri M. A., Montecinos A. (1990). “Relaciones Entre Variaciones Del Medio Ambiente Y Las Fluctuaciones De Los Principales Recursos Pelágicos Explotados En La Zona De Talcahuano, Chile,” in En. Perspectivas De La Actividad Pesquera En Chile. Ed. Barbieri M. A. (Valparaíso: Escuela de Ciencias del Mar), 49–62.
Keywords: Bayesian analysis, meta-analysis, meta-regression, pelagic fish, size structure, Araucanian herring
Citation: Aranis A, de la Cruz R, Montenegro C, Ramírez M, Caballero L, Gómez A and Walker K (2022) Meta-Estimation of Araucanian Herring, Strangomera bentincki (Norman, 1936), Biological Indicators in the Central-South Zone of Chile (32°–47° LS). Front. Mar. Sci. 9:886321. doi: 10.3389/fmars.2022.886321
Received: 28 February 2022; Accepted: 27 April 2022;
Published: 16 June 2022.
Edited by:
Célia M. Teixeira, Center for Marine and Environmental Sciences (MARE), PortugalReviewed by:
Vera Sequeira, Center for Marine and Environmental Sciences (MARE), PortugalMohammad Sadegh Alavi-Yeganeh, Tarbiat Modares University, Iran
Md Abu Hanif, Chonnam National University, South Korea
Copyright © 2022 Aranis, de la Cruz, Montenegro, Ramírez, Caballero, Gómez and Walker. This is an open-access article distributed under the terms of the Creative Commons Attribution License (CC BY). The use, distribution or reproduction in other forums is permitted, provided the original author(s) and the copyright owner(s) are credited and that the original publication in this journal is cited, in accordance with accepted academic practice. No use, distribution or reproduction is permitted which does not comply with these terms.
*Correspondence: Antonio Aranis, antonio.aranis@ifop.cl