
Municipal Wastewater Reuse: Is it a Competitive Alternative to Seawater Desalination?


Faculty of Engineering and Sciences, Universidad Adolfo Ibáñez, Av. Diagonal Las Torres 2640, Santiago 7941169, Chile
*
Author to whom correspondence should be addressed.
Sustainability 2021, 13(12), 6815; https://doi.org/10.3390/su13126815
Submission received: 28 April 2021
/
Revised: 4 June 2021
/
Accepted: 8 June 2021
/
Published: 16 June 2021
(This article belongs to the Special Issue Sustainable Wastewater Management and Treatment)
Abstract
:Water scarcity is becoming a global challenge to attempts to narrow the water demand–supply gap. To overcome this problem, it is sensible to consider alternative technologies that can exploit non-conventional water resources. The choice of such technologies should be, however, carefully analyzed, because any choice might be unfeasible from an economic point of view. In this work, a methodology to select the most appropriate non-conventional water resource, out of municipal wastewater and seawater, was proposed. Specifically, we attempted to determine which alternative provides cheaper water supply and production costs for domestic uses, depending on the wastewater treatment system used and the water plant capacity. The production of water under three scenarios was analyzed: (i) a city that has a conventional wastewater treatment plant (WWTP); (ii) a city that uses primary treatment and submarine outfalls to treat municipal wastewater; (iii) seawater desalination. The proposed methodology was tested in Chilean cities that are located in areas where water is a scarce resource. The results showed that the reuse of municipal wastewater represents a cost-competitive alternative to seawater desalination, mainly when municipal wastewater is treated in a conventional WWTP and when water flow demand is higher than 1500 m3/d. In contrast, seawater desalination becomes more profitable than wastewater reuse when the treatment of municipal wastewater is based on the use of submarine outfalls. This study provides a useful economic tool for promoting municipal wastewater reuse as a non-conventional water source for supplying water to cities that suffer from water scarcity in Chile and in similar areas of the world.
1. Introduction
Water scarcity has been recognized as a serious global issue of this century. At present, around 25% of the world’s population live in areas that experience water stress, and it is estimated that more than half of the global population will experience severe water scarcity in the coming years [1]. As the world’s population continues to grow and the impacts of climate change intensify, water shortages are expected to increase in the near future, particularly in arid and semi-arid regions [1,2]. In the context of water scarcity, it is imperative to use water more efficiently. However, this is not enough, and it is necessary to explore alternative and sustainable technologies to exploit non-conventional water resources (e.g., seawater, wastewater, rainwater, fog, among others) [3,4,5].
Among these alternative water supply technologies, membrane-based separation processes, particularly reverse osmosis, provide an opportunity to deal with water scarcity in many water-stressed regions around the world [6,7,8,9]. At present, seawater reverse osmosis dominates the desalination market; around 66 million m3/d were produced worldwide, which accounts for 69% of the total desalinated water [4]. Nevertheless, regardless of the success of this desalination process, it may be limited by the consumption of energy related to the filtration process and later water transportation costs [10,11]. In this context, it is recognized that reverse osmosis is an energy-intensive process, especially when desalinating seawater [12,13,14], but continued improvements, such as energy recovery or coupling membrane systems with renewable energy sources, have allowed a reduction in economic costs, thus making it more economically viable [10,15,16]. The typical production costs of seawater desalination are between 0.45 and 2.5 USD/m3 (excluding the costs of water transportation) for desalination plant capacities between 60,000 and 1000 m3/d, respectively, and it is expected that these costs will reduce by around 20% over the next 5 years and by more than half in the next 20 years [16,17,18].
Furthermore, the produced water must be transported from the production facility to the water use site (e.g., water purification plant), and it may be expensive to transport water across long-distances [14]. In fact, when water demand sites are located far away to the coast and/or at high altitudes, exploiting other conventional or non-conventional water resources may be more economical than obtaining water from the sea (Table 1) [9,19]. Therefore, water transportation costs can significantly contribute to total water production costs, affecting the economic viability of the seawater desalination process [11,14,20]. Thus, the total costs to produce water are one of the most critical factors that influence the implementation of these kind of projects [21,22], and these costs depend on several factors, such as plant production capacity, the quality of feedwater, technology, the location of water plants, energy costs, plant lifetime, among others [9,16,23]. In fact, most previous studies have reported a wide range of water production costs because they have been developed for a particular water demand site with a specific plant capacity, water production technology, and feedwater, and consequently these costs were restricted to the particular conditions in which they were determined, which can make it difficult to compare among them.
Taking into account that about 66% of the global urban population lives in urban centers bordering the ocean [14,16,24], the potential implementation of seawater desalination plants is therefore especially significant. However, it may not be a viable solution for water-stressed regions that are located a long distance from the coast or at a high altitude [9,24]. The reuse of municipal wastewater could be a viable alternative to address water scarcity for these cases [6,14,25]. In this context, there are already European countries that reuse treated wastewater for non-potable and potable uses [2]. The conventional treatment of municipal wastewater is usually based on primary treatment followed by secondary treatment, which usually involves a biological process to remove organic matter from wastewater, in order to meet the standards needed for its discharge. In order to reuse treated municipal wastewater, a tertiary treatment (e.g., membrane-based separation processes) is needed to remove the remaining pollutants from secondary treated effluent, such as inorganic and organic compounds, pathogens, or nutrients, in order to meet water standards [26]. The reuse of municipal wastewater allows for an increase in the water supply flow rate, but its additional costs, consisting of both the extra treatment needed to reach the water quality requirement and the transportation of the produced water to the reuse site, should be considered.
Based on this background, this work proposed a methodology to select the most appropriate non-conventional water resource between municipal wastewater and seawater. Specifically, we consider which alternative provides a cheaper water supply for domestic uses, particularly in water-stressed regions. The proposed methodology was tested in Chilean cities that are located in areas where water is a scarce resource. Chile was chosen as the subject of this research because it is one of the countries most vulnerable to the impacts of climate change, due mainly to its geographical location. At present, water scarcity is one of the most significant effects of climate change in several regions of Chile, particularly in the northern and central regions, and it is expected that their water demand will increase significantly over the next decades [27]. Several desalination plants have been implemented to supply water for domestic and/or industrial uses in the north of the country in recent years [28,29], where water shortages are more severe. However, as previously mentioned, the economic feasibility of these desalination projects is limited by the costs associated with water transportation, particularly for cities located in inland areas, where the industrial sector (e.g., mining) is only able to pay these water costs, causing important socio-economic conflicts related to water use [30]. Therefore, it is necessary to explore more economical water supply options for domestic use—for instance, the reuse of municipal wastewater.
This paper contributes to the current literature by proposing a novel methodology that helps to select, from an economic point of view, the most appropriate non-conventional water resource, between municipal wastewater and seawater, to supply water, when assessing the implementation of water production projects.
2. Materials and Methods
2.1. Proposed Scenarios
Three scenarios to produce water from municipal wastewater and seawater are proposed in this work:
- (a)
- Scenario 1. This scenario is based on a city whose wastewater is treated by a WWTP with both primary and secondary treatments. In this case, a post-treatment of the WWTP effluent would be implemented by means of a hybrid ultrafiltration (UF) and reverse osmosis (RO) system. First, the secondary treated effluent is passed through the UF membrane to remove particles and colloids and then through RO membrane to remove the remaining pollutants. It was considered that UF and RO membranes are periodically cleaned using reagents to maintain a suitable pressure drop. The recovery ratio was set to 70% in relation to the inlet wastewater volume [31].
- (b)
- Scenario 2. This scenario is based on a coastal city whose wastewater is treated by a primary treatment and its effluent is sent to sea by means of a submarine outfall. For this reason, in this proposed scenario, the construction of an activated sludge unit followed by a hybrid UF-RO system was considered.
- (c)
- Scenario 3. This scenario involves the complete implementation of a seawater desalination plant based on the reverse osmosis process. The recovery ratio of the reverse osmosis system was set to 50% in relation to the initial volume of the feedwater (seawater) [14].
2.2. Methodology for Economic Assessment
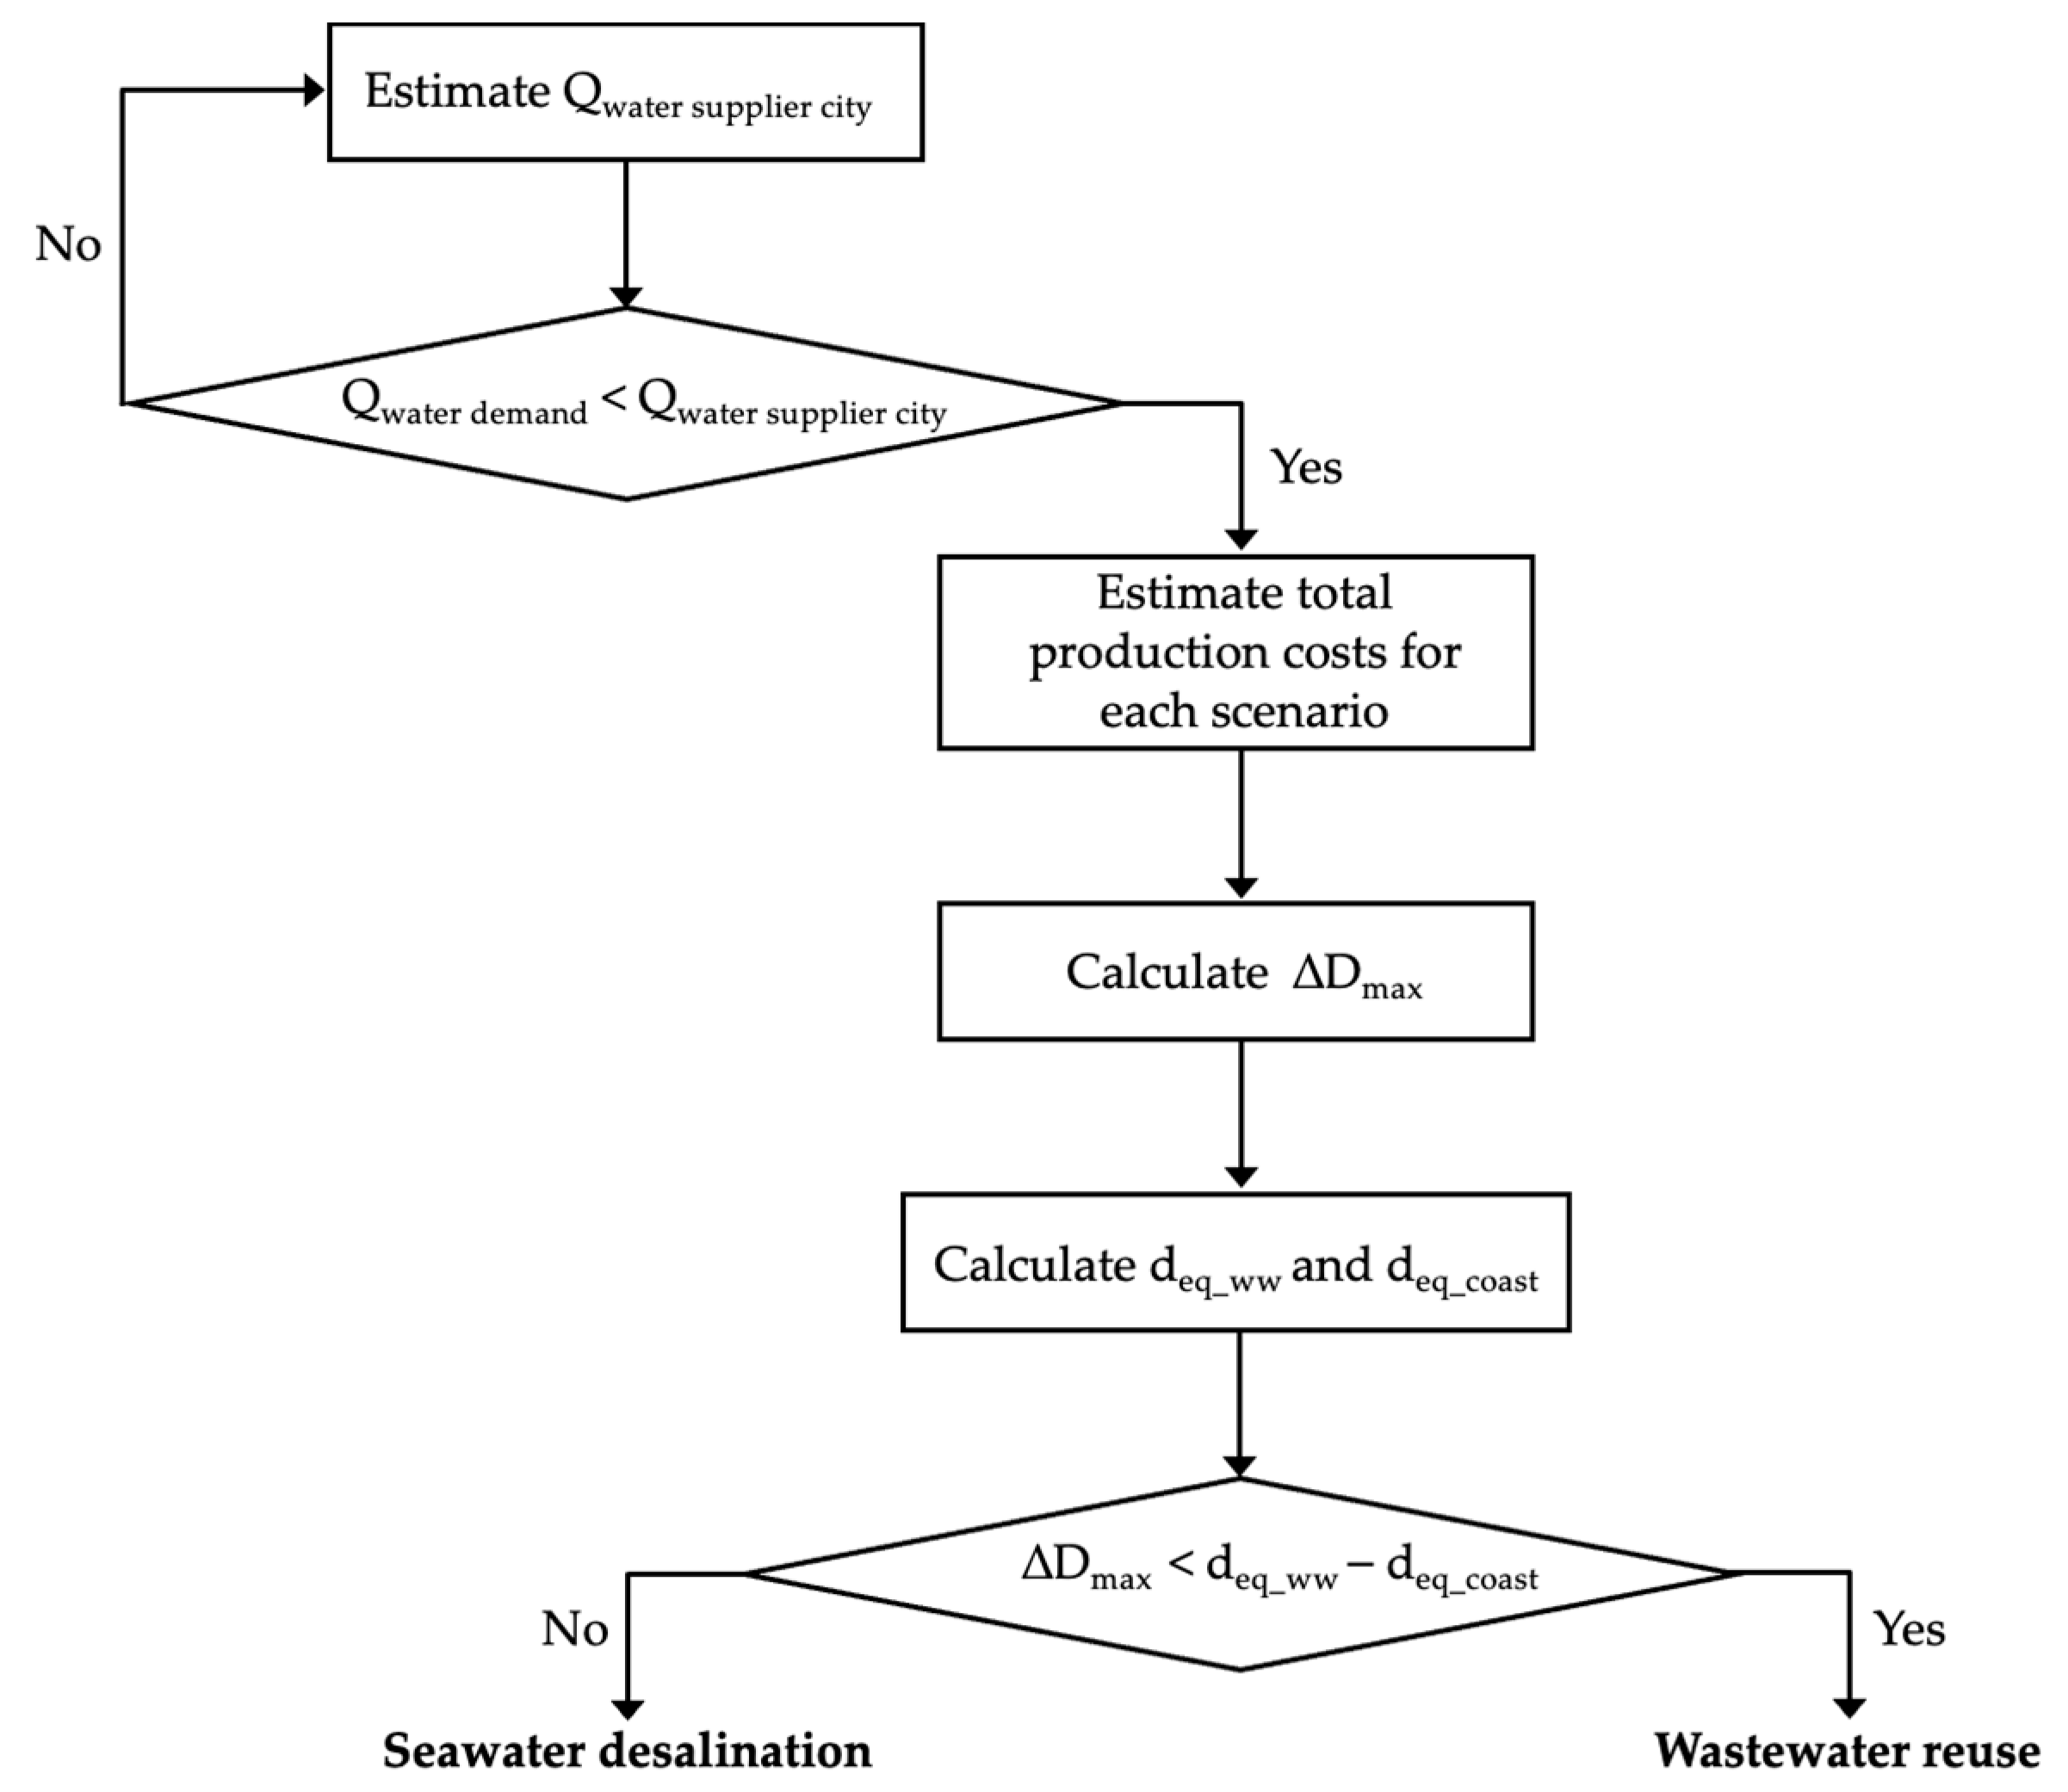
The proposed methodology to determine the best option to supply water to the water-demanding city was schematically outlined throughout the following steps. Figure 1 illustrates the methodology proposed in this work.
- The required water flow rate was calculated. The annual flow of the water demand (m3/year) of the studied city was estimated based on its population and water consumption (m3/cap/year).
- The total water production costs (USD/m3) for the proposed scenarios were estimated. First, total production costs were calculated based on the total capital costs (CAPEX) and the operating and maintenance costs (OPEX) (Equation (1)).
The total capital costs and the operating and maintenance costs for each scenario are detailed below:
- (a)
- Scenario 1. The total capital costs included the cost related to the purchase of equipment (UF and RO units), the required equipment for piping, instrumentation/electricity, engineering costs and civil works (Table 2). The operating and maintenance costs included energy consumption, reagents consumption, membrane replacement, and maintenance and labor costs (Table 2). The capital costs and operating and maintenance costs related to the UF-RO system were calculated using cost functions that were developed based on the data reported by Plumlee et al. (2014) [32].
- (b)
- Scenario 2. The total capital costs included costs related to the construction or purchase of the equipment (activated sludge system, UF and RO units) and the required equipment for piping, instrumentation/electricity, engineering costs, and civil works (Table 2). The costs associated with the operation of the activated sludge system were energy and reagents consumption, labor, waste management and maintenance. The total capital costs and operating and maintenance costs for the UF-RO system included the items described for scenario 1 (Table 2). The total capital costs and operating and maintenance costs of the activated sludge were calculated based on the data reported by Guo et al. (2014) [33] and Molinos-Senante et al. (2010) [34], respectively.
- (c)
- Scenario 3. The total capital costs for the desalination plant included 5 cost items, which were construction and infrastructure costs (main equipment, piping, instrumentation/electricity, among others), land acquisition costs, engineering costs, and development and management costs (Table 2). The operating and maintenance costs included energy consumption, membrane replacement, maintenance, reagents consumption and labor costs (Table 2). Based on the salinity concentration and average temperature of the coast of Chile, around 35,000 ppm and 17 °C, respectively [35], it was assumed that the energy consumption of seawater desalination was 3.5 kWh/m3. The capital costs and operating and maintenance costs were estimated using cost functions that were developed based on the results reported by Molinos-Senante and González (2019) [35]. The cost functions and the economic parameters for the proposed scenarios are given in Table 2. The price of electricity was set at 0.109 USD/kWh [36]. All costs used in this work were normalized to the USD of 2019.
Then, the minimum cost of produced water that makes the net present value (NPV) zero (Equation (2)) for the proposed scenarios was calculated:
where: Bt are the benefits due to the water sale, Ct is the sum of the operating and maintenance costs, i is the inflation rate (3%), r is the interest rate (5%), and T is the payback time (20 years).
- 3.
- The best scenario to produce water was determined. A pairwise comparison in terms of the total production costs for the proposed scenarios was developed in order to determine the most profitable scenario. The total production costs for the proposed scenarios were compared and used to estimate the maximum distance that produced water can be transported from the water plant production to the water demand city if the cheaper scenario were selected. This distance (ΔDmax) was expressed as a function of the total production costs (USD/m3), the transportation costs for horizontal distance (a, 0.05 USD/m3/km/year) and the lifetime of the facility (t, 20 years) (Equation (3)). The transportation costs, a, was determined as a function of the piping and pumping costs for the horizontal distance, using the data reported by Caldera et al. (2018) [11] and ESCWA (2009) [37]. It should be noted that scenarios 1 and 2 have not been compared among them because it is only possible to implement one of these scenarios for a particular city, and their selection depends on the actual wastewater treatment system.
- 4.
- The selection of possible water sources for the studied city was carried out. Once the suitable scenario was determined, the selection of the potential water sources was developed based on the flow rate of water that would be supplied and the distance between the water source and water demand site. It should be noted that water transportation distance is comprised of the horizontal and vertical distances, respectively, and they have a different impact on the water production cost. Vertical distance has a larger impact on water transportation costs than horizontal distance [19], and thereby an equivalent distance from the water source to water demand site for wastewater reuse scenarios (deq_ww) and seawater desalination (deq_coast) was determined (Equation (4)):where: X and Y are the horizontal and vertical distances (km) from the water source to the water demand site, and a and b are the transportation costs for horizontal and vertical distances, 0.05 and 1.82 USD/m3/km/year, respectively. The values of a and b were determined as a function of the piping and pumping costs for the vertical and horizontal distances, respectively, and were calculated based on the data reported by Caldera et al. (2018) [11] and ESCWA (2009) [37]. The horizontal and vertical distances between the water source and water demand site were determined using Google Earth Pro.
- 5.
- Finally, the best option to supply water to the water-demanding city was selected based on the maximum distance that produced water can be transported from the water plant production to the water-demanding city (ΔDmax), and the equivalent distance that water should be transported was obtained for the potential water sources. Therefore, if ΔDmax > (deq_ww − deq_coast), the reuse of wastewater is more favorable than seawater desalination. In contrast, if ΔDmax < (deq_ww − deq_coast), the desalination of seawater is more economical than wastewater reuse.
2.3. Case Study
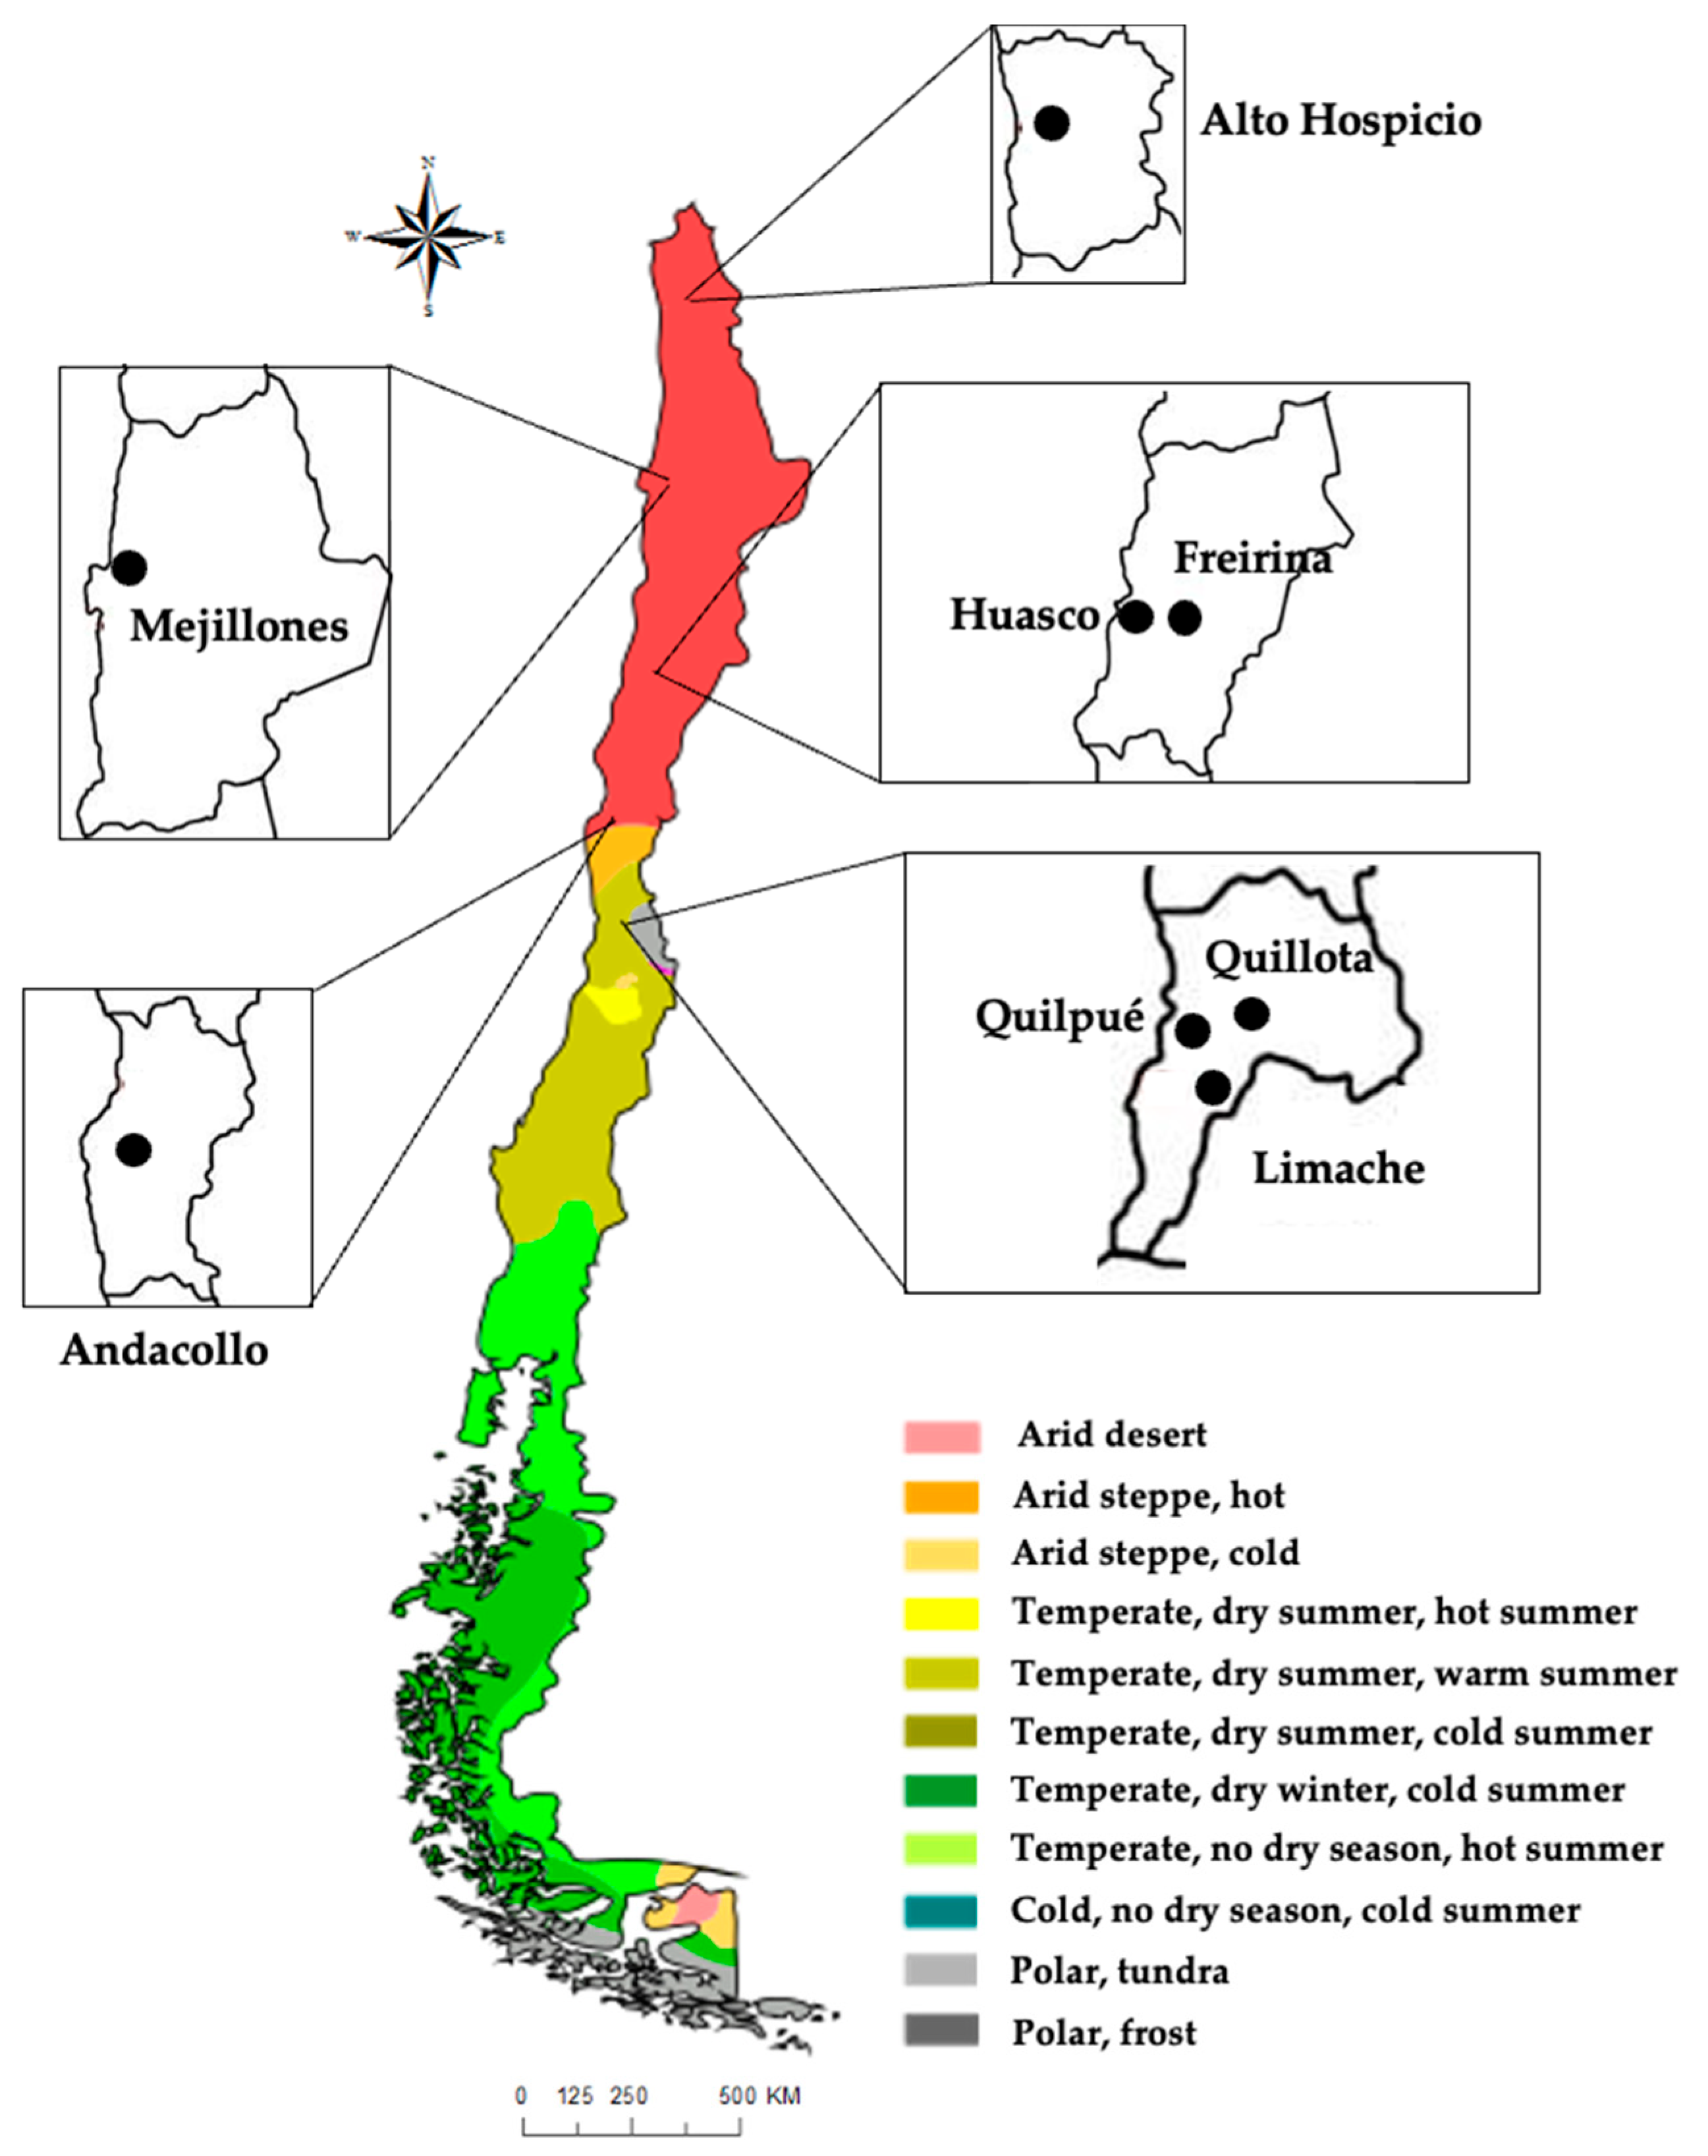
Chile is a developing country that experiences great climatic variation throughout the country, and consequently, it has a highly unequal water distribution, with the northern regions being mostly arid and semi-arid areas and the south regions being temperate, ranging from Mediterranean to marine west coast areas [38]. The northern and central regions of Chile are economically and socially important due to the development of the main economic activities, mining and agriculture activities. However, water scarcity has been an important issue for these regions over the last decade. A sample of 8 Chilean cities was used to validate the methodology proposed in this work. These cities are located in the north and central regions of the country (Figure 2), where water scarcity is more accentuated [39].
Two types of municipal wastewater treatment configurations can be differentiated in the wastewater treatment system of Chile: wastewater treatment plants that use primary settling followed by a biological treatment (hereafter referred to as conventional WWTP); and those that use submarine outfalls preceded by preliminary treatment for sanitary discharge (hereafter referred to as submarine outfalls WWTP). As previously mentioned, it was assumed that the recovery ratio to produce water from municipal wastewater was set at 70%, and thereby the reuse of municipal wastewater in the same city was not studied in this work because the produced water would not be sufficient to meet its water requirements. Therefore, the production and transportation of produced water to a nearby city which suffers from water stress was the strategy studied for these Chilean cities.
3. Results and Discussion
3.1. Cost Associated with Water Production
Based on the production plant capacity, the capital costs and operating and maintenance (O&M) costs to produce water flow rates between 500 and 100,000 m3/d were calculated for each proposed scenario (Table 3). As expected, as water production capacity decreased, capital and operating and maintenance costs increased, regardless of the proposed scenario. Overall, the production of water from municipal wastewater by the use of the UF-RO system (scenario 1) was found to be less capital-intensive than seawater desalination, for water production capacities higher than 5000 m3/d (Table 3). However, for the studied range of water production capacities, the capital costs of desalinated seawater were far lower than the cost to produce water from municipal wastewater by the implementation of an activated sludge unit followed by a hybrid UF-RO system (scenario 2) (Table 3).
Regarding the reuse of municipal wastewater, the capital costs were mainly given by the UF and RO equipment for scenario 1, regardless of the plant capacity. These items represented around 25% and 49% of the total capital costs, respectively. The other items of capital costs (i.e., yard piping, sitework landscaping, site electrical and controls) represented around 26% of the overall capital costs for this scenario. If they are standardized considering the water production capacity, values of 0.07 and 1.66 USD/m3 are obtained for plant capacities of 100,000 and 500 m3/d, respectively (Table 3). Meanwhile, for scenario 2, in which an activated sludge system followed by a hybrid UF-RO system to treat wastewater was studied, capital costs were distributed mainly among the activated sludge system (39%), the UF (20%), and the RO (41%) units. For this scenario, the standardized total capital costs were between 0.14 and 1.80 USD/m3, ranging in size from 100,000 to 500 m3/d, respectively (Table 3). Finally, for the implementation of seawater desalination for producing water, the most relevant items in the total capital costs were the construction and infrastructure costs. For this scenario, the unitary total capital costs ranged between 0.14 and 1.03 USD/m3 for water plant capacities of 100,000 and 500 m3/d, respectively (Table 3). The capital costs for the proposed scenarios are shown in Tables S1–S3 in the Supplementary Material.
Regarding operating and maintenance costs, they increased as the water production capacity decreased, regardless of the proposed scenario (Table 3). For scenario 1, the operating and maintenance costs ranged from 0.26 to 0.46 USD/m3 for water plant capacities of 100,000 and 500 m3/d, respectively. The consumption of energy and reagents were the most expensive items in the operating and maintenance costs, comprising around 34% and 42% of the total operating and maintenance costs, respectively, for this scenario. Meanwhile, the operating and maintenance costs estimated for scenario 2 were around 1.5 times higher than those of scenario 1. They were 0.45 and 0.64 USD/m3 for water production capacities of 100,000 and 500 m3/d, respectively (Table 3). The costs related to the operation of activated sludge contributed around 40% of the overall operating and maintenance costs, while energy and reagents consumption represented around 25% and 20% of these costs, respectively.
Moreover, the operating and maintenance costs for scenario 3 (seawater desalination) were similar to those obtained for the implementation of an activated sludge and UF-RO system to produce water from municipal wastewater. These costs were 0.45 and 0.49 USD/m3 for desalination plant capacities of 100,000 and 500 m3/d, respectively (Table 3), and the consumption of energy accounted for approximately 68% of the operating and maintenance costs. The costs associated with the membrane replacement and reagents consumption were other important items in the operating and maintenance costs, representing around 18% and 9% of these costs, respectively. Recently, literature has reported that operating and maintenance costs for seawater desalination plants are between 1.21 and 1.12 USD/m3 for plant production capacities ranging from 1000 to 10,000 m3/d, and they are in the range of 1.04 and 0.30 USD/m3 for desalination plant capacities between 15,000 and 100,000 m3/d [14,35].
Thus, these results indicated that the operating costs to produce water from municipal wastewater were lower than those estimated for seawater desalination, if the wastewater treatment system is based on primary settling followed by a biological treatment (scenario 1). The operating and maintenance costs for the proposed scenarios are shown in Tables S4–S6 in the Supplementary Material.
3.2. Economic Analysis
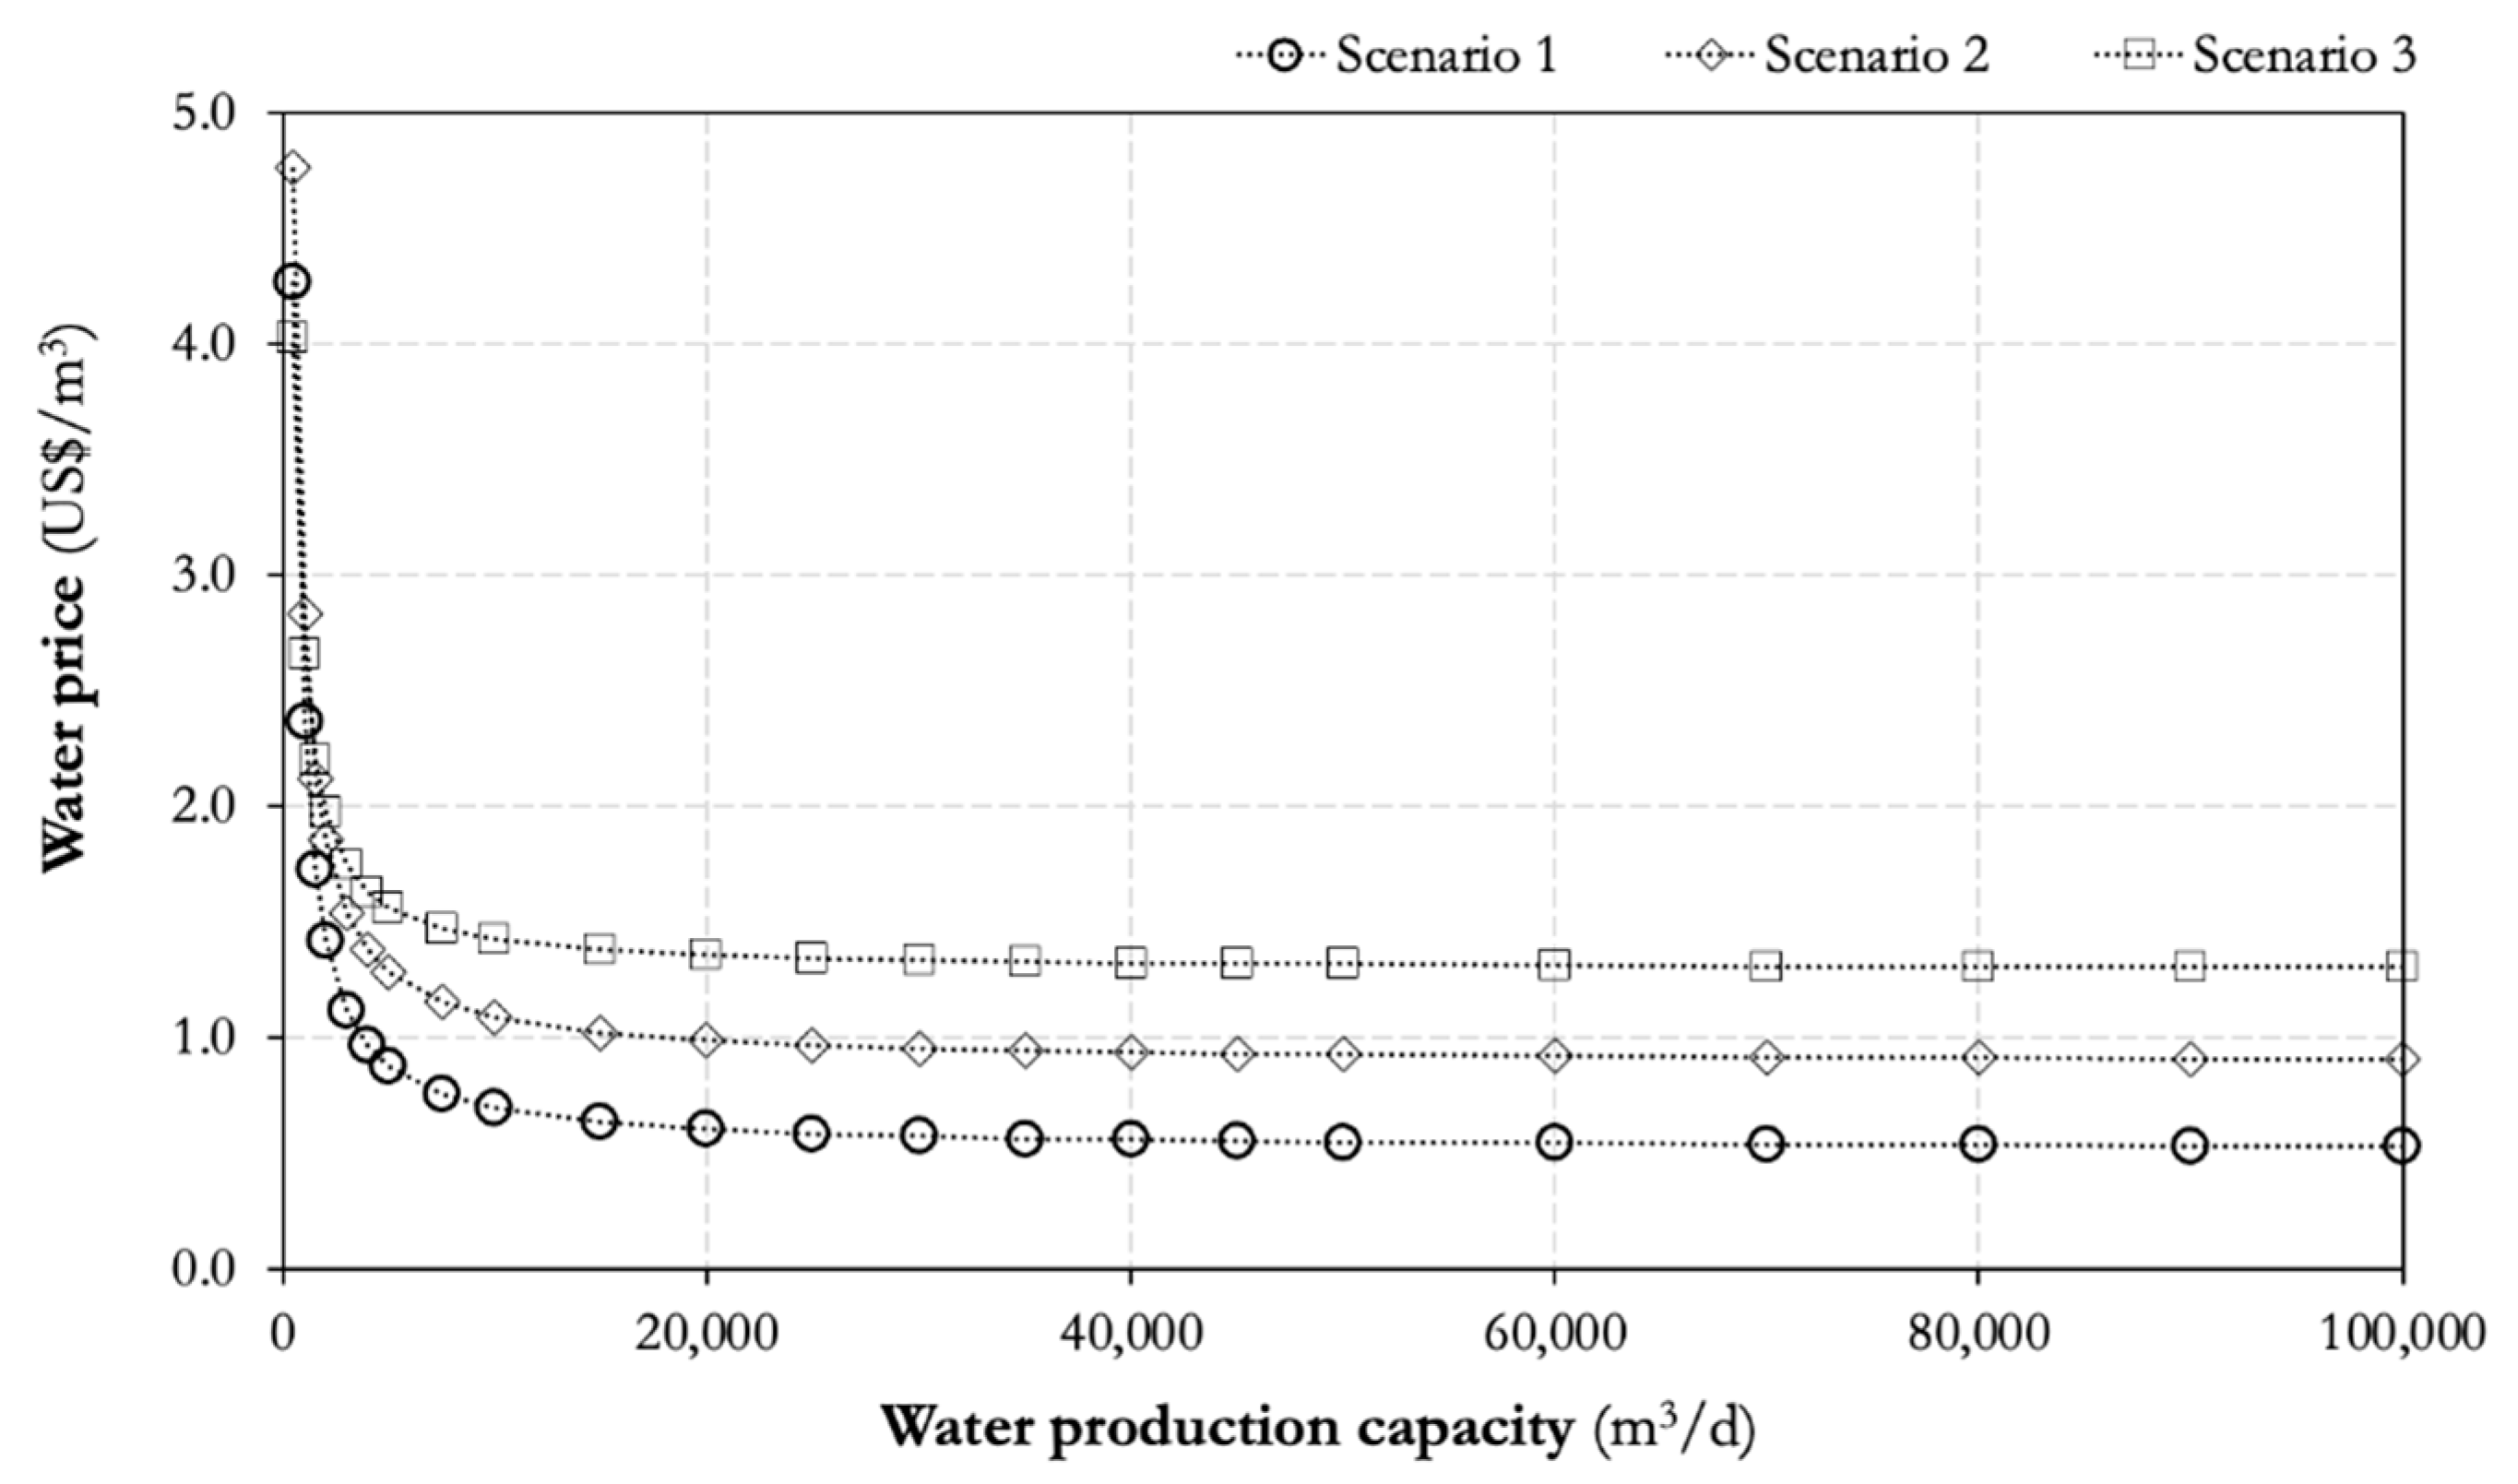
In order to compare the results obtained for the proposed scenarios, the total production costs and the minimum price of the produced water were determined. Overall, the results indicated that these decreased with an increasing plant production capacity, regardless of the used feedwater (Table 3 and Figure 3). In this regard, the total production costs of the desalinated water were between 0.59 and 1.52 USD/m3 for desalination plant capacities of 100,000 and 500 m3/d, respectively. Meanwhile, for the use of municipal wastewater as feedwater, the total water production costs were between 0.33 and 2.12 USD/m3 for scenario 1, and they ranged from 0.59 to 2.44 USD/m3 for scenario 2 for production plant capacities of 100,000 and 500 m3/d, respectively (Table 3). Different wastewater treatment costs can be found in the literature ranging from 0.40 and 1.26 USD/m3, which can be associated with different combinations of tertiary treatments, such as coagulation-flocculation, filtration, ultrafiltration, disinfection, reverse osmosis, among others [40,41,42,43,44]. Among these studies, Fundación Chile (2016) [44] evaluated the reuse of municipal wastewater from submarine outfalls WWTPs for agricultural activities. These authors reported operating costs ranging from 0.79 to 1.02 USD/m3, including water transportation costs. However, these authors did not indicate the technologies that were being considered to replace the current wastewater treatment system. This wide range of potential used technologies prevents the comparison of these obtained values with the previously reported ones. In any case, the total costs obtained in this work are within this range.
Furthermore, the price at which produced water would have to be sold in order to recover the internal costs of the project for the conventional WWTP ranged between 0.53 and 4.27 USD/m3 for production plant capacities of 100,000 and 500 m3/d, respectively. Meanwhile, this was found to range between 0.91 and 4.77 USD/m3 for the production of water from a submarine outfalls WWTP with plant capacities of 100,000 and 500 m3/d, respectively. The minimum price of the produced water was also calculated for the scenario where seawater desalination was evaluated, obtaining values ranging from 1.30 to 4.03 USD/m3 to produce water, for plant capacities of 100,000 and 500 m3/d, respectively (Figure 3). Therefore, results would indicate that WWTP retrofitting would be more favorable than the implementation of seawater desalination when the city has conventional WWTP to treat its wastewater rather than a submarine outfalls WWTP.
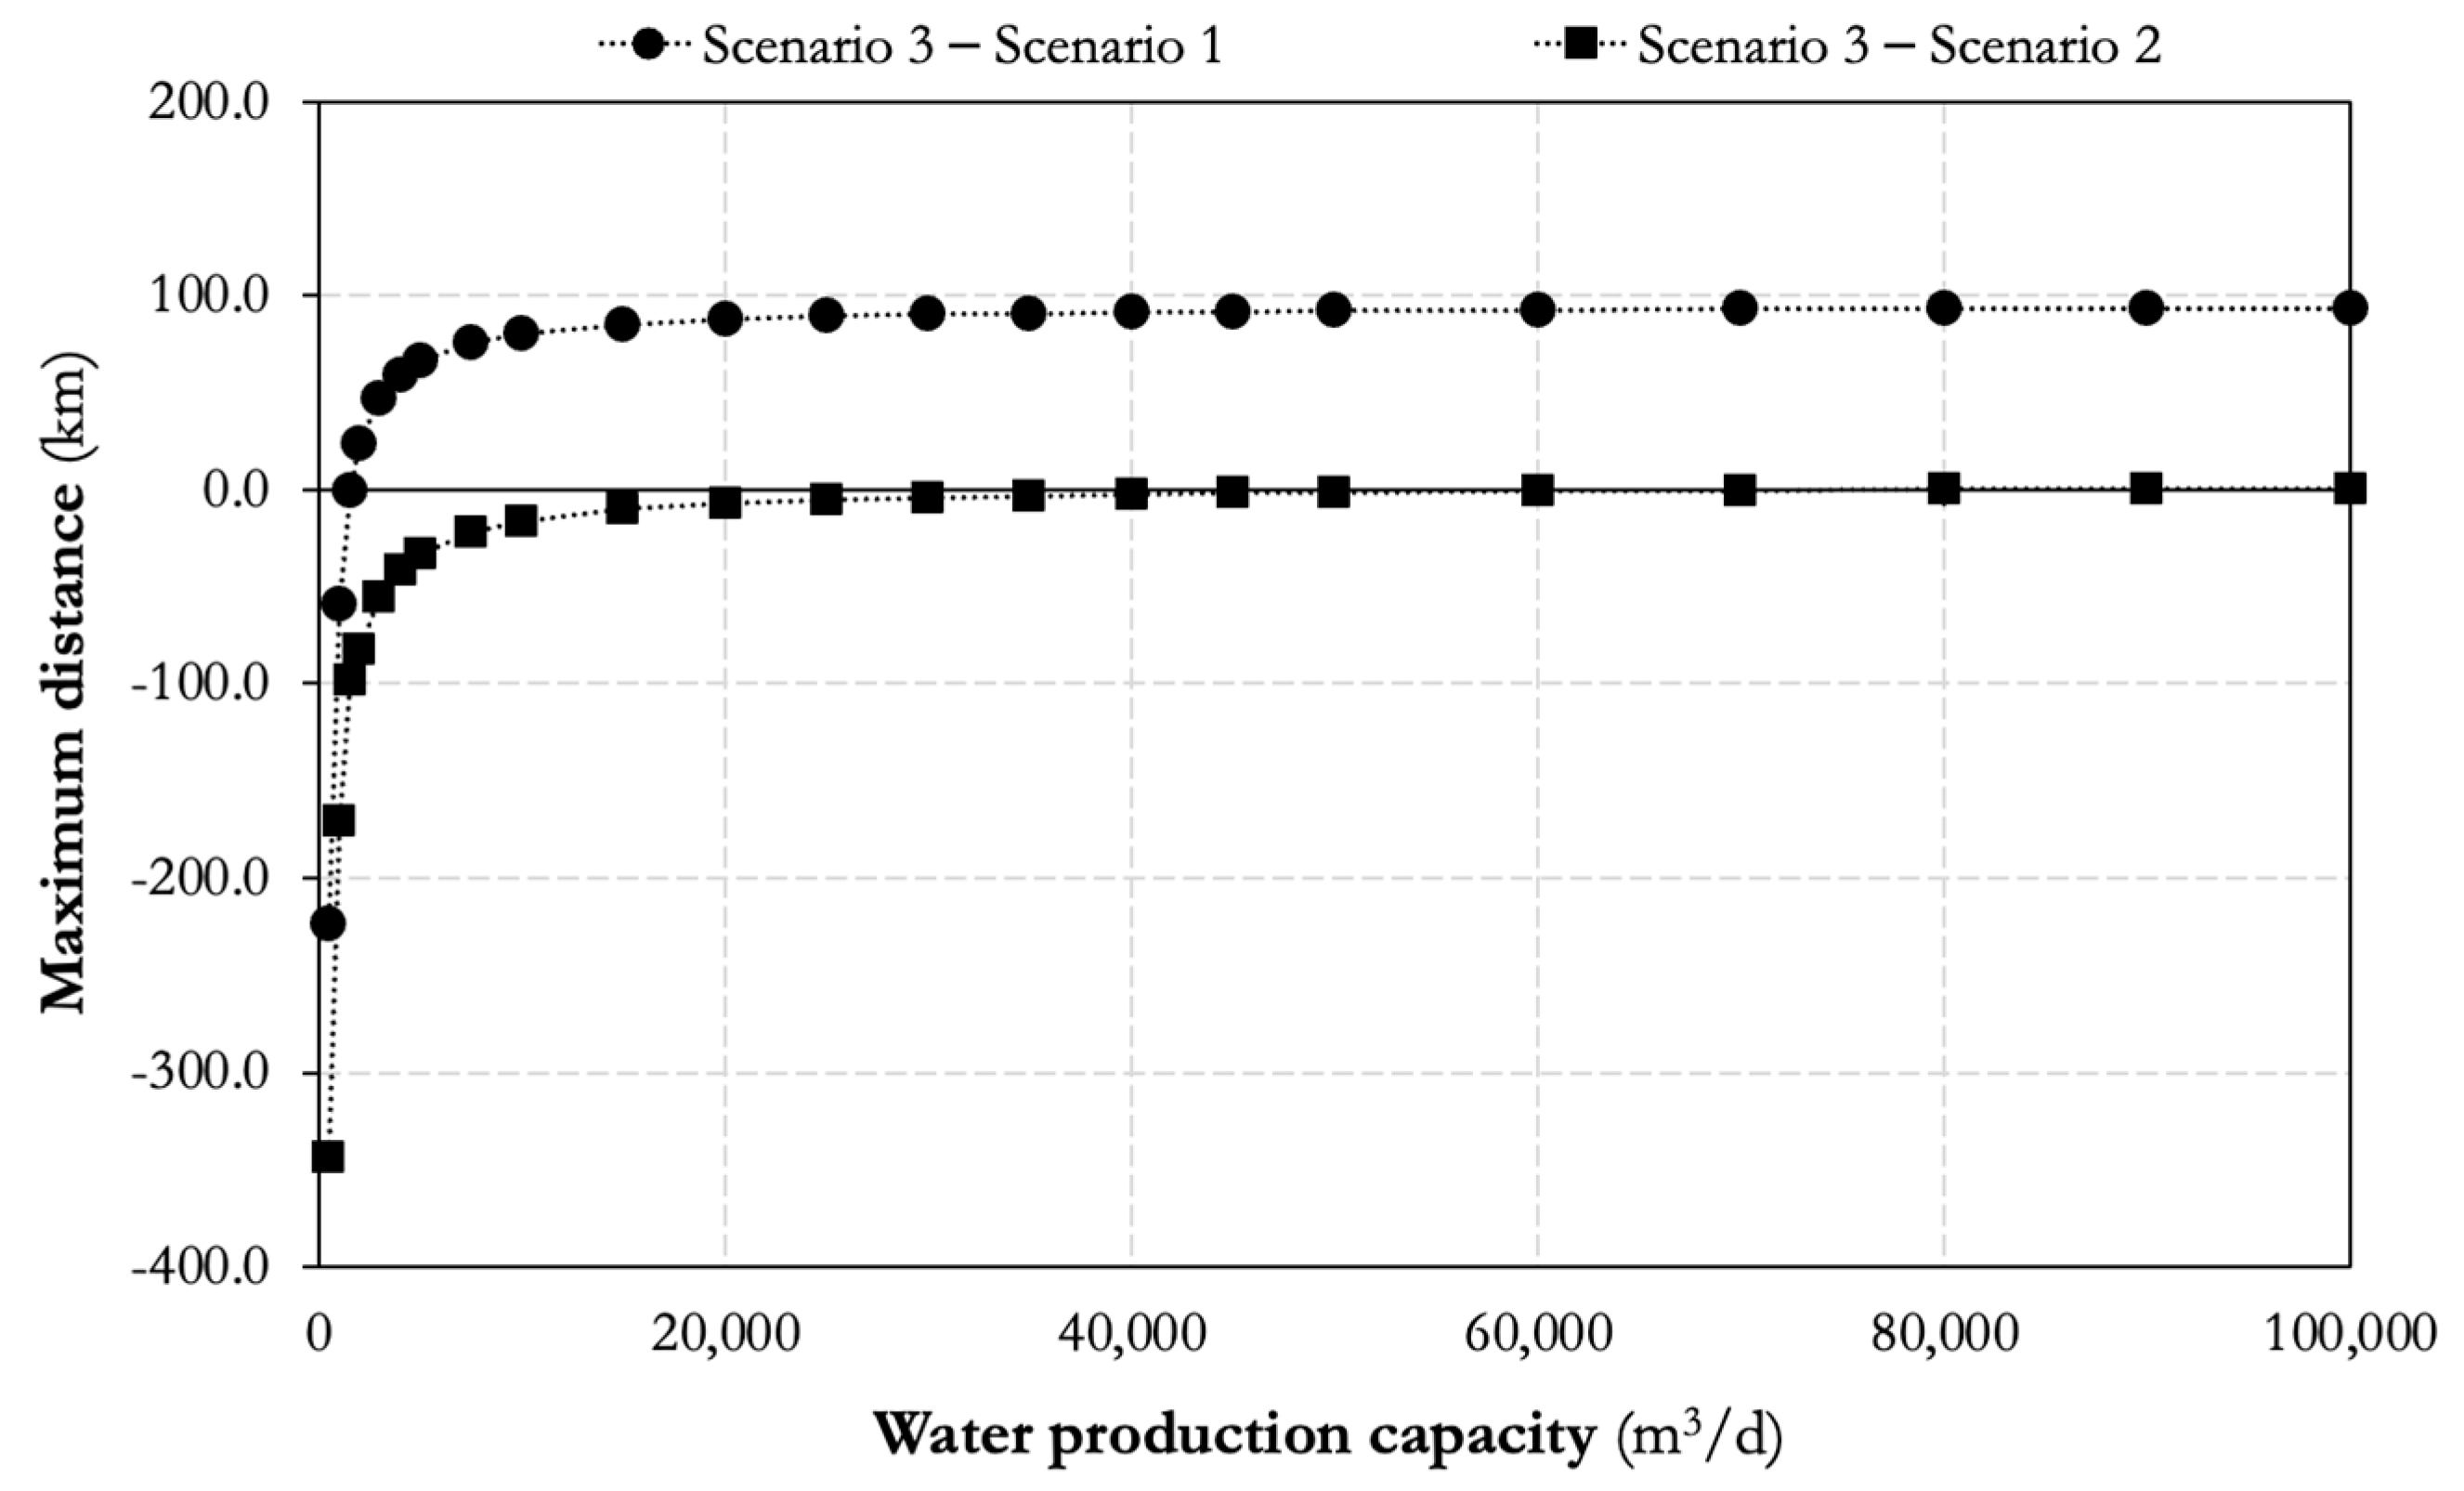
Therefore, the production of water from municipal wastewater by a UF-RO system (scenario 1) may be an attractive alternative to seawater desalination for water plant capacities higher than 1500 m3/d. In addition, for these cases, the reuse of wastewater would result in an opportunity cost that allows for the transportation of produced water from the water production facility to the water demand site (Table 3 and Figure 4). Nevertheless, if an activated sludge unit followed by a hybrid UF-RO system (scenario 2) is implemented to produce water from municipal wastewater, seawater desalination becomes more profitable than the reuse of municipal wastewater for production plant capacities lower than 70,000 m3/d. In this case, the selection of seawater desalination instead of the reuse of wastewater allows for the production of water and its transport to the water demand site (Figure 4). It should be noted that the maximum distance that produced water can be transported will depend on the water flow to be supplied (Figure 4).
3.3. Water Production from Non-Conventional Water Resources: Case Studies from Chile
Here, we illustrate the use of the proposed methodology in eight different cities of Chile that are placed in regions that are prone to suffer from water stress (Figure 2), and they, collectively, represent a sample of water security problems that can be found in arid, semi-arid or Mediterranean areas of fast-growing economies. These cities are located near to the coast or in inland areas, and their water demand is between 1033 and 33,659 m3/d (Table 4 and Figure 2). The production of water, either by the reuse of municipal wastewater or by the desalination of seawater to provide water for these Chilean cities was studied.
As shown in Table 4 and Table 5, results indicated that the production of water from conventional WWTP is an attractive alternative to seawater desalination for water production capacities ranging from 2200 to around 24,000 m3/d, regardless of the distance between the coast and the city. For these cities, the reuse of municipal wastewater allows for the transport of produced water for a maximum distance between 32.4 and 89.0 km, respectively (Table 4 and Figure 5). For instance, for the city of Alto Hospicio, cities located within an equivalent distance of 86.1 km from this city could be candidates for the position of their water supplier. Therefore, the reuse of the municipal wastewater generated in the city of Iquique could be a potential water supplier city because it is located at a distance of around 22.4 km from Alto Hospicio. However, the reuse of municipal wastewater would not be a good option for cities with a water flow demand lower than 2200 m3/d. In this regard, the city of Freirina has a water flow demand of around 1000 m3/d, so seawater desalination would be the appropriate scenario for the supply of water to this city (Table 4). As previously mentioned, the desalination of seawater becomes more profitable than municipal wastewater reuse at low water flows (production plant capacity < 1500 m3/d) (Table 4 and Table 5). Moreover, seawater desalination would be more profitable to produce water than wastewater reuse when the city uses submarine outfalls WWTP to treat municipal wastewater, regardless of the water flow demand (Table 4 and Table 5). As shown in Table 4, the maximum distance that desalinated water can be transported is between 46.3 and 65.9 km for cities with water flows ranging between 2000 and 3000 m3/d. It should be noted that these cities are located near to the coast (distance from the coast < 1 km), and this transport distance decreases with an increasing water plant capacity as well as an increasing distance from the coast (Table 4 and Figure 5).
The minimum price of the produced water would range from 0.63 to 1.31 USD/m3 for cities supplied by the water produced from municipal wastewater, and it would be between 1.37 and 2.66 USD/m3 for the cities where seawater desalination is used to supply the demanded water (Table 5). It should be noted that the estimated price of water supplied by municipal wastewater is lower than the current market price in Chile, which is between 1.09 and 3.20 USD/m3 [45]. Meanwhile, the price to produce water from seawater desalination is within the current range of Chilean prices. Thus, the results indicated that the reuse of municipal wastewater would be more economical to produce and supply water compared to the desalination of seawater for water flow demands higher than around 2000 m3/d, particularly for cities that use conventional WWTP to treat municipal wastewater.
Therefore, these results fit quite well with the expected results. Thus, it can be inferred that the proposed methodology should be useful in deciding on the best non-conventional water resource, between seawater and municipal wastewater, to supply water to cities that suffer from water stress. Additionally, it is important to note that the scenarios proposed in this work should be evaluated according to the local characteristics of the regions where these water production systems will be installed.
4. Conclusions
Even when seawater desalination has considerable water supply potential, particularly for countries like Chile due to its abundance and availability, the reuse of municipal wastewater represents an economical alternative to seawater desalination for the production of water. In this regard, the retrofitting of conventional WWTPs in order to reuse municipal wastewater can be more profitable than seawater desalination for water plant capacities higher than 1500 m3/d. In contrast, when the treatment of municipal wastewater is based on the use of submarine outfalls, seawater desalination becomes more profitable than wastewater reuse for the production of water flow rates lower than 70,000 m3/d.
From a policy perspective, the proposed methodology should be of great interest to water authorities interested in promoting municipal wastewater reuse as a non-conventional water source for the supplying of water to cities that are located in water scarce areas.
Moreover, it should be noted that the reuse of municipal wastewater in the same city has not been considered in the proposed methodology. This methodology is based on the reuse of municipal wastewater from nearby cities that generate wastewater flows higher than the water required for the water-demanding site. Hence, future research on this issue should focus on including the reuse of municipal wastewater from more than one city (e.g., from nearby cities and from the same city) in order to meet the water requirements of the water-demanding site. Additionally, other local non-conventional water resources, such as rainwater and fog, could be included as feedwater to produce water in this methodology.
Supplementary Materials
The following are available online at https://www.mdpi.com/article/10.3390/su13126815/s1, Table S1: Capital costs to produce water from municipal wastewater by a UF-RO system (scenario 1), Table S2: Capital costs to produce water from municipal wastewater by an activated sludge unite followed by a UF-RO system (scenario 2), Table S3: Capital costs to produce water by the desalination of seawater (scenario 3), Table S4: Operating and maintenance costs to produce water from municipal wastewater by a UF-RO system (scenario 1). Table S5: Operating and maintenance costs to produce water from municipal wastewater by an activated sludge unite followed by a UF-RO system (scenario 2), Table S6: Operating and maintenance costs to produce water by the desalination of seawater (scenario 3).
Author Contributions
Conceptualization, J.L.C. and D.C.; methodology, D.C. and J.L.C.; writing-original draft preparation and performed the calculations, D.C.; data analysis, D.C. and J.L.C.; writing-review and editing, D.C. and J.L.C. All authors contributed to the writing and proofreading of the paper. All authors have read and agreed to the published version of the manuscript.
Funding
This research was funded by Universidad Adolfo Ibáñez and the Chilean Government through the Projects ANID/FONDECYT/1200850 and CRHIAM Centre grant number ANID/FONDAP/15130015.
Institutional Review Board Statement
Not applicable.
Informed Consent Statement
Not applicable.
Data Availability Statement
Not applicable.
Conflicts of Interest
The authors declare no conflict of interest.
References
- UN (United Nations Water). World Water Development Report 2019. Available online: https://unwater.org/publications/world-water-development-report-2019/ (accessed on 4 February 2021).
- Voulvoulis, N. Water reuse from a circular economy perspective and potential risks from an unregulated approach. Curr. Opin. Environ. Sci. Health 2018, 2, 32–45. [Google Scholar] [CrossRef]
- Hussain, M.I.; Muscolo, A.; Farooq, M.; Ahmad, W. Sustainable use and management of non-conventional water resources for rehabilitation of marginal lands in arid and semiarid environments. Agric. Water Manag. 2019, 221, 462–476. [Google Scholar] [CrossRef]
- Jones, E.; Qadir, M.; van Vliet, M.T.H.; Smakhtin, V.; Kang, S. The state of desalination and brine production: A global outlook. Sci. Total Environ. 2019, 657, 1343–1356. [Google Scholar] [CrossRef] [PubMed]
- Qadir, M.; Jiménez, G.C.; Franum, R.L.; Dodson, L.L.; Smakhtin, V. Fog Water Collection: Challenges beyond Technology. Water 2018, 10, 372. [Google Scholar] [CrossRef] [Green Version]
- Yusuf, A.; Sodiq, A.; Giwa, A.; Eke, J.; Pikuda, O.; De Luca, G.; Di Salvo, J.; Chakraborty, S. A review of emerging trends in membrane science and technology for sustainable water treatment. J. Clean. Prod. 2020, 266, 121867. [Google Scholar] [CrossRef]
- Aliyu, U.M.; Rathilal, S.R.; Isa, Y.M. Membrane desalination technologies in water treatment: A review. Water Pract. Technol. 2018, 13, 738–752. [Google Scholar] [CrossRef]
- Amy, G.; Ghaffour, N.; Li, Z.; Francis, L.; Valladares Linares, R.; Missimer, T.; Lattemann, S. Membrane-based seawater desalination: Present and future prospects. Desalination 2017, 401, 16–21. [Google Scholar] [CrossRef]
- Gude, V.G. Desalination and sustainability-an appraisal and current perspective. Water Resour. 2016, 89, 87–106. [Google Scholar] [CrossRef]
- Ahmed, F.E.; Hashaikeh, R.; Hilal, N. Hybrid technologies: The future of energy efficient desalination—A review. Desalination 2020, 495, 114659. [Google Scholar] [CrossRef]
- Caldera, U.; Bogdanov, D.; Breyer, C. Desalination costs using renewable energy Technologies. In Renewable Energy Powered Desalination Handbook; Elsevier: Amsterdam, The Netherlands, 2018; pp. 287–329. [Google Scholar]
- Elsaid, K.; Kamil, M.; Sayed, E.T.; Abdelkareem, M.A.; Wilberforce, T.; Olabi, A. Environmental impact of desalination technologies: A review. Sci. Total Environ. 2020, 748, 141528. [Google Scholar] [CrossRef]
- Okamoto, Y.; Lienhard, J.H. How RO membrane permeability and other performance factors affect process cost and energy use: A review. Desalination 2019, 470, 114064. [Google Scholar] [CrossRef]
- World Bank. The Role of Desalination in an Increasingly Water-Scarce World; World Bank: Washington, DC, USA, 2019. [Google Scholar]
- Mollahosseini, A.; Abdelrasoul, A.; Sheibany, S.; Amini, M.; Salestan, S.K. Renewable energy-driven desalination opportunities—A case study. J. Environ. Manag. 2019, 239, 187–197. [Google Scholar] [CrossRef]
- Ghaffour, N.; Missimer, T.M.; Amy, G.L. Technical review and evaluation of the economics of water desalination: Current and future challenges for better water supply sustainability. Desalination 2013, 309, 197–207. [Google Scholar] [CrossRef] [Green Version]
- Garcia, X.; Pargament, D. Reusing wastewater to cope with water scarcity: Economic, social and environmental considerations for decision-making. Resour. Conserv. Recy. 2015, 101, 154–166. [Google Scholar] [CrossRef]
- Al-Karaghouli, A.; Kazmerski, L.L. Energy consumption and water production cost of conventional and renewable-energy-powered desalination processes. Renew. Sustain. Energy Rev. 2013, 24, 343–356. [Google Scholar] [CrossRef]
- Zhou, Y.; Tol, S.J. Evaluating the costs of desalination and water transport. Water Resour. Res. 2005, 41, W03003, 1–10. [Google Scholar] [CrossRef]
- Abdulbaki, D.; Al-Hindi, M.; Yassine, A.; Najm, M.A. An optimization model for the allocation of water resources. J. Clean. Prod. 2017, 164, 994–1006. [Google Scholar] [CrossRef]
- Goh, P.S.; Matsuura, G.T.; Ismail, A.F.; Ng, B.C. The water-energy nexus: Solutions towards energy-efficient desalination. Energy Technol. 2017, 5, 1136–1155. [Google Scholar] [CrossRef]
- Pinto, F.S.; Marques, R.C. Desalination projects economic feasibility: A standardization of cost determinants. Renew. Sustain. Energy Rev. 2017, 78, 904–915. [Google Scholar] [CrossRef]
- Papapetrou, M.; Cipollina, A.; La Commare, U.; Micale, G.; Zaragoza, G.; Kosmadakis, G. Assessment of methodologies and data used to calculate desalination costs. Desalination 2017, 419, 8–19. [Google Scholar] [CrossRef]
- Livi-Bacci, M. A Concise History of World Population; John Wiley & Sons: Hoboken, NJ, USA, 2012. [Google Scholar]
- Ventura, D.; Consoli, S.; Barbagallo, S.; Licciardello, F.; Cirelli, G.L. How to overcome barriers for wastewater agricultural reuse in Sicily (Italy)? Water 2019, 11, 335. [Google Scholar] [CrossRef] [Green Version]
- EPA (U.S. Environmental Protection Agency). Guidelines for Water Reuse; U.S. Environmental Protection Agency: Washington, DC, USA, 2012.
- Vicuña, S.; Vargas, X.; Boisier, J.P.; Mendoza, P.A.; Gómez, T.; Vásquez, N.; Cepeda, J. Impacts of climate change on water resources in Chile. In Water Resources of Chile; World Water Resources; Fernández, B., Gironás, J., Eds.; Springer Nature: Cham, Switzerland, 2021. [Google Scholar] [CrossRef]
- Alvez, A.; Aitken, D.; Rivera, D.; Vergara, M.; McIntyre, N.; Concha, F. At the crossroads: Can desalination be a suitable public policy solution to address water scarcity in Chile’s mining zones? J. Environ. Manag. 2020, 258, 110039. [Google Scholar] [CrossRef]
- Herrera-León, S.; Cruz, C.; Kraslawski, A.; Cisternas, L.A. Current situation and major challenges of desalination in Chile. Desalination Water Treat. 2019, 171, 93–104. [Google Scholar] [CrossRef]
- CNID (Consejo Nacional de Innovación para el Desarrollo). Evaluation of the Socio-Economic Conflicts of Large Projects with Focus on Water and Energy for 1998–2015. Available online: http://www.cnid.cl/wp-content/uploads/2017/04/Informe-final-CNID-Evaluacio%CC%81n-de-Conflictos-Socioambientales-1.pdf (accessed on 24 February 2021).
- Yang, J.; Monnot, M.; Ercolei, L.; Moulin, P. Membrane-Based Processes Used in Municipal Wastewater Treatment for Water Reuse: State-Of-The-Art and Performance Analysis. Membranes 2020, 10, 131. [Google Scholar] [CrossRef] [PubMed]
- Plumlee, M.; Stanford, B.D.; Debroux, J.F.; Hopkins, D.C.; Snyder, S.A. Cost of advanced treatment in water reclamation. Ozone Sci. Eng. 2014, 36, 485–495. [Google Scholar] [CrossRef]
- Guo, E.; Englehardt, J.; Wu, T. Review of cost versus scale: Water and wastewater treatment and reuse processes. Water Sci. Technol. 2014, 69, 223–234. [Google Scholar] [CrossRef]
- Molinos-Senante, M.; Hernández-Sancho, F.; Sala-Garrido, R. Economic feasibility study for wastewater treatment: A cost–benefit analysis. Sci. Total Environ. 2010, 408, 4396–4402. [Google Scholar] [CrossRef] [PubMed]
- Molinos-Senante, M.; González, D. Evaluation of the economics of desalination by integrating greenhouse gas emission costs: An empirical application for Chile. Renew. Energy 2019, 133, 1327–1337. [Google Scholar] [CrossRef]
- ENEL. Tarifas Vigentes. Available online: https://www.enel.cl/es/clientes/informacion-util/tarifas-y-reglamentos/tarifas.html (accessed on 4 February 2021).
- ESCWA (Economic and Social Commission for Wester Asia). ESCWA Water Development Report 3: Role of Desalination in Addressing Water Scarcity; United Nations Publications: New York, NY, USA, 2009. [Google Scholar]
- Sarricolea, P.; Herrera-Ossandon, M.; Meseguer-Ruiz, O. Climatic regionalisation of continental Chile. J. Maps 2017, 13, 66–73. [Google Scholar] [CrossRef]
- Aitken, D.; Rivera, D.; Godoy-Faúndez, A.; Holzaptel, E. Water Scarcity and the Impact of the Mining and Agricultural Sectors in Chile. Sustainability 2016, 8, 128. [Google Scholar] [CrossRef] [Green Version]
- Murashko, K.; Nikku, M.; Sermyagina, E.; Vauterin, J.J.; Hyppänen, E.; Pyrhónen, J. Techno-economic analysis of a decentralized wastewater treatment plant operating in closed-loop. A Finnish case study. J. Water Process. Eng. 2018, 25, 278–294. [Google Scholar] [CrossRef]
- Melgarejo, J.; Prats, D.; Molina, A.; Trapote, A. A case study of urban wastewater reclamation in Spain: Comparison of water quality produced by using alternative processes and related costs. J. Water Reuse Desalination 2016, 6, 72–81. [Google Scholar] [CrossRef] [Green Version]
- Plappally, A.K.; Lienhard, J.H. Costs for water supply, treatment, end-use and reclamation. Desalination Water Treat. 2012, 51, 1–33. [Google Scholar] [CrossRef]
- Valladares Linares, R.; Li, Z.; Yangali-Quintanilla, V.; Ghaffour, N.; Amy, G.; Leiknes, T.; Vrouwenvelder, J.S. Life cycle cost of a hybrid forward osmosis e low pressure reverse osmosis system for seawater desalination and wastewater recovery. Water Res. 2016, 88, 225–234. [Google Scholar] [CrossRef] [PubMed] [Green Version]
- Fundación Chile. Aguas Residuales como Nueva Fuente de Agua. Diagnóstico del Potencial Reúso de Aguas Residuales en la Región de Valparaíso; Fundación Chile: Santiago-Valparaíso, Chile, 2016. [Google Scholar]
- SISS. Superintendencia de Servicios Sanitarios. Informe de Gestión del Sector Sanitario. 2019. Available online: https://www.siss.gob.cl/586/articles-17955_recurso_1.pdf (accessed on 4 February 2021).
Figure 1.
Procedure to select the most appropriate water resource to supply water for domestic uses (Q is water flow rate (m3/d), ΔDmax is the maximum distance that produced water can be transported (km), deq_ww and deq_coast are the equivalent distance ((km) from the water source to water demand site for wastewater reuse scenarios and seawater desalination, respectively).

Figure 2.
Localization of studied cities of Chile.

Figure 3.
Water price (USD/m3) for the proposed scenarios.

Figure 4.
Estimated maximum distance (km) for the pairwise comparison of the proposed scenarios.

Figure 5.
Maximum equivalent distance to transport produced water for studied cities: (A) Alto Hospicio; (B) Mejillones; (C) Freirina; (D) Huasco; (E) Andacollo; (F) Limache; (G) Quillota; (H) Quilpué.
Figure 5.
Maximum equivalent distance to transport produced water for studied cities: (A) Alto Hospicio; (B) Mejillones; (C) Freirina; (D) Huasco; (E) Andacollo; (F) Limache; (G) Quillota; (H) Quilpué.


Table 1.
Transportation cost of desalinated water for different cities [9].
Table 1.
Transportation cost of desalinated water for different cities [9].
| City, Country | Distance (km) | Elevation (m) | Cost (USD/m3) |
|---|---|---|---|
| México city, México | 225 | 2500 | 2.44 |
| Sana, Yemen | 135 | 2500 | 2.38 |
| Beijing, China | 135 | 100 | 1.13 |
| Crateus, Brazil | 240 | 350 | 1.33 |
| Phoenix, USA | 280 | 320 | 1.34 |
| Delhi, India | 1050 | 500 | 1.90 |
| Zaragoza, Spain | 163 | 500 | 1.36 |
Table 2.
Summary of the cost functions for total capital costs (USD) and operating and maintenance costs (USD/year) for water production (y is cost, x is capacity (m3/d)).
Table 2.
Summary of the cost functions for total capital costs (USD) and operating and maintenance costs (USD/year) for water production (y is cost, x is capacity (m3/d)).
| Item | Cost Function | Reference |
|---|---|---|
| Capital costs | ||
| 1. Municipal wastewater | ||
| Reverse osmosis system | y = 272.54·x + 4.9835·106 | [32] |
| Ultrafiltration system | y = 136.38·x +2.4859·106 | |
| Yard piping | y = 40.97·x + 7.3826·105 | |
| Sitework land scaping | y = 20.38·x + 3.7647·105 | |
| Site electrical and controls | y = 81.86·x + 1.4916·106 | |
| Activated sludge system | log(y) = 0.256·(log(x))1.556 + 4.545 | [33] |
| 2. Seawater | ||
| Construction and infrastructure | y = 8.996·105·x + 6.20·106 | [35] |
| Land acquisition | y = 17.995·x + 1.2363·105 | |
| Engineering | y = 31.53·x + 2.1608·105 | |
| Development and management | y = 4.5263·x + 3.0165·104 | |
| Operating and maintenance costs | ||
| 1. Municipal wastewater | ||
| Labor | 0.02 USD/m3 | [32] |
| Reagents UF | y = 3.1224·10−2 + x·2.2448·10−5 | |
| Membrane replacement UF | y = 4.6073·10−3 + x·8.9988·10−6 | |
| Energy consumption UF | y = −5.4386·10−3 + x·4.0363·10−6 | |
| Reagents RO | y = 2.2126·10−2 + x·2.2727·10−5 | |
| Membrane replacement RO | y = 1.1905·10−2 + x·8.8019·10−6 | |
| Energy consumption RO | y = −3.0484·10−2 + x·4.0087·10−5 | |
| Activated sludge system | ||
| Energy consumption | 0.033 USD/m3 | [34] |
| Reagents | 0.025 USD/m3 | |
| Labor | 0.060 USD/m3 | |
| Maintenance | 0.038 USD/m3 | |
| Waste management | 0.029 USD/m3 | |
| 2. Seawater | ||
| Energy consumption | y = 1.461·10−3·x + 4.946·106 | [35] |
| Membrane replacement | y = 8·10−2·x−1.57·10−1 | |
| Reagents | y = 4·10−2·x−7.85·10−2 | |
| Labor | y = 1.496·10−2·x + 1.44·105 | |
| Maintenance | y = 8.086·10−5·x + 7.883·103 | |
Table 3.
Total capital costs (USD/m3/year), operating and maintenance costs (USD/m3), and total production costs (USD/m3) estimated for the proposed scenarios.
Table 3.
Total capital costs (USD/m3/year), operating and maintenance costs (USD/m3), and total production costs (USD/m3) estimated for the proposed scenarios.
| Water Production Capacity (m3/d) | Scenario 1 | Scenario 2 | Scenario 3 | ||||||
|---|---|---|---|---|---|---|---|---|---|
| Capital Costs | O&M Costs | Total Costs | Capital Costs | O&M Costs | Total Costs | Capital Costs | O&M Costs | Total Costs | |
| 100,000 | 0.071 | 0.264 | 0.334 | 0.135 | 0.450 | 0.585 | 0.135 | 0.452 | 0.587 |
| 90,000 | 0.072 | 0.264 | 0.335 | 0.136 | 0.450 | 0.586 | 0.136 | 0.452 | 0.587 |
| 80,000 | 0.073 | 0.264 | 0.337 | 0.138 | 0.450 | 0.588 | 0.136 | 0.452 | 0.588 |
| 70,000 | 0.074 | 0.264 | 0.338 | 0.139 | 0.450 | 0.589 | 0.137 | 0.452 | 0.589 |
| 60,000 | 0.076 | 0.264 | 0.340 | 0.141 | 0.450 | 0.592 | 0.138 | 0.452 | 0.590 |
| 50,000 | 0.079 | 0.264 | 0.343 | 0.145 | 0.450 | 0.595 | 0.140 | 0.452 | 0.591 |
| 45,000 | 0.080 | 0.264 | 0.345 | 0.147 | 0.450 | 0.597 | 0.141 | 0.452 | 0.592 |
| 40,000 | 0.083 | 0.265 | 0.347 | 0.149 | 0.451 | 0.600 | 0.142 | 0.452 | 0.594 |
| 35,000 | 0.086 | 0.265 | 0.350 | 0.153 | 0.451 | 0.603 | 0.143 | 0.452 | 0.595 |
| 30,000 | 0.089 | 0.265 | 0.354 | 0.157 | 0.451 | 0.608 | 0.146 | 0.452 | 0.598 |
| 25,000 | 0.095 | 0.265 | 0.360 | 0.163 | 0.451 | 0.615 | 0.149 | 0.452 | 0.601 |
| 20,000 | 0.103 | 0.266 | 0.369 | 0.173 | 0.452 | 0.624 | 0.153 | 0.452 | 0.605 |
| 15,000 | 0.116 | 0.267 | 0.383 | 0.188 | 0.453 | 0.641 | 0.161 | 0.453 | 0.613 |
| 10,000 | 0.143 | 0.269 | 0.411 | 0.218 | 0.455 | 0.672 | 0.176 | 0.453 | 0.629 |
| 7500 | 0.169 | 0.270 | 0.440 | 0.247 | 0.456 | 0.704 | 0.191 | 0.454 | 0.644 |
| 5000 | 0.223 | 0.274 | 0.497 | 0.305 | 0.460 | 0.765 | 0.221 | 0.455 | 0.676 |
| 4000 | 0.263 | 0.277 | 0.540 | 0.348 | 0.463 | 0.811 | 0.243 | 0.456 | 0.699 |
| 3000 | 0.330 | 0.281 | 0.611 | 0.420 | 0.467 | 0.887 | 0.281 | 0.457 | 0.738 |
| 2000 | 0.463 | 0.290 | 0.753 | 0.561 | 0.476 | 1.037 | 0.356 | 0.460 | 0.816 |
| 1500 | 0.597 | 0.299 | 0.896 | 0.673 | 0.485 | 1.158 | 0.431 | 0.463 | 0.894 |
| 1000 | 0.864 | 0.346 | 1.209 | 0.978 | 0.532 | 1.509 | 0.581 | 0.469 | 1.050 |
| 500 | 1.664 | 0.457 | 2.121 | 1.801 | 0.643 | 2.444 | 1.030 | 0.487 | 1.518 |
Table 4.
Estimated values obtained to supply water from potential water supplier cities to the studied cities.
Table 4.
Estimated values obtained to supply water from potential water supplier cities to the studied cities.
| City | Water Demand (m3/d) | WWTP | Potential Water Supplier City | Produced Water (m3/d) | deq_ww (km) | deq_coast (km) | ΔDmax (km) |
|---|---|---|---|---|---|---|---|
| Alto Hospicio | 23,824 | conventional | Iquique | 28,719 | 22.4 | 3.4 | 86.1 |
| Pozo Almonte | 1533 | 61.4 | |||||
| Mejillones | 2915 | submarine outfalls | Antofagasta | 53,788 | 65.6 | 0.7 | −46.3 |
| Tocopilla | 3683 | 132.0 | |||||
| Freirina | 1033 | conventional | Huasco | 1352 | 20.2 | 20.6 | −54.0 |
| Vallenar | 6990 | 43.8 | |||||
| Huasco | 2003 | submarine outfalls | Vallenar | 6990 | 62.8 | 0.8 | −65.9 |
| Freirina | 697 | 20.2 | |||||
| Andacollo | 2252 | conventional | La Serena | 30,403 | 78.1 | 69.0 | 32.4 |
| Ovalle | 13,297 | 68.2 | |||||
| Tongoy | 835 | 92.0 | |||||
| Limache | 8813 | conventional | Villa Alemana | 19,037 | 23.6 | 30.3 | 86.9 |
| Quillota | 11,898 | 21.2 | |||||
| Olmué | 1865 | 10.9 | |||||
| Quillota | 17,624 | conventional | Viña del Mar | 50,772 | 49.8 | 25.1 | 89.0 |
| La Calera | 7393 | 19.5 | |||||
| Concón | 5986 | 33.1 | |||||
| Quilpué | 33,659 | submarine outfalls | Viña del Mar | 50,772 | 34.6 | 11.9 | −2.7 |
| Villa Alemana | 21,937 | 6.0 | |||||
| Limache | 5950 | 28.4 |
Table 5.
Summary of the selected cities to supply water to the water-demanding cities.
| City | Water Resource | Water Price (USD/m3) |
|---|---|---|
| Alto Hospicio | Wastewater reuse (from Iquique) | 0.63 |
| Mejillones | Seawater desalination | 2.23 |
| Freirina | Seawater desalination | 2.62 |
| Huasco | Seawater desalination | 2.66 |
| Andacollo | Wastewater reuse (from Ovalle) | 1.31 |
| Limache | Wastewater reuse (from Quillota) | 0.69 |
| Quillota | Wastewater reuse (from Viña del Mar) | 0.66 |
| Quilpué | Seawater desalination | 1.37 |
Publisher’s Note: MDPI stays neutral with regard to jurisdictional claims in published maps and institutional affiliations. |
© 2021 by the authors. Licensee MDPI, Basel, Switzerland. This article is an open access article distributed under the terms and conditions of the Creative Commons Attribution (CC BY) license (https://creativecommons.org/licenses/by/4.0/).
Share and Cite
MDPI and ACS Style
Crutchik, D.; Campos, J.L. Municipal Wastewater Reuse: Is it a Competitive Alternative to Seawater Desalination? Sustainability 2021, 13, 6815. https://doi.org/10.3390/su13126815
AMA Style
Crutchik D, Campos JL. Municipal Wastewater Reuse: Is it a Competitive Alternative to Seawater Desalination? Sustainability. 2021; 13(12):6815. https://doi.org/10.3390/su13126815
Chicago/Turabian StyleCrutchik, Dafne, and José Luis Campos. 2021. "Municipal Wastewater Reuse: Is it a Competitive Alternative to Seawater Desalination?" Sustainability 13, no. 12: 6815. https://doi.org/10.3390/su13126815
Note that from the first issue of 2016, this journal uses article numbers instead of page numbers. See further details here.