New Insights on the Estimation of the Anaerobic Biodegradability of Plant Material: Identifying Valuable Plants for Sustainable Energy Production


Abstract
:1. Introduction
2. Materials and Methods
3. Results
4. Discussion
5. Concluding Remarks
Author Contributions
Funding
Acknowledgments
Conflicts of Interest
Appendix A

| English Name | Latin Name | Plant Class | Plant Part | NDF g gDM−1 | ADF g gDM−1 | ADL g gDM−1 | Predicted Bo %COD |
|---|---|---|---|---|---|---|---|
| Barley | Hordeum vulgare distichon | Cereals | Green leaves | 772.9 | 431.1 | 25.6 | 43% |
| Wheat | Triticum aestivum | Cereals | Green leaves | 748.4 | 423.9 | 51.9 | 44% |
| Wheat | Triticum aestivum | Cereals | Green leaves | 689.3 | 402.2 | 32.6 | 46% |
| Barley | Hordeum vulgare distichon | Cereals | Green leaves | 645.9 | 367.7 | 26.7 | 49% |
| Elephant Grass | Miscanthus gigantus | Alternative crops | Green leaves | 704.1 | 356.5 | 20.5 | 50% |
| Barley | Hordeum vulgare distichon | Cereals | Green leaves | 691.0 | 355.9 | 22.9 | 50% |
| Wheat | Triticum aestivum | Cereals | Green leaves | 671.8 | 350.9 | 55.1 | 51% |
| Bent grass | Agrostis capillaris | Grasses | Green leaves | 443.1 | 333.2 | 60.7 | 53% |
| Meadow Fescue | Festuca pratensis | Grasses | Green leaves | 482.9 | 279.2 | 15.2 | 58% |
| Maize | Zea mays | Other agric. crops | Green leaves | 588.6 | 277.3 | 5.8 | 58% |
| Cock’s-Foot | Dactylis glomerata | Grasses | Green leaves | 535.9 | 276.9 | 14.4 | 58% |
| Onion | Allium cepa | Horticultural crops | Green leaves | 352.3 | 276.1 | 72.9 | 58% |
| Oats | Avena sativa | Cereals | Green leaves | 482.6 | 274.2 | 25.5 | 59% |
| Winter Rye | Secale cereale | Cereals | Green leaves | 447.7 | 255.9 | 34.5 | 60% |
| Oil Radish | Raphanus sativus | Catch crops | Green leaves | 247.5 | 250.8 | 30.8 | 61% |
| Cock’s-Foot | Dactylis glomerata | Grasses | Green leaves | 474.3 | 245.4 | 14.9 | 61% |
| Yellow Lupin | Lupinus luteus | Legumes | Green leaves | 301.9 | 224.6 | 28.4 | 64% |
| Chicory | Cichorium intybus | Catch crops | Green leaves | 214.2 | 218.9 | 16.6 | 64% |
| English Ryegrass | Lolium perenne | Grasses | Green leaves | 410.9 | 213.7 | 10.5 | 65% |
| Barley | Hordeum vulgare distichon | Cereals | Green leaves | 362.8 | 210.2 | 15.1 | 65% |
| Flax | Linum usitatissimum | Alternative crops | Green leaves | 303.3 | 198.8 | 65.9 | 66% |
| Oats | Avena sativa | Cereals | Green leaves | 352.8 | 188.0 | 4.4 | 67% |
| Hemp | Cannabis sativa | Alternative crops | Green leaves | 224.3 | 172.5 | 35.8 | 69% |
| Leek | Allium porrum | Horticultural crops | Green leaves | 211.8 | 170.7 | 16.5 | 69% |
| Carrot | Daucus carota | Horticultural crops | Green leaves | 216.6 | 156.2 | 31.0 | 70% |
| Chicory | Cichorium intybus | Catch crops | Green leaves | 198.7 | 152.6 | 11.4 | 71% |
| Cabbage | Brassica oleracea | Horticultural crops | Green leaves | 196.8 | 147.4 | 2.0 | 71% |
| Phacelia | Phacelia tanacetifolia | Catch crops | Green leaves | 242.6 | 144.0 | 18.7 | 72% |
| Alfalfa/Lucerne | Medicago sativa | Legumes | Green leaves | 194.6 | 141.1 | 15.7 | 72% |
| Crimson Clover | Trifolium incarnatum | Legumes | Green leaves | 224.6 | 134.4 | 11.3 | 73% |
| Oilseed Rape | Brassica napus oleifera | Other agric. crops | Green leaves | 245.4 | 126.2 | 19.9 | 73% |
| Oilseed Rape | Brassica napus oleifera | Other agric. crops | Green leaves | 169.9 | 124.9 | 0.6 | 74% |
| Sugar Beet | Beta vulgaris spp. | Other agric. crops | Green leaves | 231.3 | 123.6 | 6.1 | 74% |
| White Clover | Trifolium repens | Legumes | Green leaves | 153.6 | 105.0 | 9.1 | 76% |
| Cabbage | Brassica oleracea | Horticultural crops | Green leaves | 150.3 | 102.7 | 0.9 | 76% |
| Turnip Rape | Brassica rapa oleifera | Catch crops | Green leaves | 181.7 | 95.3 | 7.7 | 76% |
| Sunflower | Helianthus… | Other agric. crops | Mature straw | 742.1 | 627.5 | 115.0 | 23% |
| Hemp | Cannabis sativa | Alternative crops | Mature straw | 700.0 | 589.1 | 88.1 | 27% |
| Turnip Rape | Brassica rapa oleifera | Catch crops | Mature straw | 763.4 | 584.5 | 126.5 | 28% |
| Pea | Pisum sativum | Legumes | Mature straw | 766.5 | 563.9 | 107.1 | 30% |
| Pea | Pisum sativum | Legumes | Mature straw | 749.5 | 548.9 | 111.8 | 31% |
| Yellow Mustard | Sinapis alba | Catch crops | Mature straw | 727.3 | 509.5 | 113.7 | 35% |
| Barley | Hordeum vulgare distichon | Cereals | Mature straw | 817.3 | 473.4 | 44.8 | 39% |
| Wheat | Triticum aestivum | Cereals | Mature straw | 791.9 | 457.0 | 36.6 | 40% |
| Wheat | Triticum aestivum | Cereals | Mature straw | 754.3 | 448.5 | 47.3 | 41% |
| Barley | Hordeum vulgare distichon | Cereals | Mature straw | 673.7 | 406.6 | 40.2 | 45% |
| Red Fescue | Festuca rubra | Grasses | Mature straw | 717.6 | 403.9 | 42.6 | 46% |
| Meadow Foxtail | Alopecurus pratensis | Grasses | Mature straw | 675.9 | 358.5 | 25.4 | 50% |
| Bluegrass | Poa pratensis | Grasses | Mature straw | 650.7 | 341.3 | 23.6 | 52% |
| Oats | Avena sativa | Cereals | Mature straw | 543.2 | 306.2 | 20.5 | 55% |
| Oilseed Rape | Brassica napus oleifera | Other agric. crops | Pod walls | 567.0 | 428.6 | 90.0 | 43% |
| Oilseed Rape | Brassica napus oleifera | Other agric. crops | Pod walls | 529.1 | 390.9 | 72.4 | 47% |
| Maize | Zea mays | Other agric. crops | Pods | 509.2 | 230.5 | 3.4 | 63% |
| Wheat | Triticum aestivum | Cereals | Pods | 394.3 | 193.7 | 20.9 | 67% |
| Barley | Hordeum vulgare distichon | Cereals | Pods | 480.6 | 175.5 | 11.3 | 68% |
| Wheat | Triticum aestivum | Cereals | Pods | 287.6 | 126.7 | 11.4 | 73% |
| Barley | Hordeum vulgare distichon | Cereals | Pods | 251.9 | 76.2 | 3.2 | 78% |
| Maize | Zea mays | Other agric. crops | Pods | 197.1 | 68.9 | 0.7 | 79% |
| Hemp | Cannabis sativa | Alternative crops | Stem | 794.9 | 649.3 | 100.4 | 21% |
| Flax | Linum usitatissimum | Alternative crops | Stem | 765.2 | 629.1 | 168.0 | 23% |
| Flax | Linum usitatissimum | Alternative crops | Stem | 677.1 | 576.7 | 138.7 | 28% |
| Flax | Linum usitatissimum | Alternative crops | Stem | 730.8 | 563.8 | 166.3 | 30% |
| Oilseed Rape | Brassica napus oleifera | Other agric. crops | Stem | 731.3 | 554.8 | 113.5 | 31% |
| Oilseed Rape | Brassica napus oleifera | Other agric. crops | Stem | 719.9 | 544.8 | 106.7 | 32% |
| Elephant Grass | Miscanthus gigantus | Alternative crops | Stem | 785.8 | 518.2 | 60.0 | 34% |
| Barley | Hordeum vulgare distichon | Cereals | Stem | 828.2 | 515.5 | 69.3 | 34% |
| Wheat | Triticum aestivum | Cereals | Stem | 816.6 | 510.3 | 50.7 | 35% |
| Wheat | Triticum aestivum | Cereals | Stem | 819.0 | 506.6 | 76.7 | 35% |
| Wheat | Triticum aestivum | Cereals | Stem | 797.8 | 469.2 | 94.7 | 39% |
| Barley | Hordeum vulgare distichon | Cereals | Stem | 767.6 | 464.3 | 41.6 | 40% |
| Yellow Lupin | Lupinus luteus | Legumes | Stem | 537.6 | 454.6 | 74.2 | 41% |
| Alfalfa/Lucerne | Medicago sativa | Legumes | Stem | 559.2 | 444.6 | 111.0 | 42% |
| Red Clover | Trifolium pratense | Legumes | Stem | 514.8 | 406.3 | 65.4 | 45% |
| Cock’s-Foot | Dactylis glomerata | Grasses | Stem | 659.4 | 364.3 | 25.8 | 50% |
| Cock’s-Foot | Dactylis glomerata | Grasses | Stem | 638.3 | 355.0 | 22.0 | 51% |
| Wheat | Triticum aestivum | Cereals | Stem | 617.2 | 355.0 | 60.4 | 51% |
| Maize | Zea mays | Other agric. crops | Stem | 596.3 | 344.3 | 14.9 | 52% |
| Persian Clover | Trifolium resupinatum | Legumes | Stem | 440.0 | 339.4 | 85.4 | 52% |
| Wheat | Triticum aestivum | Cereals | Stem | 572.6 | 337.9 | 36.2 | 52% |
| Barley | Hordeum vulgare distichon | Cereals | Stem | 629.7 | 332.4 | 23.1 | 53% |
| Maize | Zea mays | Other agric. crops | Stem | 566.4 | 329.1 | 14.7 | 53% |
| Maize | Zea mays | Other agric. crops | Stem | 581.2 | 329.1 | 16.6 | 53% |
| Bent Grass | Agrostis capillaris | Grasses | Stem | 393.5 | 313.0 | 49.7 | 55% |
| Wheat | Triticum aestivum | Cereals | Stem | 498.4 | 290.6 | 23.4 | 57% |
| English Ryegrass | Lolium perenne | Grasses | Stem | 494.0 | 256.0 | 6.7 | 60% |
| White Clover | Trifolium repens | Legumes | Stem | 239.4 | 181.2 | 17.3 | 68% |
| Red Clover | Trifolium pratense | Legumes | Stem | 277.3 | 176.2 | 24.3 | 68% |
| Flax | Linum usitatissimum | Alternative crops | Whole plant | 708.0 | 585.1 | 125.0 | 28% |
| Broad Bean | Vicia faba | Legumes | Whole plant | 636.4 | 527.1 | 97.9 | 33% |
| Barley | Hordeum vulgare distichon | Cereals | Whole plant | 816.4 | 512.2 | 54.8 | 35% |
| Black Mustard | Other agric. crops | Whole plant | 629.7 | 481.7 | 87.8 | 38% | |
| Flax | Linum usitatissimum | Alternative crops | Whole plant | 613.9 | 466.8 | 111.0 | 39% |
| Flax | Linum usitatissimum | Alternative crops | Whole plant | 525.0 | 383.8 | 96.9 | 48% |
| Oil Radish | Raphanus sativus | Catch crops | Whole plant | 450.5 | 383.1 | 64.5 | 48% |
| Ribbed Melilot | Melilotus officinalis | Legumes | Whole plant | 435.4 | 379.0 | 64.9 | 48% |
| Bluegrass | Poa pratensis | Grasses | Whole plant | 661.3 | 375.0 | 25.2 | 49% |
| Common Bird’s-Foot-Trefoil | Lotus corniculatus | Legumes | Whole plant | 461.1 | 359.1 | 87.6 | 50% |
| Tall Fescue | ?? Pratense | Grasses | Whole plant | 585.2 | 346.3 | 32.0 | 51% |
| Timothy | Phleum pratense | Grasses | Whole plant | 612.6 | 333.2 | 18.8 | 53% |
| Maize | Zea mays | Other agric. crops | Whole plant | 688.3 | 332.2 | 7.7 | 53% |
| Cock’s-Foot | Dactylis glomerata | Grasses | Whole plant | 571.1 | 324.1 | 16.0 | 54% |
| Maize | Zea mays | Other agric. crops | Whole plant | 676.5 | 317.6 | 1.1 | 54% |
| Tall Fescue | ?? Pratense | Grasses | Whole plant | 507.5 | 294.0 | 20.1 | 57% |
| English Ryegrass | Lolium perenne | Grasses | Whole plant | 514.5 | 273.8 | 21.9 | 59% |
| Crimson Clover | Trifolium incarnatum | Legumes | Whole plant | 435.5 | 273.1 | 57.7 | 59% |
| Timothy | Phleum pratense | Grasses | Whole plant | 511.7 | 271.8 | 14.1 | 59% |
| Winter Vetch | Vicia villosa | Legumes | Whole plant | 344.0 | 262.3 | 50.5 | 60% |
| Alfalfa/Lucerne | Medicago sativa | Legumes | Whole plant | 336.1 | 255.5 | 44.7 | 60% |
| Egyptian Clover | Trifolium alexandrinum | Legumes | Whole plant | 342.8 | 244.8 | 35.0 | 62% |
| White Clover | Trifolium repens | Legumes | Whole plant | 314.3 | 226.7 | 63.9 | 63% |
| Crimson Clover | Trifolium incarnatum | Legumes | Whole plant | 310.4 | 220.9 | 24.4 | 64% |
| White Clover | Trifolium repens | Legumes | Whole plant | 247.2 | 198.9 | 48.1 | 66% |
| Red Clover | Trifolium pratense | Legumes | Whole plant | 267.4 | 195.1 | 19.8 | 67% |
| Oilseed Rape | Brassica napus oleifera | Other agric. crops | Whole plant | 247.1 | 184.0 | 13.6 | 68% |
References
- Berglund, M.; Börjesson, P. Assessment of energy performance in the life-cycle of biogas production. Biomass and Bioenergy 2006, 30, 254–266. [Google Scholar] [CrossRef]
- Lehtomaki, A.; Viinikainen, T.A.; Rintala, J.A. Screening Boreal energy crops and crop residues for methane biofuel production. Biomass Bioenergy 2008, 32, 541–550. [Google Scholar] [CrossRef]
- Pabón-Pereira, C.; Slingerland, M.; Hogervorst, S.; van Lier, J.; Rabbinge, R. A sustainability assessment of bioethanol (EtOH) production: The case of cassava in Colombia. Sustainability 2019, 11, 3968. [Google Scholar] [CrossRef] [Green Version]
- Chynoweth, D.; Owens, J.; Legrand, R. Renewable methane from anaerobic digestion of biomass. Renew. Energy 2001, 22, 1–8. [Google Scholar] [CrossRef]
- Lehtomaki, A.; Huttunen, S.; Rintala, J.A. Laboratory investigations on co-digestion of energy crops and crop residues with cow manure for methane production: Effect of crop to manure ratio. Resour. Conserv. Recycl. 2007, 51, 591–609. [Google Scholar] [CrossRef]
- Weiland, P. Production and energetic use of biogas from energy crops and wastes in Germany. Appl. Biochem. Biotechnol. 2003, 109, 263–274. [Google Scholar] [CrossRef]
- Vats, N.; Khan, A.A.; Ahmad, K. Effect of substrate ratio on biogas yield for anaerobic co-digestion of fruit vegetable waste & sugarcane bagasse. Environ. Technol. Innov. 2019, 13, 331–339. [Google Scholar]
- Asquer, C.; Pistis, A.; Scano, E.A. Characterization of Fruit and Vegetable Wastes as a Single Substrate for the Anaerobic Digestion Extended Abstract. Environ. Eng. Manag. J. 2013, 12, 89–92. [Google Scholar]
- Bangalore, M.; Hochman, G.; Zilberman, D. Policy incentives and adoption of agricultural anaerobic digestion: A survey of Europe and the United States. Renew. Energy 2016, 97, 559–571. [Google Scholar] [CrossRef] [Green Version]
- Banks, C.J.; Salter, A.M.; Chesshire, M. Potential of anaerobic digestion for mitigation of greenhouse gas emissions and production of renewable energy from agriculture: Barriers and incentives to widespread adoption in Europe. Water Sci. Technol. 2007, 55, 165–173. [Google Scholar] [CrossRef]
- Yang, L.; Xu, F.; Ge, X.; Li, Y. Challenges and strategies for solid-state anaerobic digestion of lignocellulosic biomass. Renew. Sustain. Energy Rev. 2015, 44, 824–834. [Google Scholar] [CrossRef]
- Sawatdeenarunat, C.; Surendra, K.C.; Takara, D.; Oechsner, H.; Khanal, S.K. Anaerobic digestion of lignocellulosic biomass: Challenges and opportunities. Bioresour. Technol. 2015, 178, 178–186. [Google Scholar] [CrossRef] [PubMed]
- Amon, T.; Amon, B.; Kryvoruchko, V.; Machmuller, A.; Hopfner-Sixt, K.; Bodiroza, V.; Hrbek, R.; Friedel, J.; Potsch, E.; Wagentristl, H.; et al. Methane production through anaerobic digestion of various energy crops grown in sustainable crop rotations. Bioresour. Technol. 2007, 98, 3204–3212. [Google Scholar] [CrossRef] [PubMed]
- Boehmel, C.; Lewandowski, I.; Claupein, W. Comparing annual and perennial energy cropping systems with different management intensities. Agric. Syst. 2008, 96, 224–236. [Google Scholar] [CrossRef]
- Nemecek, T.; von Richthofen, J.S.; Dubois, G.; Casta, P.; Charles, R.; Pahl, H. Environmental impacts of introducing grain legumes into European crop rotations. Eur. J. Agron. 2008, 28, 380–393. [Google Scholar] [CrossRef]
- Gunaseelan, N. Anaerobic Digestion of Biomass for Methane Production: A Review. Biomass Bioenergy 1997, 13, 83–114. [Google Scholar] [CrossRef]
- Lehtomaki, A. Biogas Production from Energy Crops and Crop Residues; Department of Biological and Environmental Science, Jyvaskyla University: Jyvaskyla, Finland, 2006; p. 91. [Google Scholar]
- Angelidaki, I.; Sanders, W. Assessment of the anaerobic biodegradability of macropollutants. Rev. Environ. Sci. Biotechnol. 2004, 3, 117–129. [Google Scholar] [CrossRef]
- Holliger, C.; Alves, M.; Andrade, D.; Angelidaki, I.; Astals, S.; Baier, U.; Bougrier, C.; Buffière, P.; Carballa, M.; De Wilde, V.; et al. Towards a standardization of biomethane potential tests. Water Sci. Technol. 2016, 74, 2515–2522. [Google Scholar] [CrossRef]
- Pabón-Pereira, C.; Castanares, G.; Van Lier, J. An OxiTop® protocol for screening plant material for its biochemical methane potential (BMP). Water Sci. Technol. 2012, 66, 1416–1423. [Google Scholar] [CrossRef]
- Angelidaki, I.; Alves, M.; Bolzonella, D.; Borzacconi, L.; Campos, J.L.; Guwy, A.; Kalyuzhnyi, S.; Jenicek, P.; Van Lier, J.B. Defining the biomethane potential (BMP) of solid organic wastes and energy crops: A proposed protocol for batch assays. Water Sci. Technol. 2009, 59, 927–934. [Google Scholar] [CrossRef] [Green Version]
- Chandler, J.A.; Jewell, W.J.; Gossett, J.M.; Van Soest, P.J.; Robertson, J.B. Predicting methane fermentation biodegradability. Biotechnol. Bioeng. Symp. 1980, 10, 93–107. [Google Scholar]
- Jimenez, S.; Cartagena, M.C.; Arce, A. Influence of Lignin on the Methanization of Lignocellulosic Wastes. Biomass 1990, 21, 43–54. [Google Scholar] [CrossRef]
- Tong, X.; Smith, L.H.; McCarty, P.L. Methane Fermentation of Selected Lignocellulosic Materials. Biomass 1990, 21, 239–255. [Google Scholar] [CrossRef]
- Turick, C.E.; Peck, M.W.; Chynoweth, D.P.; Jerger, D.E.; White, E.H.; Zsuffa, L.; Kenney, W.A. Methane fermentation of woody biomass. Bioresour. Technol. 1991, 37, 141–147. [Google Scholar] [CrossRef]
- Eleazer, W.E.; Odle Iii, W.S.; Wang, Y.S.; Barlaz, M.A. Biodegradability of municipal solid waste components in laboratory- scale landfills. Environ. Sci. Technol. 1997, 31, 911–917. [Google Scholar] [CrossRef]
- Herrmann, C.; Idler, C.; Heiermann, M. Biogas crops grown in energy crop rotations: Linking chemical composition and methane production characteristics. Bioresour. Technol. 2016, 206, 23–35. [Google Scholar]
- Amon, T.; Amon, B.; Kryvoruchko, V.; Zollitsch, W.; Mayer, K.; Gruber, L. Biogas production from maize and dairy cattle manure-Influence of biomass composition on the methane yield. Agric. Ecosyst. Environ. 2007, 118, 173–182. [Google Scholar] [CrossRef]
- Moller, H.B.; Sommer, S.G.; Ahring, B.K. Methane productivity of manure, straw and solid fractions of manure. Biomass Bioenergy 2004, 26, 485–495. [Google Scholar] [CrossRef]
- Chynoweth, D.P.; Conrad, J.R.; Srivastava, V.J.; Jerger, D.E.; Mensinger, J.D.; Fannin, K.F. Anaerobic processes. J. Water Pollut. Control Fed. 1985, 57, 533–539. [Google Scholar]
- Sharma, S.; Mishra, I.M.; Sharma, M.P.; Saini, J.S. Effect of particle size on biogas generation from biomass residues. Biomass 1988, 17, 251–263. [Google Scholar] [CrossRef]
- Van Soest, P.J.; Robertson, J.B.; Lewis, B.A. Methods for Dietary Fiber, Neutral Detergent Fiber and Nonstarch Polysaccharides in relation to animal nutrition. J. Dairy Sci. 1991, 74, 3583–3597. [Google Scholar] [CrossRef]
- Owen, W.F.; Stuckey, D.C.; Healy, J.B.; Young, L.Y.; McCarty, P.L. Bioassay for monitoring biochemical methane potential and anaerobic toxicity. Water Res. 1979, 13, 485–492. [Google Scholar] [CrossRef]
- APHA-American Public Health Association. Standard Methods for the Examination of Water and Wastewater, 20th ed.; American Public Health Association: Washington, DC, USA, 1998. [Google Scholar]
- Symons, G.E.; Buswell, A.M. The methane fermentation of carbohydrates. J. Am. Chem. Soc. 1933, 55, 2028–2036. [Google Scholar] [CrossRef]
- Undersander, D.; Mertens, D.; Thiex, N. Forage Analyses Procedures; National Forage Testing Association: Omaha, NE, USA, 1993; p. 154. [Google Scholar]
- Veeken, A.; Hamelers, B. Effect of temperature on the hydrolysis rate of selected biowaste components. Bioresour. Technol. 1999, 69, 249–255. [Google Scholar] [CrossRef]
- Lewis, N.; Yamamoto, E. Lignin: Occurence, biogenesis and biodegradation. Annu. Rev. Plant. Physiol. Plant. Mol. Biol. 1990, 41, 455–496. [Google Scholar] [CrossRef]
- Benner, R.; Maccubin, A.E.; Hodson, R.E. Anaerobic biodegradation of the lignin and polysaccharide components of lignocellulose and synthetic lignin by sediment microflora. Appl. Environ. Microbiol. 1984, 47, 998–1004. [Google Scholar] [CrossRef] [Green Version]
- Den Camp, H.J.M.O.; Verhagen, F.; Kivaisi, A.K.; Windt, F.D.; Lubberding, H.; Gijzen, H.J.; Vogels, G.D. Effects of lignin on the anaerobic degradation of (ligno) cellulosic wastes by rumen microorganisms. Appl. Microbiol. Biotechnol. 1988, 29, 408–412. [Google Scholar] [CrossRef]
- Fernandes, T.V.; Zeeman, G.; van Lier, J.B. Humic acid-like and Fulvic acid-like inhibition on the hydrolysis of cellulose and tributyrin. Bioenergy Res. 2015, 8, 821–831. [Google Scholar] [CrossRef]
- Azman, S.; Khadem, A.F.; Zeeman, G.; van Lier, J.B.; Plugge, C.M. Mitigation of humic acid inhibition in anaerobic cellulose digestion by addition of cationic salts. Bioengineering 2015, 2, 54–65. [Google Scholar] [CrossRef] [PubMed] [Green Version]
- Ghasimi, D.S.M.; Zandvoort, K.A.M.d.M.H.; van Lier, J.B. Impact of lignocellulosic-waste intermediates on hydrolysis and methanogenesis under thermophilic and mesophilic conditions. Chem. Eng. J. 2015, 295, 181–191. [Google Scholar] [CrossRef]
- Wang, Y.S.; Byrd, C.S.; Barlaz, M.A. Anaerobic biodegradability of cellulose and hemicellulose in excavated refuse samples using a biochemical methane potential assay. J. Ind. Microbiol. 1994, 13, 147–193. [Google Scholar] [CrossRef] [PubMed]
- Triolo, J.M.; Sommer, S.G.; Møller, H.B.; Weisbjerg, M.R.; Jiang, X.Y. A new algorithm to characterize biodegradability of biomass during anaerobic digestion: Influence of lignin concentration on methane production potential. Bioresour. Technol. 2011, 102, 9395–9402. [Google Scholar] [CrossRef] [PubMed]
- Chynoweth, D.P.; Turick, C.E.; Owens, J.M.; Jerger, D.E.; Peck, M.W. Biochemical Methane Potential of biomass and waste feedstocks. Biomass Bioenergy 1993, 5, 95–111. [Google Scholar] [CrossRef]
- Barton, F.E.I.; Akin, D.E. Digestibility of delignified forage cell walls. J. Agric. Food Chem. 1977, 25, 1299–1303. [Google Scholar] [CrossRef]
- Selinger, L.B.; Forsberg, C.W.; Cheng, K.J. The rumen: A unique source of enzymes for enhancing livestock production. Anaerobe 1996, 2, 263–284. [Google Scholar] [CrossRef]
- Pabón Pereira, C.P. Anaerobic Digestion in Sustainable Biomass Chains; Wageningen University: Wageningen, The Netherlands, 2009. [Google Scholar]
- Buffiere, P.; Loisel, D.; Bernet, N.; Delgenes, J.P. Towards new indicators for the prediction of solid waste anaerobic digestion properties. Water Sci. Technol. 2006, 53, 233–241. [Google Scholar] [CrossRef] [Green Version]
- Conrad, H.R.; Weiss, W.P.; Odwongo, W.O.; Shockey, W.L. Estimating Net Energy of Lactation from components of cell solubles and cell walls. J. Dairy Sci. 1984, 67, 427–436. [Google Scholar] [CrossRef]
- Noike, T.; Endo, G.; Chang, J.; Yaguchi, J.; Matsumoto, J. Characteristics of Carbo hydrate degradation and the rate limiting step in anaerobic digestion. Biotechnol. Bioeng. 1985, 27, 1482–1489. [Google Scholar] [CrossRef]
- Hatfield, R.D.; Fukushima, R.S. Can lignin be accurately measured? Crop Sci. 2005, 45, 832–839. [Google Scholar] [CrossRef] [Green Version]
- Ghosh, S.; Henry, M.P.; Christopher, R.W. Hemicellulose conversion by anaerobic digestion. Biomass 1985, 6, 257–269. [Google Scholar] [CrossRef]
- Leschine, S. Cellulose degradation in anaerobic environments. Annu. Rev. Microbiol. 1995, 49, 399–426. [Google Scholar] [CrossRef] [PubMed]
- Pareek, S.; Kim, S.; Matsui, S.; Shimizu, Y. Hydrolysis of (ligno)cellulosic materials under sulphidogenic and methanogenic conditions. Water Sci. Technol. 1998, 38, 193–200. [Google Scholar] [CrossRef]
- Palmowski, L.M.; Müller, J.A. Influence of the size reduction of organic waste on their anaerobic digestion. Water Sci. Technol. 2000, 41, 155–162. [Google Scholar] [CrossRef] [PubMed]
- Fukushima, R.S.; Hatfield, R.D. Comparison of the Acetyl Bromide Spectrophotometric Method with Other Analytical Lignin Methods for Determining Lignin Concentration in Forage Samples. J. Agric. Food Chem. 2004, 52, 3713–3720. [Google Scholar] [CrossRef]
- Hatfield, R.D.; Jung, H.G.; Ralph, J.; Buxton, D.R.; Weimer, P.J. A comparison of the insoluble residues produced by the Klasson lignin and acid detergent lignin procedures. J. Sci. Food Agric. 2006, 65, 51–58. [Google Scholar] [CrossRef]
- Stenberg, B.; Jensen, L.S.; Nordkvist, E.; Breland, T.A.; Pedersen, A.; Guomundsson, J.; Bruun, S.; Salo, T.; Palmason, F.; Henriksen, T.M.; et al. Near infrared reflectance spectroscopy for quantification of crop residue, green manure and catch crop C and N fractions governing decomposition dynamics in soil. J. Near Infrared Spectrosc. 2004, 12, 331–346. [Google Scholar] [CrossRef]


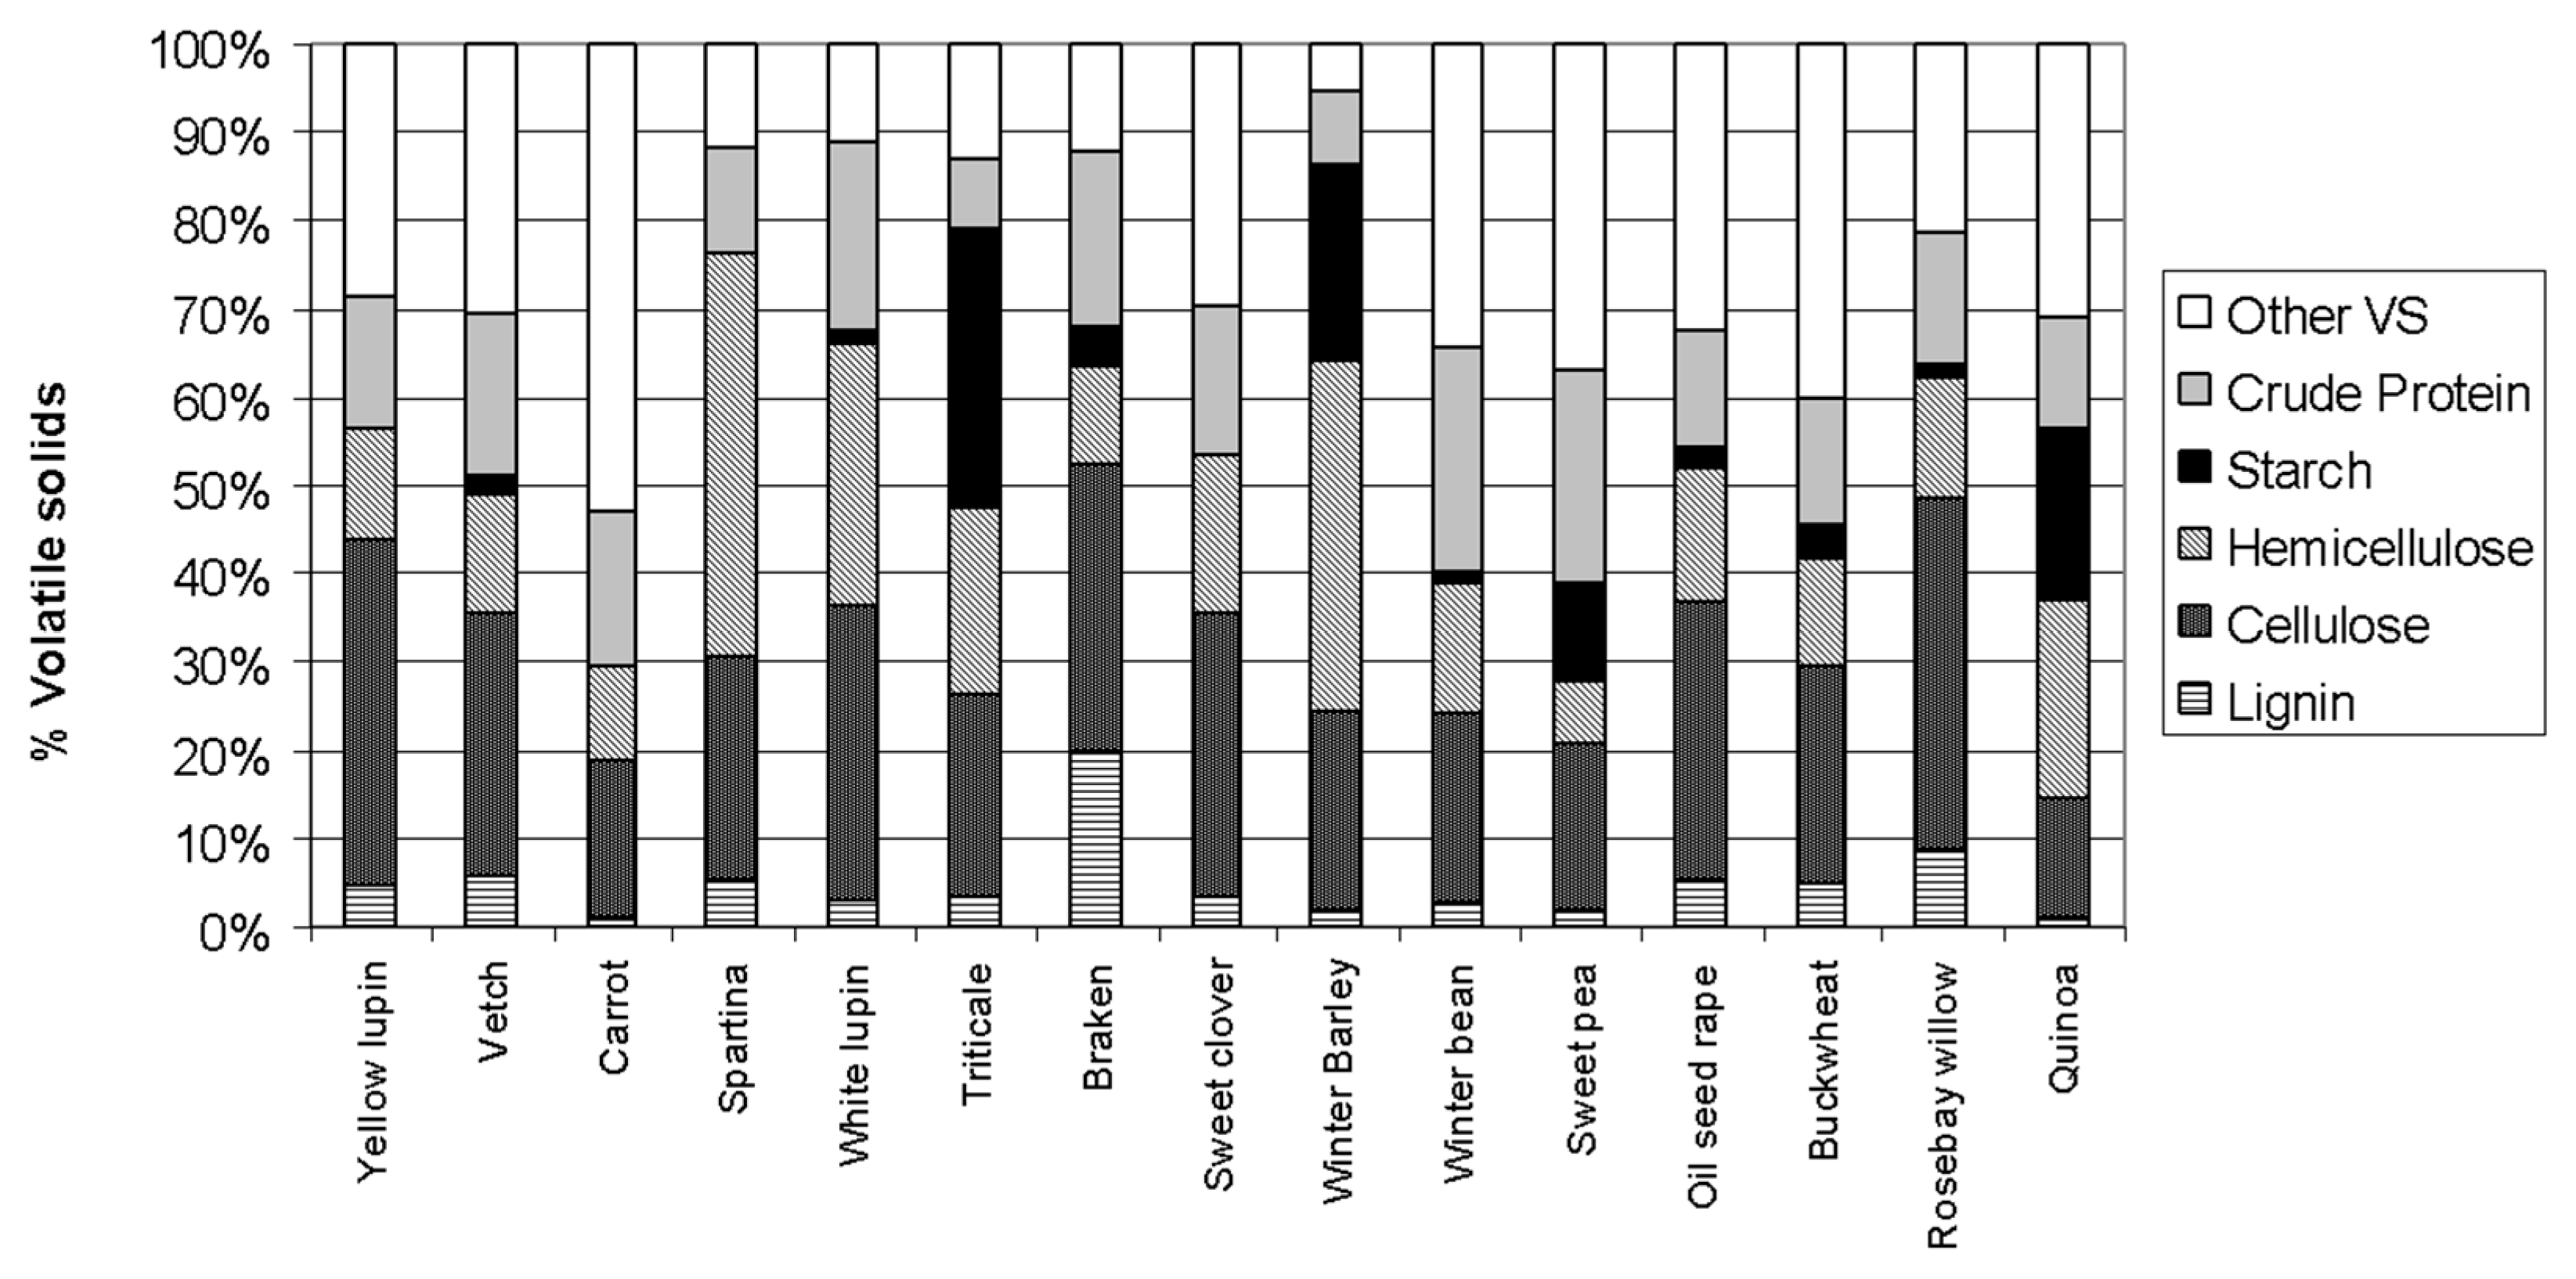
| Common Name | Scientific Name | Crop Type | TS (gTS g −1) | VS (%TS) | COD (gO2 gVS−1) | TF | L | C | H | Starch | Protein |
|---|---|---|---|---|---|---|---|---|---|---|---|
| (g.gVS−1) | |||||||||||
| Yellow lupin | Lupinu luteus | Legume | 0.15 | 91% | 1.54 | 0.58 | 0.04 | 0.41 | 0.13 | 0.00 | 0.15 |
| Vetch | Vicia sativa | Legume | 0.24 | 93% | 1.47 | 0.51 | 0.06 | 0.32 | 0.13 | 0.03 | 0.18 |
| Carrot | Daucus carota | Vegetable | 0.11 | 90% | 1.37 | 0.29 | 0.01 | 0.17 | 0.11 | 0.00 | 0.18 |
| Spartina | Spartina anglica | Wild grass | 0.32 | 89% | 1.42 | 0.77 | 0.05 | 0.26 | 0.46 | 0.00 | 0.12 |
| White lupin | Lupinus albus | Legume | 0.14 | 93% | 1.46 | 0.65 | 0.03 | 0.32 | 0.30 | 0.01 | 0.21 |
| Triticale | Triticum secale | Cereal | 0.70 | 97% | 1.43 | 0.47 | 0.04 | 0.22 | 0.21 | 0.32 | 0.08 |
| Bracken | Pteridium aquilinum | Fern-perennial | 0.16 | 94% | 1.51 | 0.63 | 0.20 | 0.32 | 0.11 | 0.05 | 0.20 |
| Sweet clover | Melilota officinalis | Legume | 0.33 | 94% | 1.58 | 0.53 | 0.03 | 0.32 | 0.18 | 0.00 | 0.17 |
| Winter barley | Hordeum vulgare | Cereal | 0.38 | 95% | 1.43 | 0.65 | 0.02 | 0.23 | 0.40 | 0.22 | 0.09 |
| Winter bean | Vicia faba | Legume | 0.15 | 92% | 1.52 | 0.42 | 0.03 | 0.24 | 0.15 | 0.01 | 0.26 |
| Sweet pea | Pisum sativum | Legume | 0.15 | 90% | 1.53 | 0.29 | 0.02 | 0.20 | 0.07 | 0.11 | 0.24 |
| Oilseed rape | Brassica napus | Oil crop | 0.26 | 93% | 1.62 | 0.54 | 0.05 | 0.33 | 0.15 | 0.02 | 0.13 |
| Buckwheat | Fagopyrum esculentum | Pseudo cereal | 0.17 | 90% | 1.45 | 0.44 | 0.05 | 0.26 | 0.12 | 0.04 | 0.14 |
| Rosebay willow | Chamaenerion angustifolium | Herb-perennial | 0.38 | 94% | 1.53 | 0.76 | 0.09 | 0.40 | 0.14 | 0.02 | 0.15 |
| Quinoa | Chenopodium quinoa | Pseudo cereal | 0.22 | 86% | 1.35 | 0.27 | 0.01 | 0.13 | 0.23 | 0.19 | 0.13 |
| Specie | BMP (lCH4 gVS−1) | BMP (lCH4 gCOD−1) | Bo (%COD) | Bp (%pCOD) | Bs (%sCOD) |
|---|---|---|---|---|---|
| Yellow lupin | 0.26 ± 0.01 | 0.16 ± 0.01 | 47% | 36 | 92 |
| Vetch | 0.29 ± 0.02 | 0.20 ± 0.01 | 56% | 43 | 99 |
| Carrot | 0.31 ± 0.01 | 0.23 ± 0.01 | 66% | 31 | 100 |
| Spartina | 0.29 ± 0.01 | 0.21 ± 0.01 | 59% | 52 | 97 |
| White lupin | 0.26 ± 0.01 | 0.18 ± 0.01 | 52% | 35 | 100 |
| Triticale | 0.29 ± 0.00 | 0.20 ± 0.00 | 57% | 52 | 86 |
| Bracken | 0.18 ± 0.01 | 0.12 ± 0.01 | 34% | 22 | 92 |
| Sweet clover | 0.29 ± 0.01 | 0.18 ± 0.01 | 53% | 42 | 88 |
| Winter barley | 0.30 ± 0.01 | 0.21 ± 0.01 | 60% | 51 | 93 |
| Winter bean | 0.35 ± 0.02 | 0.23 ± 0.02 | 66% | 55 | 89 |
| Sweet pea | 0.37 ± 0.03 | 0.24 ± 0.02 | 70% | 61 | 93 |
| Oilseed rape | 0.29 ± 0.02 | 0.18 ± 0.01 | 51% | 59 | 90 |
| Buckwheat | 0.32 ± 0.02 | 0.22 ± 0.01 | 63% | 54 | 98 |
| Rosebay willow | 0.20 ± 0.01 | 0.13 ± 0.01 | 37% | - | - |
| Quinoa | 0.33 ± 0.02 | 0.24 ± 0.01 | 70% | - | - |
| Model Variables | p | R2 | Predictor Variables p-Values | ||||||
|---|---|---|---|---|---|---|---|---|---|
| NDF | ADF | C | H | L | CP | St | |||
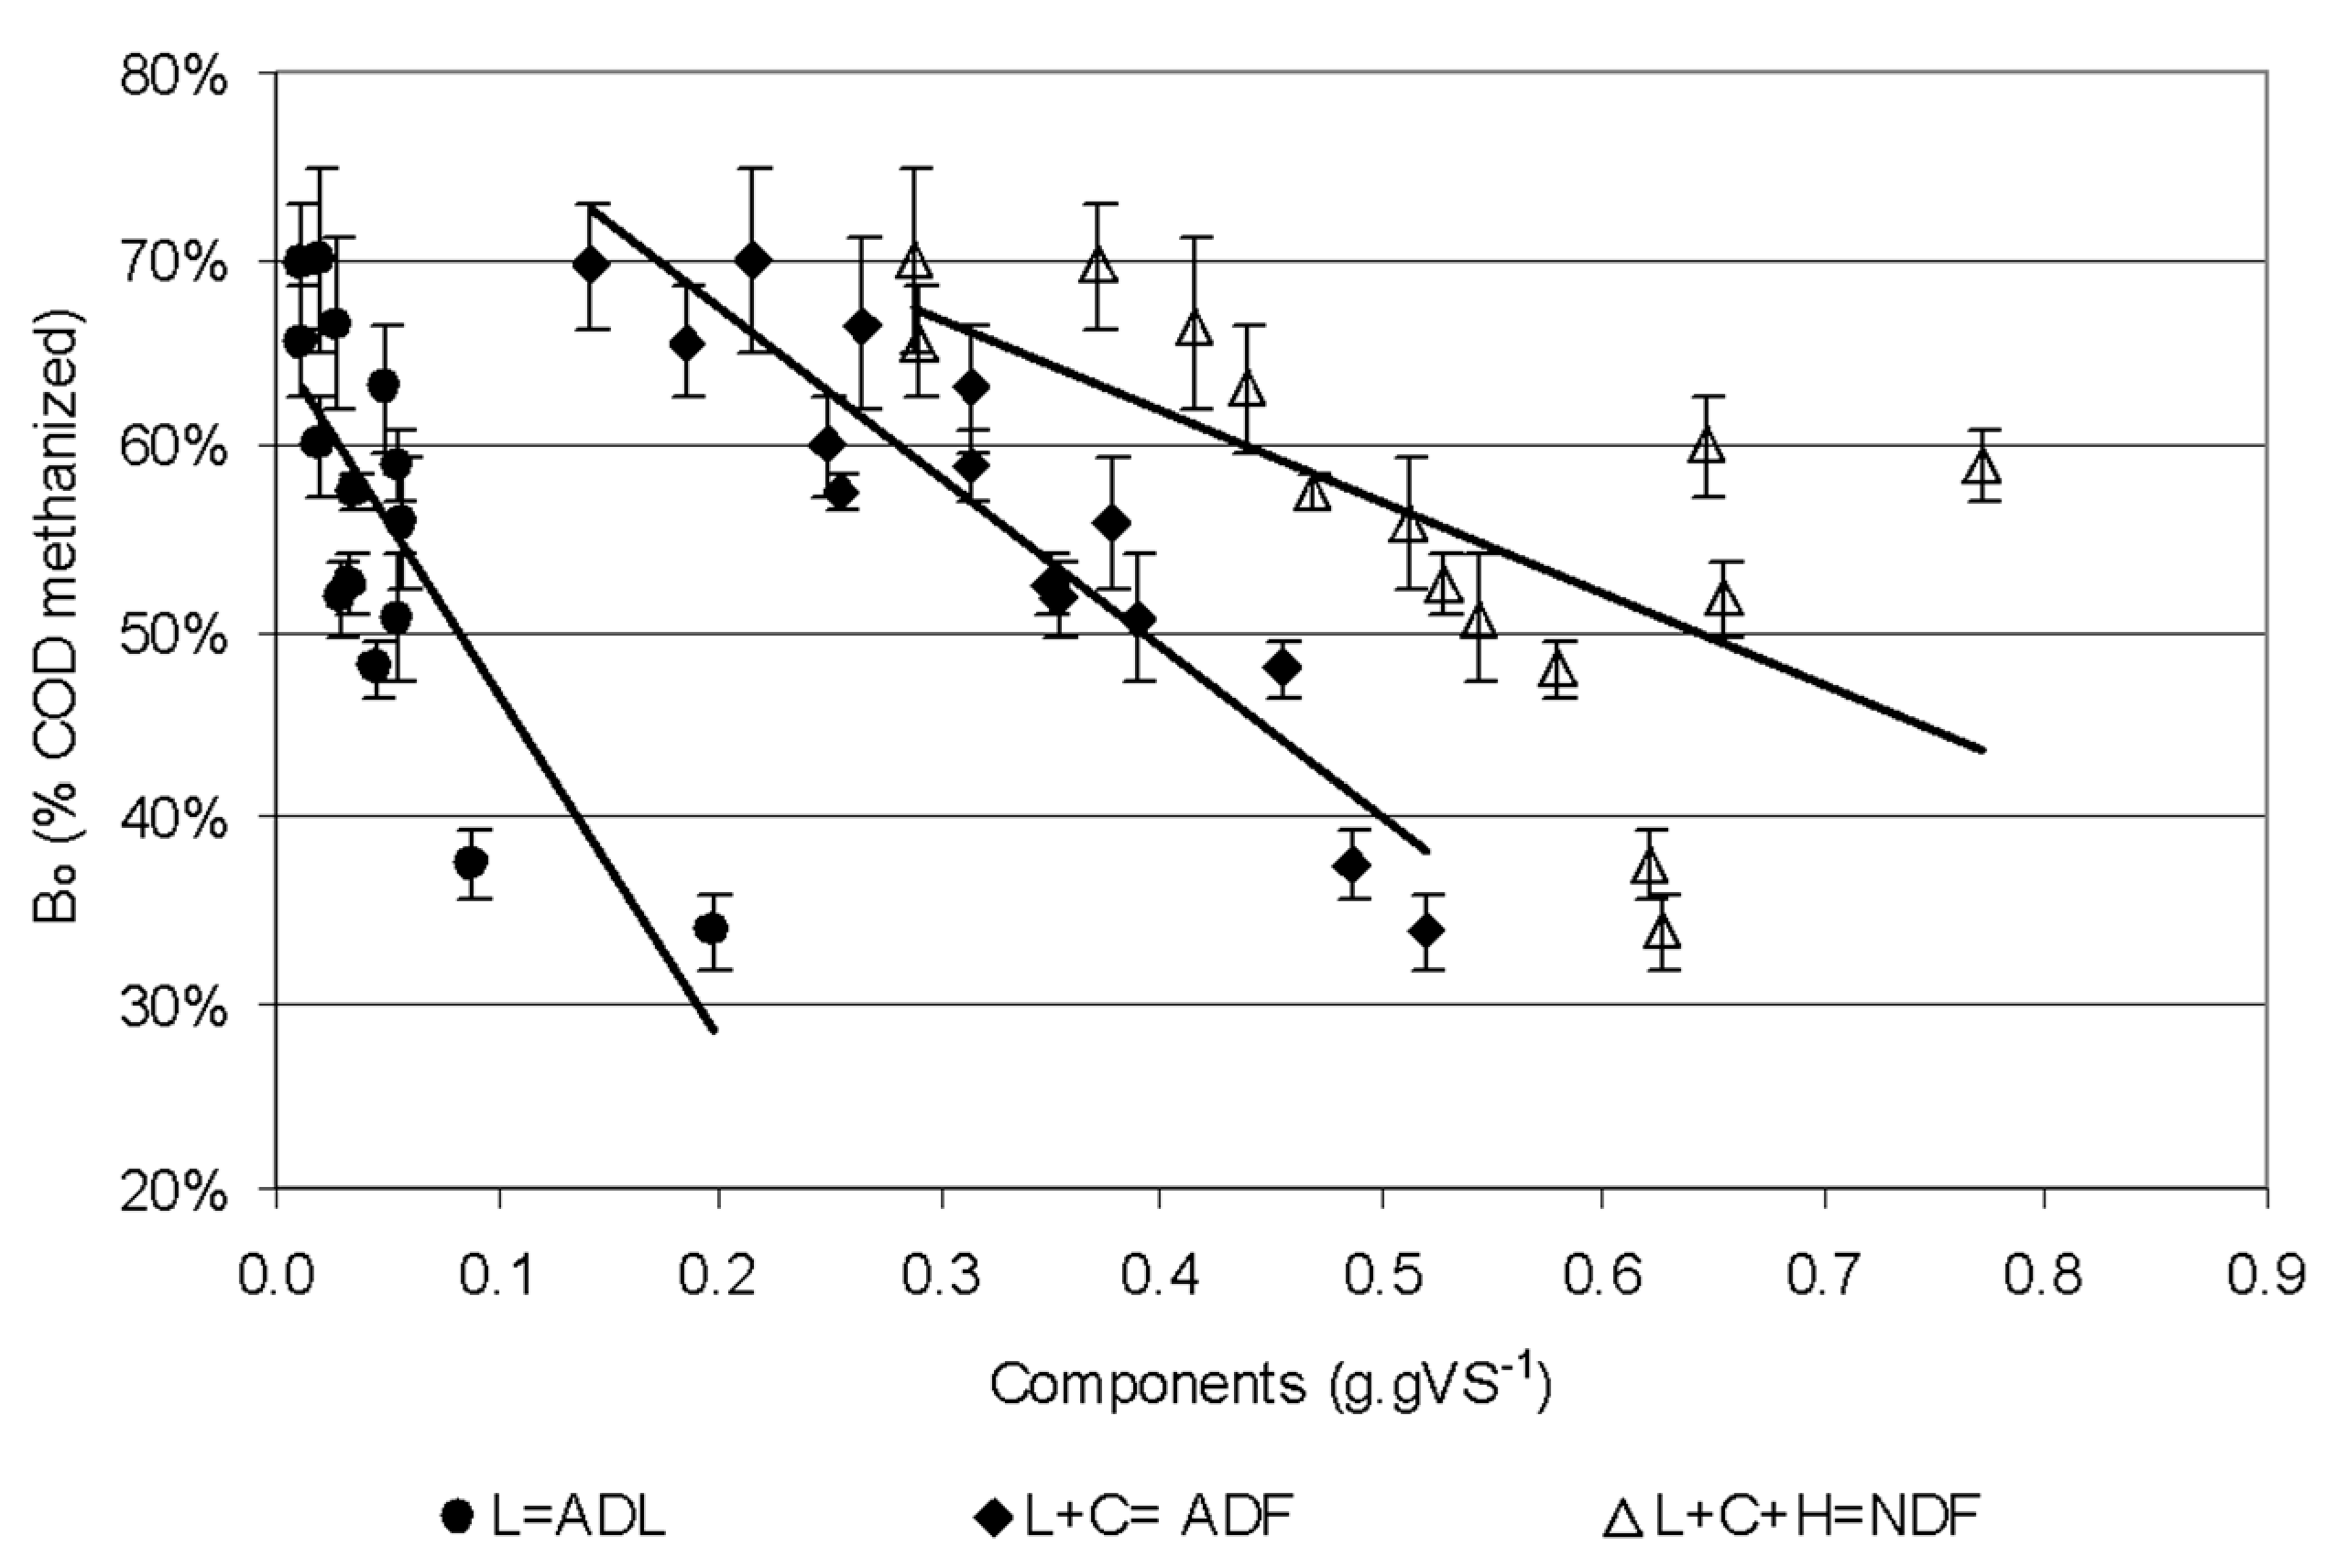
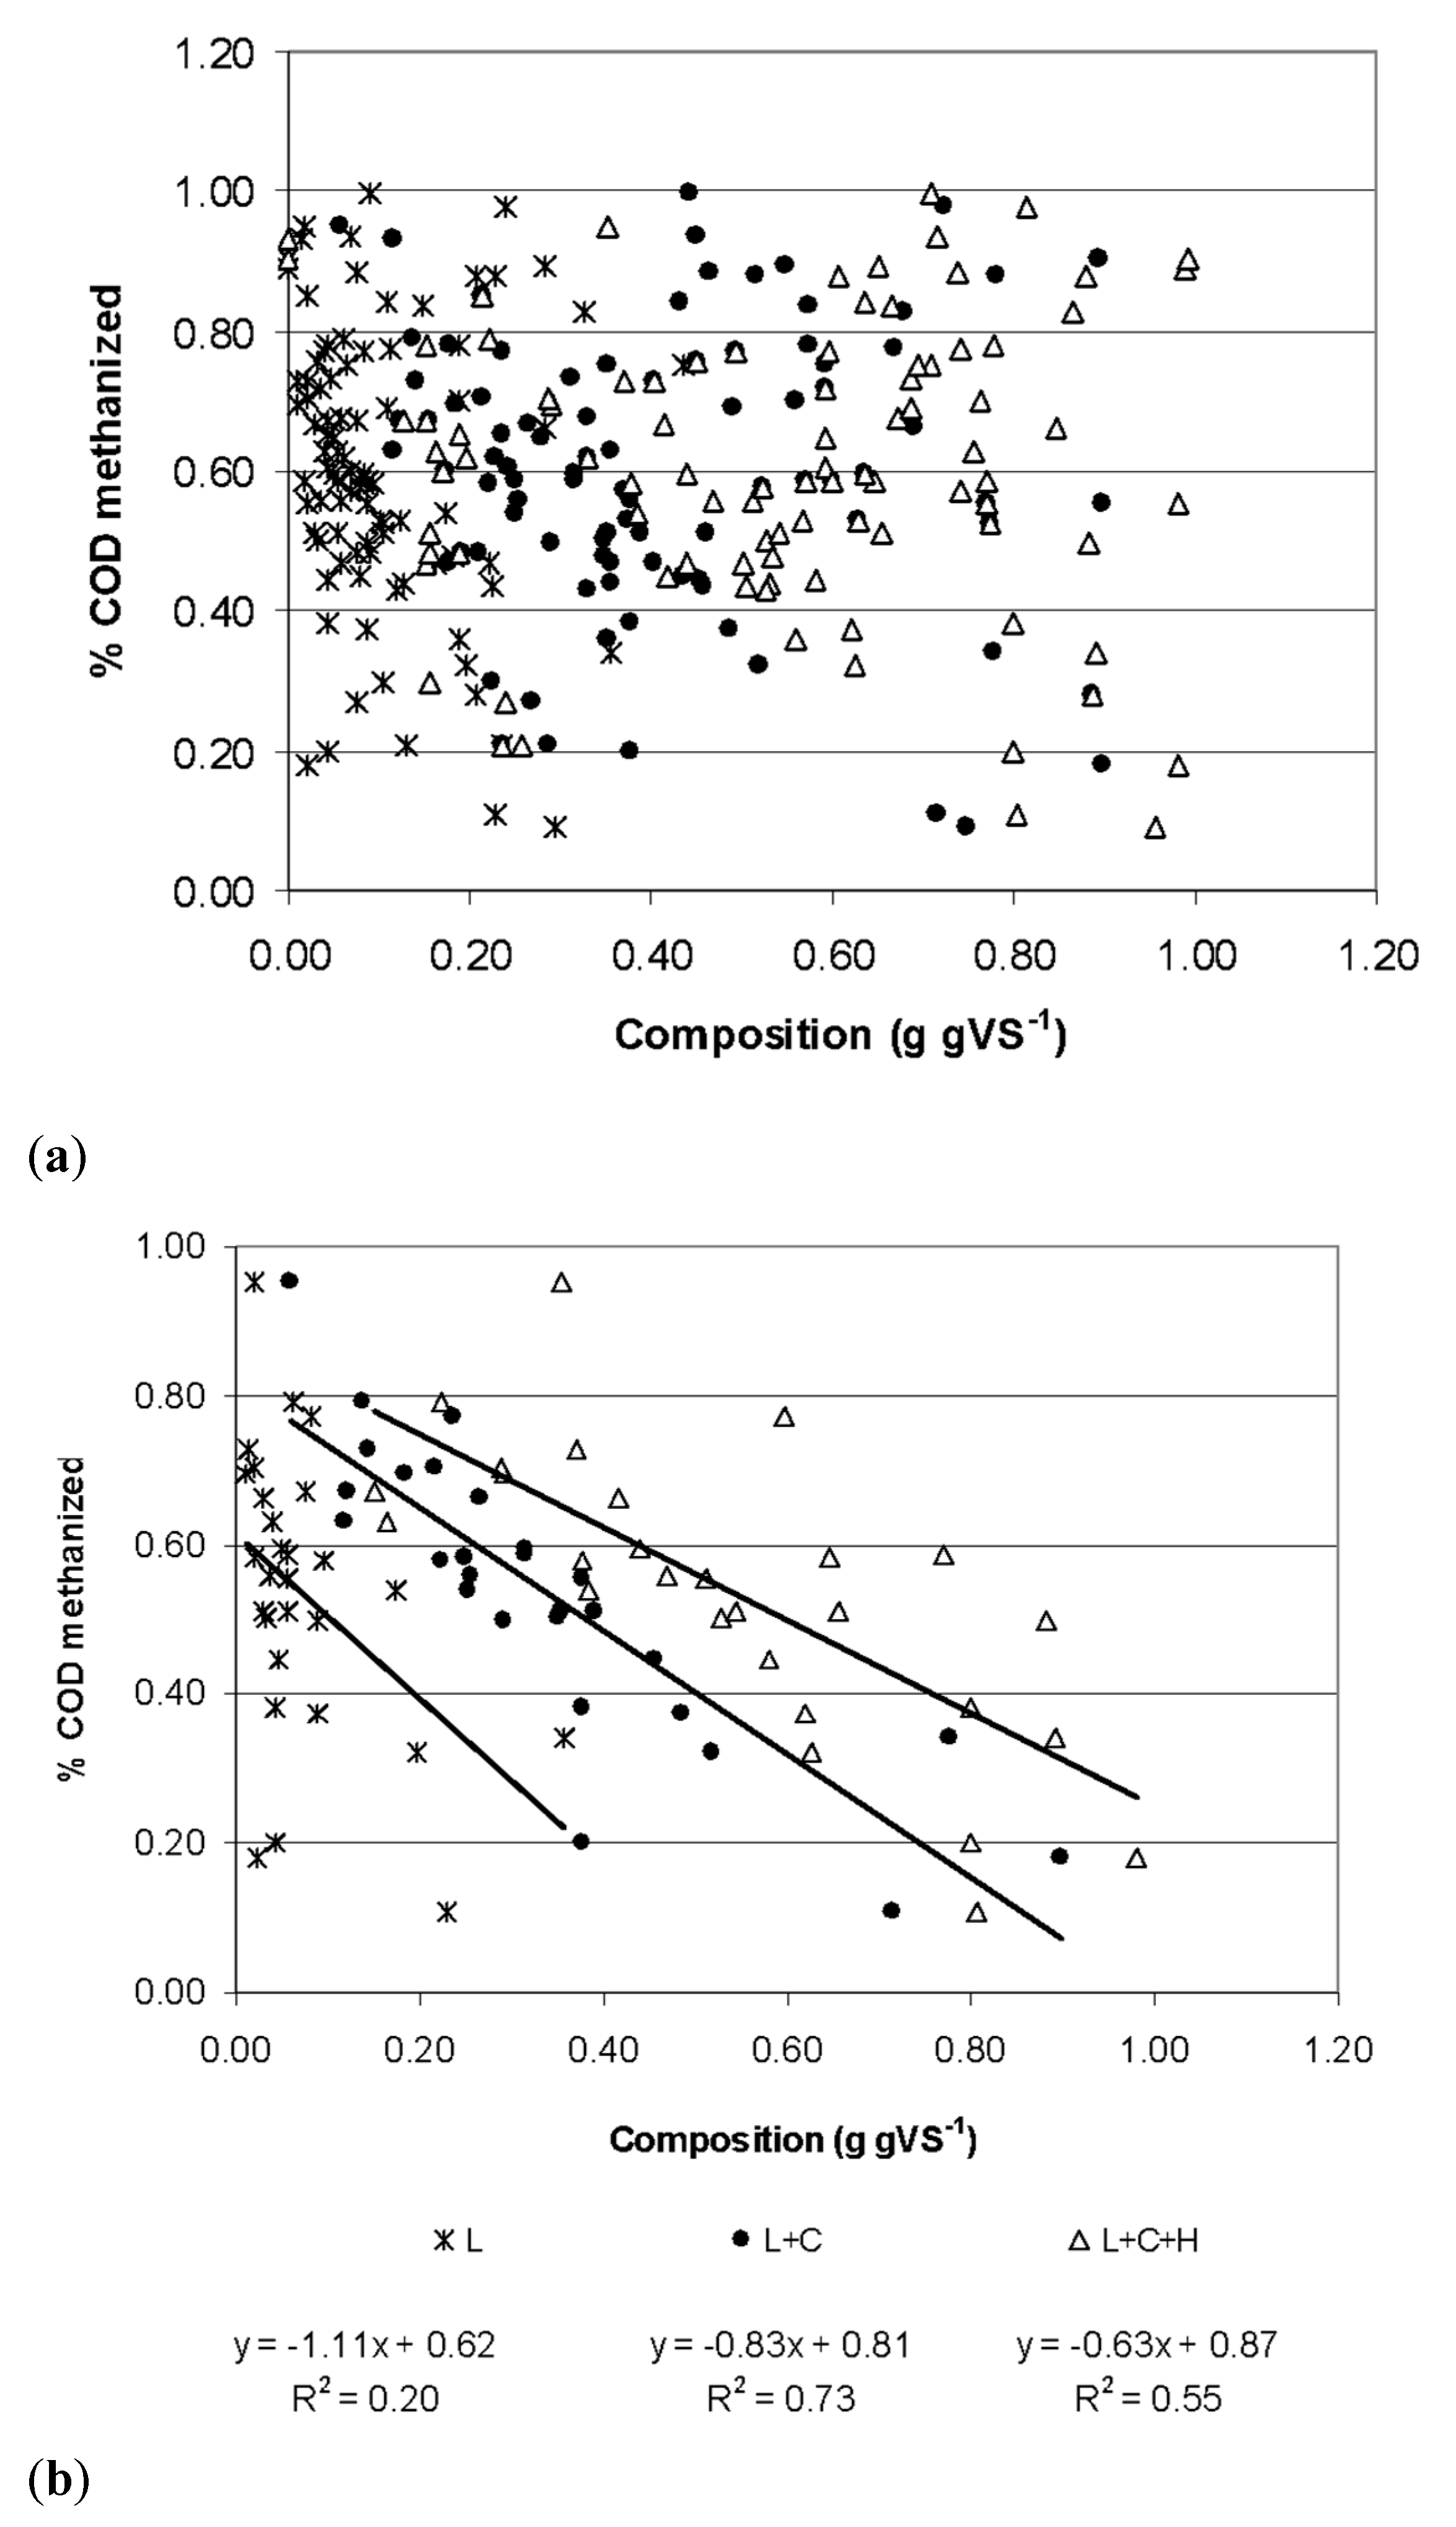
| ADF | 2 | 0.86 | - | 0.000 | - | - | - | - | - |
| C, L | 3 | 0.87 | - | - | 0.000 | - | 0.001 | - | - |
| ADL = L | 2 | 0.61 | - | - | - | - | 0.000 | - | - |
| NDF | 2 | 0.37 | 0.010 | - | - | - | - | - | - |
| C | 2 | 0.65 | - | - | 0.000 | - | - | - | - |
| C,H | 3 | 0.63 | - | - | 0.000 | 0.953 | - | - | - |
| C,L,St | 4 | 0.88 | - | - | 0.000 | - | 0.000 | - | 0.138 |
| C,L,CP | 4 | 0.88 | - | - | 0.000 | 0.000 | 0.132 | - | |
| C,H,L | 4 | 0.87 | - | - | 0.000 | 0.385 | 0.001 | - | - |
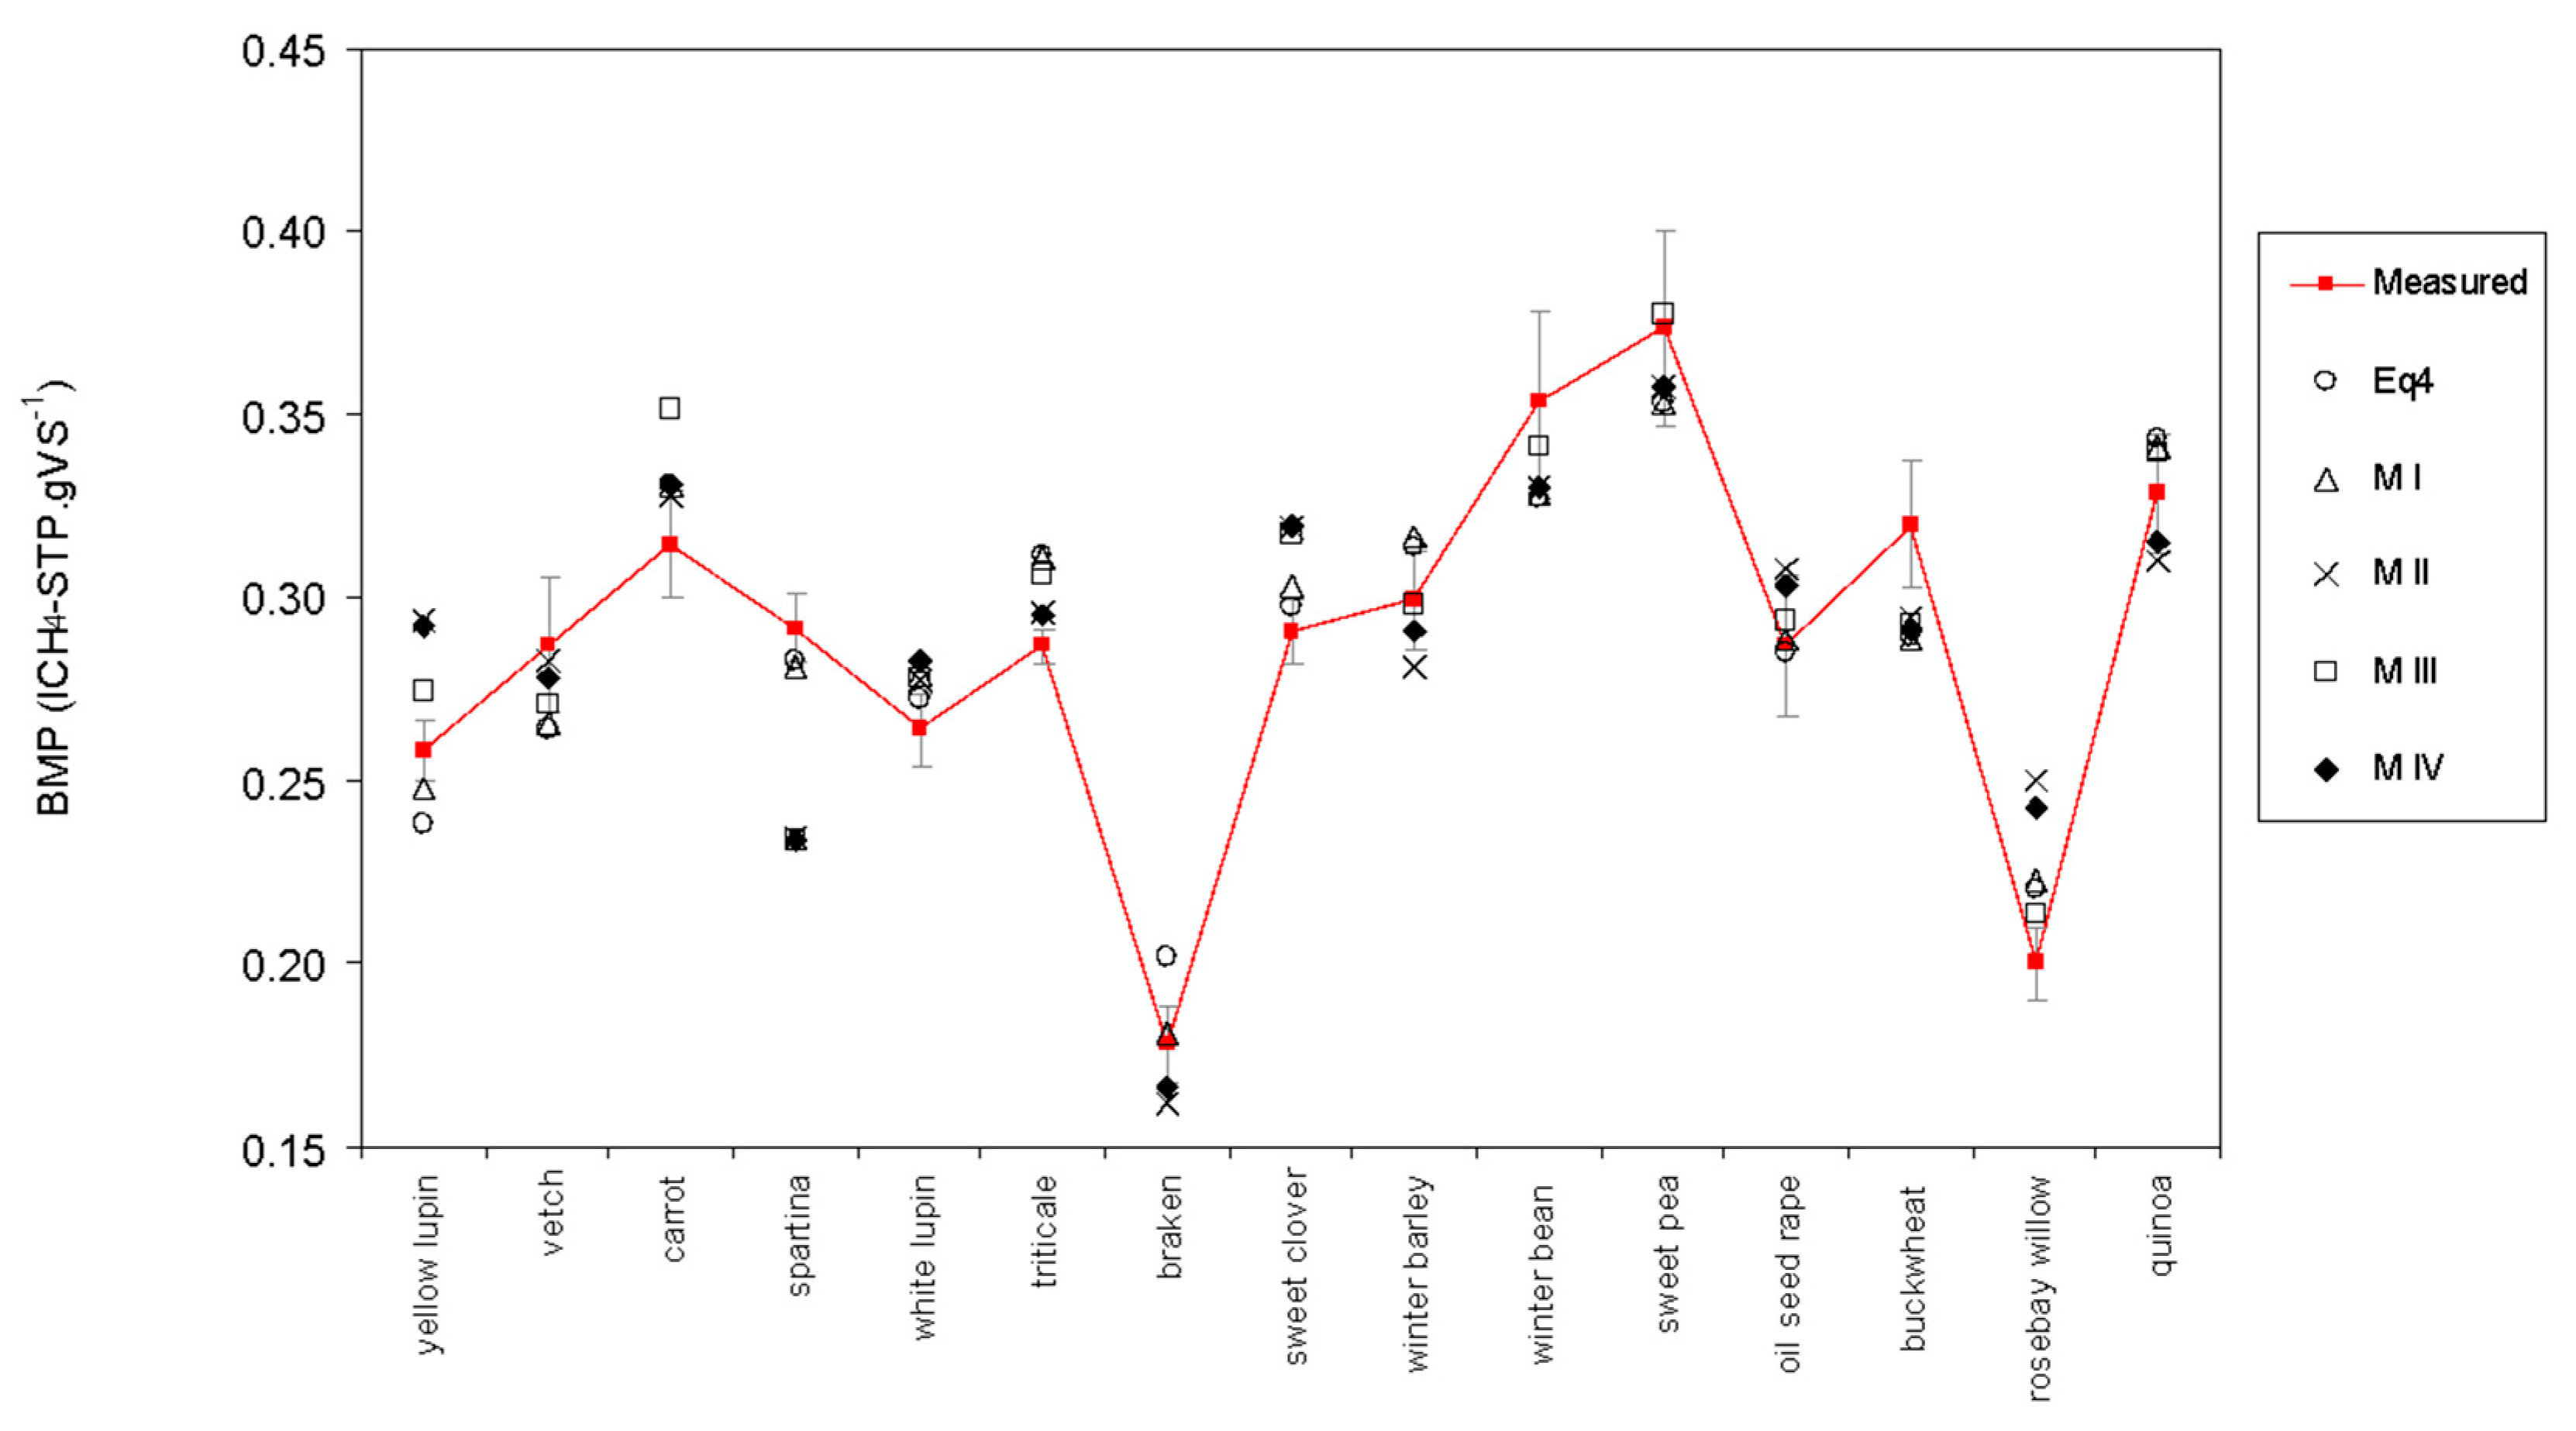
| Model | Assumption Tested | R2 | RSS | Fpr | |
|---|---|---|---|---|---|
| I | 86 | 0.006 | <0.001 | ||
| II | 81 | 0.016 | <0.001 | ||
| III | 73 | 0.011 | <0.001 | ||
| IV | 75 | 0.011 | <0.001 | ||
© 2020 by the authors. Licensee MDPI, Basel, Switzerland. This article is an open access article distributed under the terms and conditions of the Creative Commons Attribution (CC BY) license (http://creativecommons.org/licenses/by/4.0/).
Share and Cite
Pabón-Pereira, C.P.; Hamelers, H.V.M.; Matilla, I.; van Lier, J.B. New Insights on the Estimation of the Anaerobic Biodegradability of Plant Material: Identifying Valuable Plants for Sustainable Energy Production. Processes 2020, 8, 806. https://doi.org/10.3390/pr8070806
Pabón-Pereira CP, Hamelers HVM, Matilla I, van Lier JB. New Insights on the Estimation of the Anaerobic Biodegradability of Plant Material: Identifying Valuable Plants for Sustainable Energy Production. Processes. 2020; 8(7):806. https://doi.org/10.3390/pr8070806
Chicago/Turabian StylePabón-Pereira, Claudia P., H. V. M. Hamelers, Irene Matilla, and Jules B. van Lier. 2020. "New Insights on the Estimation of the Anaerobic Biodegradability of Plant Material: Identifying Valuable Plants for Sustainable Energy Production" Processes 8, no. 7: 806. https://doi.org/10.3390/pr8070806