the Creative Commons Attribution 4.0 License.
the Creative Commons Attribution 4.0 License.
 | 28 Jun 2022
Rainfall-induced landslide early warning system based on corrected mesoscale numerical models: an application for the southern Andes
Ivo Fustos-Toribio
Nataly Manque-Roa
Daniel Vásquez Antipan
Mauricio Hermosilla Sotomayor
Viviana Letelier Gonzalez
Rainfall-induced landslides (RILs) are an issue in the southern Andes nowadays. RILs cause loss of life and damage to critical infrastructure. Rainfall-induced landslide early warning systems (RILEWSs) can reduce and mitigate economic and social damages related to RIL events. The southern Andes do not have an operational-scale RILEWS yet. In this contribution, we present a pre-operational RILEWS based on the Weather and Research Forecast (WRF) model and geomorphological features coupled to logistic models in the southern Andes. The models have been forced using precipitation simulations. We correct the precipitation derived from WRF using 12 weather stations through a bias correction approach. The models were trained using 57 well-characterized RILs and validated by ROC analysis. We show that WRF has strong limitations in representing the spatial variability in the precipitation. Therefore, accurate precipitation needs a bias correction in the study zone. We used accurate precipitation simulation and slope, demonstrating a high predicting capacity (area under the curve, AUC, of 0.80). We conclude that our proposal could be suitable at an operational level under determined conditions. A reliable RIL database and operational weather networks that allow real-time correction of the mesoscale model in the implemented zone are needed. The RILEWSs could become a support to decision-makers during extreme-precipitation events related to climate change in the south of the Andes.
- Article
(14081 KB) - Full-text XML
- BibTeX
- EndNote


Rainfall-induced landslides (RILs) are natural hazards that generate a large number of casualties and economic losses every year. Rainfall, soil, and slope play a key role in RIL genesis that must be evaluated in each case. Despite RIL research in recent years, RILs cannot be avoided. Rainfall-induced landslide early warning systems (RILEWSs) become a powerful alternative for mitigating human losses and reducing infrastructure damage (Guzzetti et al., 2020; Chikalamo et al., 2020; Hermle et al., 2021). The increase in RIL events showed devastating effects, including loss of human life and destruction of the natural and urban environment (Marjanović et al., 2018). Recent RILs affected critical infrastructure and highways in populated areas (Chikalamo et al., 2020; Fustos et al., 2020a; Peruccacci et al., 2017; Fustos et al., 2021). In South America, RILs have caused high social and economic impacts; they require better evaluation in future (Sepulveda and Petley, 2015). The present work evaluates the design of a RILEWS using a mesoscale atmospheric model coupled to a logistic model to mitigate the effect of RILs in the southern Andes.
Due to new extreme rainfall events related to climate change, RIL events are increasing in the southern Andes and other parts of the world. To mitigate the impact of extreme-precipitation RILEWSs have gained interest to mitigate the impact of RILs using different approaches (Peres and Cancelliere, 2014; Tiranti et al., 2014; Sättele et al., 2015; Segoni et al., 2018; Cremonini and Tiranti, 2018; Fan et al., 2019; Tiranti et al., 2019; Thirugnanam et al., 2020; Bernard and Gregoretti, 2021; Lee et al., 2021). RILEWSs based on precipitation thresholds show good agreement but do not consider the effect of soil moisture, leading to bias in their predictive capacity (Marra et al., 2017; Zhao et al., 2019; Chikalamo et al., 2020). Some historically based RILEWSs with long-term observations, climate reanalysis models, and atmospheric mesoscale models experience issues related to the spatial and temporal resolution, reducing the performance due to low precipitation accuracy (Lazzari and Piccarreta, 2018; Tichavský et al., 2019).
RILEWSs require accurate precipitation data delivered from local weather stations in dense weather networks, satellite estimations, and atmospheric mesoscale models. However, atmospheric mesoscale models were shown to be incapable of representing accurate precipitation fields in areas with complex topography like the southern Andes (Yáñez-Morroni et al., 2018). Currently, mesoscale models are restricted to the quality of their atmospheric forcings, requiring ensembles to be generated to obtain approximate solutions (Wayand et al., 2013). Moreover, the mesoscale models demand intensive computational efforts that increase the difficulty of coupling to RILEWSs (Yáñez-Morroni et al., 2018; Schumacher et al., 2020; Yang et al., 2021). Recently, mesoscale atmospheric models coupled to local weather stations have allowed the delimitation of areas susceptible to RILs by means of deterministic numerical models (Fustos et al., 2020a). Nowadays, bias correction approaches contribute to reducing the time needed to compute mesoscale models, improving the estimation of precipitation using in situ stations (Srivastava et al., 2015; Bannister et al., 2019; Heredia et al., 2018; Jeong and Lee, 2018; Osman et al., 2021; Worku et al., 2020). Therefore, a correct implementation of mesoscale models could allow accurate precipitation in RILEWSs. Nonetheless, the application of corrected mesoscale models in RILEWSs in complex topography has not been evaluated yet.
The objective of the present work was to evaluate the implementation of a RILEWS based on a mesoscale atmospheric model coupled to a logistic model. We corrected mesoscale models (models that allow atmospheric processes to be represented at the synoptic scale) using weather stations, generating likely-RIL probability zones for the first time in the southern Andes. The paper is structured as follows: after the introduction, the second section describes the study site and its pertinence to implement RILEWSs. In the third section, we describe the data and methods, including the calibration and validation procedures. In the fourth section, we outline the main results of the proposed RILEWS, focusing on the quality of predictors and model outputs. The fifth and final section comprises the discussion and conclusions, presenting the implications of this proposal and their general applicability to the southern Andes.
We evaluated the implementation of RILEWSs in the southern Andes and the northern part of the Patagonian Andes (∼ 40.0–42.5∘ S, ∼72.0–73.5∘ W; Fig. 1). A prolonged increase in RIL events in this area took place during the period 2012–2019, generated by extreme-precipitation events (Espinoza et al., 2019). The area presents three principal morphological units in bands oriented north–south. From west to east, they are the Coastal Range, the Central Valley and the Andes Range (Fig. 1). In the western area, altitudes range from 100–1000 m a.s.l., with slopes between 0 and 25∘. In the central valley, the maximum altitude is 150 m.a.s.l., with slopes between 0 and 15∘ in the central part and between 25 and 45∘ towards the Andes. Finally, the highest altitudes (400 to 2700 m a.s.l.) and the steepest slopes (25–70∘) are found in the eastern zone (Gomez-Cardenas and Garrido-Urzua, 2018).
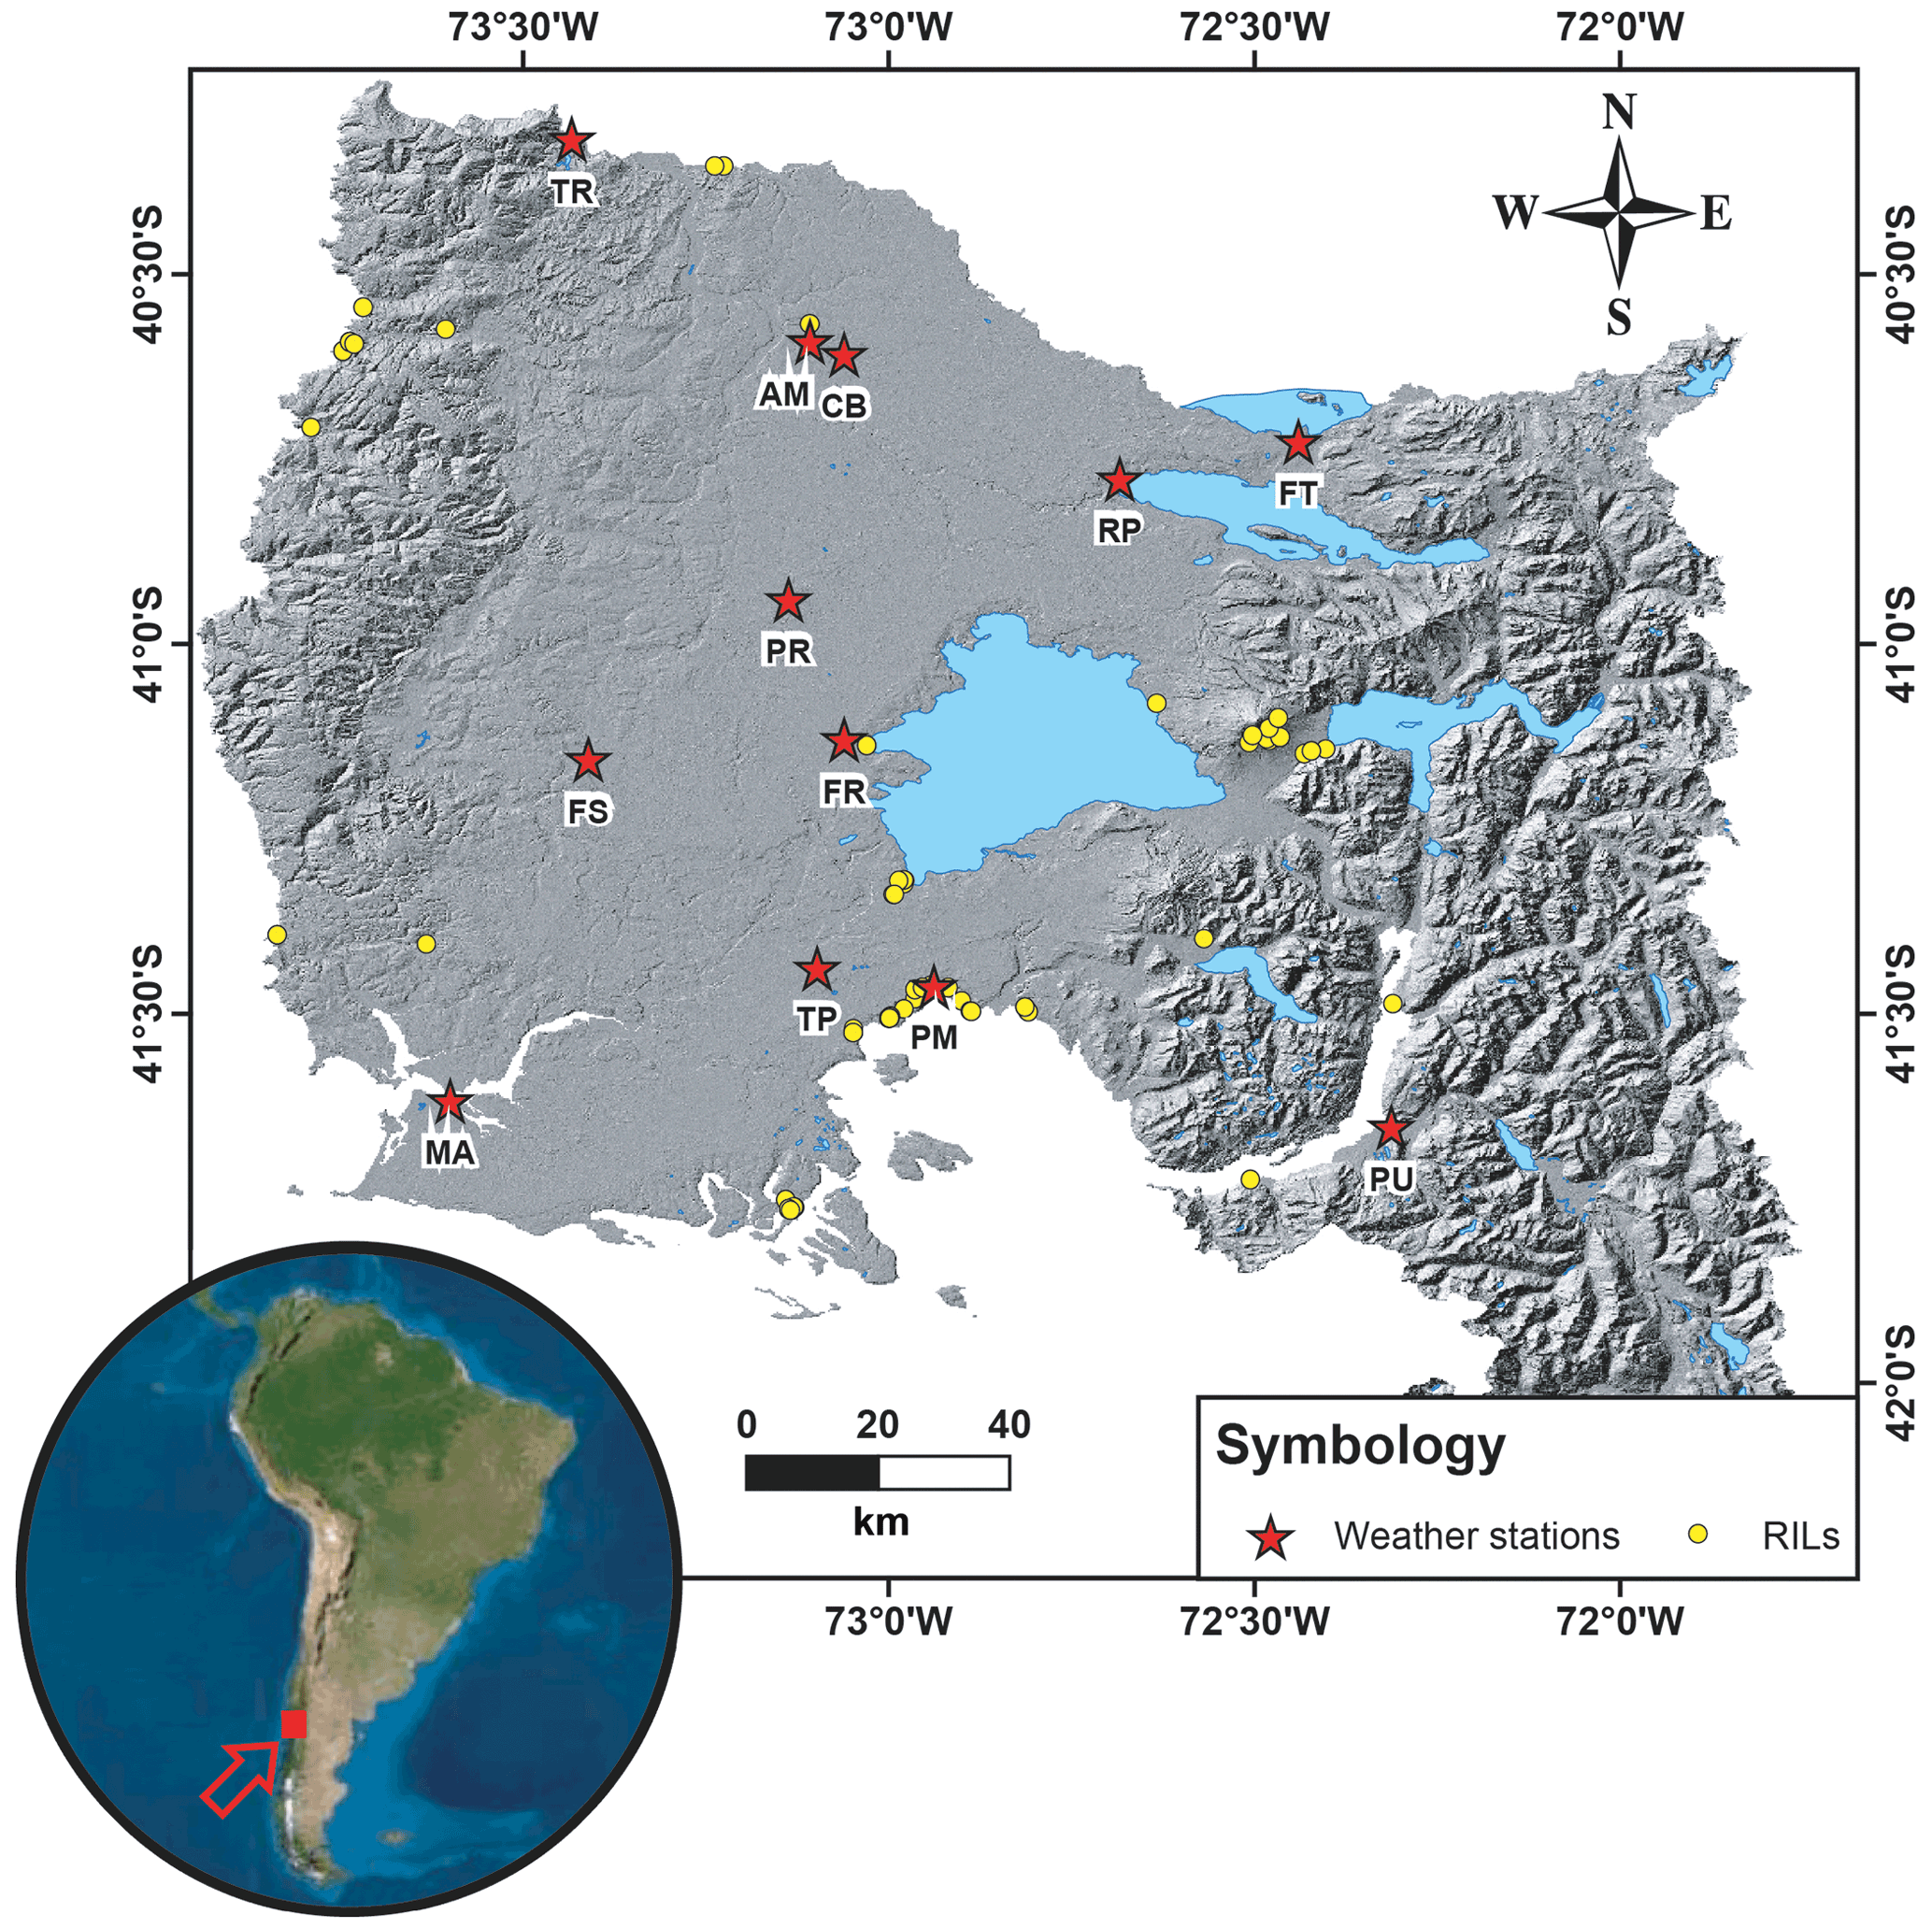
Figure 1Study area in the southern Andes zone and the northern part of the Patagonian Andes. RIL events in the area are highlighted with yellow dots, and red stars mark the meteorological stations available. Hillshade based on Shuttle Radar Topography Mission (SRTM) data.
Average annual precipitation is strongly correlated with topography and latitude. In the northern segment (∼40∘33′–∼41∘10′ S) it is over 1200 mm per year, while in the south (∼41∘10′–∼42∘10′ S) it rises to over 1400 mm per year. In the Central Valley, the precipitation exceeds 1910 mm per year. The highest precipitation is recorded in the Andes Range, of over 4000 mm (Alvarez-Garreton et al., 2018). The climate in the area is classified as oceanic climate (Beck et al., 2018) with a dry summer in the northern portion, but no dry months in the south (Alvarez-Garreton et al., 2018).
The oldest geological units in the area correspond to Cretaceous intrusive bodies which emerge in the Rupanco Lake peninsula and further south. In the Coastal Range, there are outcrops of metamorphic rocks from the Paleozoic–Triassic (300–250 Ma). These rocks are largely covered by sedimentary deposits of various origins: marine from the Oligocene–Miocene (eastern flank of the Coastal Range), volcanic from the Oligocene–Miocene (40 to 5 Ma; south of Rupanco Lake), and glacial from the Pleistocene–Holocene. In the south-east of the region is the North Patagonian Batholith (132–77 Ma), consisting of granites, granodiorites, tonalites, and leucogranites (Gomez-Cardenas and Garrido-Urzua, 2018). Elsewhere in the region, there are clayey soils called trumaos and ñadis, which have developed from glacial–fluvial–volcanic sediments. These soils present a high organic content, poor drainage, and low development (Blanco and de la Balze, 2020).
We assessed the feasibility of a RILEWS applied to RILs using geomorphological and precipitation forcings for the southern Andes. We consider an approximation of the probability of occurrence of RILs through logistic distributions. The probability allows a spatialization of “likely-landslide” or “not likely-landslide” conditions under established precipitation and topographical conditions. Precipitation data and local geomorphological features were integrated into a logistic model as predictors to evaluate the occurrence of RILs. These variables were taken into account because both the precipitation and the topography predispose the study area to RILs (Fustos et al., 2017, 2020a). We do not use additional data, such as soil moisture or climatic index, to avoid complex models, allowing fast estimations into an operational stage. We used a RIL database (Gomez-Cardenas and Garrido-Urzua, 2018) separated into calibration sub-database and validation sub-database to evaluate the models' performance. The bias associated with the precipitation obtained from the mesoscale model was corrected using in situ stations (Fig. 2). To establish the reliability of the model for the correct prediction of RILs, its sensitivity was calculated using the validation subset. This allowed the RIL prediction sensitivity to be characterized for operational implementation in future RILEWSs.
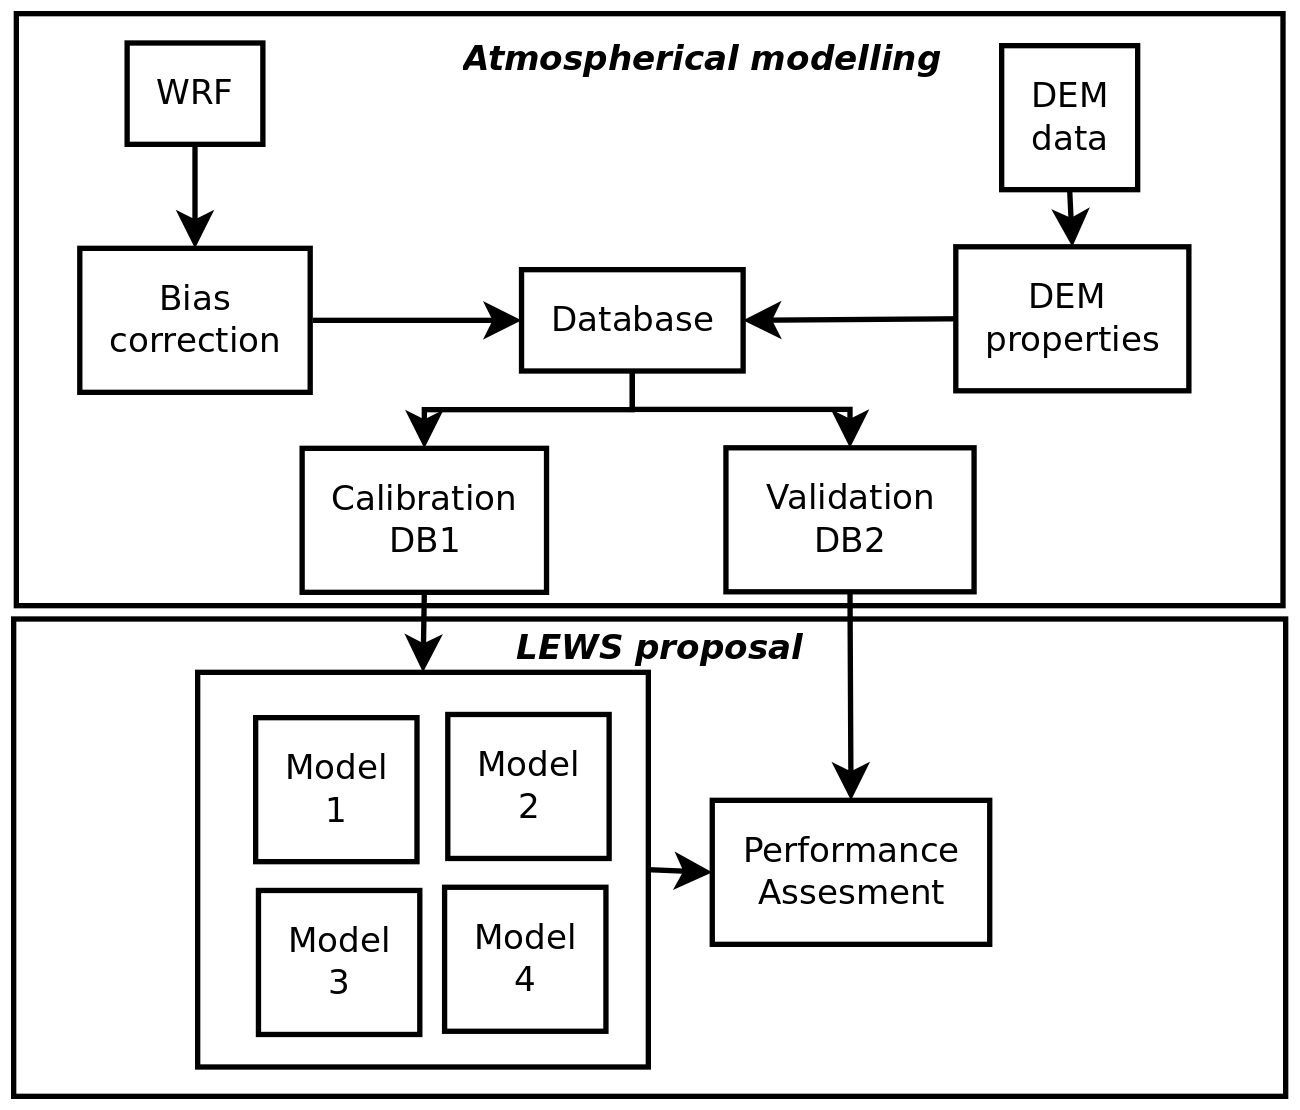
Figure 2Short methodological description. The first phase is explained in detail in Sect. 3.1, and the second stage is explained in Sect. 3.2 and 3.3.
3.1 Atmospheric modelling
The study area contains a limited number of meteorological stations, making representing the spatial distribution of precipitation a challenge. To overcome the limitation imposed by the meteorological data, precipitation fields were estimated using the Weather and Research Forecast model 4.0 (WRF; Skamarock et al., 2019). Atmospheric conditions were simulated for the period 2014 to 2018 at hourly time resolution. We used a spatial resolution of 4 km that allows the representation of the complex topography of the Andes. WRF parameterization followed the WSM 3-Class Simple Ice Scheme microphysical model (Hong et al., 2004), while the soil–atmosphere interaction was parameterized by the Unified Noah Land-Surface Model (Tewari et al., 2004). The Final Operational Global Analysis product from the US National Centers for Environmental Prediction (NCEP), also known as FNL (NCEP, 2000), was used as the global forcing to obtain the solutions of precipitation at 4 km or the mesoscale (resolution on the order of kilometres).
The precipitation fields of the WRF model were compared with 12 meteorological stations available in the area to evaluate the bias of the numerical model (Fig. 1). Biases associated with local effects of the parameterization selected in WRF were corrected by MeteoLab (Wilcke, 2013) using three different methods. The first approach corresponds to the PP_M4A method with a perfect prognosis approach (San-Martin et al., 2017). The perfect prognosis establishes statistical relationships between the variables at large and local scales. The physical processes on intermediate scales could be ignored (Maraun et al., 2010). The second approach, corresponding to the ISI_MIP method, corrects at different timescales using the monthly mean followed by correction of the daily variability about the monthly mean (Hempel et al., 2013). The ISI_MIP method requires a long time series of data, requiring weather stations with little gaps in the data. The last method corresponds to BC_QPQM, which focuses on extreme-value correction and its effects on the bias correction on the temporal change signal. The methodology requires weather stations without data gaps in the time series. In some cases, outliers exist, showing problems when correcting these situations (Gutjahr and Heinemann, 2013). We compared the three methods with WRF without corrections using different statistics functions such as bias, MAE, RMSE, and Pearson and Spearman correlation coefficients. Subsequently, the model corrected with the lowest RMSE in precipitation was used in a RILEWS implementation.
3.2 Rainfall-induced landslide early warming
We propose a model for RILEWSs based on the probability of occurrence of RILs in space and time. The probability was determined using logit and probit logistic distribution functions, which have been implemented previously in the southern Andes (Fustos et al., 2017, 2020b). The advantage of logistic regressions is that they establish statistical relations between physical processes at different scales with a limited quantity of information (Fustos et al., 2020b). The logistic regressions were trained based on the local geomorphological conditions (slope) and previously modelled and corrected precipitation simulations. We used slope values derived from SRTM data with a spatial resolution of 30 m. A limited number of 4987 RILs have been reported for the south of Chile (Gomez-Cardenas and Garrido-Urzua, 2018). However, 2035 RILs exist in the zone, and only 57 RIL events have an exact date. The final database considers mudflow, debris flow, and mass wasting. The current dataset is the most comprehensive landslide catalogue for the zone in comparison to well-validated global datasets such as the Global Landslide Catalog (GLC) (Kirschbaum et al., 2010) and the Global Fatal Landslide Database (GFLD) (Froude and Petley, 2018) developed into other studies (Destro et al., 2017; Rossi et al., 2017; Wang et al., 2021).
The logit distribution model fit the probability of occurrence of an event using a logistic curve (Li et al., 2011). The logit distribution model (L) is given by
where L(yi=1) is the probability of occurrence of a RIL, N is the number of predictors used (Xk), is the coefficient of the function, and βo′ is the intercept. A probit distribution also uses binary dependent variables, and its main difference from the logit distribution is the use of the inverse standard normal distribution. The probit distribution (P) (McCullagh and Nelder, 1989) is given by
where k, β, and Xk refer to the same variables as the logit distribution, ϵ is the error in the fit with standard normal distribution , and Φ−1 denotes an inverse normal probability function (McCullagh and Nelder, 1989). Four predictors were used for both the logit and probit functions, daily precipitation, precipitation over the previous 7 and 30 d, and slope (Table 1). The complete RIL database was split into a calibration sub-base (DB1) and an independent calibration validation sub-base (DB2) for subsequent evaluation (Fig. 2). The database was split by taking between 20 % and 30 % of the data, chosen at random, for calibration. A calibration set was selected 100 times to obtain βk and , and their standard deviations denoted by ωk and , respectively, calculated according to the methodology presented by Fustos et al. (2020b).

3.3 Performance assessment
The quality of each regression was evaluated by ROC analysis (Fawcett, 2006) using the independent database DB2 (Fig. 2). The DB2 has georeferenced the initial failure zone. We compared the initial failure zone to the pixel of our models (pixel that includes the point). This allowed us to understand the degree of accuracy in identifying a RIL event under determined conditions of slope and precipitation. A probability threshold (tolerance) was established to define the instant when the models identify a RIL event correctly. The tolerance was defined from the results of the ROC curve for probability thresholds between 50 % and 95 %. In this way, the sensitivity of each iteration was estimated (Eq. 3), representing the capacity of the set of estimators to detect RIL events correctly (Fawcett, 2006; Hand and Till, 2001). The sensitivity (S) was defined as the ratio of true-positive (TP) predictions of events to the total of positive events (including false-negative, FN, predictions). The specificity (E) was also calculated (Eq. 4) to evaluate the capacity of detection of non-RIL events or true negative (TN) to avoid false positives (FP) (Fawcett, 2006). Therefore, this methodology made it possible to evaluate the capacity of each model to detect RIL events (Fustos et al., 2020b). We propose that the threshold must be suitable to separate a likely-landslide event from a non-likely-landslide event. The threshold maximizes the sensibility in the four models with different degrees of performance of RILEWSs.
This work evaluated a new RILEWS based on two logistic models and forced by geomorphological and atmospheric conditions on a mesoscale in the southern Andes. We analysed the quality of the representation of atmospheric conditions of our RILEWS based on logistic identifiers and the performance in identifying RILs correctly in areas with complex topography.
4.1 Atmospheric modelling
The uncertainty in precipitation is a critical factor for RILEWSs (Guzzetti et al., 2020; Chikalamo et al., 2020). The uncorrected precipitation simulation showed low (∼0.26–0.49) to medium (∼0.32–0.67) correlation values (Pearson and Spearman correlation coefficients) in comparison to in situ weather stations. Our results showed a spatial dependence of the precipitation error between the mesoscale model and weather station. Stations located in the SW and NW extremes of the domain presented low correlations in comparison to the WRF model (Fig. 3). Moreover, the meteorological stations in the eastern zone had RMSE between 16.33 and 18.00 mm, respectively. The RMSE for the rest of the stations ranged between 8.79 and 12.24 mm. Meanwhile, MAE showed similar values for all the stations (3.44–6.67 mm), while the bias varies between −4.0 and 5.2 mm, except in the stations on the W and SE borders (Fig. 4). Therefore, our results showed that the atmospheric model did not represent the spatial and temporal distribution of the precipitation. The corrected precipitation model showed higher performance in RMSE, correlation, and bias than in the original simulations (Fig. 3). The methods of the perfect prognosis (PP_M4A) family gave better performance than bias correction (BC) methods. The PP_M4a method generated smaller errors in the corrected fields compared to meteorological stations. The best-performing BC method, gpQM, did not diminish the MAE, which increased by 0.05 mm on average compared to the uncorrected model, but it did improve the RMSE by 2.47 mm on average (Fig. 3). Finally, the Spearman correlation coefficient produced a lower correspondence with the observations than the uncorrected simulation did. Therefore, our results showed that the mesoscale correction allows the rainfall representation quality to be improved.
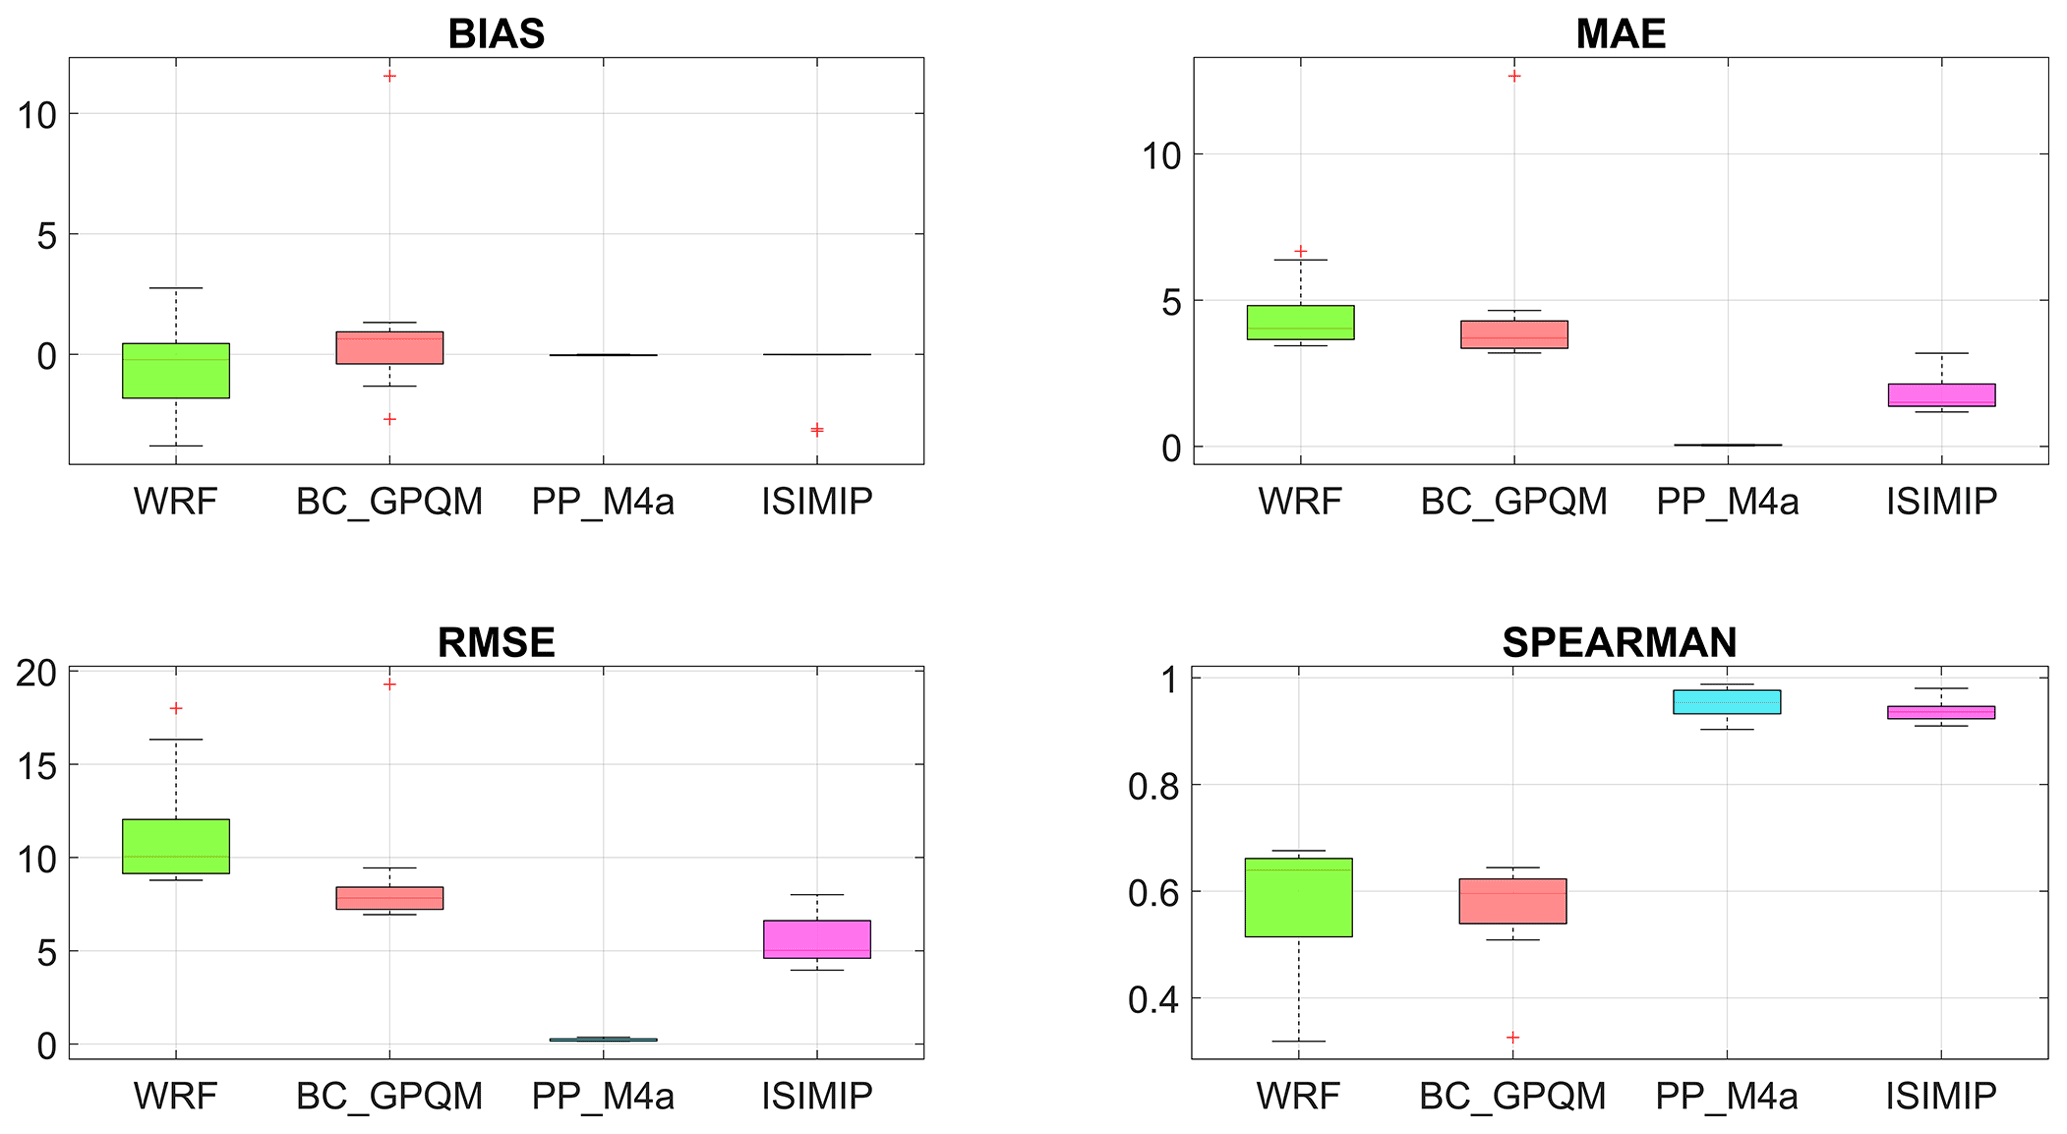
Figure 3Precision and reliability indicators. Bias (mm), MAE (mm), RMSE (mm), and Spearman correlation coefficient. WRF is the uncorrected model, while the other models are the different methodologies used for correction by MeteoLab.
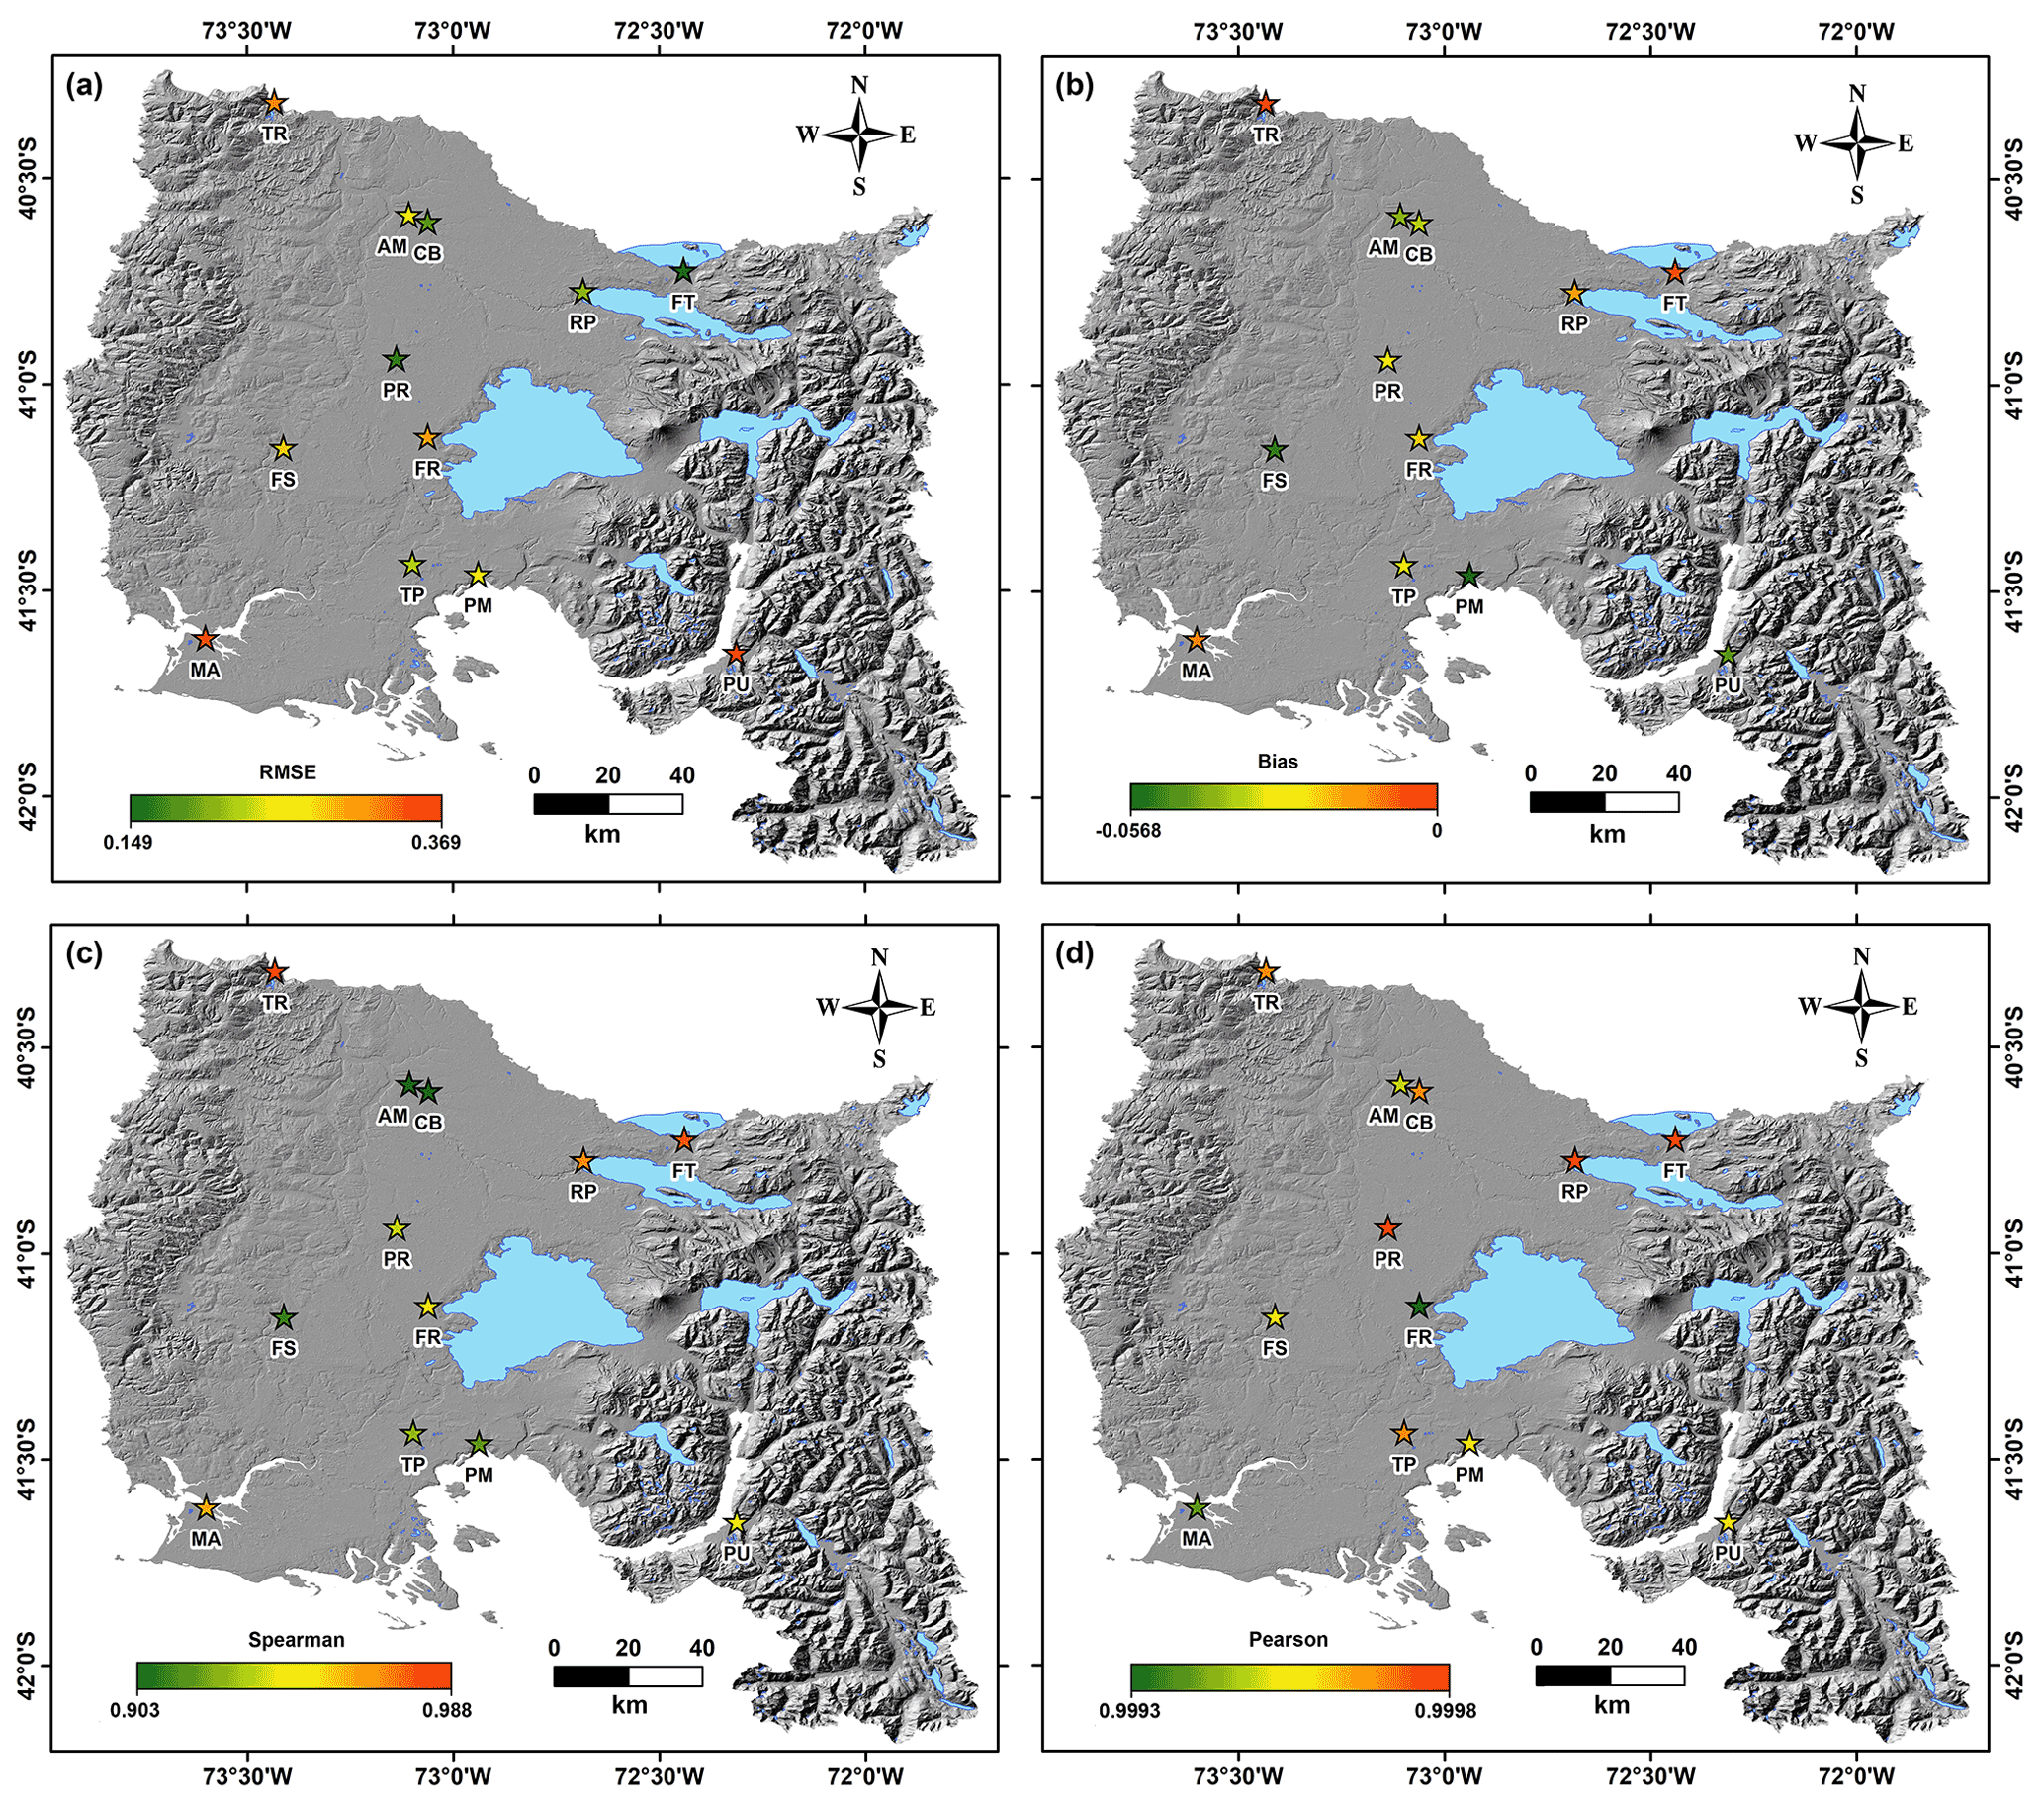
Figure 4Statistical assessment of the model-corrected data versus weather station data using the best results (PP_M4a). (a) BIAS of the simulation in comparison with stations, (b) MAE of the simulation in comparison with stations, (c) RMSE of the simulation in comparison with stations, (d) Spearman correlation coefficient of the simulation in comparison with stations. Hillshade based on SRTM data.
The precipitation fields corrected with different approaches of MeteoLab showed improved values in weather stations in comparison to the raw solution. The corrected ISI_MIP results were similar to those described for PP_M4a, but with slightly larger error values. Both ISI_MIP and PP_M4a presented a bias lower than 0.5 mm. The gpQM method varied between −2.69 and 0.95 mm (Fig. 3). We point out that the PP_M4a method showed the best performance considering MAE and the RMSE (∼0.04 and ∼0.23 mm, respectively). The Spearman correlation coefficient ranged between 0.90 and 0.98, increasing the quality of representation of the precipitation fields in comparison to weather stations.
4.2 Rainfall-induced landslide early warning
The probability of occurrence of RILs at the spatial and temporal scale was estimated using the precipitation values corrected using the PP_M4a approach. The results of the logit regression (Table 2) showed that the weight of the intercept varied by a maximum of ∼0.36 units for the four models, varying between 3.1658 ± 0.0091 and 3.5235 ± 0.0069 (Fig. 5). The estimators corresponding to the daily precipitation fluctuated between −0.8176 ± 0.0089 and −0.8124 ± 0.0066 (1 mm−1), while for the precipitation of the previous 7 d the estimator varied from −0.6413 ± 0.0063 to 0.0020 ± 0.0086 (1 mm−1). The indicator obtained for the monthly precipitation was −0.3518 ± 0.0033 (1 mm−1) (used exclusively for the M3 model), while the slope estimator fluctuated between −0.1696 ± 0.0049 and −1289 ± 0.0072 (1 per degree) (Fig. 5).

Table 2Values of the estimators for the logit models. False-positive rate (FPR) and true-positive rate (TPR) were evaluated with a threshold of 95 %.
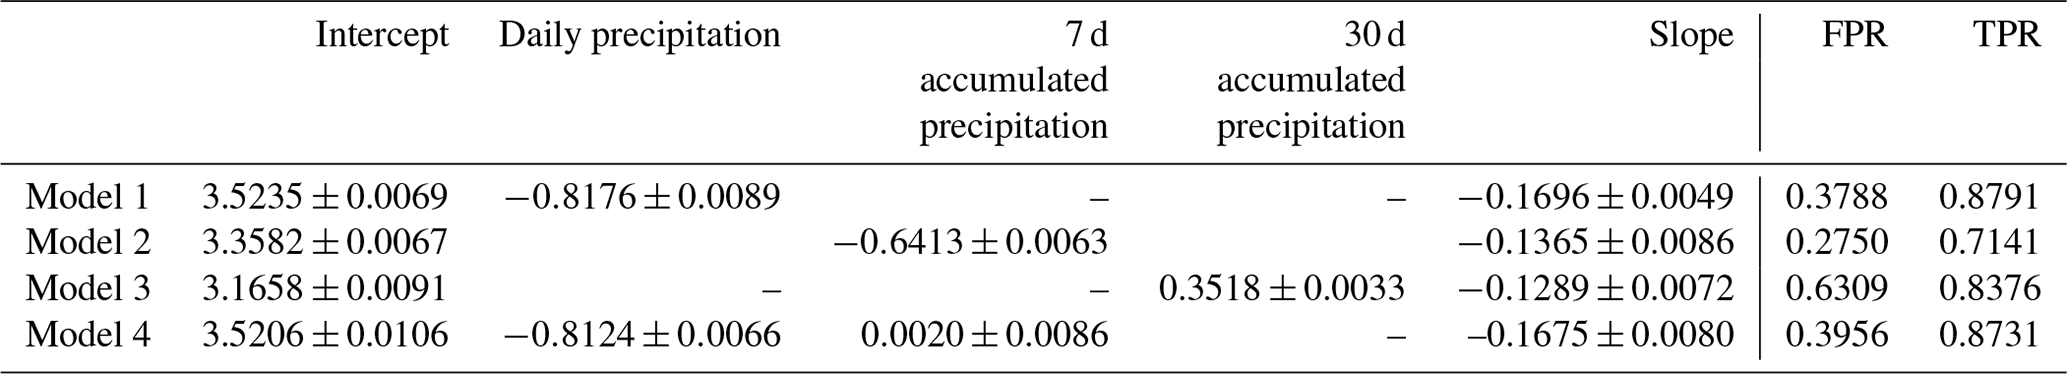
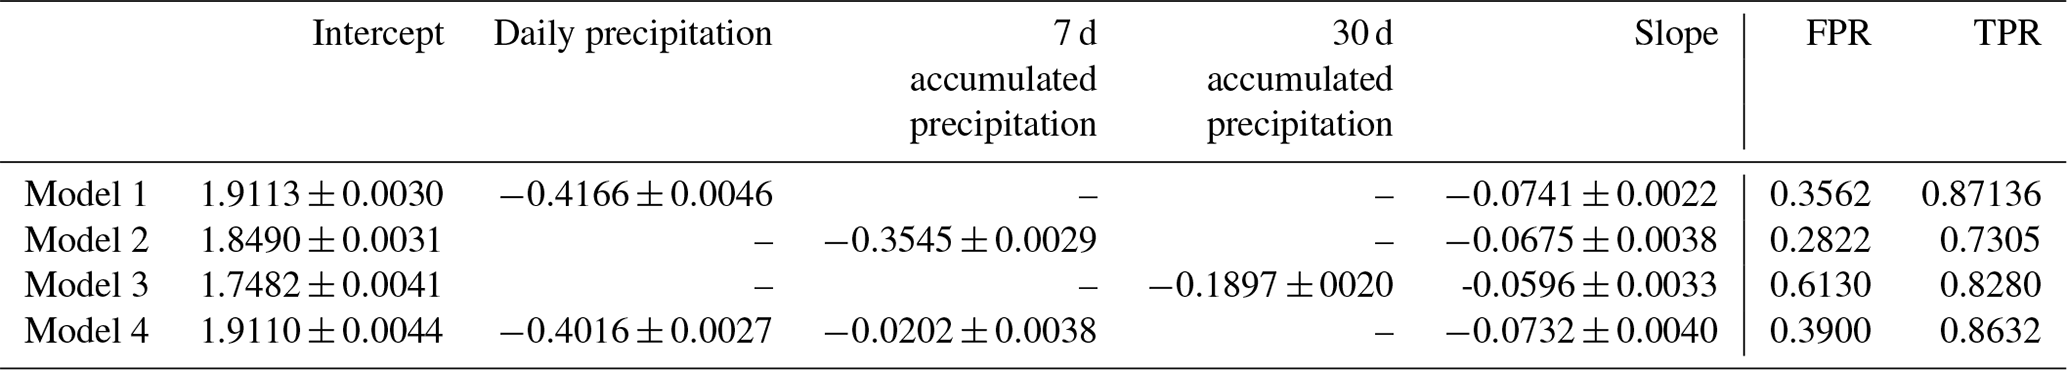
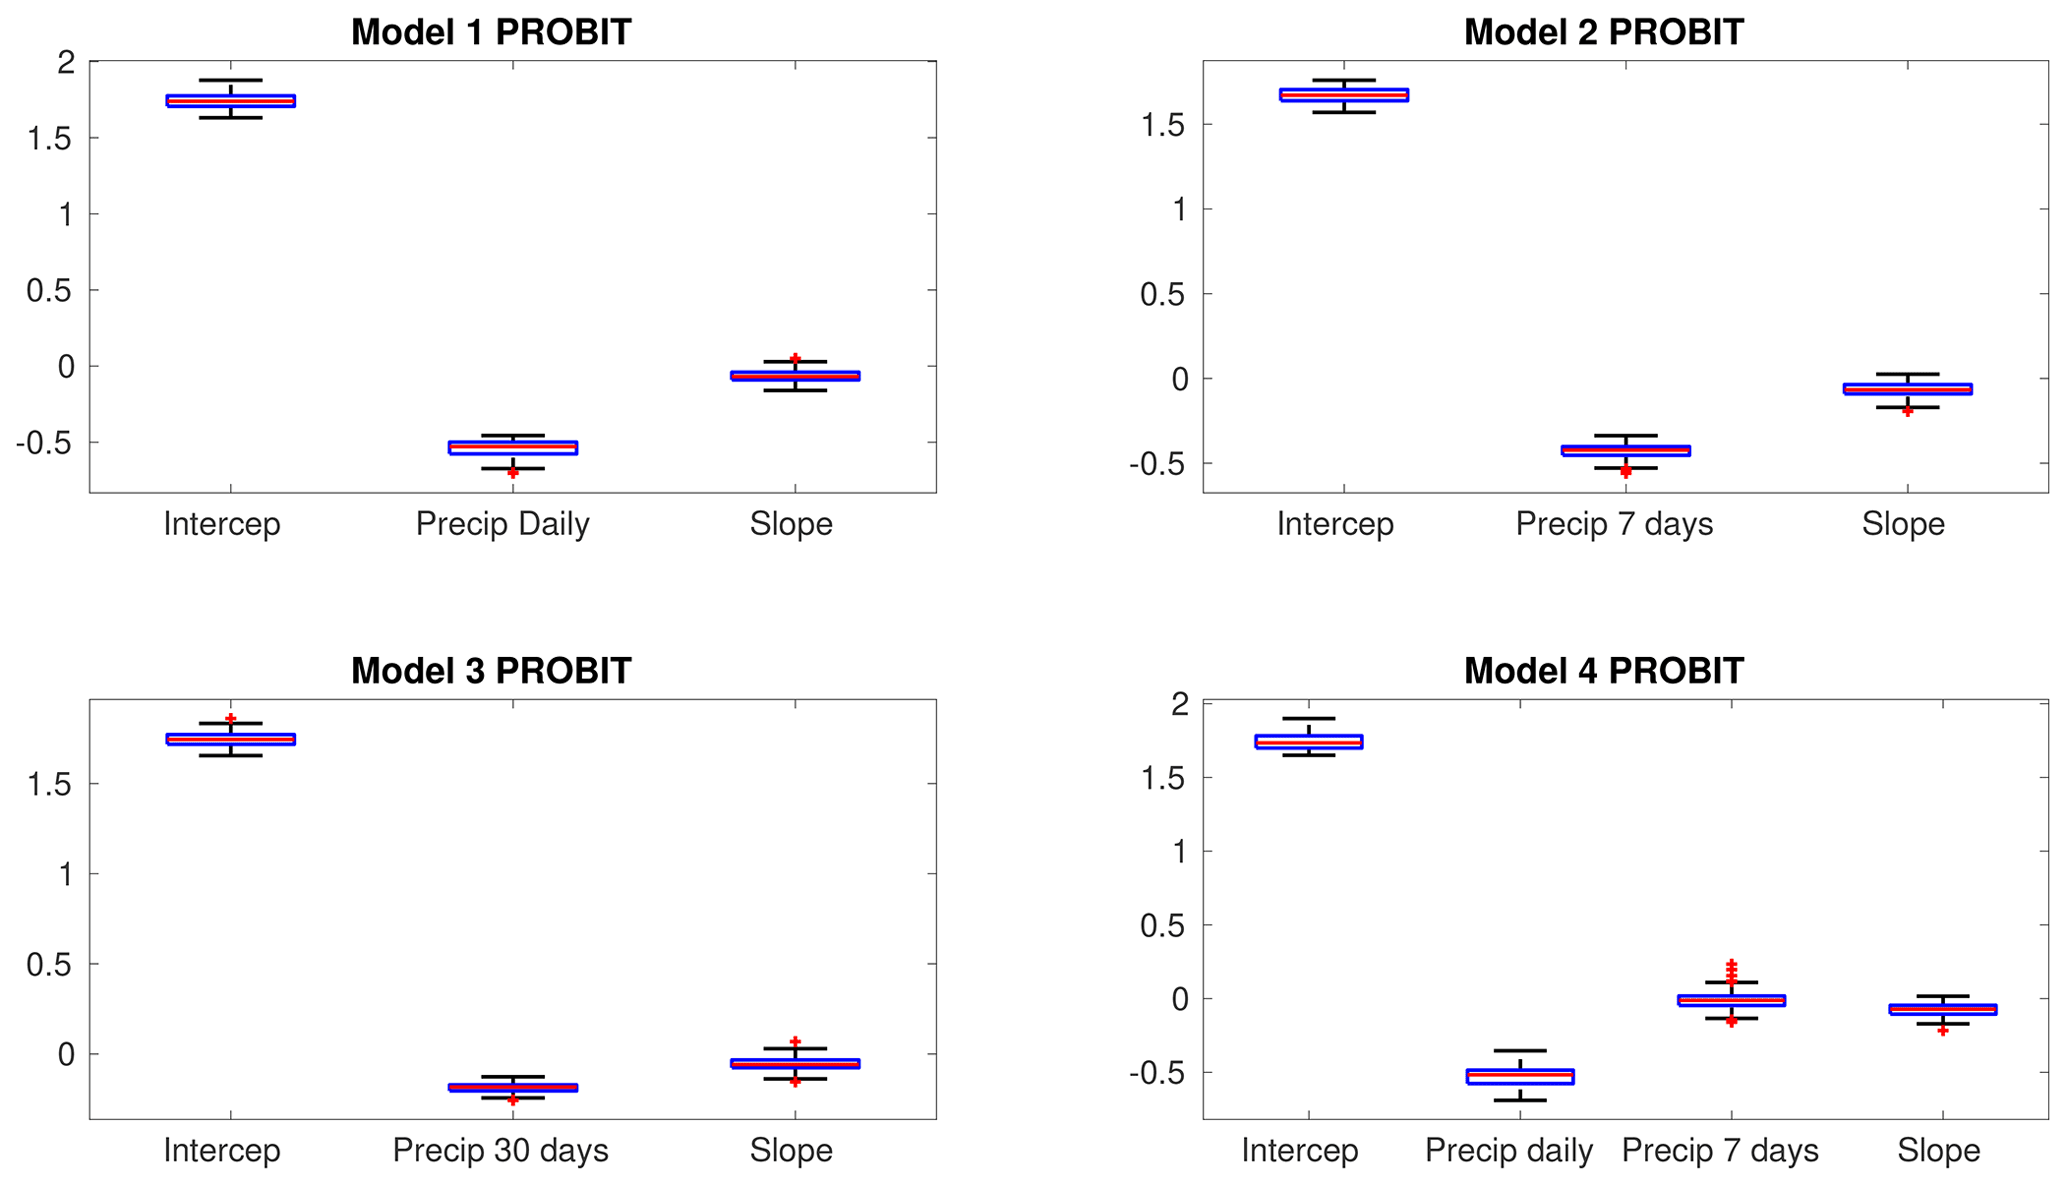
We point out that estimators related to the precipitation had a higher absolute weight than the slope for all the models calibrated. The precipitation used in daily (M1), previous 7 d (M2), or previous 30 d (M3) models showed a decreasing value (in absolute terms) as the accumulated precipitation period increased. The results of the PP_M4a model, which considered the daily precipitation in conjunction with that of the previous 7 d, showed that the latter had an absolute weight of almost zero compared to the former. In general, the standard deviations (σk) obtained from the estimators and intercept were very low for all the logit models calibrated. The probit model (Table 3) showed the same behaviour (as the logit) of the intercept for the four models; its estimator fluctuated between 1.7482 ± 0.0041 and 1.9113 ± 0.0030. The βk values for daily precipitation varied from −0.4166 ± 0.0046 to −0.4016 ± 0.0027, the values for 7 d precipitation varied from −0.3545 ± 0.0029 to −0.0202 ± 0.0038, the values for 30 d precipitation were at −0.1897 ± 0.0020 (just used in M3), and the slope varied from −0.0741 ± 0.0022 to −0.0596 ± 0.0033 (Fig. 6).
Table 3Values of the estimators for the probit models. False-positive rate (FPR) and true-positive rate (TPR) were evaluated with a threshold of 95 %.
4.3 Performance assessment
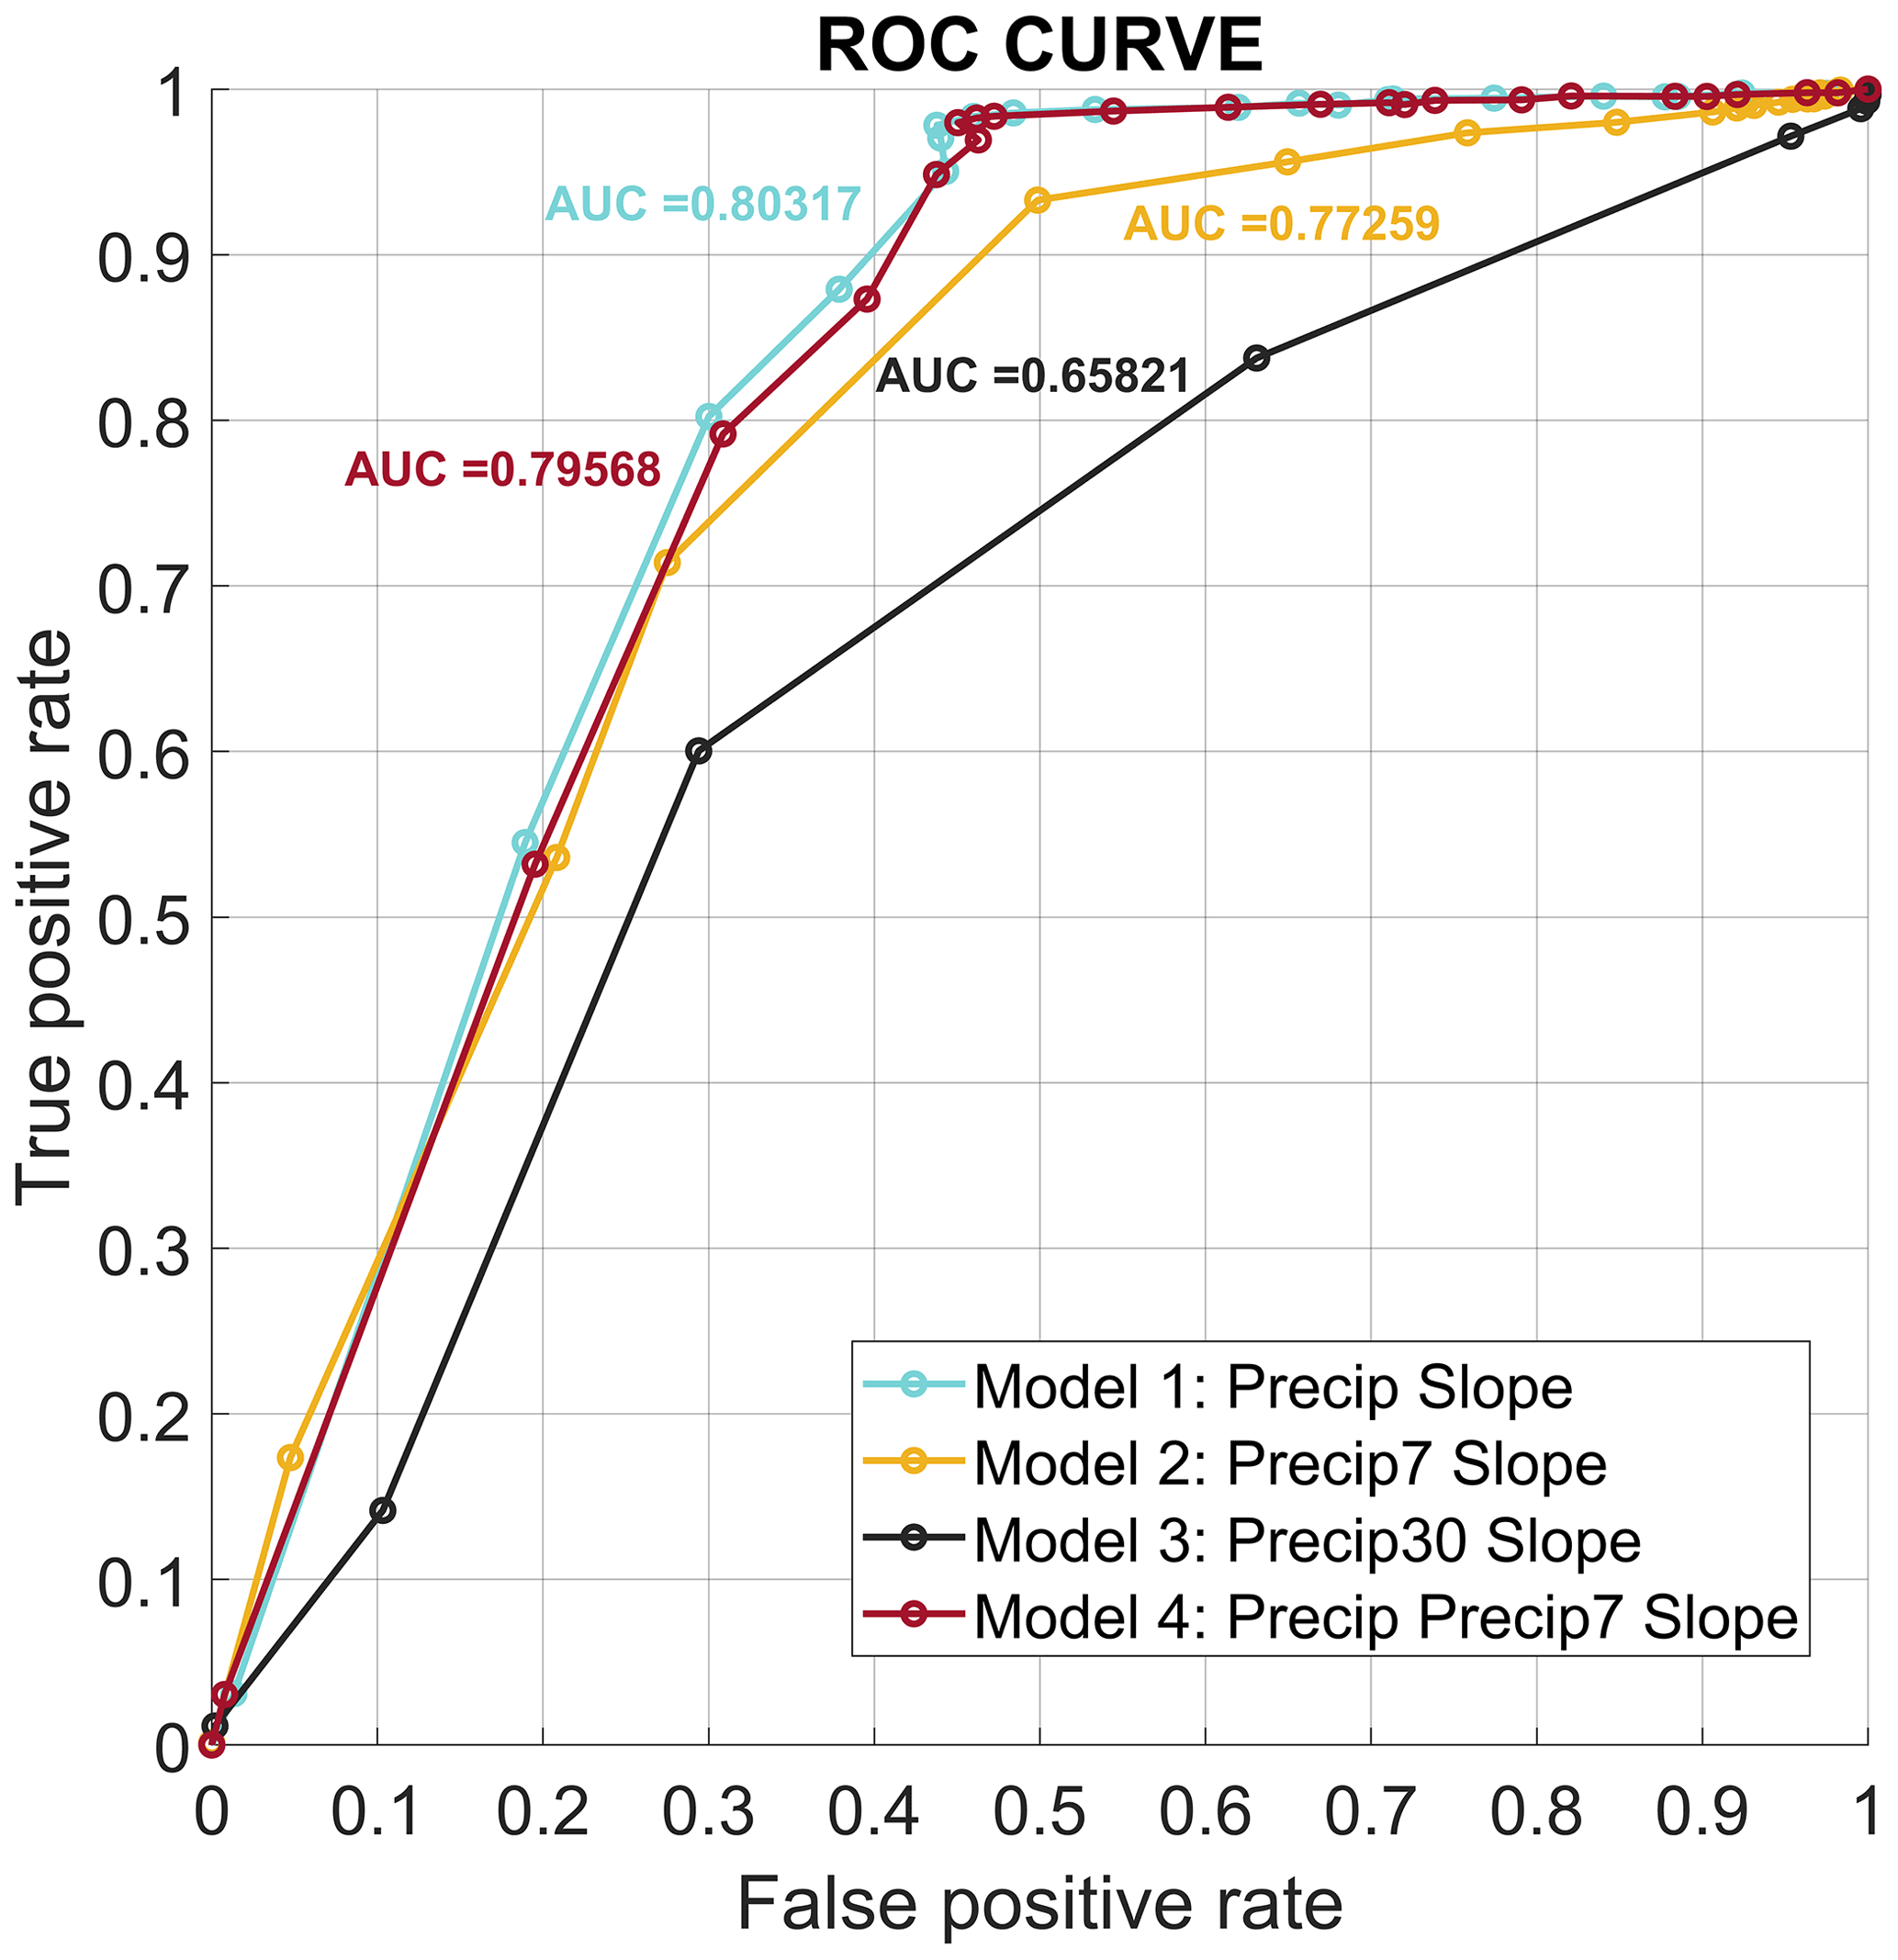
ROC analysis of the logit and probit models showed that the M1, M2, and M4 models gave a similar performance (Figs. 7 and 8). The area under the curve for the logit models varied between 0.8032 and 0.6672, while for the probit models it varied between 0.8076 and 0.6672. Our results showed a lack of performance for M3 in comparison to daily precipitation data for logit and probit models (0.6582 and 0.6672, respectively). Models with area-under-the-curve, AUC, values equal to 0.5 indicate that they are not suitable for discriminating the landslides and that they generate random predictions. Therefore, our results demonstrate that the calibrated models do not do a random fitting. The rate of valid positives in the logit distributions of the M1 and M4 models was higher than 0.97 with tolerances below 50 %. For the same range, however, the rate of FP was over 45 %. The same occurred with the probit models. For a tolerance of 95 %, the prediction of FN for both regressions diminished to below 40 %, although the accurate predictions (TP) also fell by ∼11 %. Similar performance was observed in M2, with slightly higher numbers of FP, but fewer than the proportion of TP. M3 in contrast presented rates of accurate predictions and FN close to 1 for thresholds lower than 85 %. In general, we observe that the probit models had greater AUC values than the logit, making them more suitable for RILEWSs.
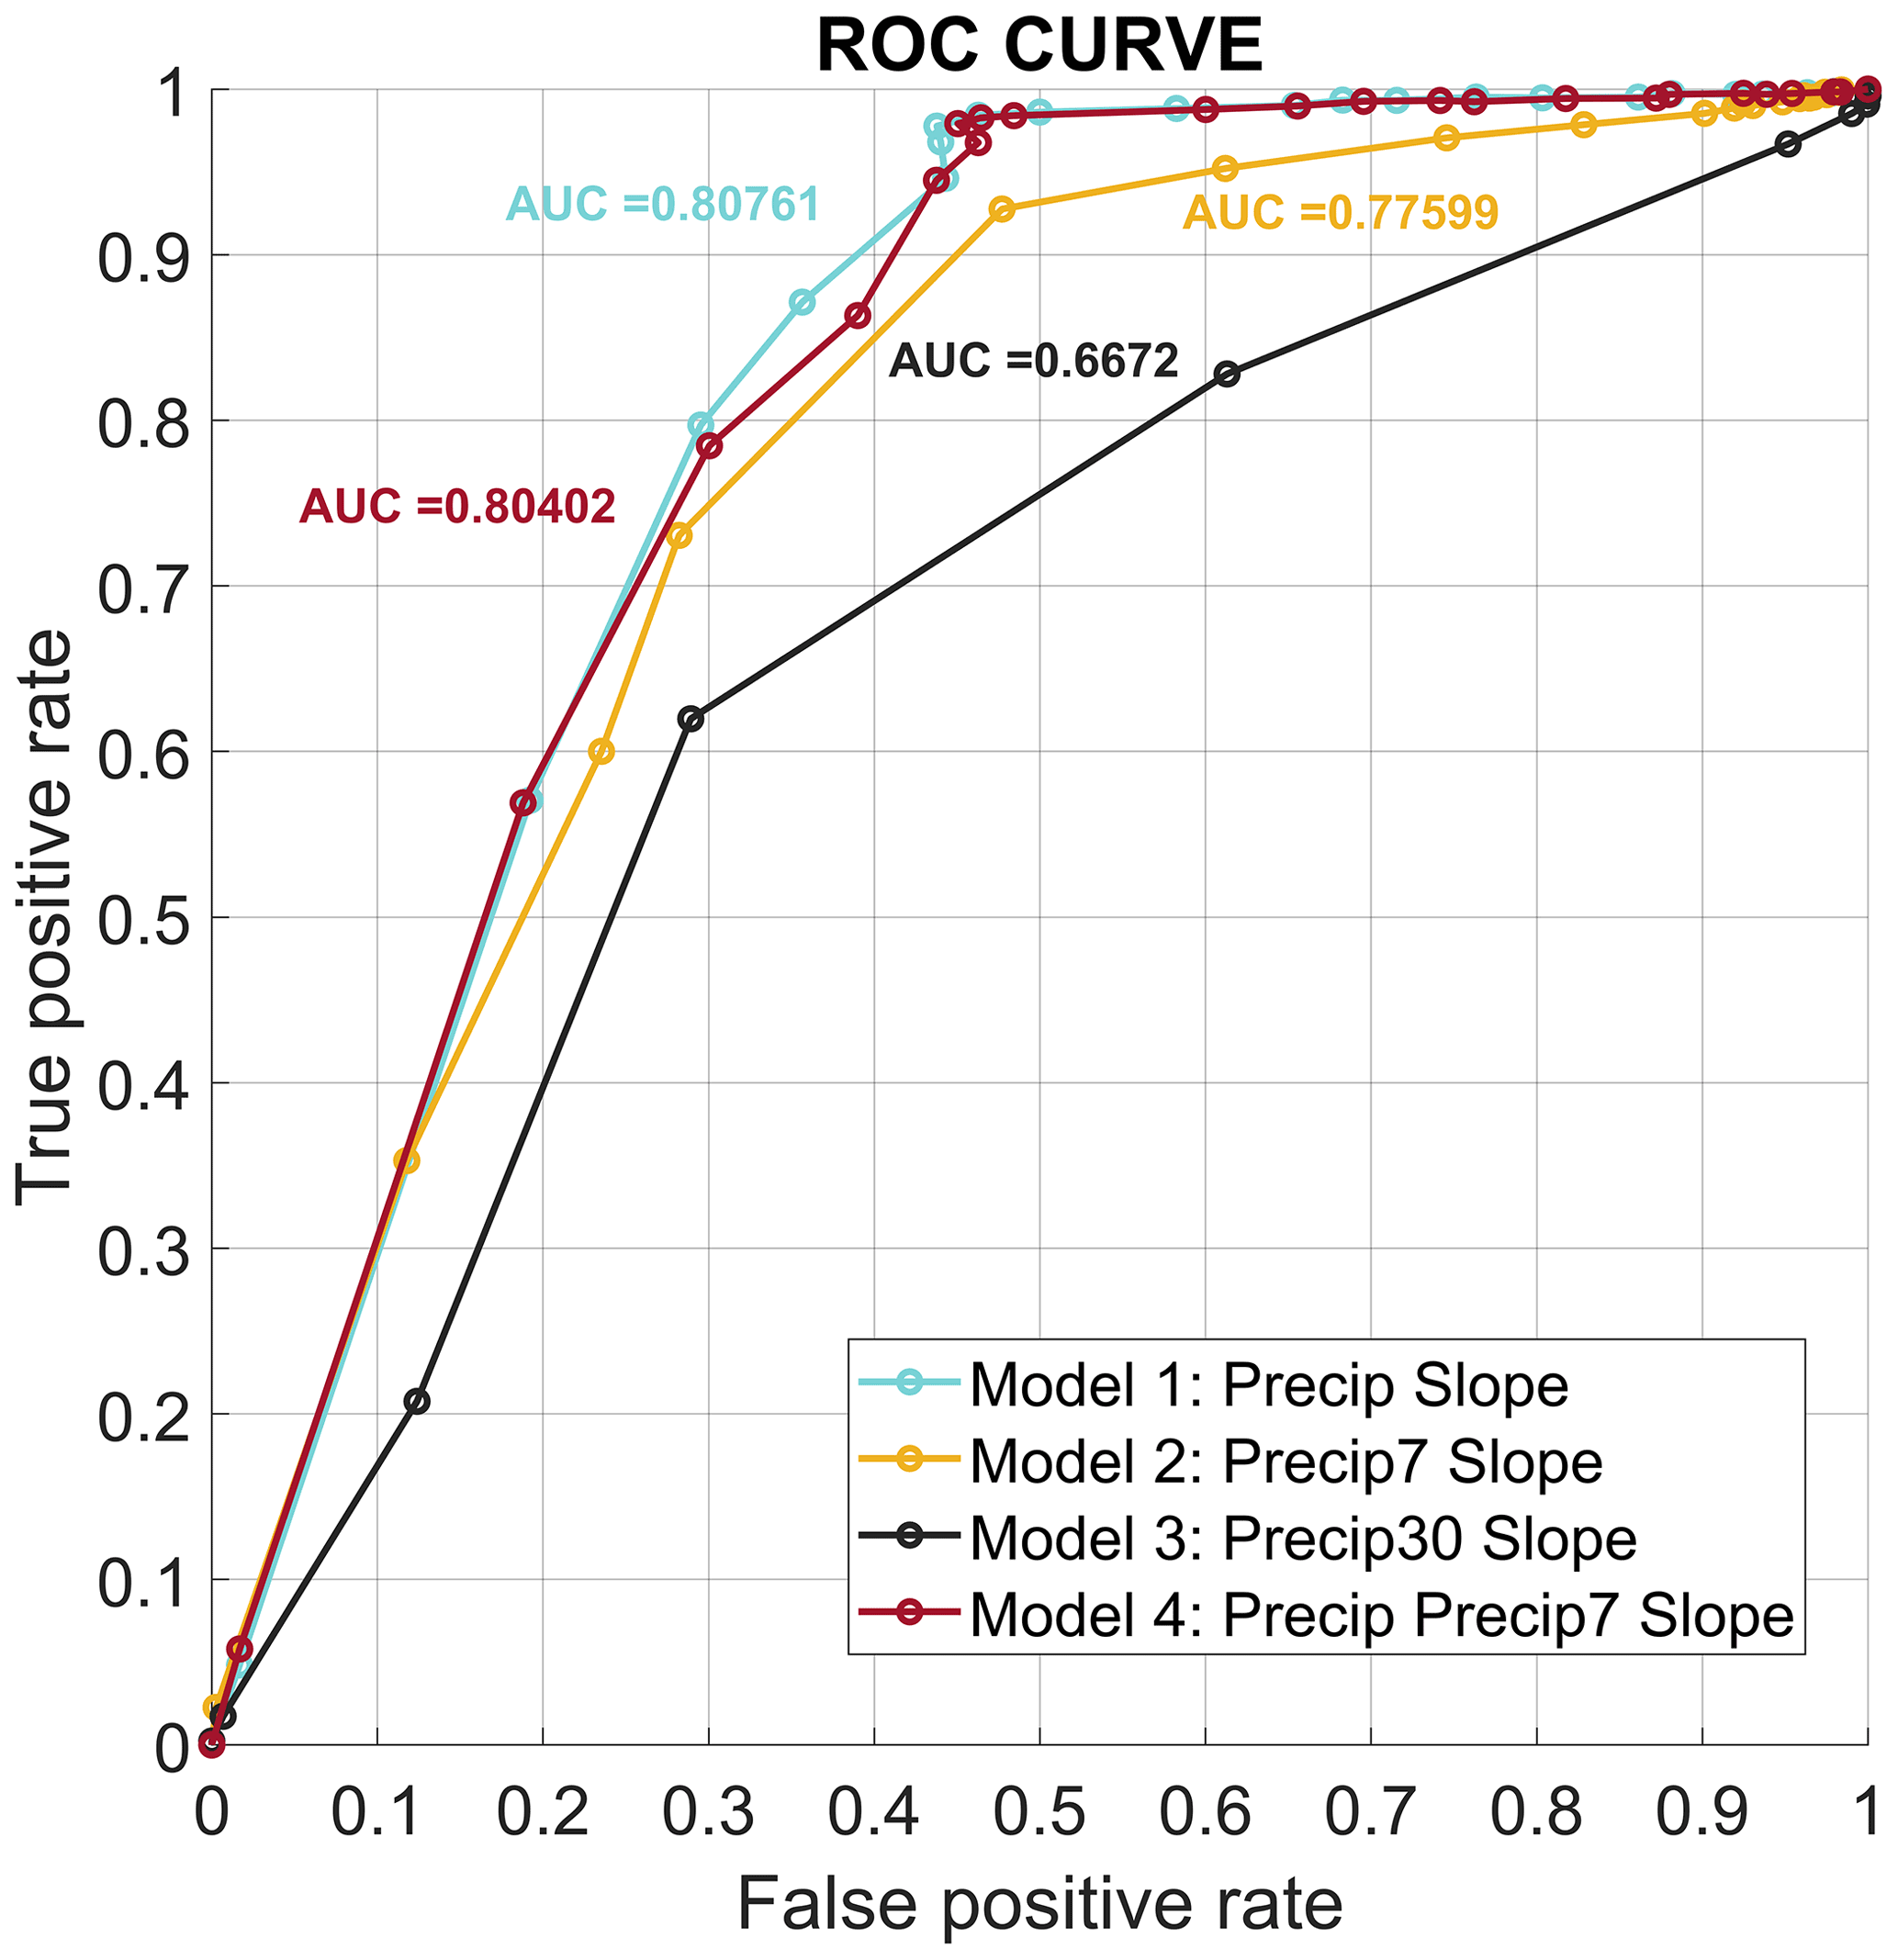
The logit and probit regressions for M1 and M4 presented the highest sensitivity values, of 91.79 ± 1.95 % and 91.81 ± 2.00 %, respectively, for the logit regressions (Table 4). In the probit models, M1 and M4 achieved sensitivity values of 91.25 ± 1.96 and 91.16 ± 2.03 %, respectively. Likewise, M2 had a sensitivity of 87.07 ± 2.93 % for logit and 86.19 ± 2.79 % for probit. The sensitivity of M3 was 83.89 ± 5.46 % for logit and 82.94 ± 5.21 for probit (Table 4). In general, we observed that the logit models were more sensitive than the probit. The specificity values for the M2 and M3 models were subtly higher for the probit regressions than for the logit, while for the M1 and M4 models the results obtained were almost equal.
Table 4Values of the estimators for the probit models. False-positive rate (FPR) and true-positive rate (TPR) were evaluated with a threshold of 95 %.

According to this, the best model for predicting RILs in the study area was M1 (daily precipitation and slope). The sensitivity and specificity values with the 95 % threshold chosen after ROC analysis were higher than 82 %. The results showed that the indicators were similar for the M1, M3, and M4 models (Table 4). However, a reduction was observed in the rate of TP for the M2 model (∼10 %).
Implementing RILEWSs is a challenge due to natural limitations like historical records and the precipitation data available. One of the main challenges in RILEWSs corresponds to the development of a model that generates warning only using limited meteorological information. Therefore, precipitation representation characterized by a low uncertainty in complex topography environments is a valuable contribution (Table 4). Our study proposes an alternative to landslide forecasting in data-scarce environments, allowing the resilience of the local community to be increased. Here, we demonstrate that the mesoscale models become suitable for reproducing the spatial precipitation distribution with a bias correction using in situ weather stations. The precipitation was integrated into a logistic model subsequently to establish the spatial probability of occurrence of a RIL event.
5.1 Atmospheric modelling
Implementation of a RILEWS applied to RILs requires accurate estimation of the spatial distribution of precipitation. Zones with a low density of meteorological stations generate uncertainties in the RILEWS implementation (Marra et al., 2018; Peres et al., 2018). The emergence of mesoscale atmospheric modelling to RILEWSs opens new possibilities for applications in data-scarce or ungauged regions. Our results show that the WRF model needs an extensive evaluation and often calibration by in situ weather stations before any use in the operational stage. Chikalamo et al. (2020) published a study on RILEWSs using satellite rainfall products. They found a good agreement between the rainfall products and RILs splitting rainfall thresholds at the seasonal scale. However, Zambrano-Bigiarini et al. (2017) showed differences between satellite products and in situ measurements in high-elevation zones (over 1000 m a.s.l.), suggesting that just satellite information could generate results with low performance. They found that satellite estimations are more reliable in the plain areas of southern Chile, far from the landslide-prone areas. Therefore, a RILEWS based on satellite rainfall products is not feasible in the study zone yet. Therefore, our results encourage including numerical modelling with bias-corrected solutions with a dense weather network to improve our results. We propose that the zone has limited weather stations that could be increased in the future.
Previous works have shown the sensitivity of mesoscale models to abrupt changes in complex topography (Srivastava et al., 2015; Osman et al., 2021; Heredia et al., 2018; Jeong and Lee, 2018; Bughici et al., 2019; Bannister et al., 2019; Worku et al., 2020), which is consistent with the abrupt topography of the eastern part of the study area (Fig. 4), where the MAE (6.6) and RMSE (17.9) values were concentrated. We avoided the precipitation constraint using a bias-corrected version of the WRF model to reduce the spatial error estimation in the precipitation. The use of bias-corrected precipitation of the WRF model improved the spatial representation in this study. The uncorrected model had bias values higher than 16 mm, which becomes critical during the incorrect early warning generation. Therefore, an incorrect precipitation estimation could become a human loss. Our results deliver precipitation data with a low uncertainty level. That becomes suitable to operative RILEWSs with a low false-positive rate (FP).
In many areas of the world, the prediction of rainfall-induced landslides is usually carried out using empirical rainfall thresholds (Gariano et al., 2020). Previous contributions showed that dense networks of weather stations allow the representation of the complex precipitation distribution, giving a good threshold estimation (Nikolopoulos et al., 2014). However, debris flow thresholds developed from sparse in situ weather stations generated low performance (Nikolopoulos et al., 2015). The complex topography and the sparse weather station availability underestimate rainfall thresholds for landslides in the southern Andes. A RILEWS based only on weather stations is thus not suitable. Previous studies showed a systematic underestimation of debris flow early warning thresholds related to the use of sparse rain gauge networks (Marra et al., 2016; Destro et al., 2017; Marra et al., 2017). Moreover, the topography has a strong influence on the modification of the spatial distribution of precipitation that leads to debris flows (Marra et al., 2016; Fustos et al., 2021) and landslides (Fustos et al., 2017). Hence, our contribution allows reduction in the precipitation estimation uncertainty, increasing the reliability of RILEWSs in the southern Andes. From our results, the bias correction improved the precipitation representation when we compared against the weather stations (Fig. 4). The data from 12 spatially distributed meteorological stations were sufficient to represent the precipitation fields with low RMSE values (max 0.36 mm). However, we encourage future users to increase the number of weather stations, reducing the uncertainty in ungauged sub-basins. The zone showed discrepancies between satellite rainfall products and topography, including new constraints that could hide some extreme values regarding precipitation at high altitudes. New RILEWS developments with a reduced weather network could lead to misestimation of early warning with disastrous results.
The corrected results represent the precipitation fields in Andean areas with lower bias values than previous studies (Yáñez-Morroni et al., 2018; Schumacher et al., 2020). The PP_M4a approach was found to reduce the bias efficiently for the study area. We propose that the perfect prognosis approach allows for the correction of the topographic influence on the precipitation if an adequate distribution of the weather stations is available. We note that 30 % of all the RILs occurred on days with low precipitation on the day and during the preceding days (7 and 30 d previous). Therefore, we propose that future developments should progress to analysis on a sub-daily scale. In this context, future developments should aim to use the corrected WRF at an hourly scale or else use lower-resolution satellite estimates of precipitation as a tool to complement WRF simulations.
5.2 Rainfall-induced landslide early warning
The southern Andes have a complex topography that influences precipitation events with different intensities in a few kilometres of separation (examples in Figs. 9 and 10). Hence, a correct precipitation representation along the space allows the sensitivity to be increased. The sensitivity of RILEWSs depends heavily on the input variables, specifically the precipitation in this case. The RILEWS achieved high predictive ability, with AUC values between 0.65 (M3) and 0.80 (M1), suggesting high sensitivity to intense precipitation in short periods. The performance of the model diminished when data at the monthly scale were used (M3) in comparison with daily resolution (M1 and M2), where the M2 model (AUC = 0.77) had similar performance to M1. This similarity may be associated with the soil moisture content, reflecting the previous precipitation; this means that it functions as a memory of the soil moisture in the slope before a RIL (related to the different soil types). The memory effect in the slope in M3 will reflect in part its predisposition to suffering a RIL based on the soil moisture content in the first few centimetres. Numerous works have related satellite information on precipitation and soil moisture to establish links between them (Brocca et al., 2020; Camici et al., 2020; Pellarin et al., 2020). In future, the soil moisture memory approach could be the best way to obtain a proxy for the soil moisture content and the slope response to landslides in zones without a network of moisture sensors. This is consistent when we compare M1 (AUC = 0.80) and M4 (AUC = 0.79); they present similar sensitivity values (∼91 % in both cases), suggesting that either model could be used. Model 1 and Model 4 showed similar performance because one is contained in the second. Hence, we interpret that an overrepresentation could exist. Therefore, Model 4 does not support additional information. At an operational level, discarding Model 4 reduces the computing loading, simplifying the alert processes.

Figure 9Zones susceptible to RILs for 8 January 2017. Results using Model 1 (logit). Hillshade based on SRTM data.
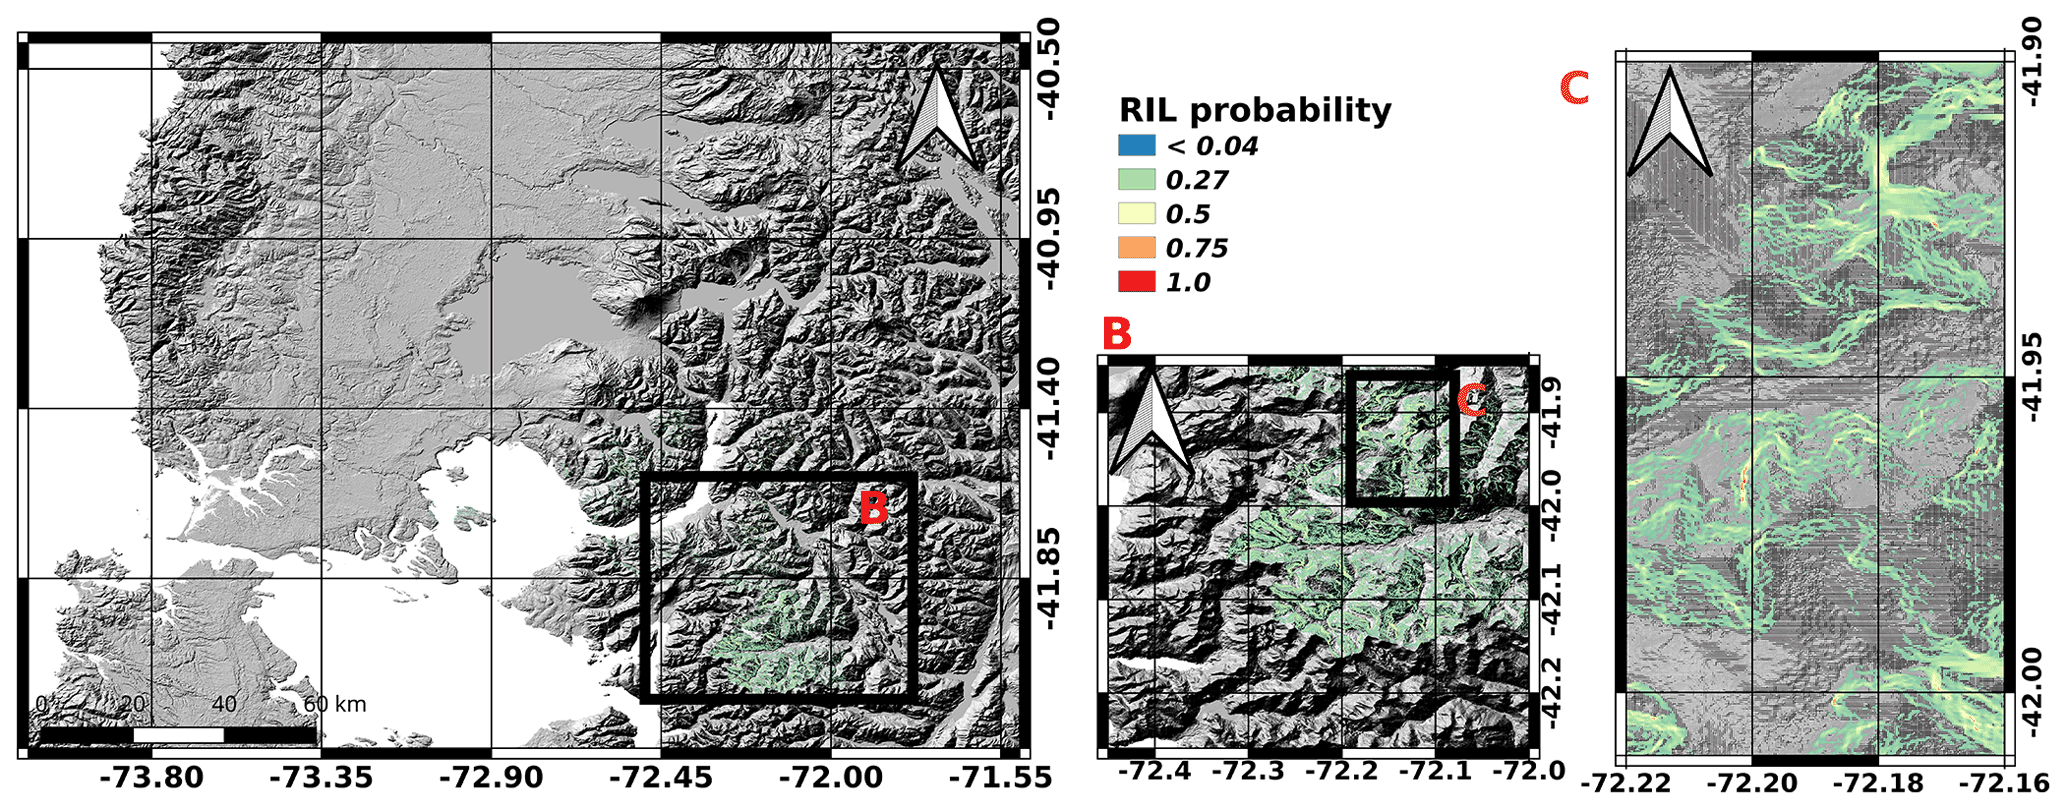
Figure 10Zones susceptible to RILs for 8 January 2017. Results using Model 1 (probit). Hillshade based on SRTM data.
5.3 Future developments
The Andes are one of the most susceptible zones to intense precipitation changes as a product of climate change. To reproduce and understand intense precipitation changes and their impact on landslides, a high spatio-temporal resolution is needed. The present contribution supports reproducing accurate precipitation, contributing to robust RILEWSs. Potential improvements should be directed towards increasing the predictive ability by increasing the temporal resolution of the precipitation products. Our models do not consider the soil hydraulic variability like tephra fall or intensely weathered soft rocks. Recently, rainfall-induced landslides affected active (Fustos et al., 2021) and older volcanic environments (Somos-Valenzuela et al., 2020). The new generation of RILEWSs will need a parameterization of these environments from a geotechnical point of view. Moreover, all RILEWSs must be able to be automated, which involves computing capacities of various kinds; to mitigate the calculation costs we suggest incorporating the available satellite precipitation products, but at lower spatial resolution (∼10 km). Satellite estimations require validation of these outputs in areas with complex topography, like southern Chile (Zambrano-Bigiarini et al., 2017). Likewise, new geoscientific data interfaces like GSMaP will allow better integration with precipitation, complementing WRF products. One limitation of the present study is the quality of the RIL inventory used. South America presents a low density of recorded events, despite the high density of their occurrence. Future efforts should be directed towards generating RIL identification records using remote sensor techniques (Guzzetti et al., 2020; Fustos et al., 2017; Jia et al., 2019) or numerical identification (Chikalamo et al., 2020; Guzzetti et al., 2020; Fustos et al., 2020a). To date, our database is the best available for the spatial location and date of generation in the study area. We suggest that alternatives should be considered in future to strengthen the generation of RIL databases in the southern Andes with a larger number of events. This could help to strengthen future RILEWSs in this area, improving their performance in terms of sensitivity and specificity.
This work evaluates the implementation of a RILEWS based on a logistic model and forced by geomorphological and atmospheric conditions in the southern Andes. For the first time in the southern Andes, we showed how the WRF model can be integrated into RILEWS operating systems without the need to use ensembles, by use of bias correction processes. Our findings suggest that the bias correction is a useful alternative to numerical ensembles that increases the computational cost at the operative scale. This opens the door to the implementation of precipitation-based prediction models without costly computer iterations by ensembles of models (Yáñez-Morroni et al., 2018; Schumacher et al., 2020). A WRF-corrected model could be used at the operational scale in different countries if a weather network is available.
The logistic approach proposed in this study allows a RILEWS to be rapidly implemented using a limited landslide catalogue in different countries in the future. Our results and previous studies indicate that RILEWSs in the southern Andes should be directed towards increasing the RIL database currently available. In future we suggest evaluating alternatives to strengthen better-quality RIL database generation in this segment of South America, completing the existing database from the records of the Chilean National Geological and Mining Service (Sernageomin). This could help to strengthen future RILEWSs in the southern Andes, improving their performance in terms of sensitivity and specificity. Logistic models proved their capacity to predict RIL events, with AUC varying between 0.65 and 0.80, indicating their ability to represent RIL occurrence correctly. Despite the high relative sensitivity of M3, the models which presented high sensitivity and specificity were those which included precipitation on a daily scale (models 1, 2, and 4). Using the precipitation of the previous 7 d could improve this approach to representing soil moisture. There is no network of moisture sensors in the area, so Model 4 should be incorporated as it allows this factor to be represented. Finally, we propose using models M1 and M4 in conjunction.
Our proposed RILEWS was developed under limited and scarce atmospheric data. We expect that national emergency authorities integrate this proposal into their routine activities, disseminating the landslide warning information to the stakeholders. The continual improvement will allow the performance to be increased as well as allow correct alerting under different precipitation scenarios. The real-time implementation will allow the precipitation representation to be tested and the accurate precipitation estimation to be assessed. We conclude that our RILEWS could become a promising methodology for implementation in similar climatic zones in different countries and latitudes. In future, global-scale products such as the Global Landslide database could support future implementation of RILEWSs at a regional scale using corrected precipitation products such as the WRF model or satellite precipitation products.
The codes and data can be made available by sending an email to ivo.fustos@ufrontera.cl.
NMR and IFT contributed to the conceptualization and methodology of the research and performed the formal analysis, visualization, and validation. NMR carried out the numerical simulations and following validations. IFT, DVA, VLG, and MHS contributed with the supervision, review, and editing of the paper.
The contact author has declared that neither they nor their co-authors have any competing interests.
Publisher’s note: Copernicus Publications remains neutral with regard to jurisdictional claims in published maps and institutional affiliations.
This article is part of the special issue “Multi-risk assessment in the Andes region”. It is not associated with a conference.
We acknowledge Dirección de Investigación of the University of La Frontera for their English editing support. The study was supported by Fondecyt 11180500 (logistic models development) and PII180007 (validation phase) of the Chilean government.
This research has been supported by the Fondo Nacional de Desarrollo Científico y Tecnológico (grant no. 11180500) and China-Chilean Joint Research Initiative (grant no. PII180007).
This paper was edited by Elisabeth Schoepfer and reviewed by David J. Peres and one anonymous referee.
Alvarez-Garreton, C., Mendoza, P. A., Boisier, J. P., Addor, N., Galleguillos, M., Zambrano-Bigiarini, M., Lara, A., Puelma, C., Cortes, G., Garreaud, R., McPhee, J., and Ayala, A.: The CAMELS-CL dataset: catchment attributes and meteorology for large sample studies – Chile dataset, Hydrol. Earth Syst. Sci., 22, 5817–5846, https://doi.org/10.5194/hess-22-5817-2018, 2018.
Bannister, D., Orr, A., Jain, S. K., Holman, I. P., Momblanch, A., Phillips, T., Adeloye, A. J., Snapir, B., Waine, T. W., Hosking, J. S., and Allen‐Sader, C.: Bias Correction of High‐Resolution Regional Climate Model Precipitation Output Gives the Best Estimates of Precipitation in Himalayan Catchments, J. Geophys. Res.-Atmos., 124, 14220–14239, https://doi.org/10.1029/2019jd030804, 2019.
Beck, H. E., Zimmermann, N. E., McVicar, T. R., Vergopolan, N., Berg, A., and Wood, E. F.: Present and future Köppen-Geiger climate classification maps at 1-km resolution, Sci. Data, 5, 1–12 , https://doi.org/10.1038/sdata.2018.214, 2018.
Bernard, M. and Gregoretti, C.: The Use of Rain Gauge Measurements and Radar Data for the Model‐Based Prediction of Runoff‐Generated Debris‐Flow Occurrence in Early Warning Systems, Water Res., 57, e2020WR027893, https://doi.org/10.1029/2020wr027893, 2021.
Blanco, D. E. and de la Balze, V. M.: Los Turbales de la Patagonia. Bases para su inventario y la conservación de su biodiversidad, Wetl. Int., 19, 2004.
Brocca, L., Massari, C., Pellarin, T., Filippucci, P., Ciabatta, L., Camici, S., Kerr, Y. H., and Fernández-Prieto, D.: River flow prediction in data scarce regions: soil moisture integrated satellite rainfall products outperform rain gauge observations in West Africa, Sci. Rep., 10, 12517, https://doi.org/10.1038/s41598-020-69343-x, 2020.
Bughici, T., Lazarovitch, N., Fredj, E., and Tas, E.: Evaluation and Bias Correction in WRF Model Forecasting of Precipitation and Potential Evapotranspiration, J. Hydrometeorol., 20, 965–983, https://doi.org/10.1175/jhm-d-18-0160.1, 2019.
Camici, S., Massari, C., Ciabatta, L., Marchesini, I., and Brocca, L.: Which rainfall score is more informative about the performance in river discharge simulation? A comprehensive assessment on 1318 basins over Europe, Hydrol. Earth Syst. Sci., 24, 4869–4885, https://doi.org/10.5194/hess-24-4869-2020, 2020.
Chikalamo, E. E., Mavrouli, O. C., Ettema, J., van Westen, C. J., Muntohar, A. S., and Mustofa, A.: Satellite-derived rainfall thresholds for landslide early warning in Bogowonto Catchment, Central Java, Indonesia, Int. J. Appl. Earth Obs., 89, 102093, https://doi.org/10.1016/j.jag.2020.102093, 2020.
Cremonini, R. and Tiranti, D.: The Weather Radar Observations Applied to Shallow Landslides Prediction: A Case Study From North-Western Italy, Front. Earth Sci., 6, 12 pp., https://doi.org/10.3389/feart.2018.00134, 2018.
Destro, E., Marra, F., Nikolopoulos, E. I., Zoccatelli, D., Creutin, J. D., and Borga, M.: Spatial estimation of debris flows-triggering rainfall and its dependence on rainfall return period, Geomorphology, 278, 269–279, https://doi.org/10.1016/j.geomorph.2016.11.019, 2017.
Espinoza, L., Marín, M., and Pantoja, G.: SERNAGEOMIN. Peligros de remociones en masa tipo flujo de la Cuenca Alta del Río Maipo, Región Metropolitana de Santiago [monografías], Santiago: SERNAGEOMIN, 2 mapas pleg (Informe Registrado: no 72), 2019.
Fan, X., Xu, Q., Liu, J., Subramanian, S. S., He, C., Zhu, X., and Zhou, L.: Successful early warning and emergency response of a disastrous rockslide in Guizhou province, China, Landslides, 16, 2445–2457, https://doi.org/10.1007/s10346-019-01269-6, 2019.
Fawcett, T.: An introduction to ROC analysis, Pattern Recognit. Lett., 27, 861–874, https://doi.org/10.1016/j.patrec.2005.10.010, 2006.
Froude, M. J. and Petley, D. N.: Global fatal landslide occurrence from 2004 to 2016, Nat. Hazards Earth Syst. Sci., 18, 2161–2181, https://doi.org/10.5194/nhess-18-2161-2018, 2018.
Fustos, I., Abarca-del-Rio, R., Ávila, A., and Orrego, R.: A simple logistic model to understand the occurrence of flood events into the Biobío River Basin in central Chile, J. Flood Risk Management, 10, 17–29, https://doi.org/10.1111/jfr3.12131, 2017.
Fustos, I., Abarca-del-Río, R., Mardones, M., González, L., and Araya, L. R.: Rainfall-induced landslide identification using numerical modelling: A southern Chile case, J. South Am. Earth Sci., 101, 102587, https://doi.org/10.1016/j.jsames.2020.102587, 2020a.
Fustos, I., Abarca-del-Rio, R., Moreno-Yaeger, P., and Somos-Valenzuela, M.: Rainfall-Induced Landslides forecast using local precipitation and global climate indexes, Nat Hazards, 102, 115–131, https://doi.org/10.1007/s11069-020-03913-0, 2020b.
Fustos-Toribio, I. J., Morales-Vargas, B., Somos-Valenzuela, M., Moreno-Yaeger, P., Muñoz-Ramirez, R., Rodriguez Araneda, I., and Chen, N.: Debris flow event on Osorno volcano, Chile, during summer 2017: new interpretations for chain processes in the southern Andes, Nat. Hazards Earth Syst. Sci., 21, 3015–3029, https://doi.org/10.5194/nhess-21-3015-2021, 2021.
Gariano, S. L., Melillo, M., Peruccacci, S., and Brunetti, M. T.: How much does the rainfall temporal resolution affect rainfall thresholds for landslide triggering?, Nat. Hazards, 100, 655–670, https://doi.org/10.1007/s11069-019-03830-x, 2020.
Gomez-Cardenas, P. and Garrido-Urzua, N.: Catastro de remociones en masa en la región de Los Lagos, Chile. XV Congreso Geológico Chileno, 16 November, Concepción-Chile, https://congresogeologicochileno.cl/wp-content/uploads/2018/12/Libro-de-Actas-XVCongresoGeologicoChileno2018-2.pdf (last access: 21 June 2022), 2018.
Gutjahr, O. and Heinemann, G.: Comparing precipitation bias correction methods for high-resolution regional climate simulations using COSMO-CLM, Theor. Appl. Climatol., 114, 511–529, https://doi.org/10.1007/s00704-013-0834-z, 2013.
Guzzetti, F., Gariano, S. L., Peruccacci, S., Brunetti, M. T., Marchesini, I., Rossi, M., and Melillo, M.: Geographical landslide early warning systems, Earth-Sci. Rev., 200, 102973, https://doi.org/10.1016/j.earscirev.2019.102973, 2020.
Hand, D. J. and Till, R. J.: A Simple Generalisation of the Area Under the ROC Curve for Multiple Class Classification Problems, Mach. Learn., 45, 171–186, https://doi.org/10.1023/A:1010920819831, 2001.
Hempel, S., Frieler, K., Warszawski, L., Schewe, J., and Piontek, F.: A trend-preserving bias correction – the ISI-MIP approach, Earth Syst. Dynam., 4, 219–236, https://doi.org/10.5194/esd-4-219-2013, 2013.
Hermle, D., Keuschnig, M., Hartmeyer, I., Delleske, R., and Krautblatter, M.: Timely prediction potential of landslide early warning systems with multispectral remote sensing: a conceptual approach tested in the Sattelkar, Austria, Nat. Hazards Earth Syst. Sci., 21, 2753–2772, https://doi.org/10.5194/nhess-21-2753-2021, 2021.
Heredia, M. B., Junquas, C., Prieur, C. and Condom, T.: New statistical methods for precipitation bias correction applied to WRF model simulations in the Antisana Region, Ecuador, J. Hydrometeorol., 19, 2021–2040, https://doi.org/10.1175/JHM-D-18-0032.1, 2018.
Hong, S. Y., Dudhia, J. and Chen, S. H.: A revised approach to ice microphysical processes for the bulk parameterization of clouds and precipitation, Mon. Weather Rev., 132, 103–120, https://doi.org/10.1175/1520-0493(2004)132<0103:ARATIM>2.0.CO;2, 2004.
Jeong, J. and Lee, S.-J.: A Statistical Parameter Correction Technique for WRF Medium-Range Prediction of Near-Surface Temperature and Wind Speed Using Generalized Linear Model, Atmosphere, 9, 291, https://doi.org/10.3390/atmos9080291, 2018.
Jia, H., Zhang, H., Liu, L., and Liu, G.: Landslide Deformation Monitoring by Adaptive Distributed Scatterer Interferometric Synthetic Aperture Radar, Remote Sensing, 11, 2273, https://doi.org/10.3390/rs11192273, 2019.
Kirschbaum, D. B., Adler, R., Hong, Y., Hill, S., and Lerner-Lam, A.: A global landslide catalog for hazard applications: method, results, and limitations, Nat. Hazards, 52, 561–575, 2010.
Lazzari, M. and Piccarreta, M.: Landslide Disasters Triggered by Extreme Rainfall Events: The Case of Montescaglioso (Basilicata, Southern Italy), Geosciences, 8, 377, https://doi.org/10.3390/geosciences8100377, 2018.
Lee, W. Y., Park, S. K., and Sung, H. H.: The optimal rainfall thresholds and probabilistic rainfall conditions for a landslide early warning system for Chuncheon, Republic of Korea, Landslides, 18, 1721–1739, https://doi.org/10.1007/s10346-020-01603-3, 2021.
Li, H., Lee, Y.-C., Zhou, Y.-C., and Sun, J.: The random subspace binary logit (RSBL) model for bankruptcy prediction, Knowledge-Based Systems, 24, 1380–1388, https://doi.org/10.1016/j.knosys.2011.06.015, 2011.
Maraun, D., Wetterhall, F., Ireson, A. M., Chandler, R. E., Kendon, E. J., Widmann, M., Brienen, S., Rust, H. W., Sauter, T., Themeßl, M., Venema, V. K. C., Chun, K. P., Goodess, C. M., Jones, R. G., Onof, C., Vrac, M., and Thiele-Eich, I.: Precipitation downscaling under climate change: Recent developments to bridge the gap between dynamical models and the end user, Rev. Geophys., 48, 2009RG000314RG3003, https://doi.org/10.1029/2009rg000314, 2010.
Marjanović, M., Krautblatter, M., Abolmasov, B., Đurić, U., Sandić, C., and Nikolić, V.: The rainfall-induced landsliding in Western Serbia: A temporal prediction approach using Decision Tree technique, Eng. Geol., 232, 147–159, https://doi.org/10.1016/j.enggeo.2017.11.021, 2018.
Marra, F., Nikolopoulos, E. I., Creutin, J. D., and Borga, M.: Space–time organization of debris flows-triggering rainfall and its effect on the identification of the rainfall threshold relationship, J. Hydrol., 541, 246–255, https://doi.org/10.1016/j.jhydrol.2015.10.010, 2016.
Marra, F., Destro, E., Nikolopoulos, E. I., Zoccatelli, D., Creutin, J. D., Guzzetti, F., and Borga, M.: Impact of rainfall spatial aggregation on the identification of debris flow occurrence thresholds, Hydrol. Earth Syst. Sci., 21, 4525–4532, https://doi.org/10.5194/hess-21-4525-2017, 2017.
Marra, F.: Rainfall thresholds for landslide occurrence: systematic underestimation using coarse temporal resolution data, Nat Hazards, 95, 883–890, https://doi.org/10.1007/s11069-018-3508-4, 2018.
McCullagh, P. and Nelder, J. A.: Generalized linear models, Chapman and Hall, 261 pp., ISBN 9780412317606, 1989.
National Centers For Environmental Prediction/National Weather Service/NOAA/U.S. Department Of Commerce: NCEP FNL Operational Model Global Tropospheric Analyses, continuing from July 1999, https://doi.org/10.5065/D6M043C6, 2000.
Nikolopoulos, E. I., Crema, S., Marchi, L., Marra, F., Guzzetti, F., and Borga, M.: Impact of uncertainty in rainfall estimation on the identification of rainfall thresholds for debris flow occurrence, Geomorphology, 221, 286–297, https://doi.org/10.1016/j.geomorph.2014.06.015, 2014.
Nikolopoulos, E. I., Borga, M., Creutin, J. D., and Marra, F.: Estimation of debris flow triggering rainfall: Influence of rain gauge density and interpolation methods, Geomorphology, 243, 40–50, https://doi.org/10.1016/j.geomorph.2015.04.028, 2015.
Osman, M., Zittis, G., Haggag, M., Abdeldayem, A. W., and Lelieveld, J.: Optimizing Regional Climate Model Output for Hydro-Climate Applications in the Eastern Nile Basin, Earth Syst. Environ., 5, 185–200, https://doi.org/10.1007/s41748-021-00222-9, 2021.
Pellarin, T., Román-Cascón, C., Baron, C., Bindlish, R., Brocca, L., Camberlin, P., Fernández-Prieto, D., Kerr, Y. H., Massari, C., Panthou, G., Perrimond, B., Philippon, N., and Quantin, G.: The Precipitation Inferred from Soil Moisture (PrISM) Near Real-Time Rainfall Product: Evaluation and Comparison, Remote Sensing, 12, 481, https://doi.org/10.3390/rs12030481, 2020.
Peres, D. J. and Cancelliere, A.: Derivation and evaluation of landslide-triggering thresholds by a Monte Carlo approach, Hydrol. Earth Syst. Sci., 18, 4913–4931, https://doi.org/10.5194/hess-18-4913-2014, 2014.
Peres, D. J., Cancelliere, A., Greco, R., and Bogaard, T. A.: Influence of uncertain identification of triggering rainfall on the assessment of landslide early warning thresholds, Nat. Hazards Earth Syst. Sci., 18, 633–646, https://doi.org/10.5194/nhess-18-633-2018, 2018.
Peruccacci, S., Brunetti, M. T., Gariano, S. L., Melillo, M., Rossi, M., and Guzzetti, F.: Rainfall thresholds for possible landslide occurrence in Italy, Geomorphology, 290, 39–57, https://doi.org/10.1016/j.geomorph.2017.03.031, 2017.
Rossi, M., Luciani, S., Valigi, D., Kirschbaum, D., Brunetti, M. T., Peruccacci, S., and Guzzetti, F.: Statistical approaches for the definition of landslide rainfall thresholds and their uncertainty using rain gauge and satellite data, Geomorphology, 285, 16–27, https://doi.org/10.1016/j.geomorph.2017.02.001, 2017.
San-Martín, D., Manzanas, R., Brands, S., Herrera, S., and Gutiérrez, J. M.: Reassessing Model Uncertainty for Regional Projections of Precipitation with an Ensemble of Statistical Downscaling Methods, J. Climate, 30, 203–223, https://doi.org/10.1175/jcli-d-16-0366.1, 2017.
Sättele, M., Bründl, M., and Straub, D.: Reliability and effectiveness of early warning systems for natural hazards: Concept and application to debris flow warning, Reliab. Eng. Syst. Safe., 142, 192–202, https://doi.org/10.1016/j.ress.2015.05.003, 2015.
Schumacher, V., Fernández, A., Justino, F., and Comin, A.: WRF High Resolution Dynamical Downscaling of Precipitation for the Central Andes of Chile and Argentina, Front. Earth Sci., 8, 1–19, https://doi.org/10.3389/feart.2020.00328, 2020.
Segoni, S., Piciullo, L., and Gariano, S. L.: Preface: Landslide early warning systems: monitoring systems, rainfall thresholds, warning models, performance evaluation and risk perception, Nat. Hazards Earth Syst. Sci., 18, 3179–3186, https://doi.org/10.5194/nhess-18-3179-2018, 2018.
Sepúlveda, S. A. and Petley, D. N.: Regional trends and controlling factors of fatal landslides in Latin America and the Caribbean, Nat. Hazards Earth Syst. Sci., 15, 1821–1833, https://doi.org/10.5194/nhess-15-1821-2015, 2015.
Skamarock, W. C., Klemp, J. B., Dudhia, J., Gill, D. O., Liu, Z., Berner, J., Wang, W., Powers, J. G., Duda, M. G., Barker, D. M., and Huang, X.-Y.: A Description of the Advanced Research WRF Model Version 4, UCAR/NCAR, https://doi.org/10.5065/1DFH-6P97, 2019.
Somos-Valenzuela, M. A., Oyarzún-Ulloa, J. E., Fustos-Toribio, I. J., Garrido-Urzua, N., and Chen, N.: The mudflow disaster at Villa Santa Lucía in Chilean Patagonia: understandings and insights derived from numerical simulation and postevent field surveys, Nat. Hazards Earth Syst. Sci., 20, 2319–2333, https://doi.org/10.5194/nhess-20-2319-2020, 2020.
Srivastava, P. K., Islam, T., Gupta, M., Petropoulos, G., and Dai, Q.: WRF Dynamical Downscaling and Bias Correction Schemes for NCEP Estimated Hydro-Meteorological Variables, Water Resour. Manage., 29, 2267–2284, https://doi.org/10.1007/s11269-015-0940-z, 2015.
Tewari, M., Chen, F., Wang, W., Dudhia, J., LeMone, M. A., Mitchell, K., Ek, M., Gayno, G., Wegiel, J., and Cuenca, R. H.: Implementation and verification of the unified Noah land surface model in the WRF model, in: 20th Conf. on Weather Analy. And Forecast./16th Conf. on Numerical Weather Pred., 14 January 2004, Seattle, WA, USA, Paper 14.2A, https://ams.confex.com/ams/pdfpapers/69061.pdf (last access: 21 June 2022), 2004.
Thirugnanam, H., Ramesh, M. V., and Rangan, V. P.: Enhancing the reliability of landslide early warning systems by machine learning, Landslides, 17, 2231–2246, https://doi.org/10.1007/s10346-020-01453-z, 2020.
Tichavský, R., Ballesteros-Cánovas, J. A., Šilhán, K., Tolasz, R., and Stoffel, M.: Dry Spells and Extreme Precipitation are The Main Trigger of Landslides in Central Europe, Sci. Rep., 9, 14560, https://doi.org/10.1038/s41598-019-51148-2, 2019.
Tiranti, D., Cremonini, R., Marco, F., Gaeta, A. R., and Barbero, S.: The DEFENSE (debris Flows triggEred by storms – nowcasting system): An early warning system for torrential processes by radar storm tracking using a Geographic Information System (GIS), Comput. Geosci., 70, 96–109, https://doi.org/10.1016/j.cageo.2014.05.004, 2014.
Tiranti, D., Nicolò, G., and Gaeta, A. R.: Shallow landslides predisposing and triggering factors in developing a regional early warning system, Landslides, 16, 235–251, https://doi.org/10.1007/s10346-018-1096-8, 2019.
Wang, X., Otto, M., and Scherer, D.: Atmospheric triggering conditions and climatic disposition of landslides in Kyrgyzstan and Tajikistan at the beginning of the 21st century, Nat. Hazards Earth Syst. Sci., 21, 2125–2144, https://doi.org/10.5194/nhess-21-2125-2021, 2021.
Wayand, N. E., Hamlet, A. F., Hughes, M., Feld, S. I., and Lundquist, J. D.: Intercomparison of Meteorological Forcing Data from Empirical and Mesoscale Model Sources in the North Fork American River Basin in Northern Sierra Nevada, California, J. Hydrometeorol., 14, 677–699, https://doi.org/10.1175/jhm-d-12-0102.1, 2013.
Wilcke, R. A. I., Mendlik, T., and Gobiet, A.: Multi-variable error correction of regional climate models, Climatic Change, 120, 871–887, https://doi.org/10.1007/s10584-013-0845-x, 2013.
Worku, G., Teferi, E., Bantider, A., and Dile, Y. T.: Statistical bias correction of regional climate model simulations for climate change projection in the Jemma sub-basin, upper Blue Nile Basin of Ethiopia, Theor. Appl. Climatol., 139, 1569–1588, https://doi.org/10.1007/s00704-019-03053-x, 2020.
Yáñez-Morroni, G., Gironás, J., Caneo, M., Delgado, R., and Garreaud, R.: Using the Weather Research and Forecasting (WRF) Model for Precipitation Forecasting in an Andean Region with Complex Topography, Atmosphere, 9, 304, https://doi.org/10.3390/atmos9080304, 2018.
Yang, Q., Yu, Z., Wei, J., Yang, C., Gu, H., Xiao, M., Shang, S., Dong, N., Gao, L., Arnault, J., Laux, P., and Kunstmann, H.: Performance of the WRF model in simulating intense precipitation events over the Hanjiang River Basin, China – A multi-physics ensemble approach, Atmos. Res., 248, 105206, https://doi.org/10.1016/j.atmosres.2020.105206, 2021.
Zambrano-Bigiarini, M., Nauditt, A., Birkel, C., Verbist, K., and Ribbe, L.: Temporal and spatial evaluation of satellite-based rainfall estimates across the complex topographical and climatic gradients of Chile, Hydrol. Earth Syst. Sci., 21, 1295–1320, https://doi.org/10.5194/hess-21-1295-2017, 2017.
Zhao, B., Dai, Q., Han, D., Dai, H., Mao, J., Zhuo, L., and Rong, G.: Estimation of soil moisture using modified antecedent precipitation index with application in landslide predictions, Landslides, 16, 2381–2393, https://doi.org/10.1007/s10346-019-01255-y, 2019.