
Rock Pillar Design Using a Masonry Equivalent Numerical Model


1
Mining and Civil Engineering, Universidad Adolfo Ibáñez, Santiago 7941169, Chile
2
Civil Engineering, Universidad de Chile, Santiago 8370448, Chile
*
Author to whom correspondence should be addressed.
Energies 2021, 14(4), 890; https://doi.org/10.3390/en14040890
Submission received: 11 January 2021
/
Revised: 1 February 2021
/
Accepted: 2 February 2021
/
Published: 9 February 2021
(This article belongs to the Section H: Geo-Energy)
Abstract
:In underground mining, the design of rock pillars is of crucial importance as these are structures that allow safe mining by maintaining the stability of the surrounding excavations. Pillar design is often a complex task, as it involves estimating the loads at depths and the strength of the rock mass fabric, which depend on the intact strength of the rock and the shape of the pillar in terms of the aspect ratio (width/height). The design also depends on the number, persistence, orientation, and strength of the discontinuities with respect to the orientation and magnitude of the stresses present. Solutions to this engineering problem are based on one or more of the following approaches: empirical design methods, practical experience, and/or numerical modeling. Based on the similarities between masonry structures and rock mass characteristics, an equivalent approach is proposed as the one commonly used in masonry but applied to rock pillar design. Numerical models using different geometric configurations and state of stresses are carried out using a finite difference numerical approach with an adapted masonry model applied to rocks. The results show the capability of the numerical approach to replicate common types of pillar failure modes and stability thresholds as those observed in practice.
1. Introduction
Rock pillars are generally left in underground mines to safely and economically extract as much of the orebody as possible, by stabilizing the mine openings and withstanding the in situ and induced stresses of the rock mass. In [1], rock pillars are defined as “the in situ rock between two or more underground openings.” Pillars are composed of an intact rock substance and naturally occurring discontinuities such as joints, fractures, and bedding planes. From field experience, it is well known that the wider the pillar, the more stable they are. However, a wider pillar becomes inefficient in terms of economic revenue as more ore will be left unmined. The design of pillars has been done using different methods such as experience and empirical design, analytical design and numerical analysis using different constitutive rock models. Each method of design has advantages and disadvantages, as they require different input information of the rock mass strength, geometry of the pillar and surroundings, and in situ and induced stresses. The many input parameters, some unknown at the time of design, makes this process very difficult to undertake. It is essential to apply more than one method that results in an equivalent conclusion, to be able to take correct decisions of the dimensions and geometry of pillars and mined areas.
Underground rock design considers structural-controlled instability mechanisms and stress-controlled instability mechanisms. Structural-controlled mechanisms take into account the presence of discrete blocks formed by discontinuity planes that intersect the excavation contour. This type of failure may occur under low or high stress conditions and is usually stabilized by use of ground support with a combination of shotcrete, anchors, and wire meshes.
On the other hand, stress-controlled instability mechanisms must take into account the in situ and induced stresses before and after mining activities. Stress on pillars have been estimated by a relatively simple tributary area approach or a more precise solution with the use of numerical modeling.
Rock Pillar design is usually divided according to the type of rock in coal pillar and hard rock. Due to its lower intact strength, coal pillars generally have a larger width to height ratio (>1); on the other hand, hard rock pillars have width to height ratios usually less than 2 and even as small as 0.3. Therefore, they experience different problems during its design. Improved hard rock design and coal design have been proposed by different authors for example as shown in [2,3].
To estimate pillar strength, an empirically developed method is frequently used (see Equation (1)) which will be discussed in detail later. In this work, an alternative and novel modeling approach of rock pillars is performed by using failure mechanisms developed for masonry applications. The similarities between masonry structures and rock mass fabric are pointed out, and the failure mechanism of both materials is also highlighted. In total, 167 simulations were run varying the aspect ratio and strength parameters of the assessed pillars. The results are compared with field data obtained from the literature. The effect on the stability of pillar geometry, span between pillars, strength parameters, influence of discontinuity spacing and orientation, and buckling effects is analyzed. A new numerical modeling approach based on the theory derived from masonry structures shows to be a promising alternative to other numerical modeling approaches as it captures different modes of failure observed in the field and also allows to notice other aspects that are important but are not considered in the proposed model.
2. Design of Rock Pillars for Underground Mining and Methods
The geological conditions of the mine control the strength of pillars and their potential failure modes; therefore, it is not realistic to apply a generalized pillar design method to every mine scenario. The potential failure modes considered for pillar design are spalling (hourglassing), shear fracturing, bulking/bulging/slabbing, and foundation failure. It is well known that the pillar strength is proportional to the pillar width and the strength of the intact rock and inversely proportional to the pillar height. Thus, in the general form, the equation that relates the pillar strength is given as follows:
where:
- -
- σp = Strength of the pillar;
- -
- UCS = Unconfined compressive strength of the intact rock;
- -
- Wp = Width of the pillar;
- -
- Hp = Height of the pillar;
- -
- A, B, α, and β = Constants obtained from field observations.
As an example, the following equation was proposed by [4]:
where the LDF factor relates the orientation of rock structures with respect to the orientation of the load being applied. The LDF factor is explained later in this paper.
On the other hand, the pillar stress is determined from the depths of the overburden, the unit weight of the rock, and the extraction ratio. The pillar stress can be obtained using tributary theory and numerical modeling.
Most of the design criteria available for underground hard-rock pillars are based on empirical studies [5,6,7,8,9,10,11,12,13,14]. The design criterion is derived from the pillar width-to-height ratio and the average pillar stress over the UCS strength of the rock. The strength of pillars, fitted from the available data as an empirical strength curve where the abovementioned constants are derived, is based on back analysis of stable, unstable, and failed pillars.
In [15], a new convergence-confinement approach was proposed which makes use of the pillar reaction curves for predicting the axial stress acting on the pillar. An interaction diagram, comprising a ground reaction curve (also called the ground characteristic curve) and a support reaction curve, needs to be built. The ground reaction curve describes the response of the excavation walls to the pressure the rock mass exerts and the support reaction curve describes the response of the support to the pressure the rock mass exerts. The convergence–confinement equilibrium conditions are obtained at the intersection of these two curves. This approach to pillar design requires numerical stress analysis to produce the proper ground reaction curves which take into consideration the pre-mining stress state, the elastic constants of both the host and the pillar rocks, the pillar dimensions (width and height), their location within the mine, and the mutual interaction with other pillars.
3. Similarities between Masonry and Proposed Masonry Model for Rock Pillars
In [16], it was shown that there are similarities between rock mass and masonry. The present work expands these similarities through the construction of a numerical model that has been adapted from masonry theory as in [17]. Three different modes of failure are considered for masonry structures; these modes depend on the strength of the mortar (discontinuity) and the brick (intact rock) and the stresses being applied. These modes of failure are:
- -
- Adherence failure;
- -
- Failure by diagonal traction;
- -
- Compression failure.
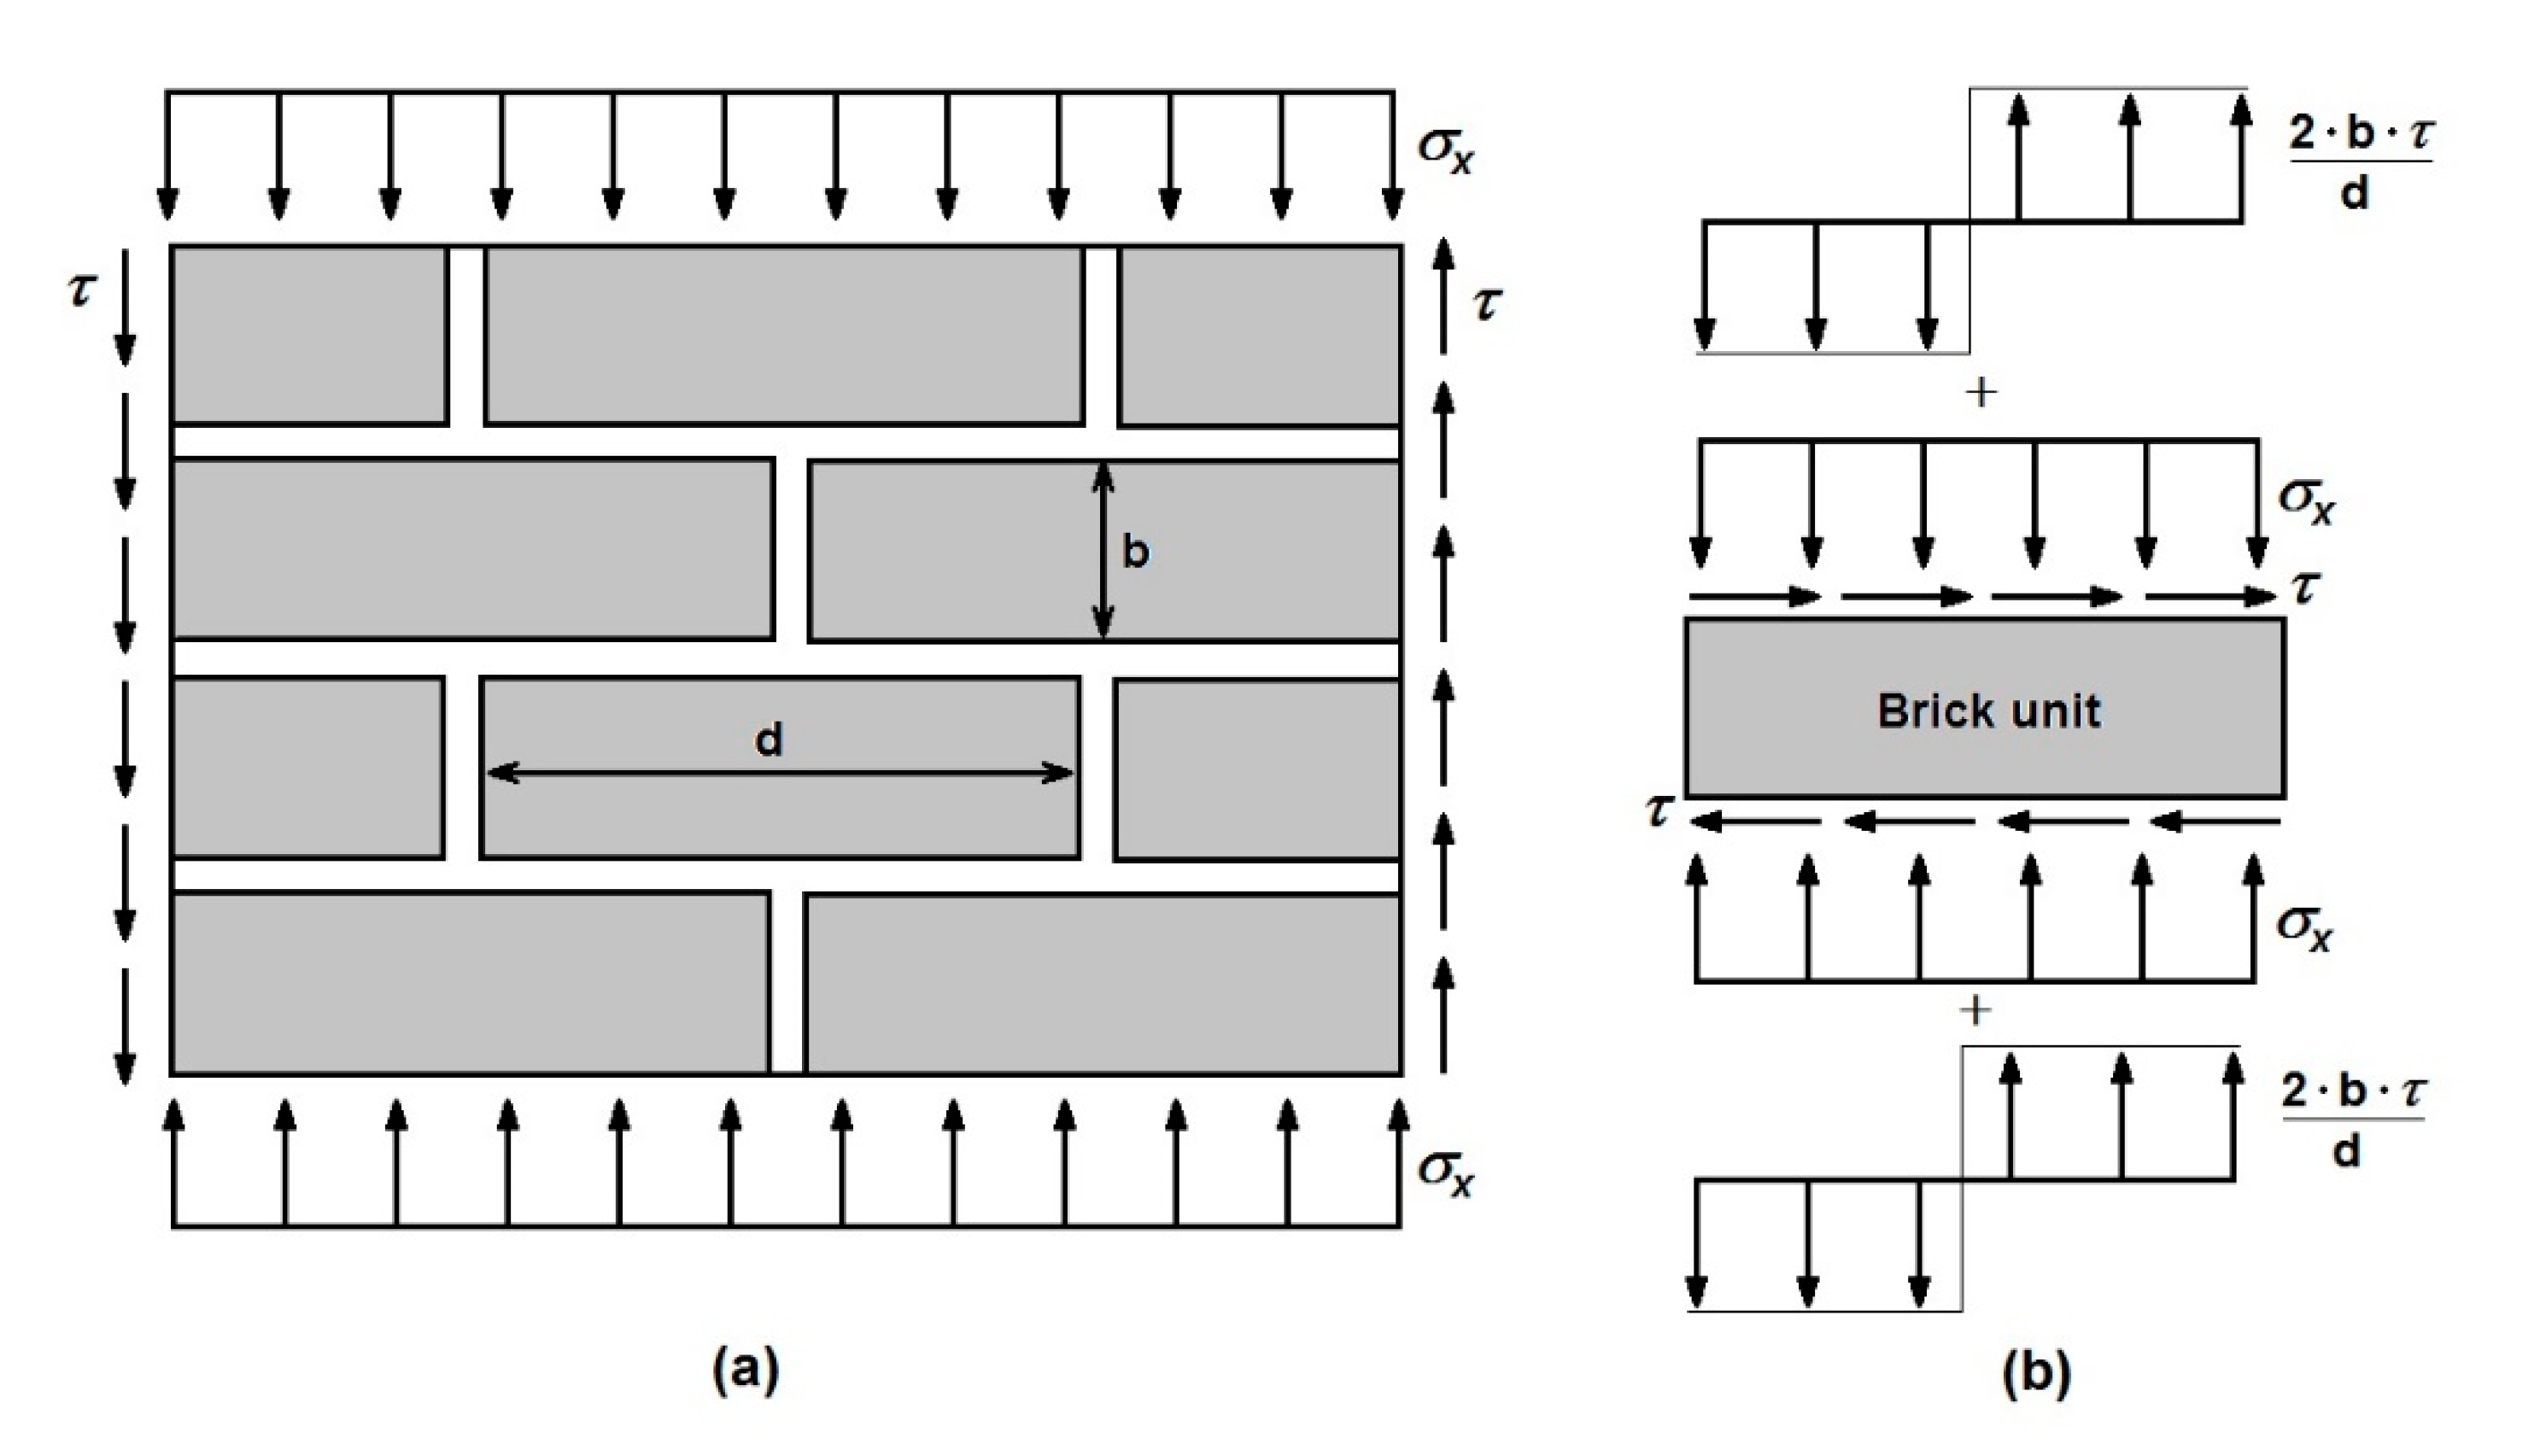
When analyzing a segment of a masonry wall, it is considered that normal stresses are acting on its horizontal faces and shear stresses are acting on its four faces. In rock pillars, this could be interpreted such that the horizontal loads are much lower than the vertical loads. When analyzing a single unit (or brick), it will be necessary to consider additional stresses over the horizontal faces of the brick, in order to maintain the moment equilibrium, as shown in Figure 1. In this case, b is the height and d is the length of the brick, σx is the normal stress, and τ is the shear stress acting on the panel.
In the following paragraphs are briefly mentioned the three modes of failure considered in masonry theory. Additional details can be found in [17].
3.1. Adherence Failure
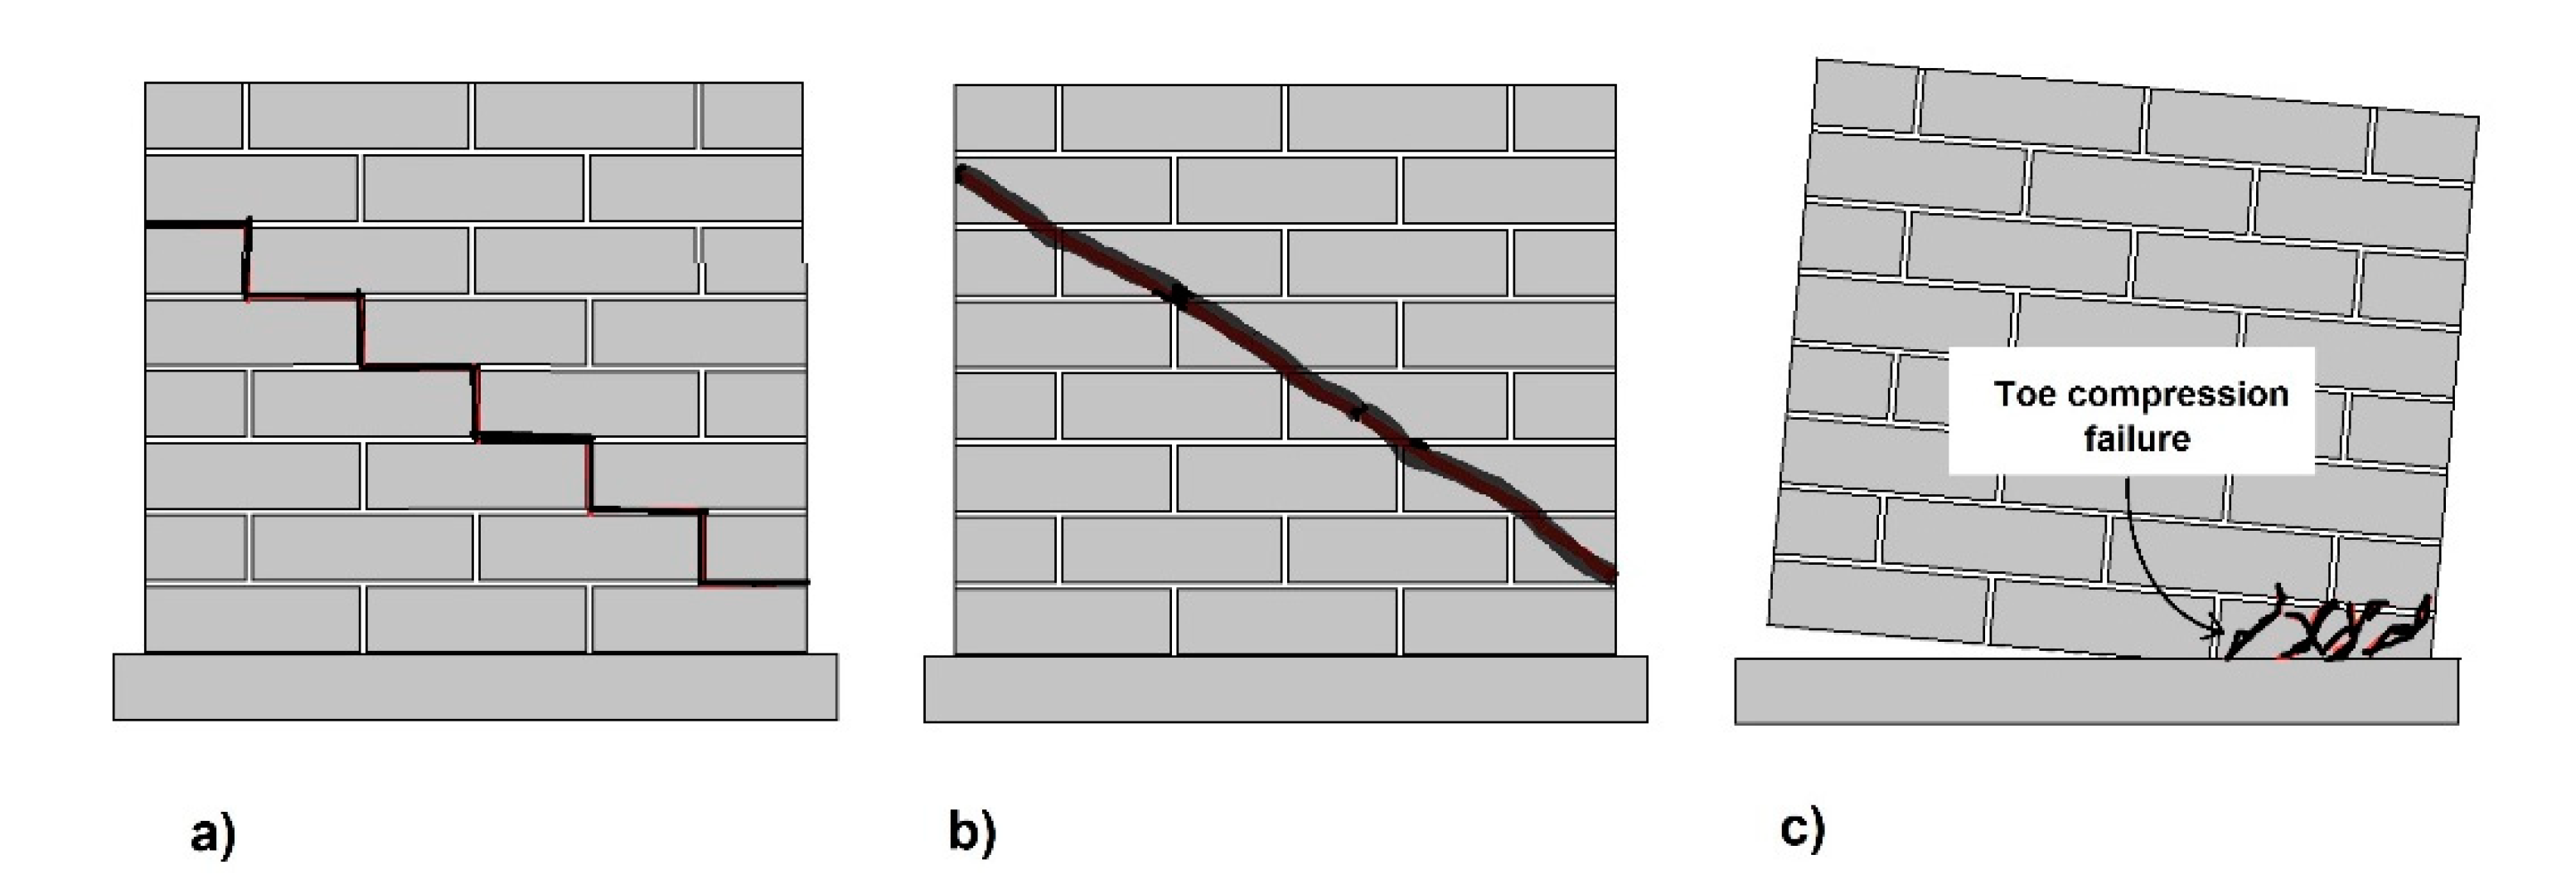
In this failure mode, a stepped failure surface is observed as shown in Figure 2a. Along this failure surface, the shear stress is equal to the strength of the joint between bricks (equivalent to the strength of discontinuities in a rock mass). Shear strength can be expressed by the equation:
where μ is the friction coefficient between the mortar and the brick and τ0 is the adherence or cohesion.
3.2. Failure by Diagonal Traction
In this case, traction over a brick unit must be considered and compared with its tensile strength. A schematic representation is shown in Figure 2b.
3.3. Compression Failure
This mode of failure depends on the compressive strength of the brick itself. This strength must be compared with the compressive stresses on the brick. A schematic of this type of failure is shown in Figure 2c.
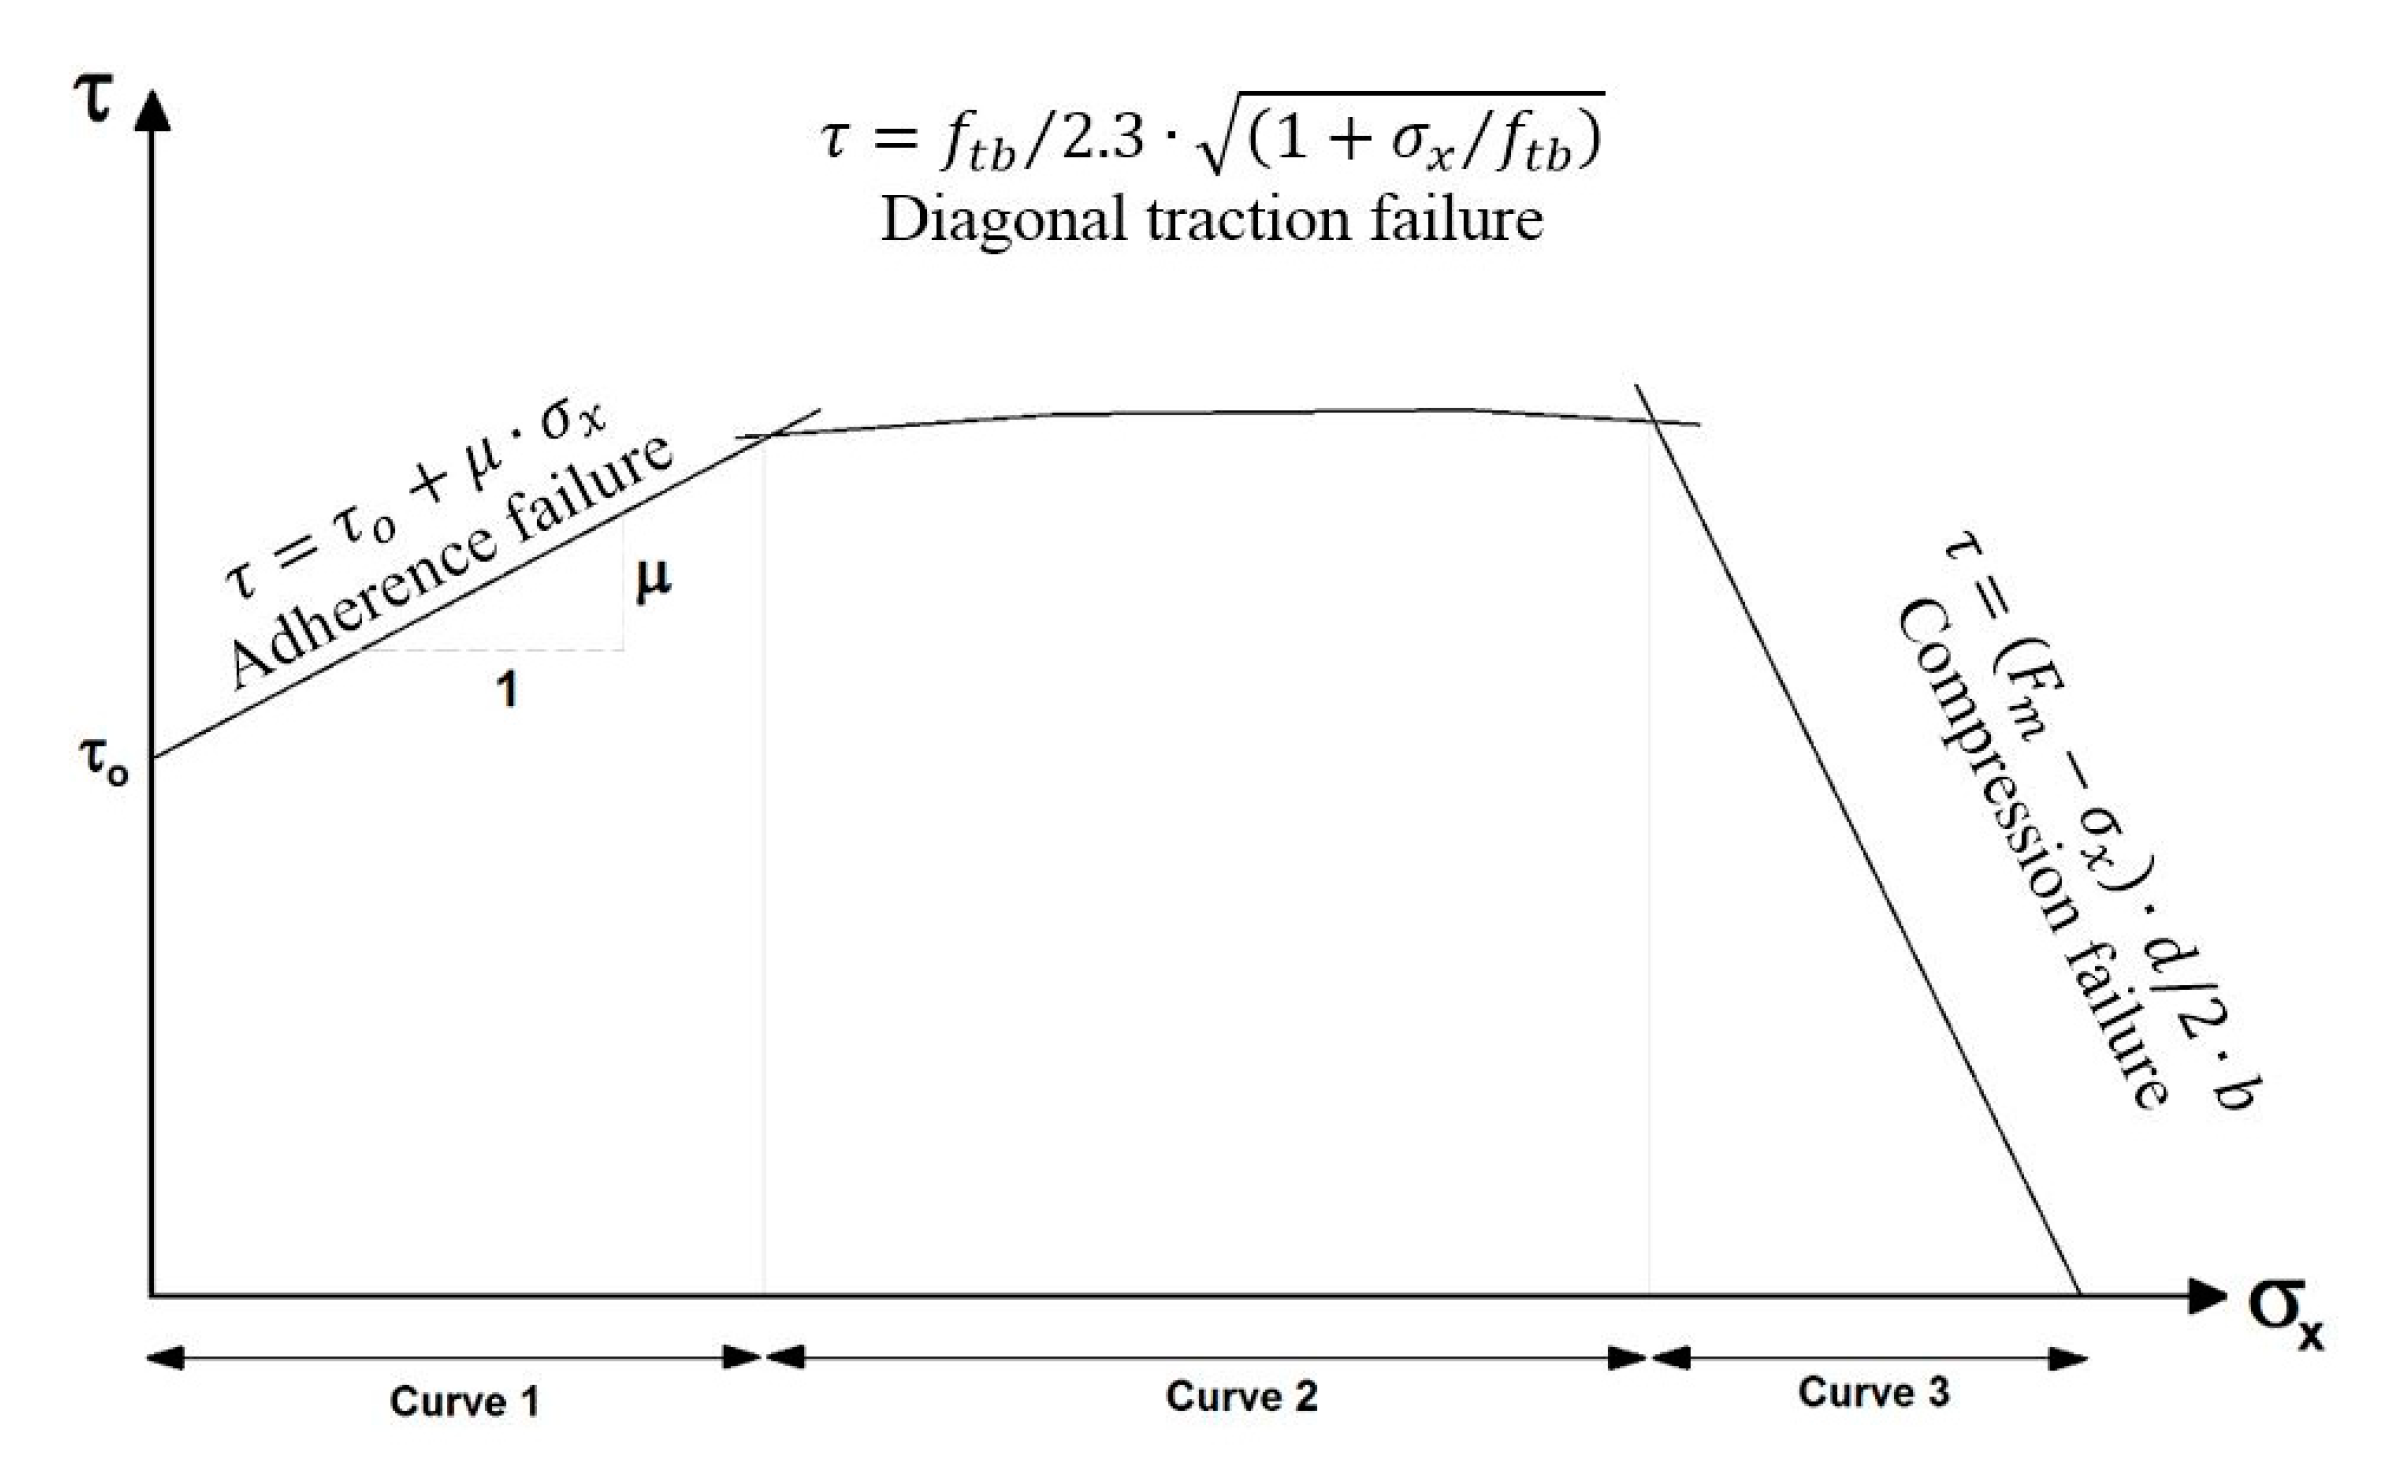
Altogether, these three modes of failure for masonry enable to generate a failure envelope, as shown in Figure 3. For low normal stresses it would be expected to have adherence failure for medium stress diagonal traction failure and for larger normal stresses compression failure. In Figure 3, fcb is the tensile capacity of the brick, σx is the normal stress, μ is the friction between mortar and brick, τ0 is the adherence or cohesion between mortar and brick, Fm is the compression resistance of the brick, and d and b are the dimensions of the brick.
4. Proposed Failure Criteria for Rock Pillars Based on Masonry
Considering the three modes of failure observed in masonry, a failure envelope is proposed for the 2D analysis of rock masses. To obtain this envelope, it is necessary to know the strength of the intact rock and discontinuities. The intact rock between discontinuities is considered equivalent to a brick unit, and the discontinuities on the rock mass as the mortar between bricks. The main restrictions of the proposed model are:
- -
- Two-dimensional analysis;
- -
- Discontinuities in the rock mass are solely considered to dip vertically and horizontally; these correspond to the border of an element in the numerical mesh where stresses are calculated;
- -
- Intact rock strength is constant in the rock mass;
- -
- Discontinuity strength is constant in the rock mass.
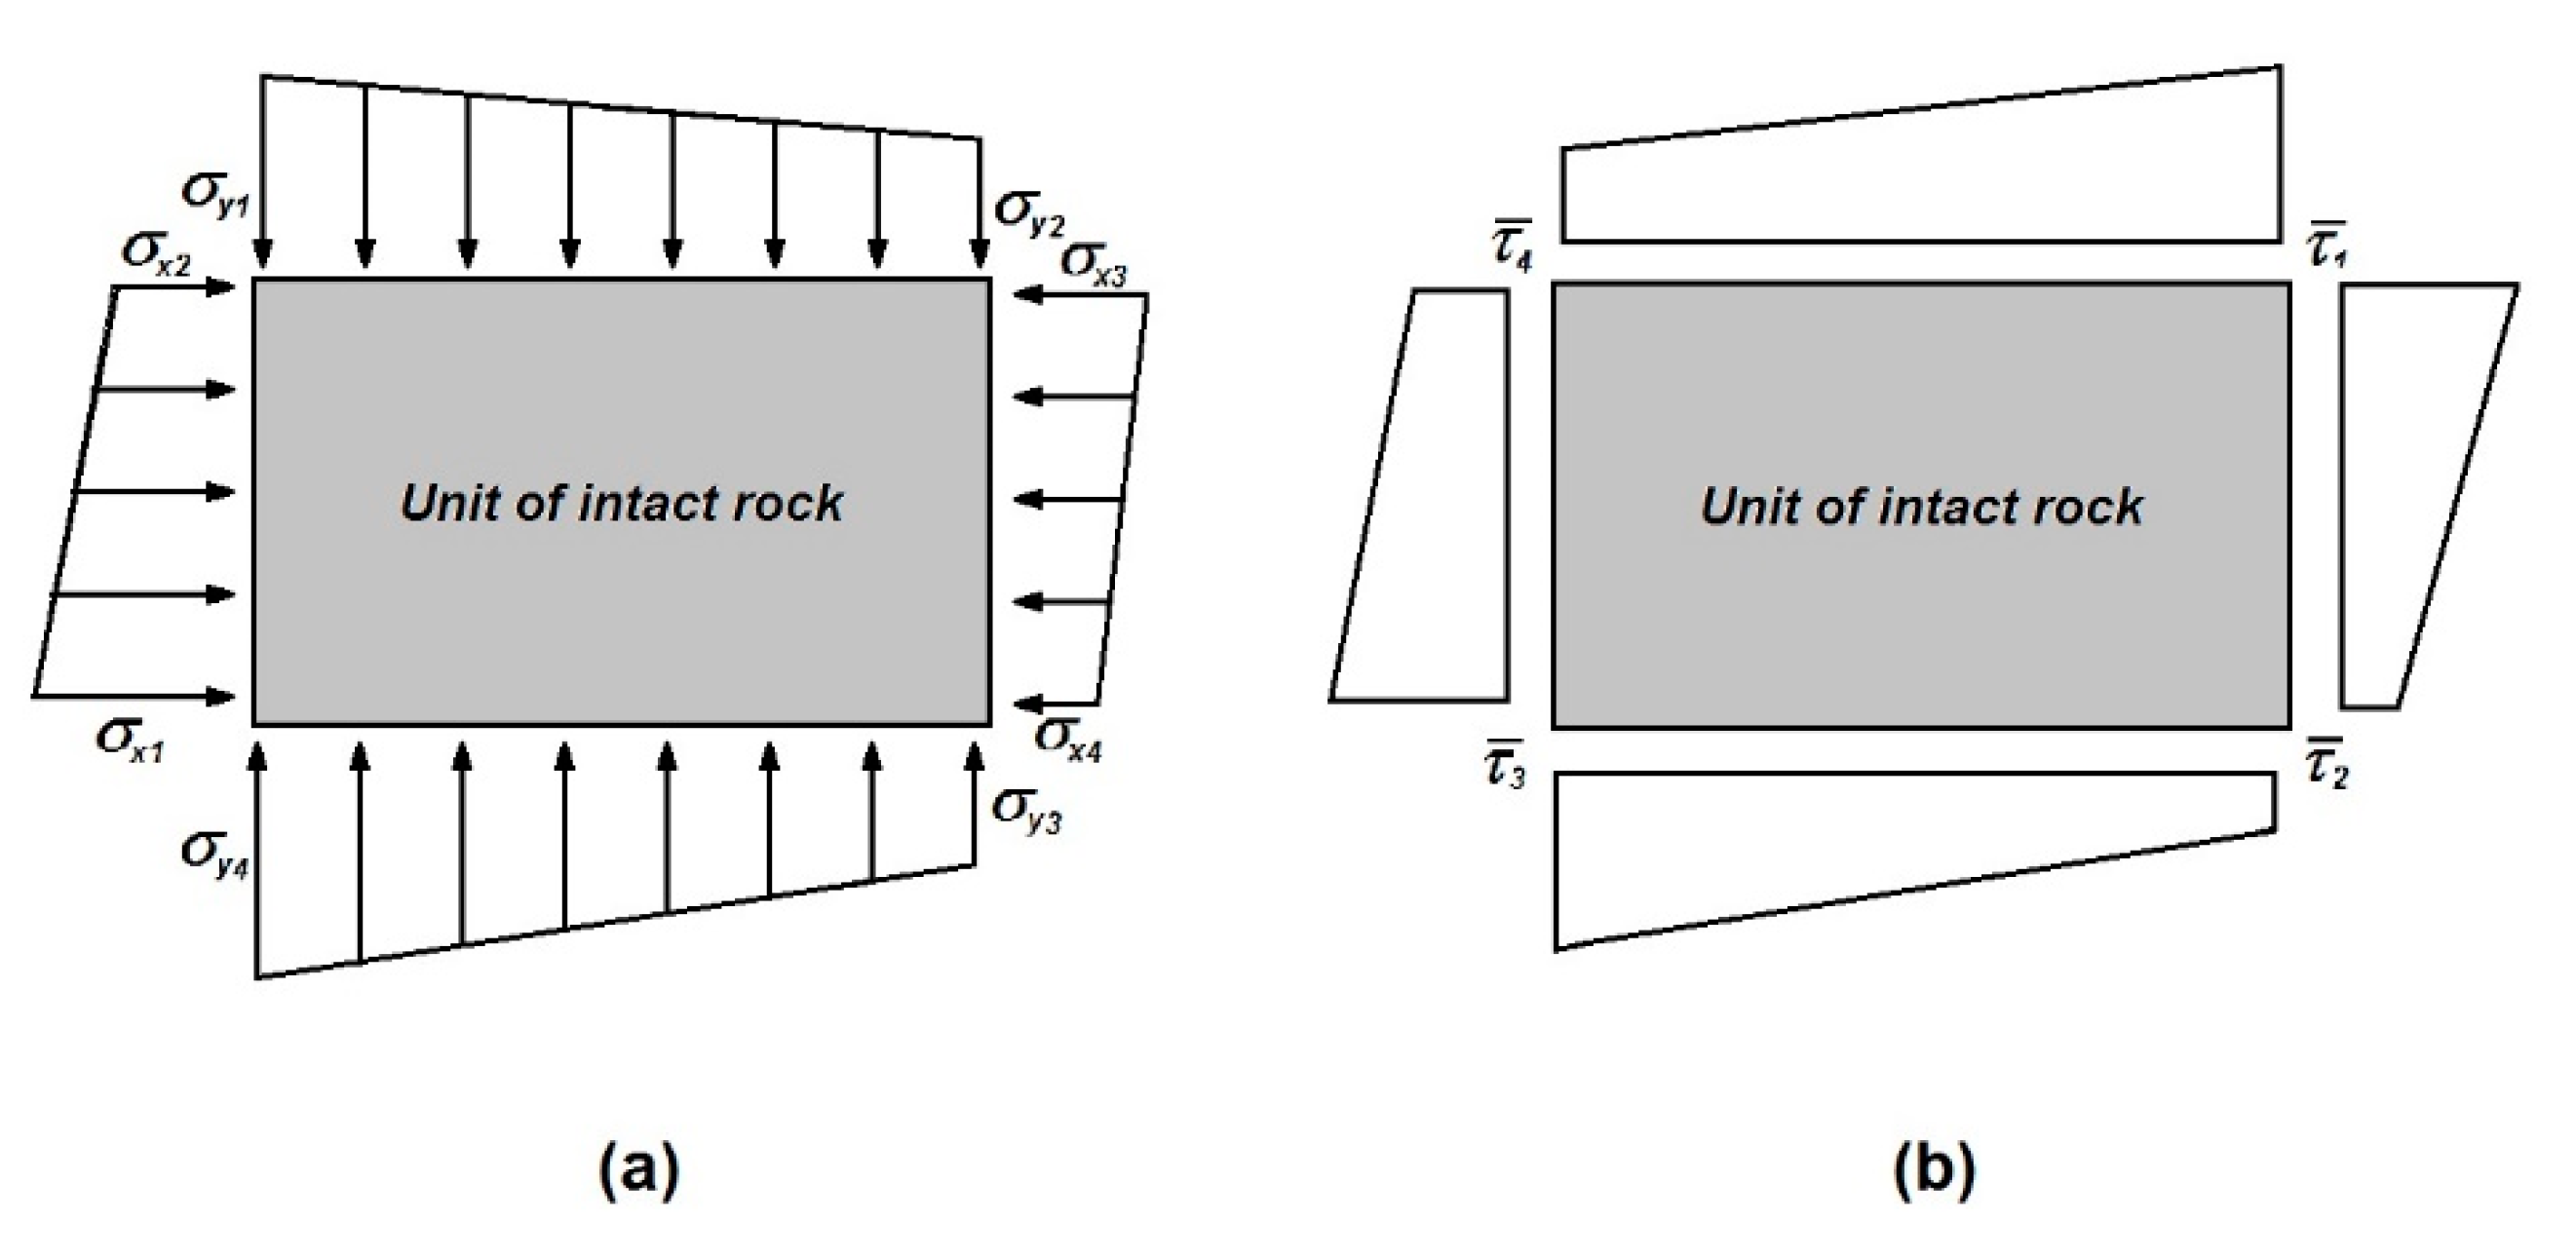
In order to closely represent the stress state in the rock mass, it is assumed that the normal and shear stresses in the rock units vary linearly and not in steps, as shown by [17] and Figure 4.
Normal and shear stresses required for defining the stability condition will be determined at the nodes of the numerical mesh. Descriptions of pillar failure modes is explained in the following paragraphs.
4.1. Adherence Failure in the Rock Mass
Shear strength is compared with the applied shear stress on each face (discontinuity) of every unit of rock. This is done on all nodes of every rock unit, where every face has two nodes, one on each side (right and left). Therefore, for each unit, a total of eight equations are verified to establish if the unit is stable. These equations are of the form:
This is done using a function within a loop that accesses and checks constantly the whole mesh of the problem being solved. In a unit, it will be considered an adherence failure only if its four faces have failed.
4.2. Failure by Diagonal Traction of the Rock Mass
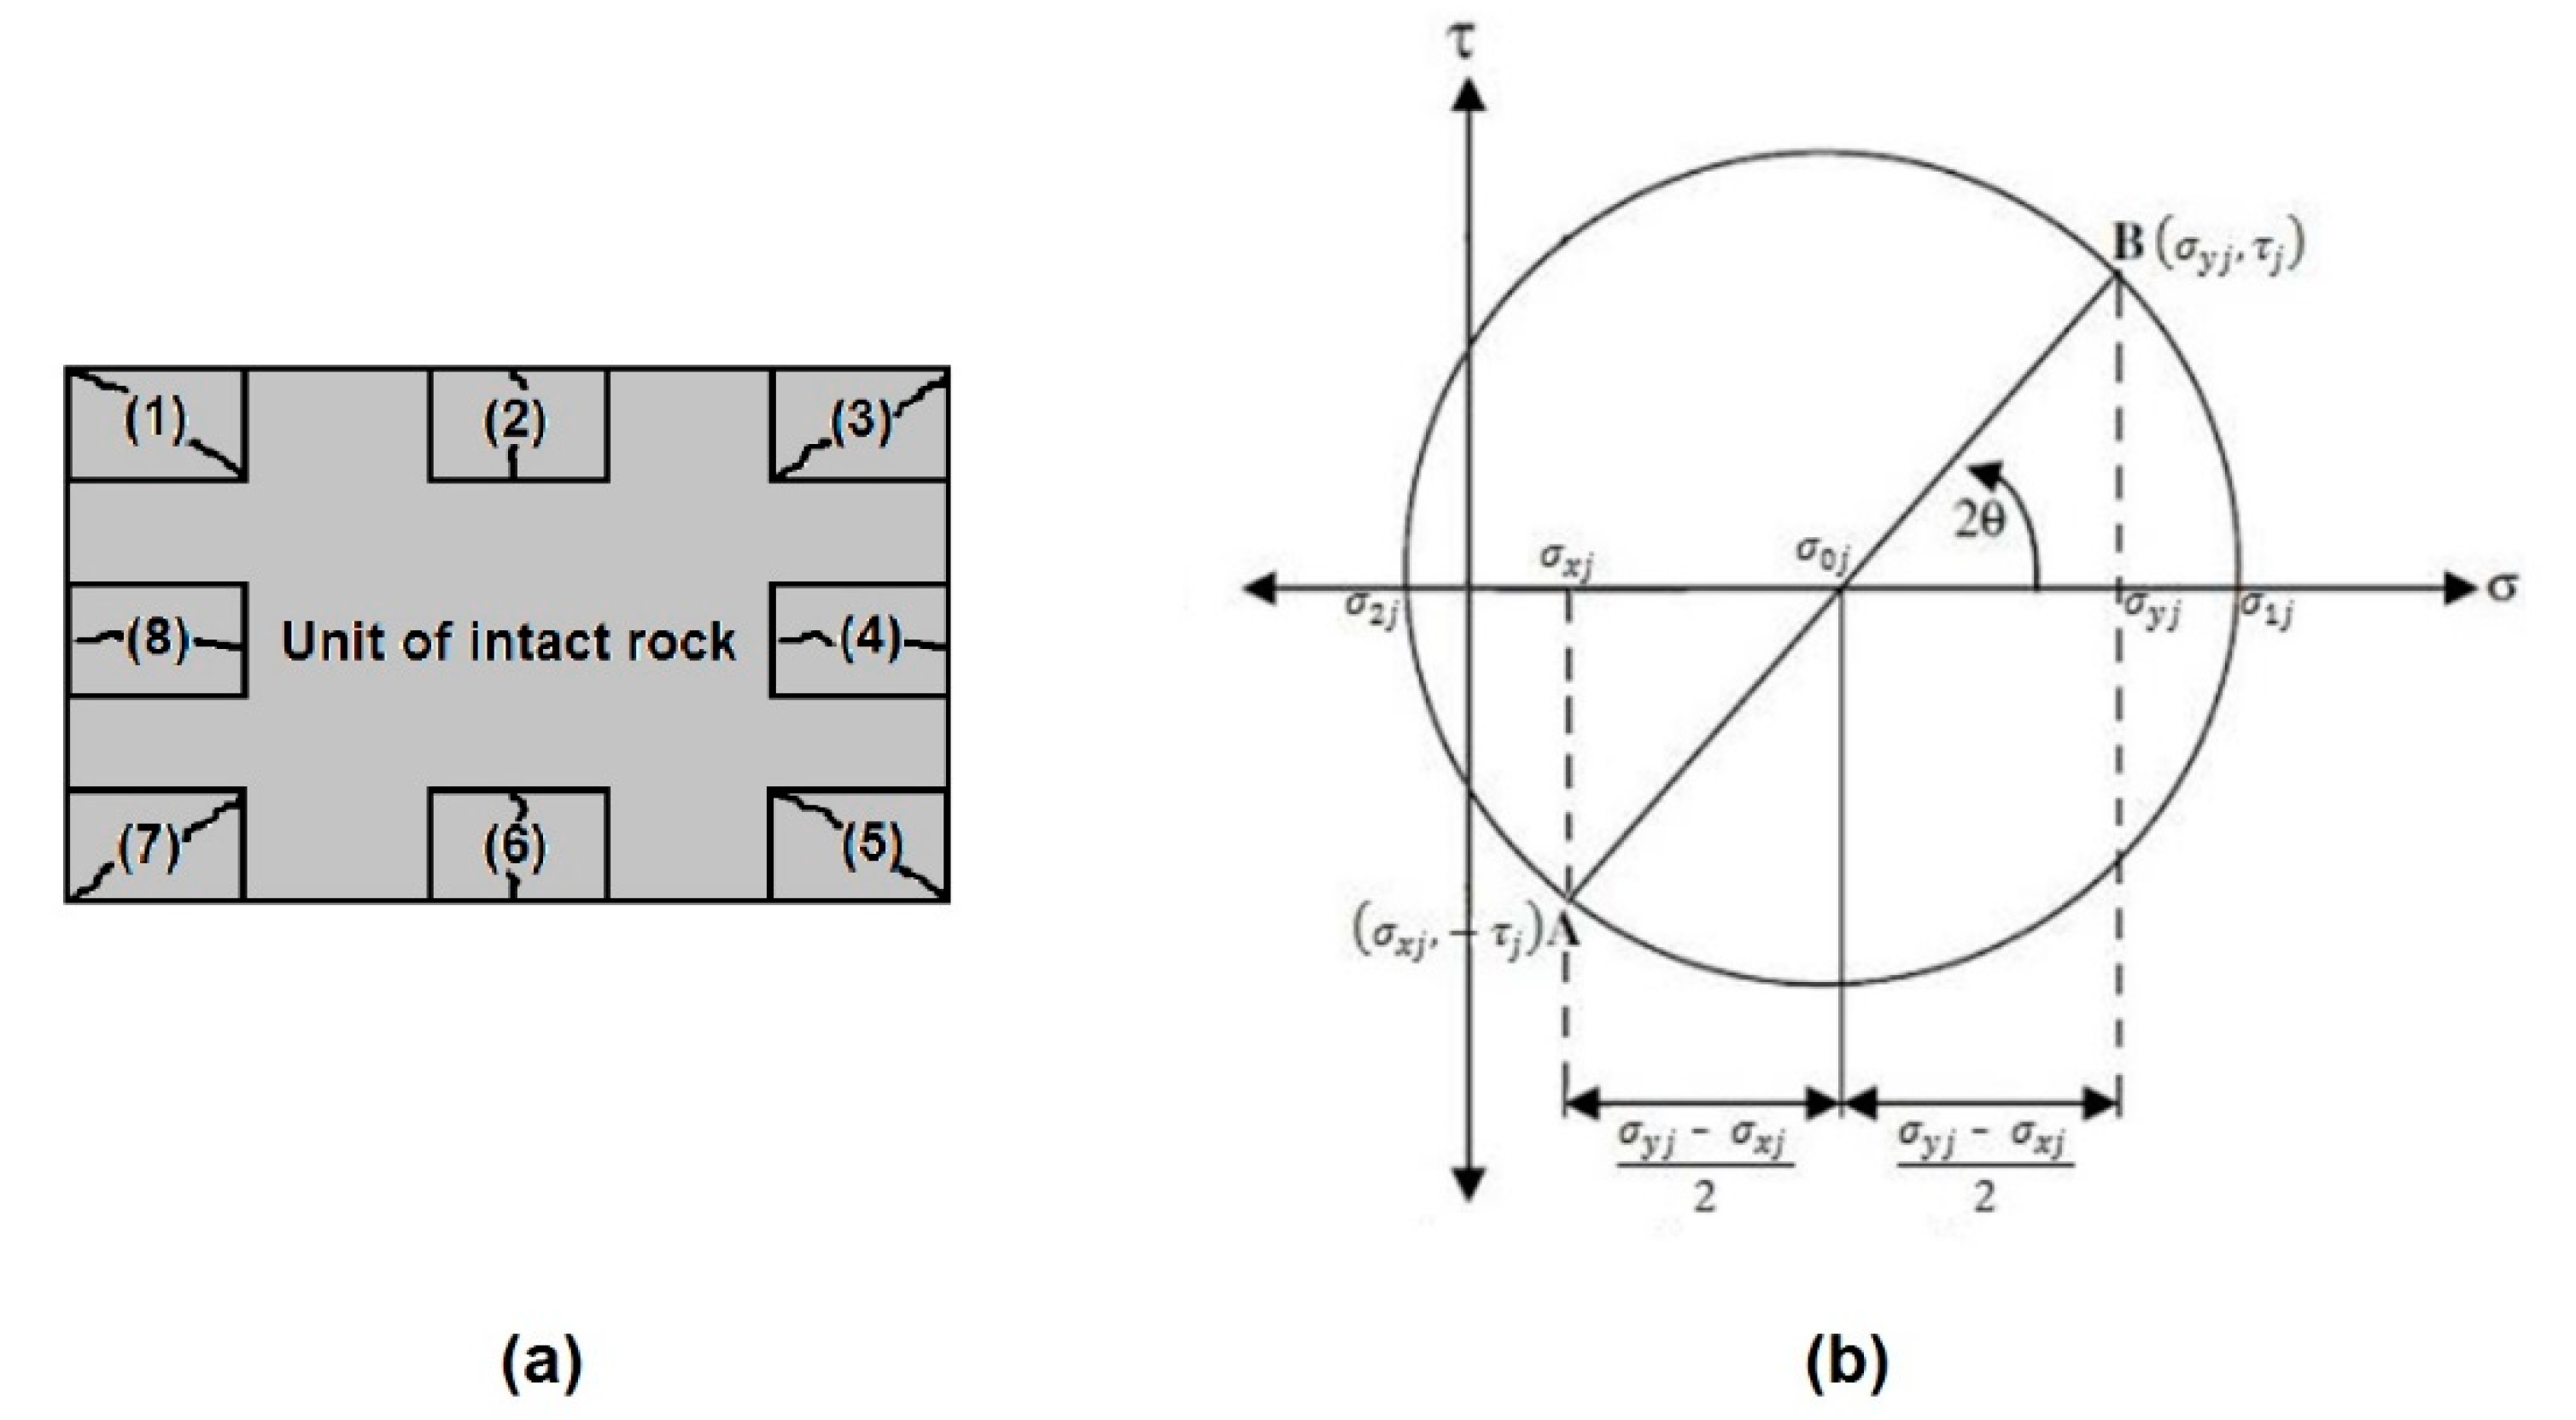
For the diagonal traction failure mode, Mann and Muller [17] considered assessing the strength at the center of the unit. However, in this model, the vertical and horizontal stresses could be different, considering that the stresses must be checked at eight different locations of the unit, as shown in Figure 5.
Both masonry structures and rock masses have a low tensile strength (in the order of 10% to 15% of its compressive strength). Figure 5b diagram shows that the tensile stress is given by:
where and are the horizontal and vertical normal stresses and τj is the shear stress acting on point j.
Before the onset of failure, the tensile stress cannot exceed the tensile capacity of the intact rock (ftb), therefore:
where τ is the shear strength on the rock unit where diagonal traction failure occurs. This formula is checked for all eight points of the rock unit shown in Figure 5. In this case, failure of the unit is established if at least one of the eight points fail according to previous equations.
4.3. Compression Failure
This type of failure depends directly on the unconfined strength of the intact rock (UCS). Maximum compressive stress in the rock unit should not exceed this value. This will be checked for all eight points shown in Figure 5, and therefore, in this case, the major principal stress should consider:
Similarly, if one or more of the eight points is in a state of failure, the rock unit will be considered to have failed by compression.
As the masonry model does not take into account the frequency and inclination of the discontinuities, they will be considered with the use of the LDF factor, due to the presence of large discontinuities dipping at an angle, as described by [18]:
where:
- -
- LDF: Large Discontinuity Factor;
- -
- DDF: Discontinuity Dip Factor;
- -
- FF: Frequency factor.
DDF is an inclination adjustment factor that represents the strength reduction due to a single discontinuity that intersects the pillar at or near its core. Table 1 shows the DDF for a range of discontinuity dips with respect to the pillar’s width-to-height ratio, and Table 2 shows the FF for a range of average frequencies of large discontinuities per pillar.
5. Numerical Results for Rock Pillars
FLAC 2D was the numerical code employed for modeling and estimating the stability of pillars under different geometries and varying strength properties [19]. FLAC uses a finite difference approach that allows the use of different constitutive models to represent rock mass or other materials as a continuum and determine its behavior under the loads being applied. In a first stage, the model is run using a linear-elastic constitutive model that gives the initial stresses that are subject the considered pillars according to its geometry, but prevents failure of the material. Posteriorly, three modes of failure, as described in Figure 3, with their respective strength envelopes are accounted for through the use of strength functions (fish functions in FLAC), which are compared to the stresses and derived from the model. Different pillar geometries were considered: width and height, width of opening, and strength parameters of the intact rock and discontinuities. For each mesh element (brick unit), when one of the three types of failure is reached, they get removed from the mesh and the model tries again to reach equilibrium. Size of the mesh was chosen as the biggest one possible but obtaining repeatable stresses and deformations of thinner size mesh. This process continues until the pillar is stable or complete failure is observed. The applied in situ stresses correspond to what has been observed at El Teniente Mine and are defined such that σh = 40 MPa (maximum horizontal stress) and σv = 25 MPa (vertical stress) [20]. Rock mass parameters are given by: K = 18.4 GPa (bulk modulus), G = 13.2 GPa (shear modulus), ρ = 28 kN/m3 (unit weight), and UCS = 119 MPa. Discontinuity strength was obtained from [20,21,22], and it is estimated to have an average cohesion of 0.6 MPa and a friction angle (ϕ) of 38°. However, a sensitivity analysis was performed to determine the effects of changing these values.
The following stages are executed through the numerical modeling process carried out:
- -
- Creation of mesh;
- -
- Applying properties to the strength function used for characterizing the masonry failure envelope in the rock mass;
- -
- Solving the initial stage for boundary loads until equilibrium is reached;
- -
- Performing excavations using the null model. This creates the pillar geometry. This stage is solved until equilibrium is reached using the elastic model;
- -
- While stepping, each element of the mesh is constantly checked using the masonry failure envelope explained previously;
- -
- Mesh elements that fail, according to any of the failure modes explained previously, are extracted (defined as null elements);
- -
- With the remaining elements, the model continues to run and failure modes are checked until no more elements fail (stable pillar) or the pillar fails completely.
A total of 167 models were run with overburden depths of 390 and 870 m with varying widths and heights of pillars and widths of openings. Firstly, the UCS value is adjusted in order to find the onset of failure. In the following stage, the discontinuity strength values are modified to check their influence on pillar stability.
6. Results and Discussion on the Validity of the Use of Masonry-Type Constitutive Model
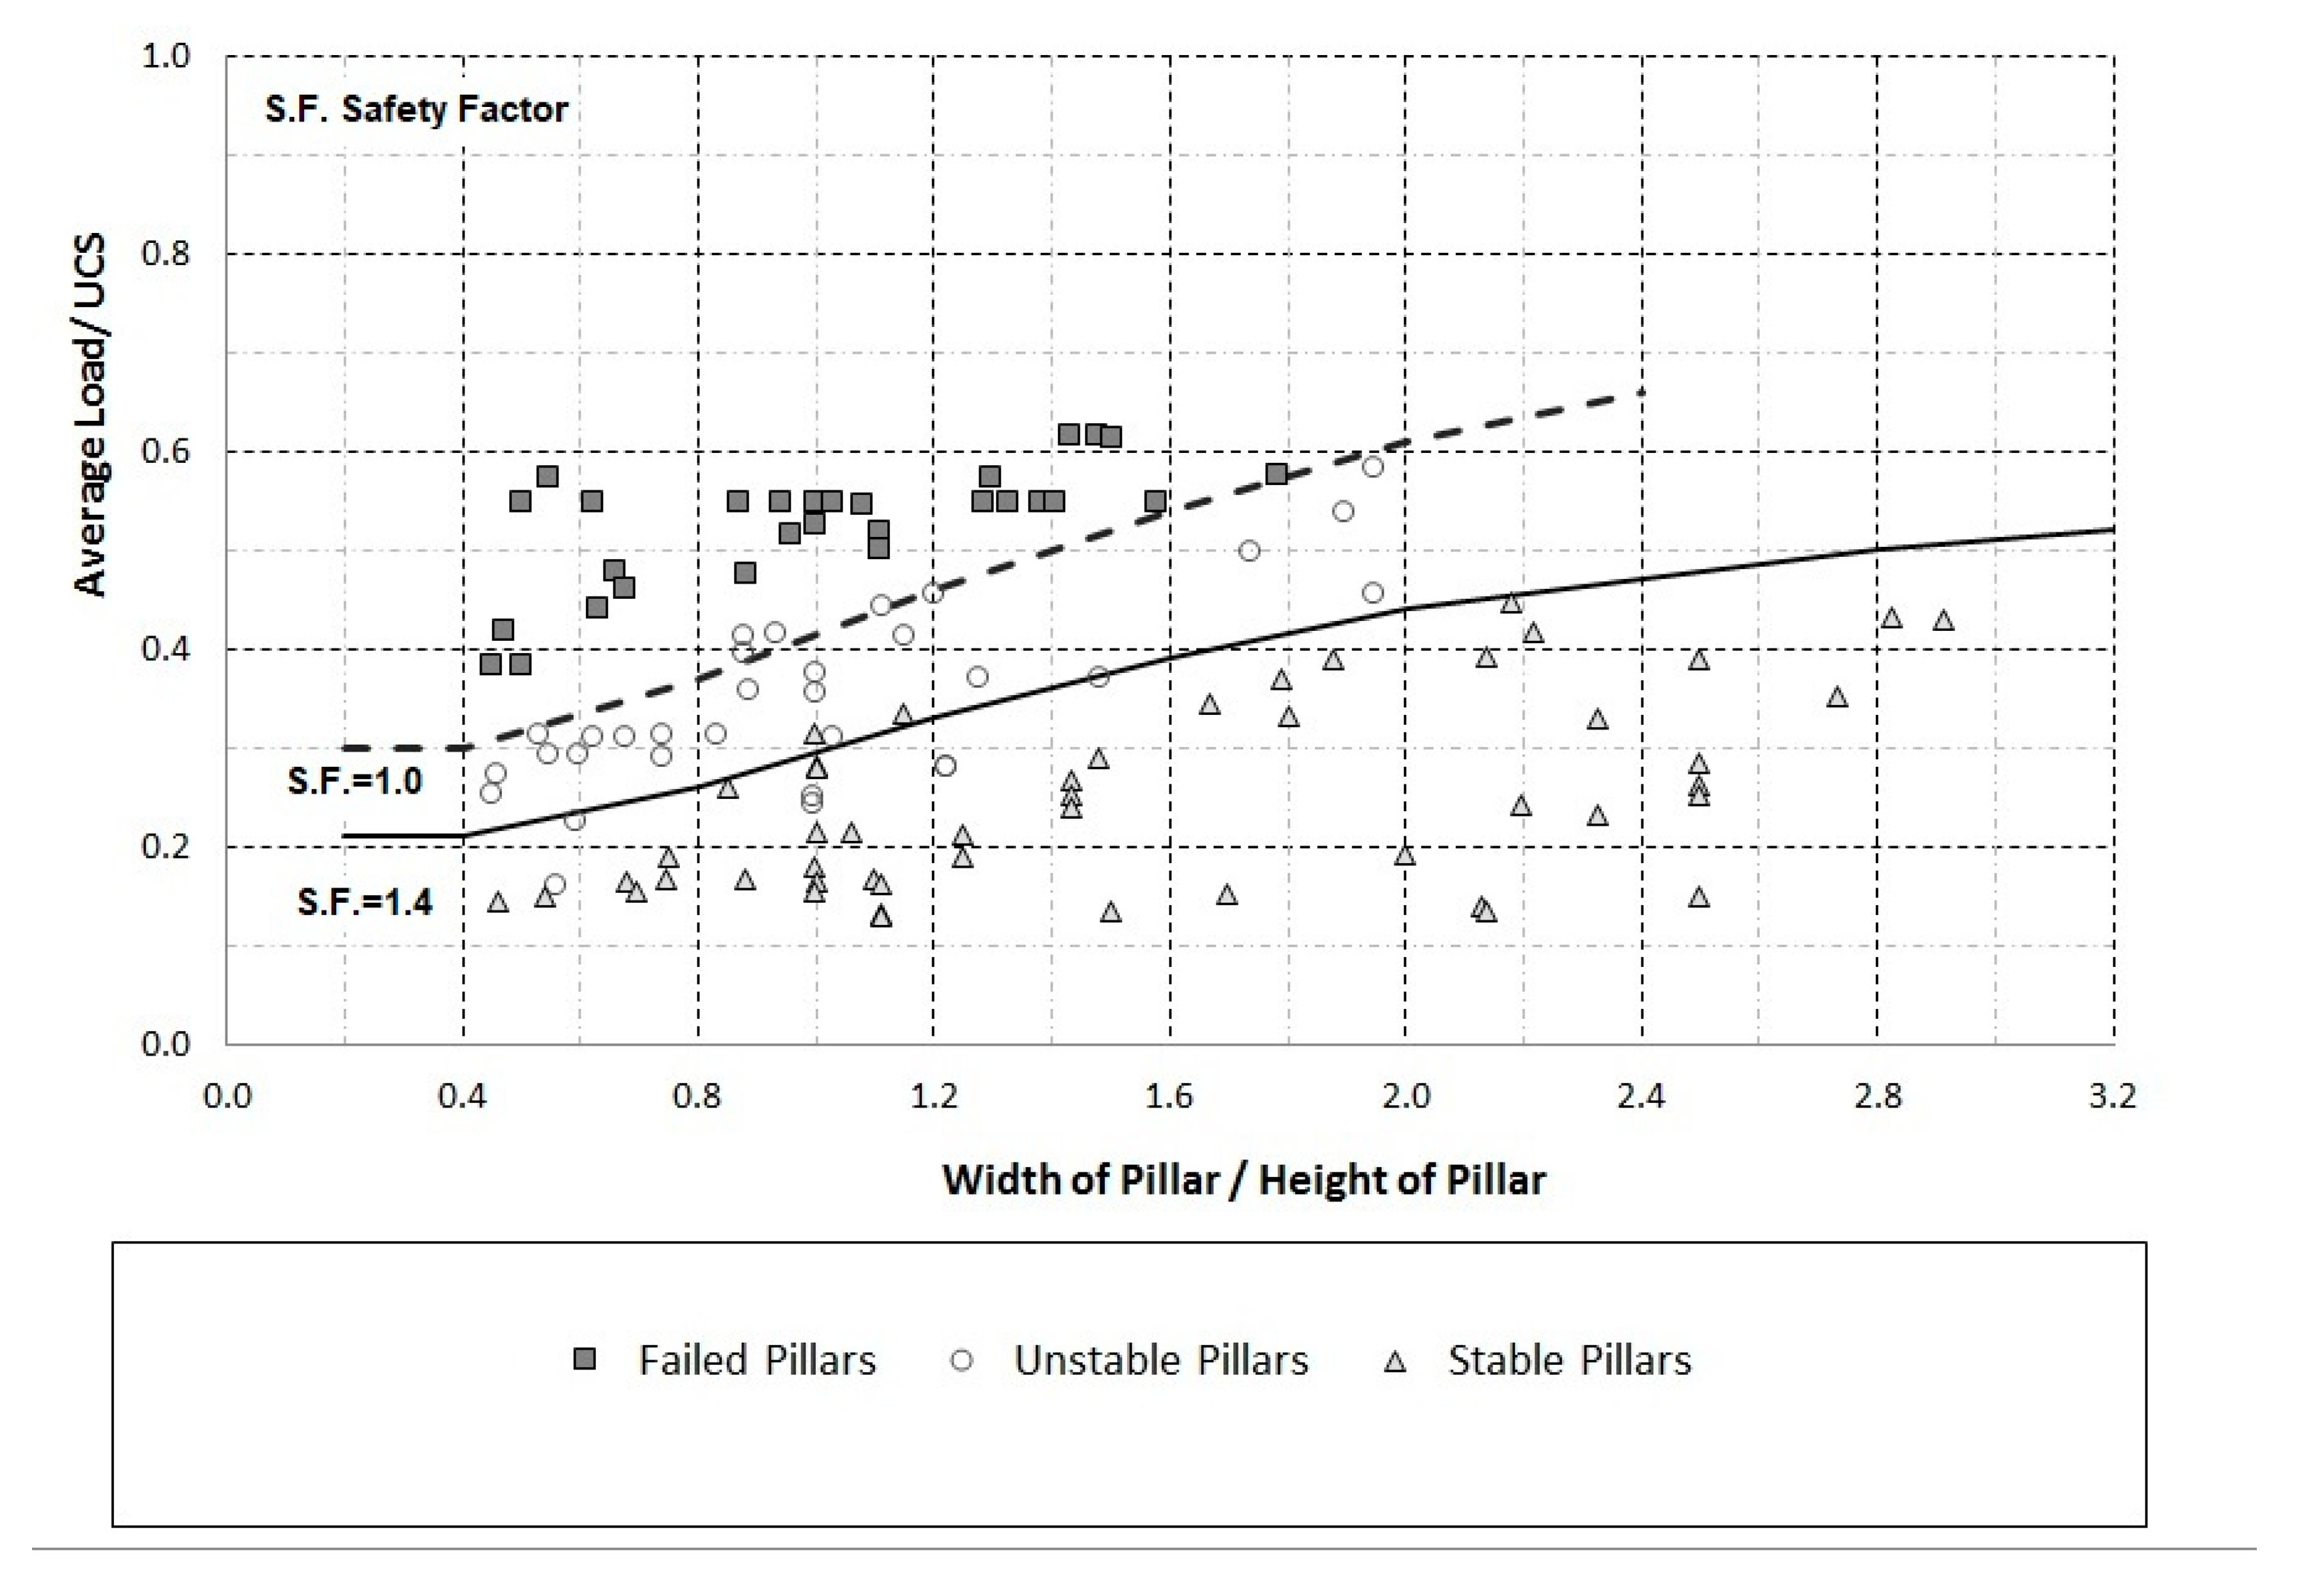
Figure 6 shows the empirical developed database and strength envelopes [14] compiled from published sources and field observations from Canadian hard-rock mines.
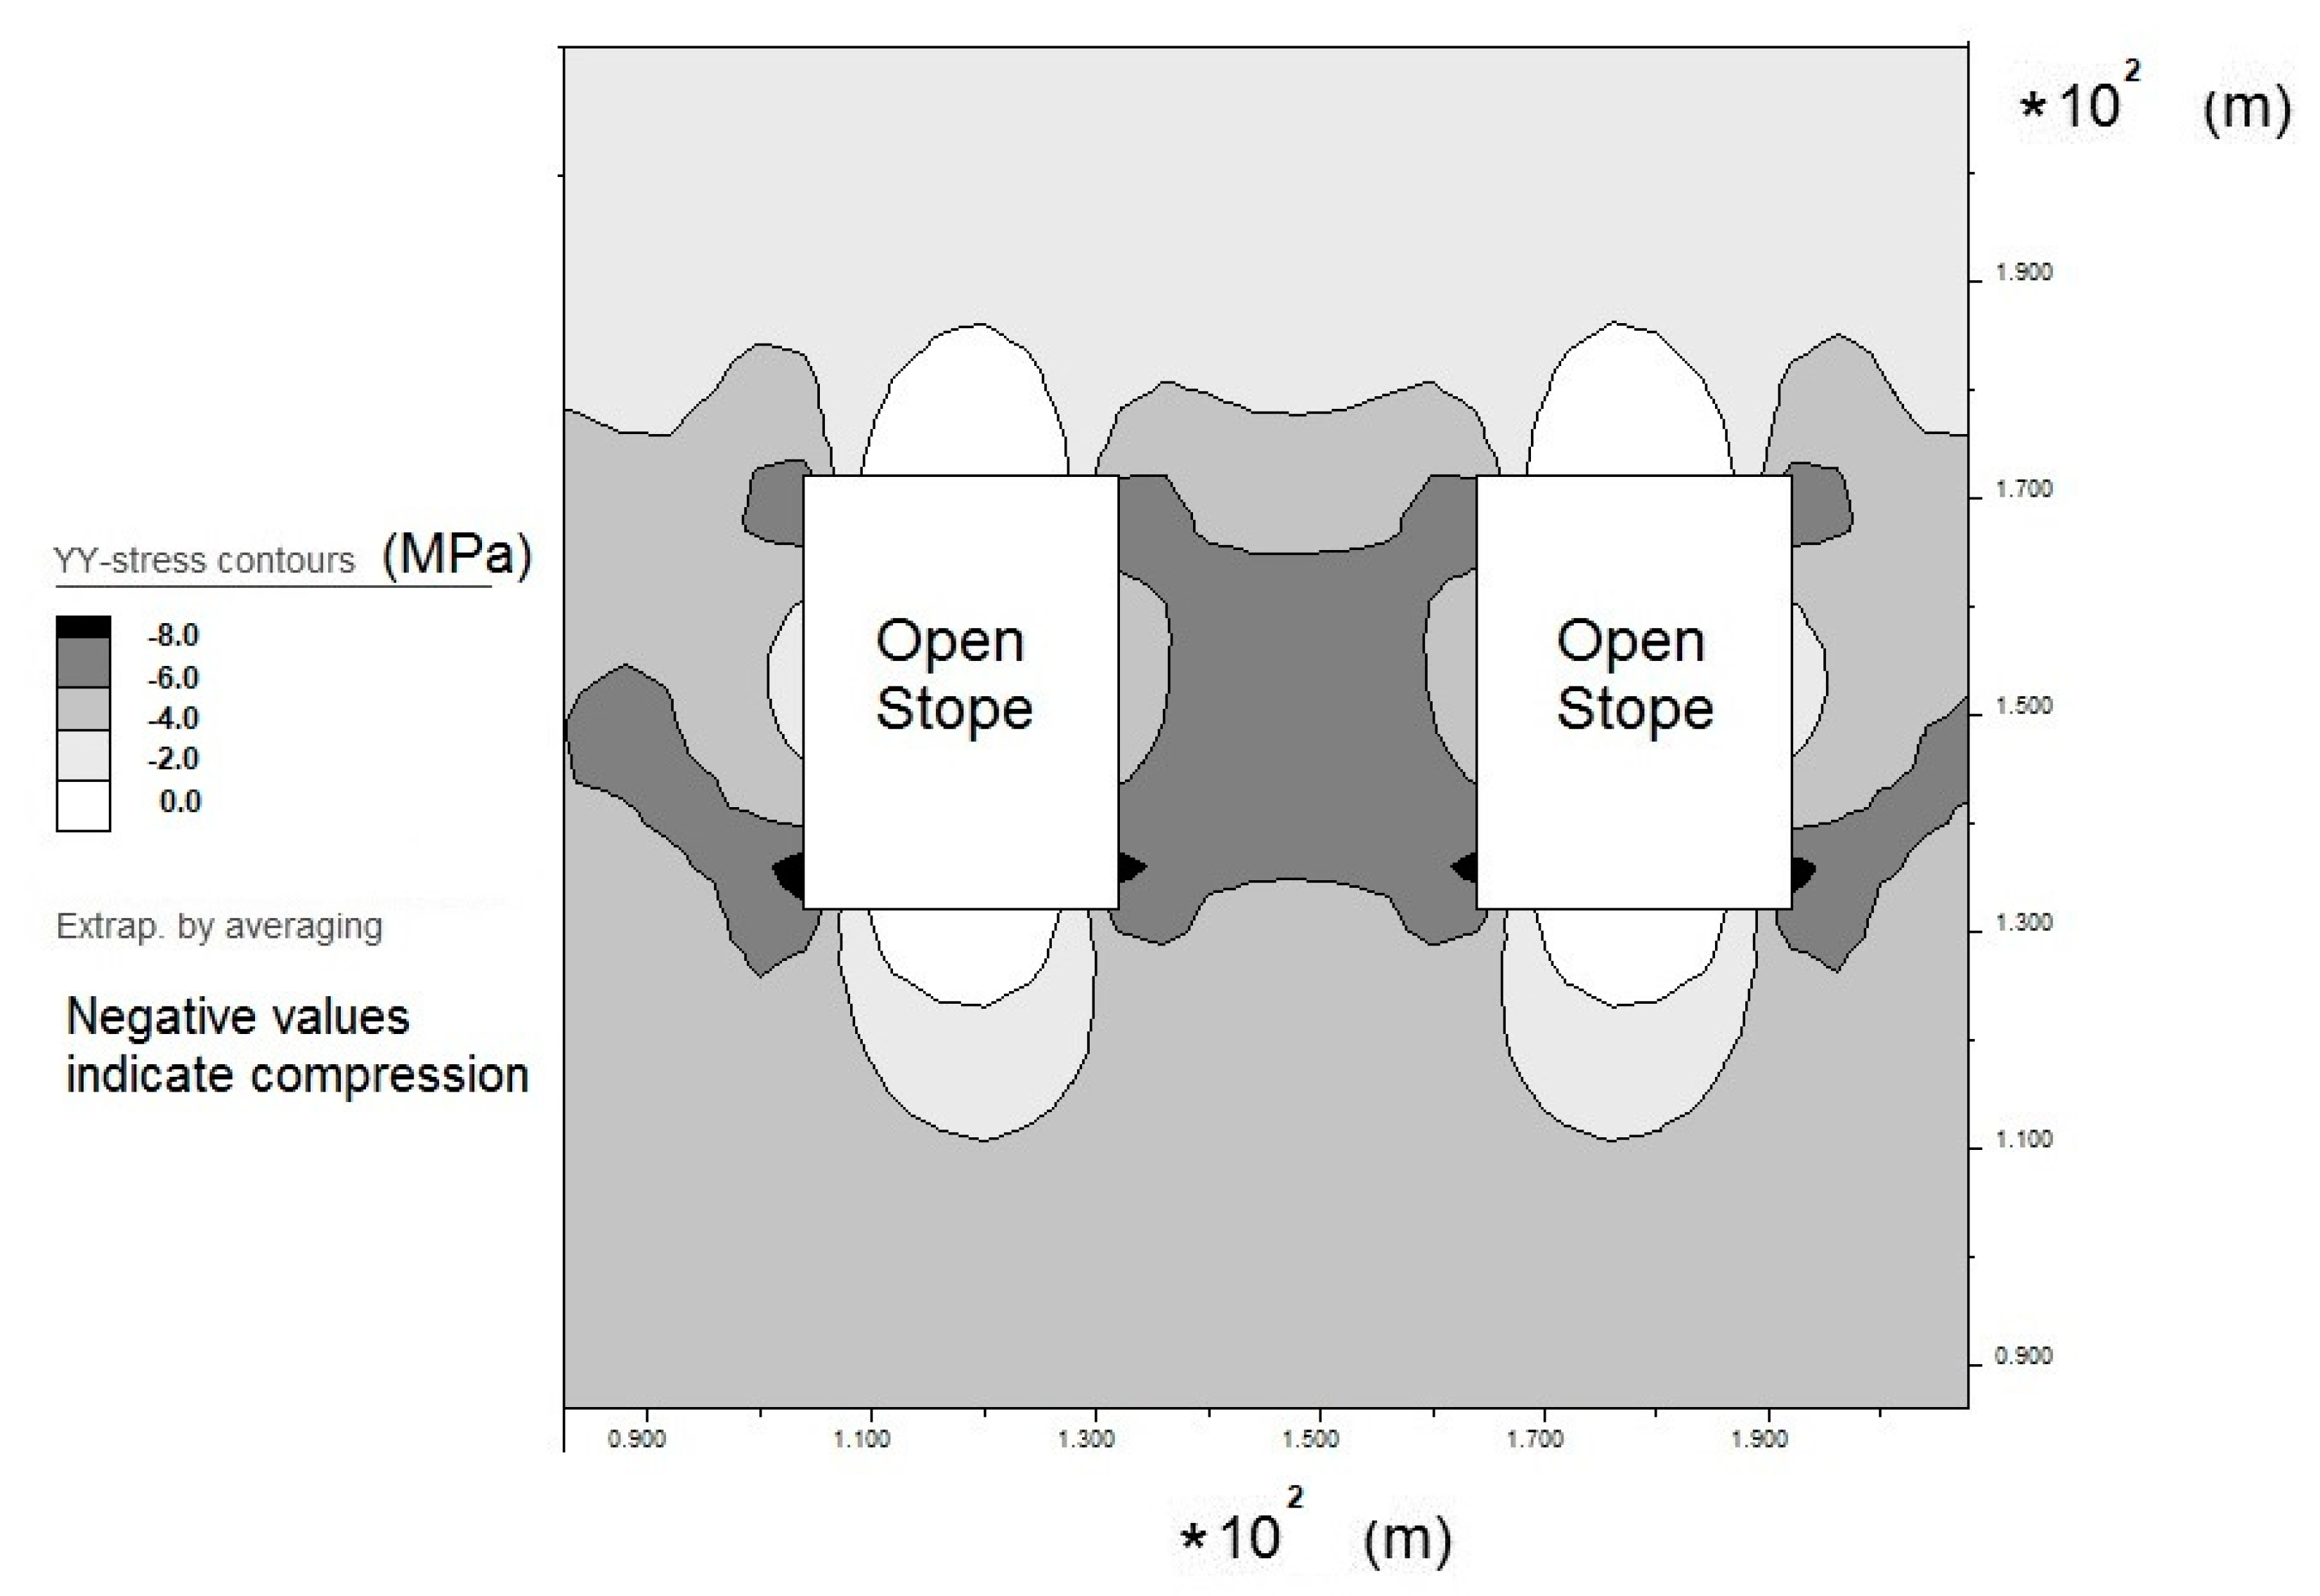
From Figure 6, it can be deduced that the strength of the pillar in function of its UCS increases as the ratio of W/H of the pillar increases. Figure 7 shows the results from FLAC numerical modeling used in this research, with vertical stress changes along a horizontal plane on the pillar are shown; a similar effect can be observed for the horizontal stress. For comparison with Figure 6, the stress applied on a pillar is considered as the average stress on a horizontal plane measured at the middle height of the pillar obtained from numerical modeling. Boundary conditions on the boundary vertical sides of the model are restrained in the x position, on the base of the model, x and y movements are restrained. Vertical stress to simulate depth of the rock mass is added at the top boundary.
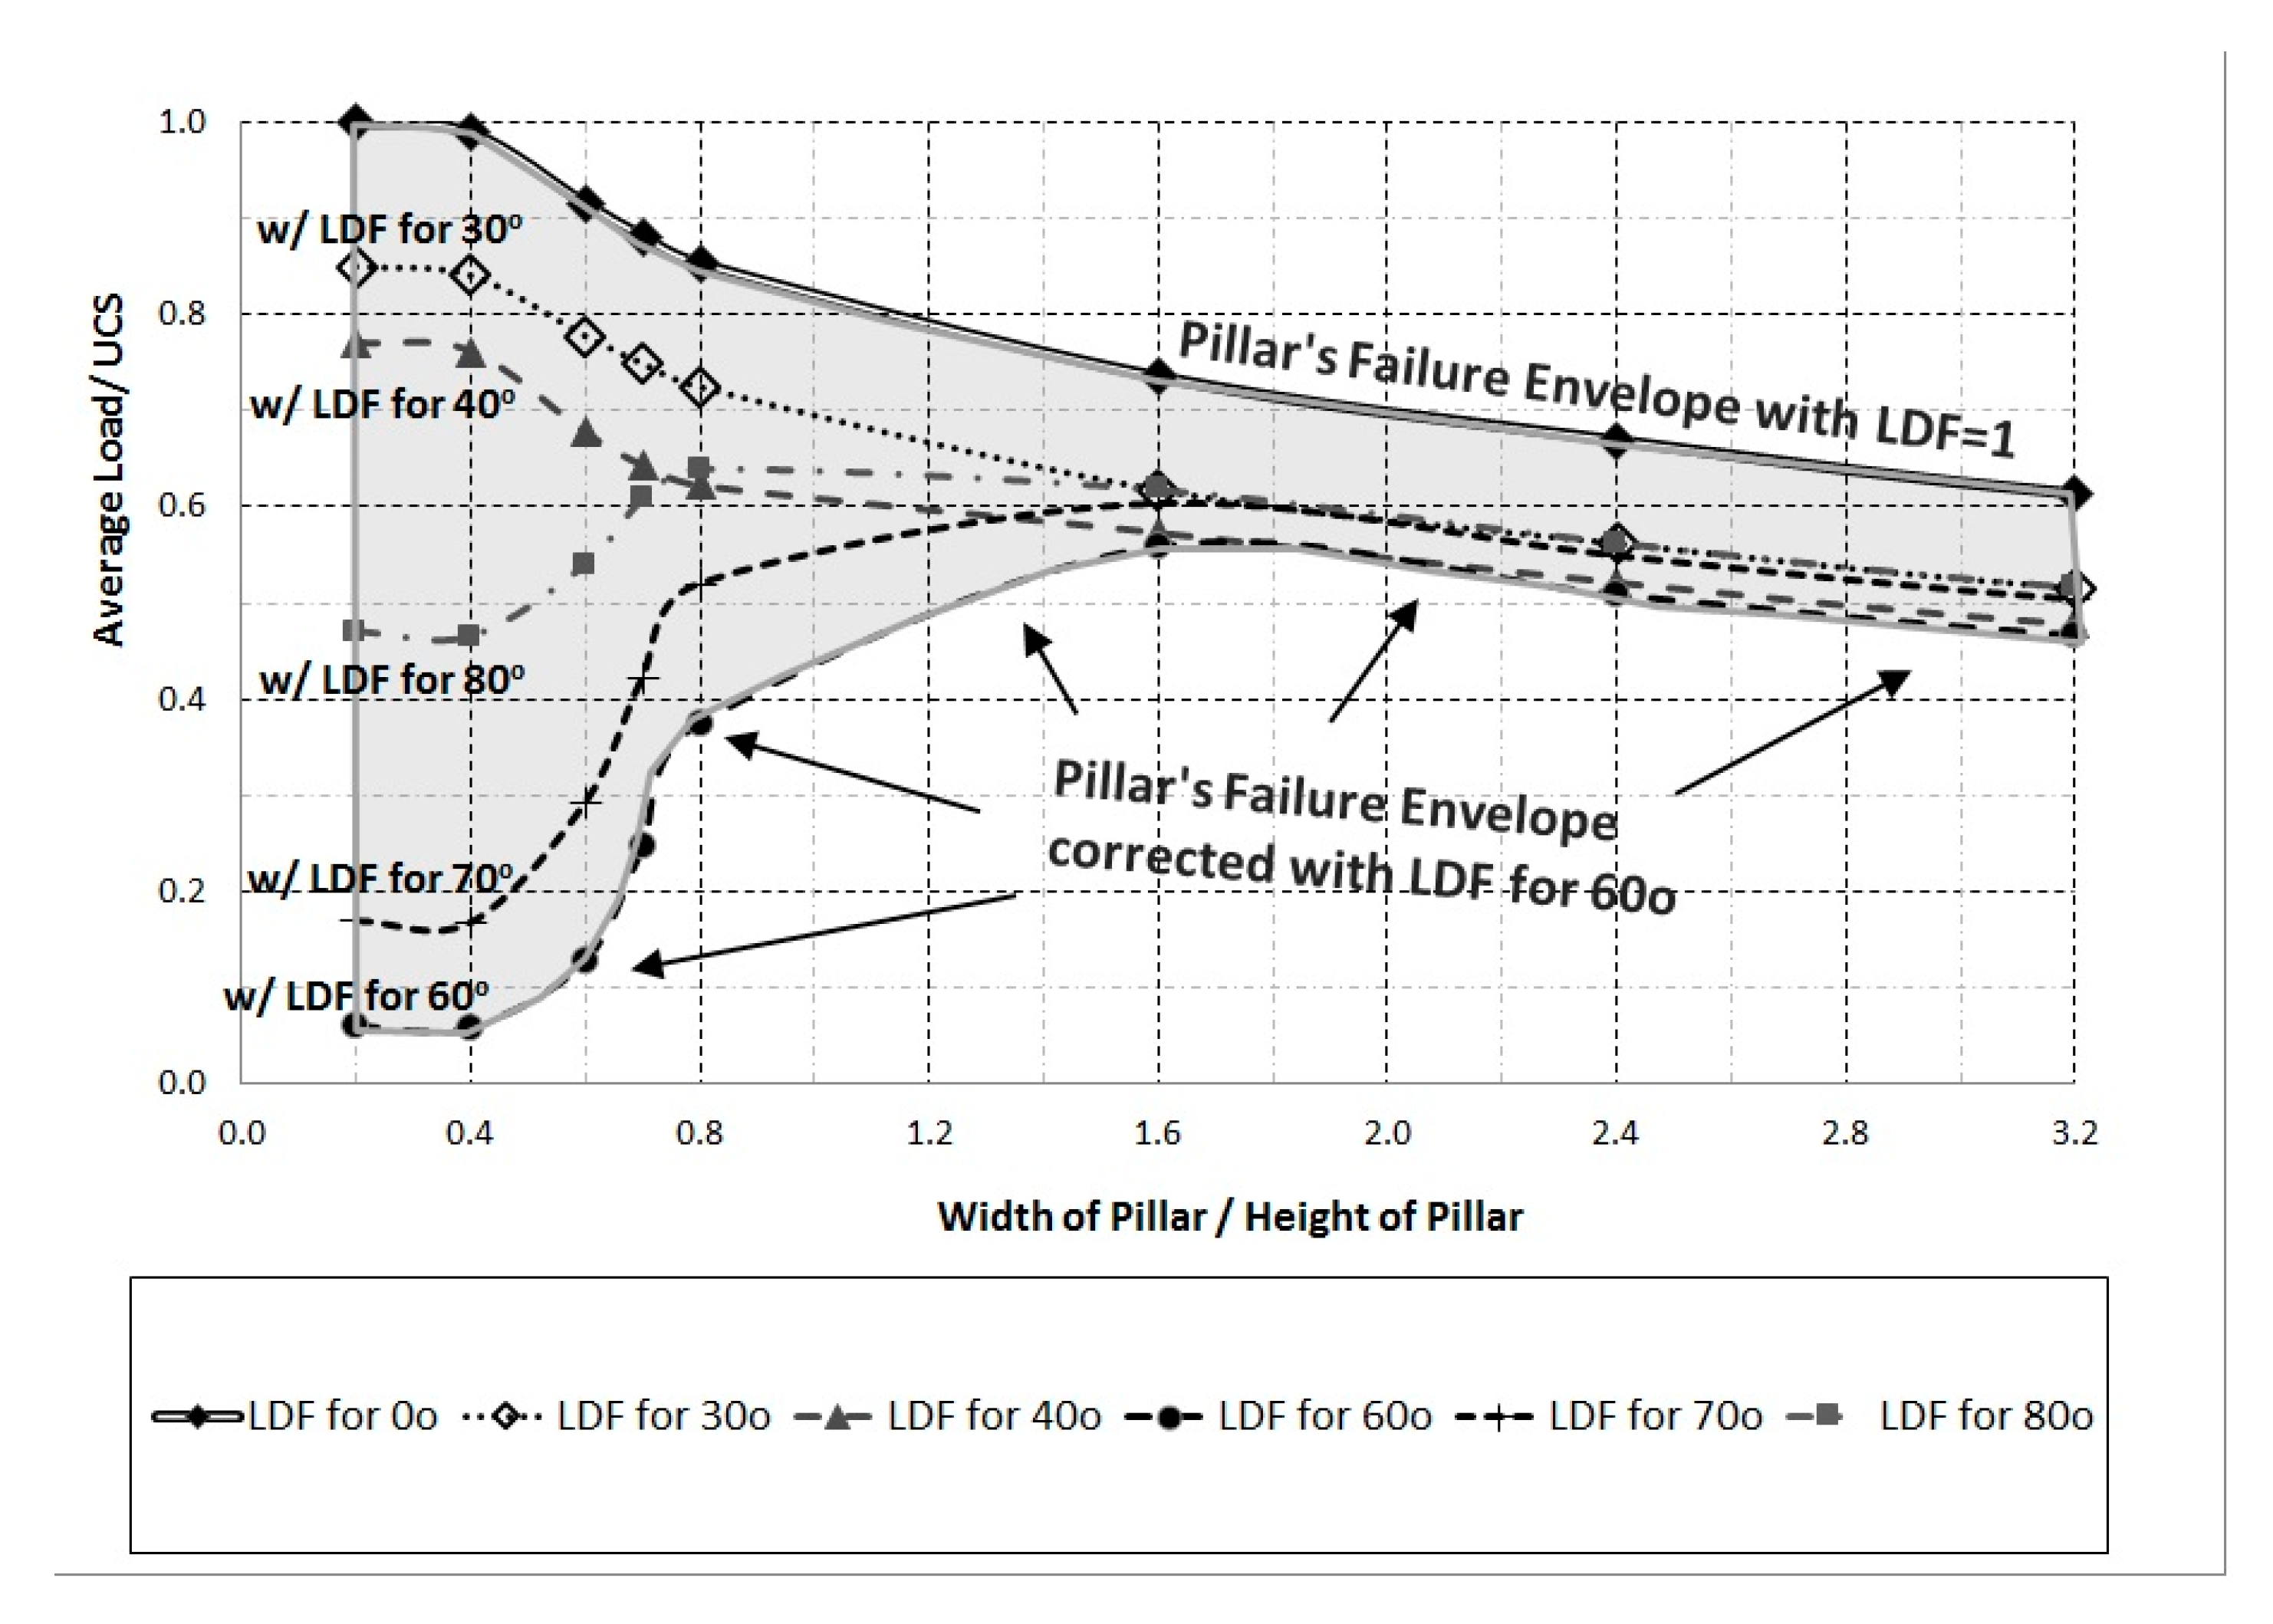
Numerical modeling results, using the previously introduced concept, are compared with the corresponding empirically developed design curves commonly used in practice, which are based on field data of failed and stable rock pillars (Figure 6). The comparison is performed in terms of the required tensile ratio between the stress in the pillar (σp) and the unconfined strength of the rock (UCS). Figure 8 shows failure envelopes, obtained from numerical modeling, of a pillar with constant height of 10 m with no structures present (curve for LDF = 1) and with the presence of geological structures oriented at 30° to 80° with respect to the horizontal. It can be noticed that pillars with geological structures oriented at 60° shows the worst-case scenario in terms of stability. Only when the presence of discontinuities inclined in different directions are considered is it possible to obtain a similar shape of failure envelopes for rock pillars. Therefore, this numerical modeling agrees with the importance of the presence and direction of discontinuities and the values previously defined of the LDF factor, as using the same values proposed from [18], it is possible to generate similar failure envelope curves as shown in Figure 6 from field observations. However, as is shown in [4], even without the presence of angular discontinuities, slender pillars should be less stable, as observed in the field. Therefore, the proposed masonry equivalent FLAC model, even considering discontinuity effects, is missing an important aspect that has not been considered in rock pillar mechanics. In structural engineering, slender columns are known to show buckling effects and failure. Buckling can be avoided (theoretically) when the loads are applied absolutely axially to the column, the column material is totally homogeneous with no imperfection, and the construction is symmetrical. All these factors are fulfilled in our present numerical modeling; however, in practice, these are not fulfilled, and thus, buckling effects are expected. This effect was first studied by Euler in the 18th century, who proposed the existence of a critical load that depends on the geometry of the column. For a column with fixed ends, the critical load for which buckling effects start to show is [23]:
Considering that there is a relationship between the elastic modulus and the UCS, a critical stress for buckling can be obtained that could explain low values of failure stress for slender rock pillars, given by:
where C is a constant that would depend on the rock type. Therefore, additionally to discontinuity effects, the buckling effect is also believed to play an important role in the stability of pillars with low values of Wp/Hp.
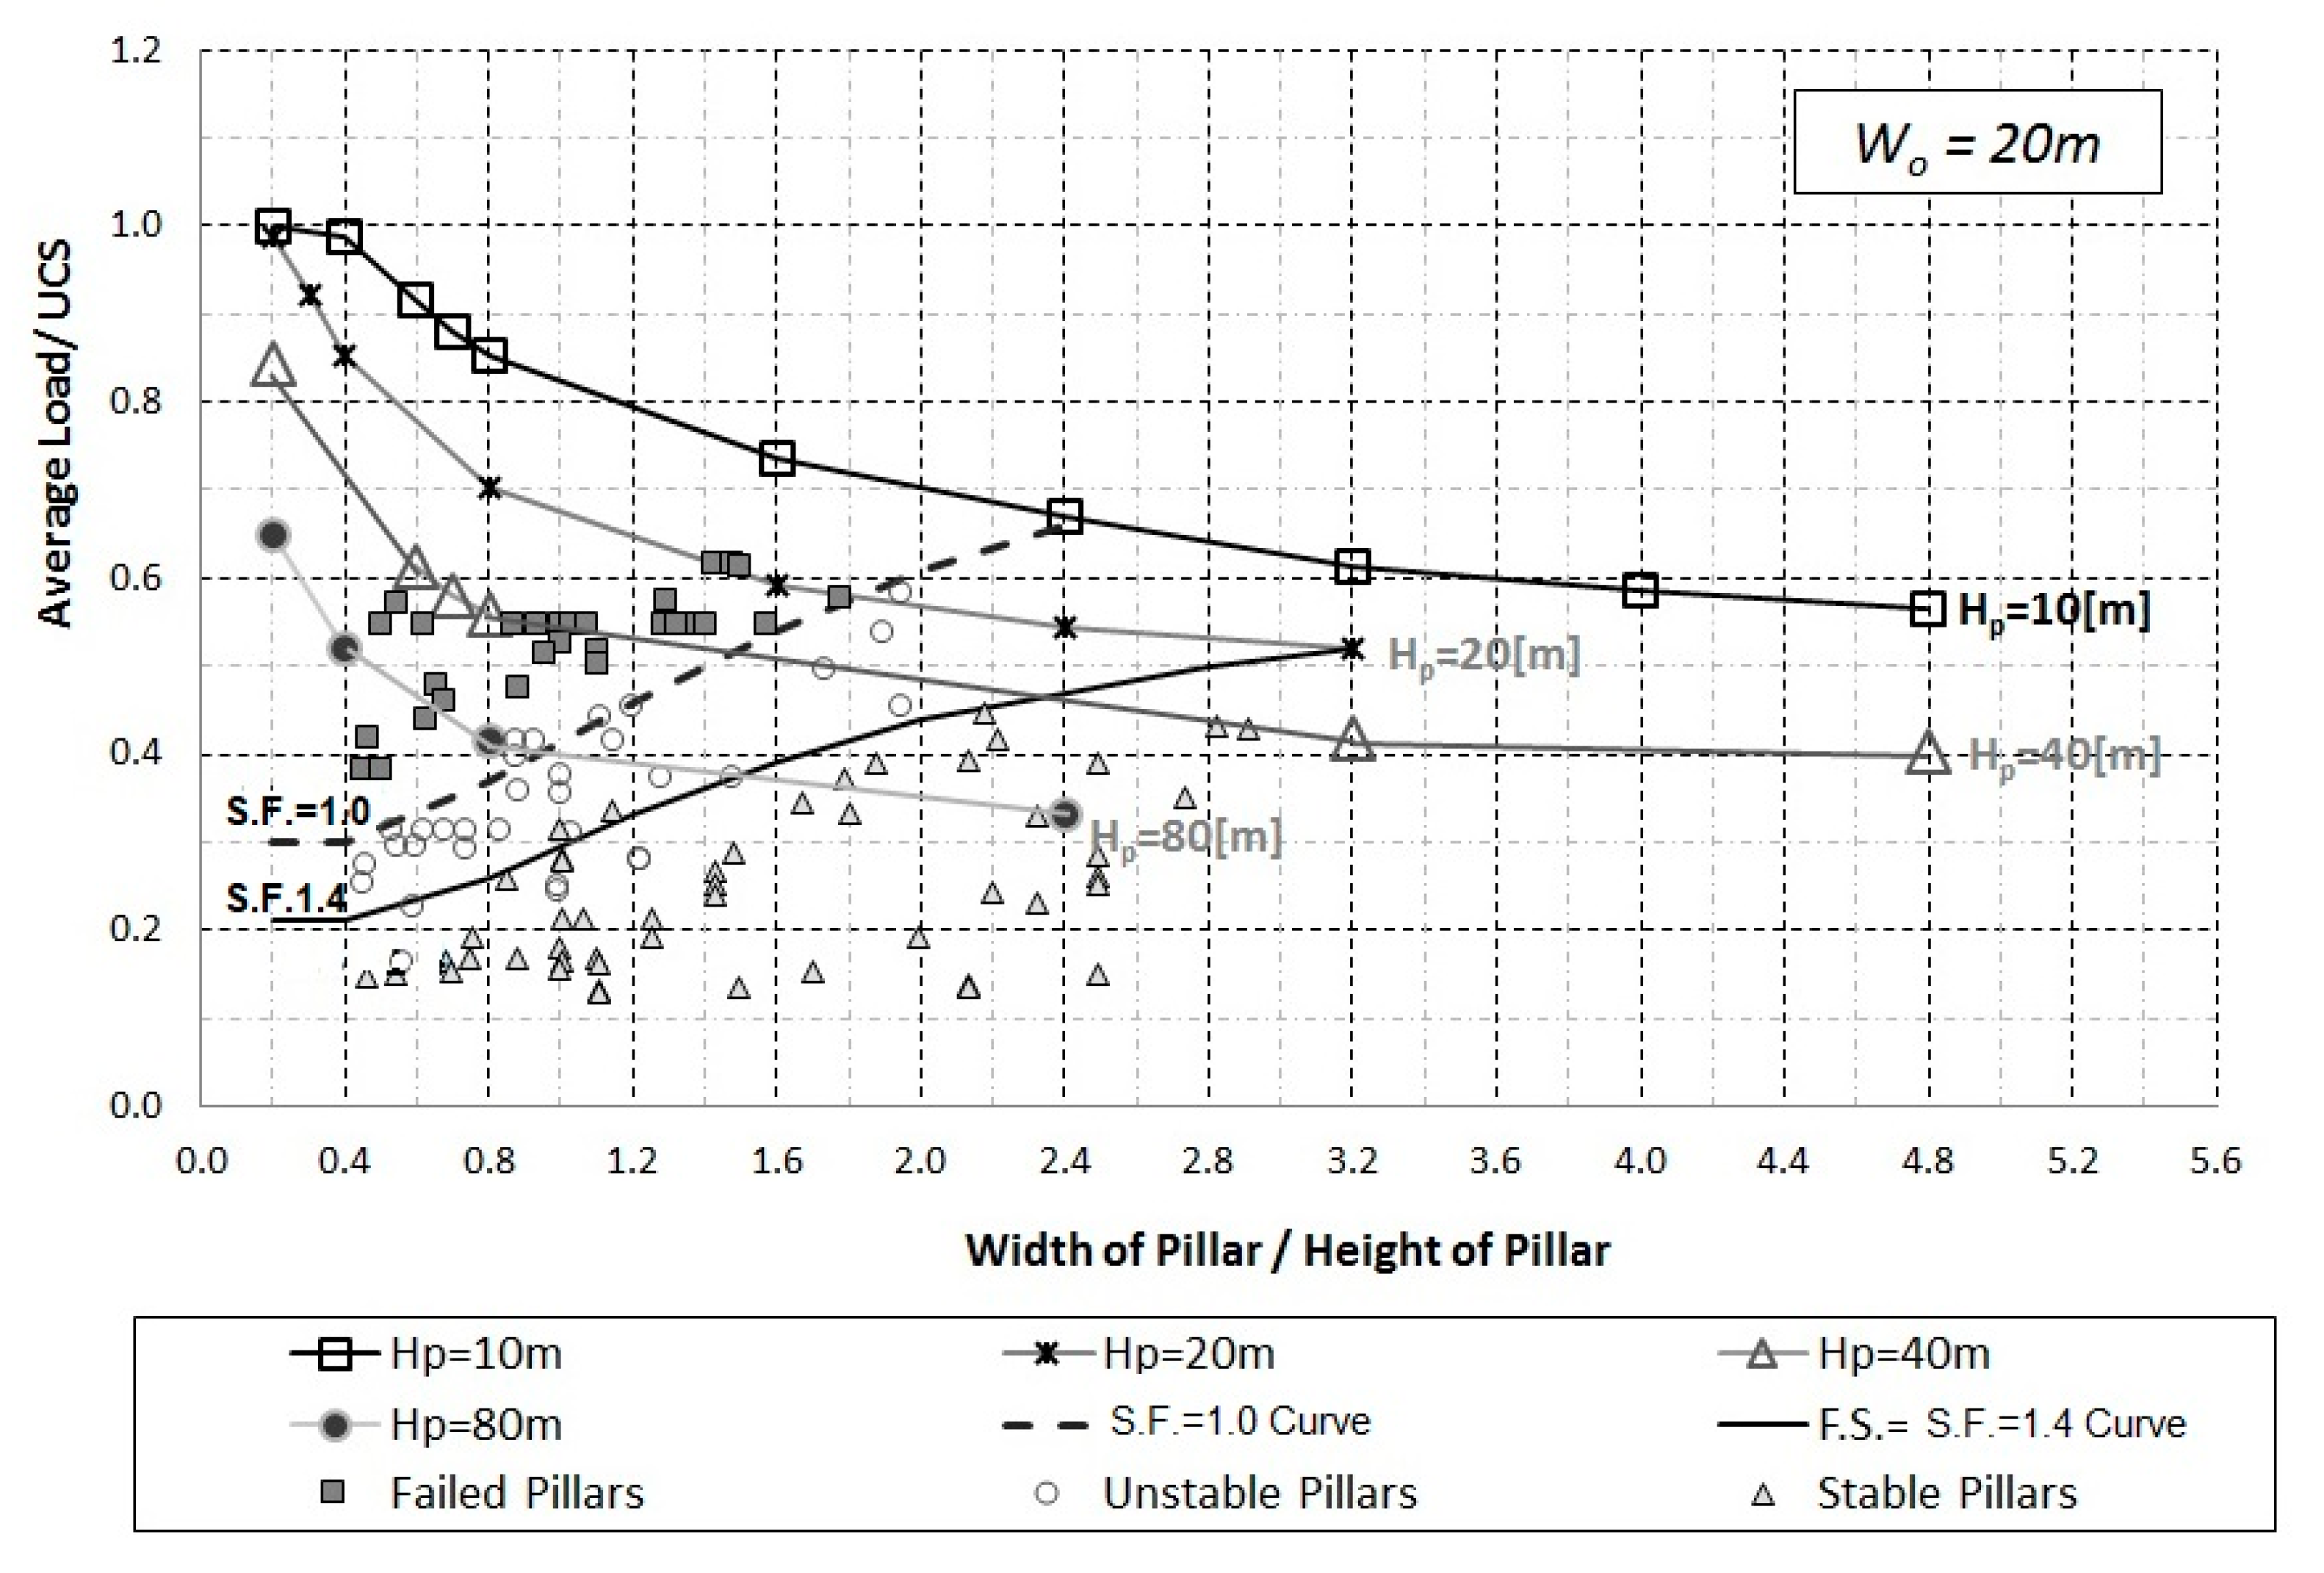
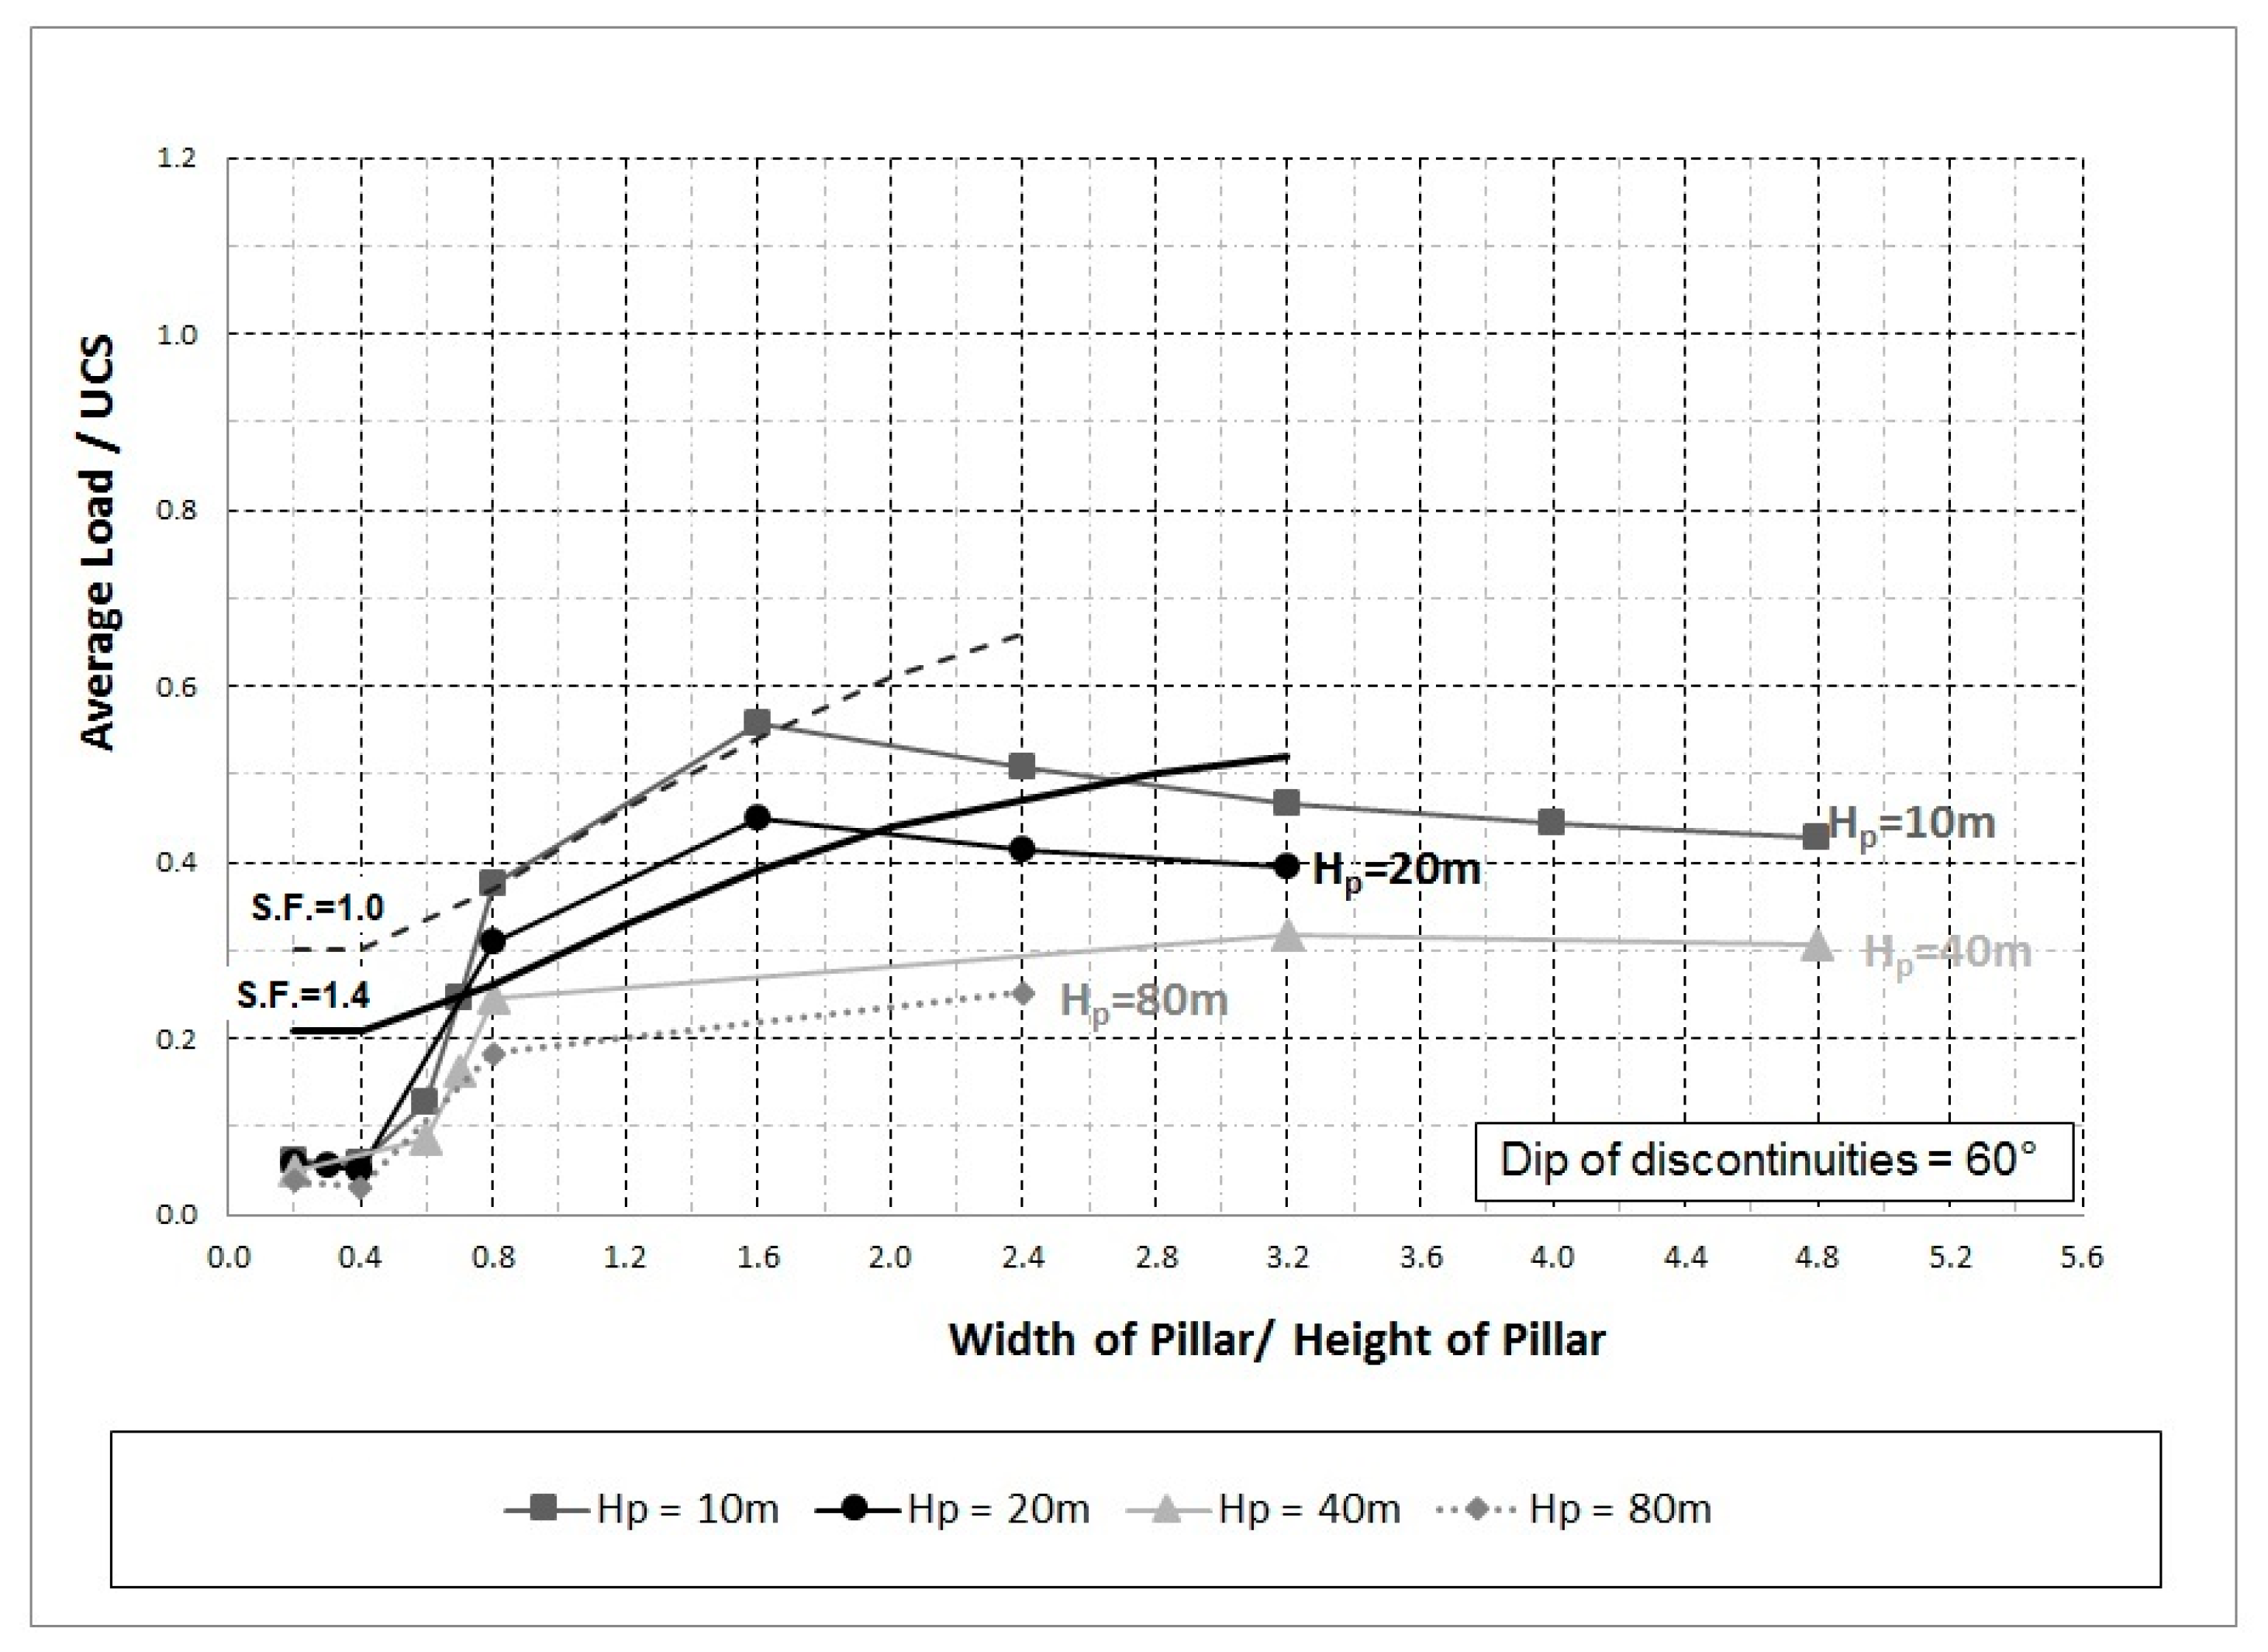
Figure 9 shows the numerical modeling stability curves for different pillar heights and constant width of opening of 20 m. These modeling results do not contemplate the effect of the dip of discontinuities. Additionally, the empirical failure envelopes, obtained from [14], with safety factors of 1.0 and 1.4, are also shown in this figure. These empirical curves were obtained from field observations of hard-rock pillars with widths ranging from 1.9 to 45 m and heights from 2.4 to 53 m.
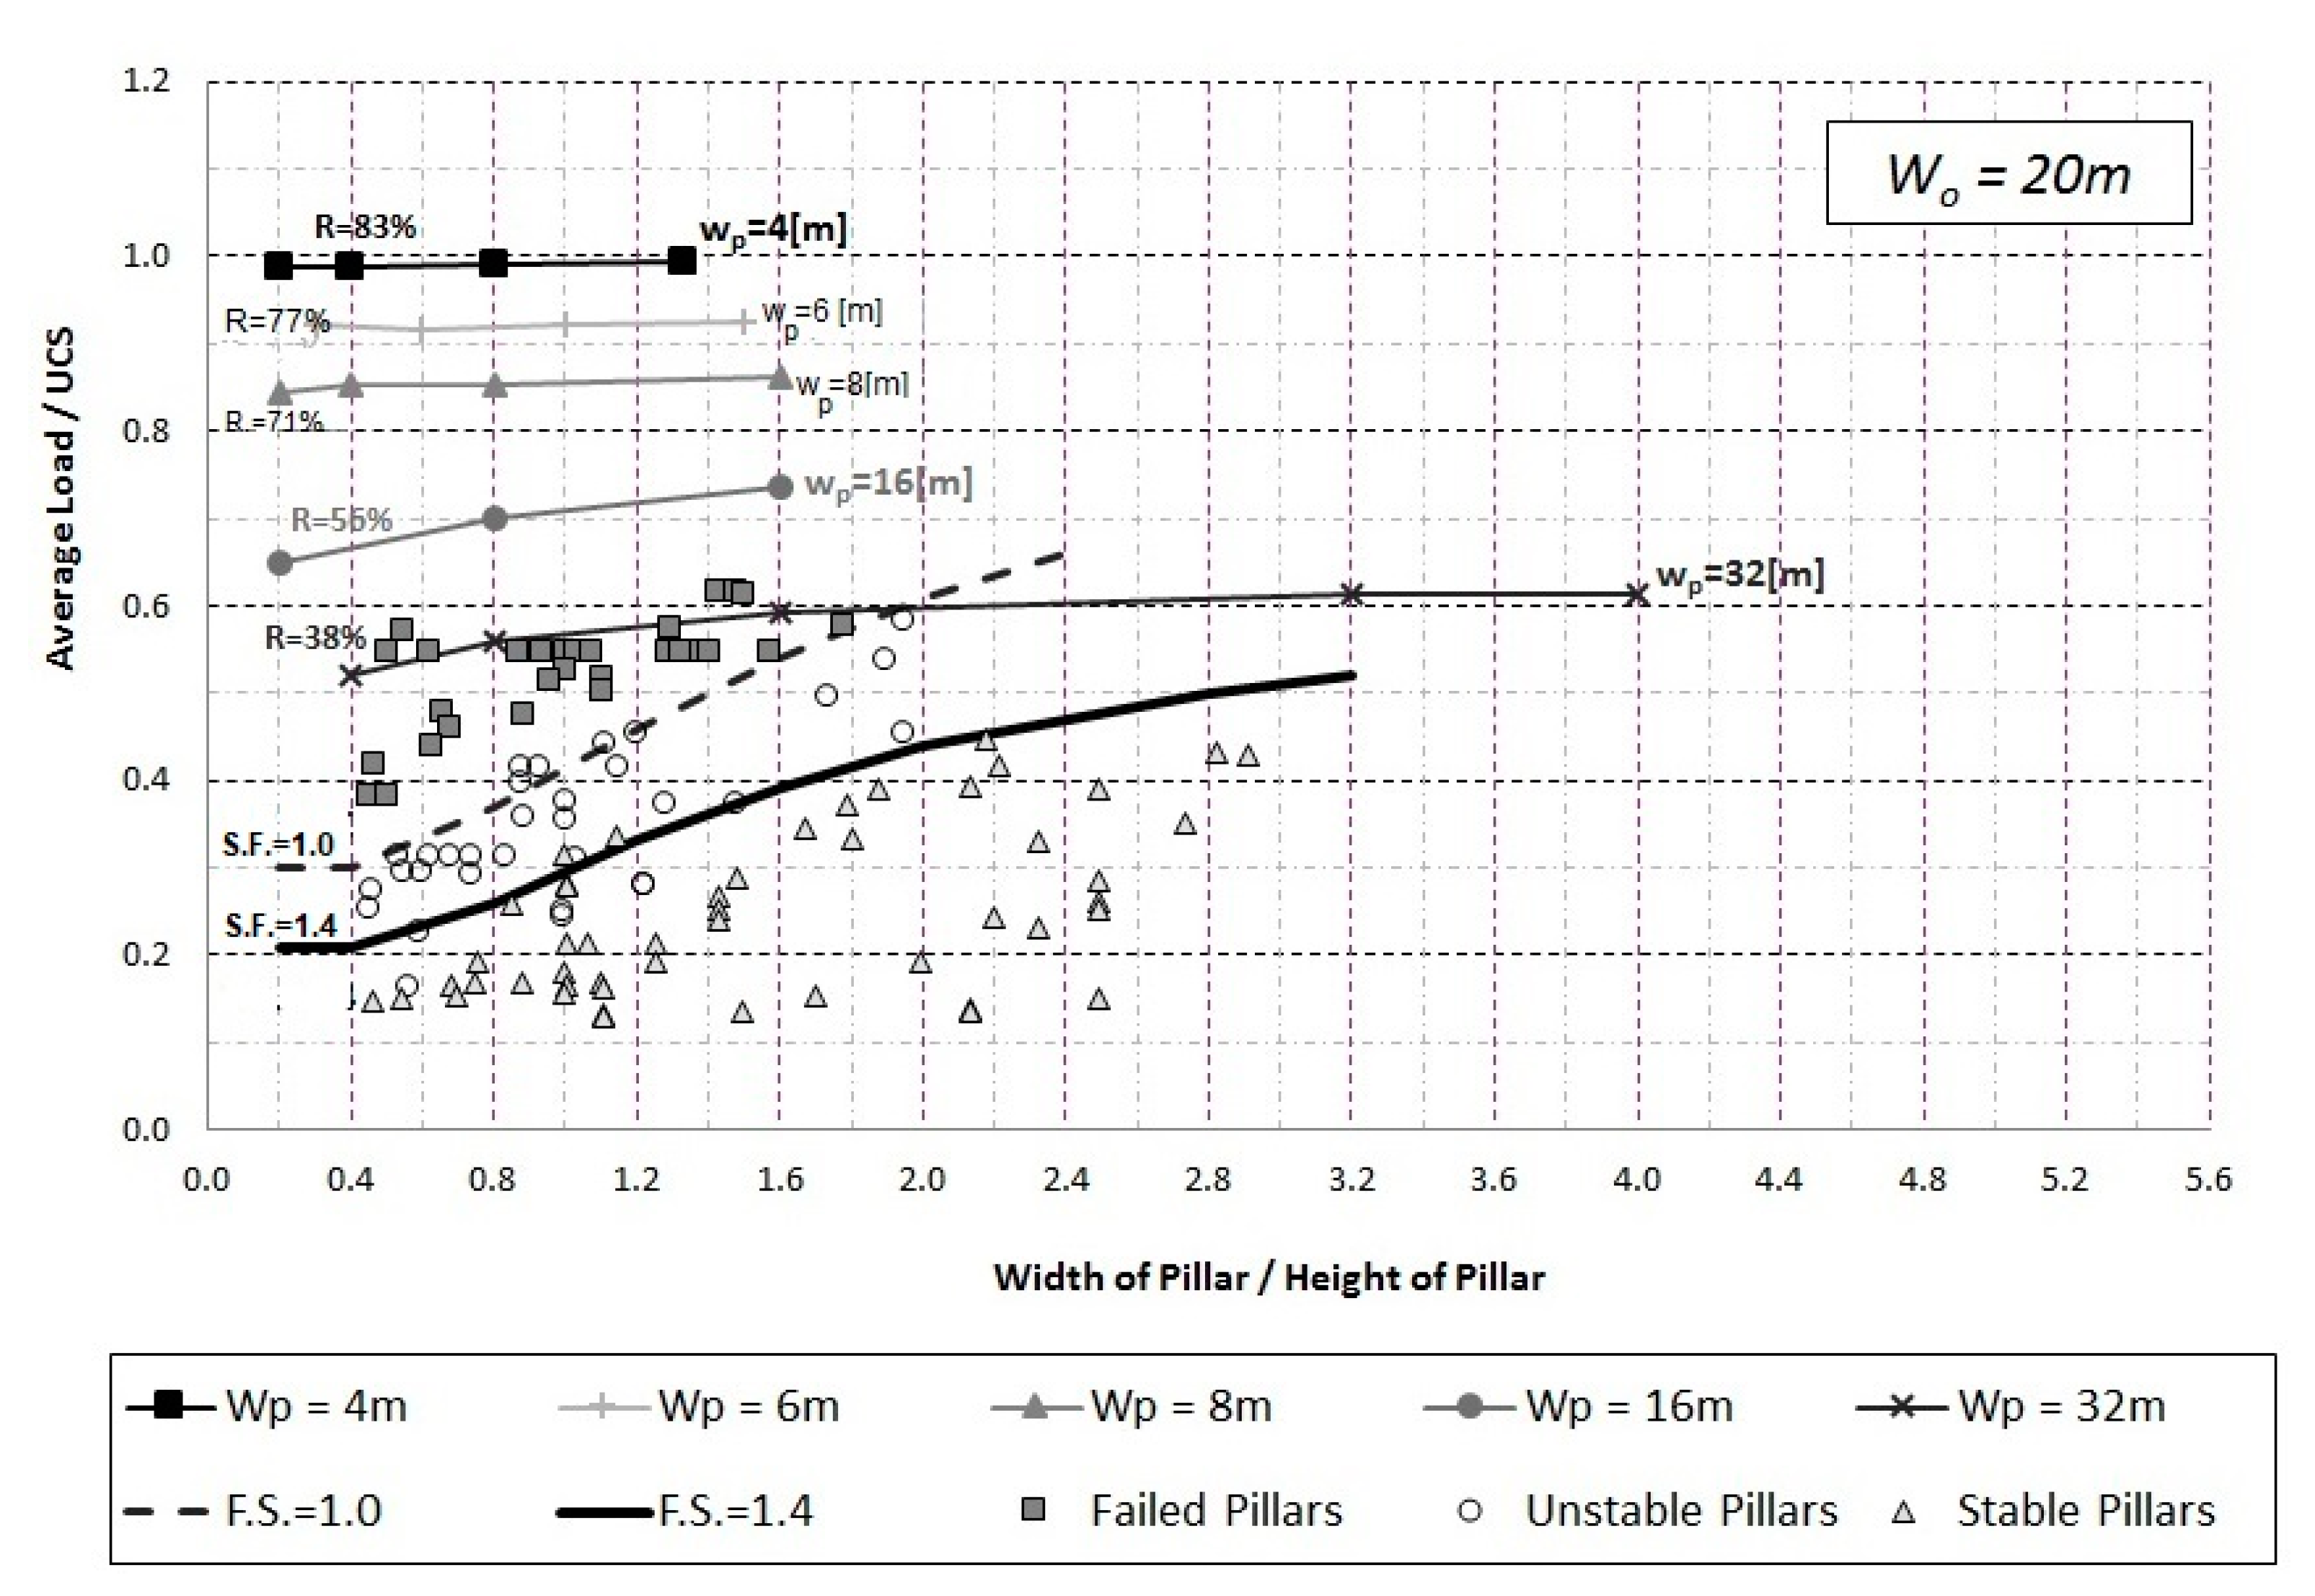
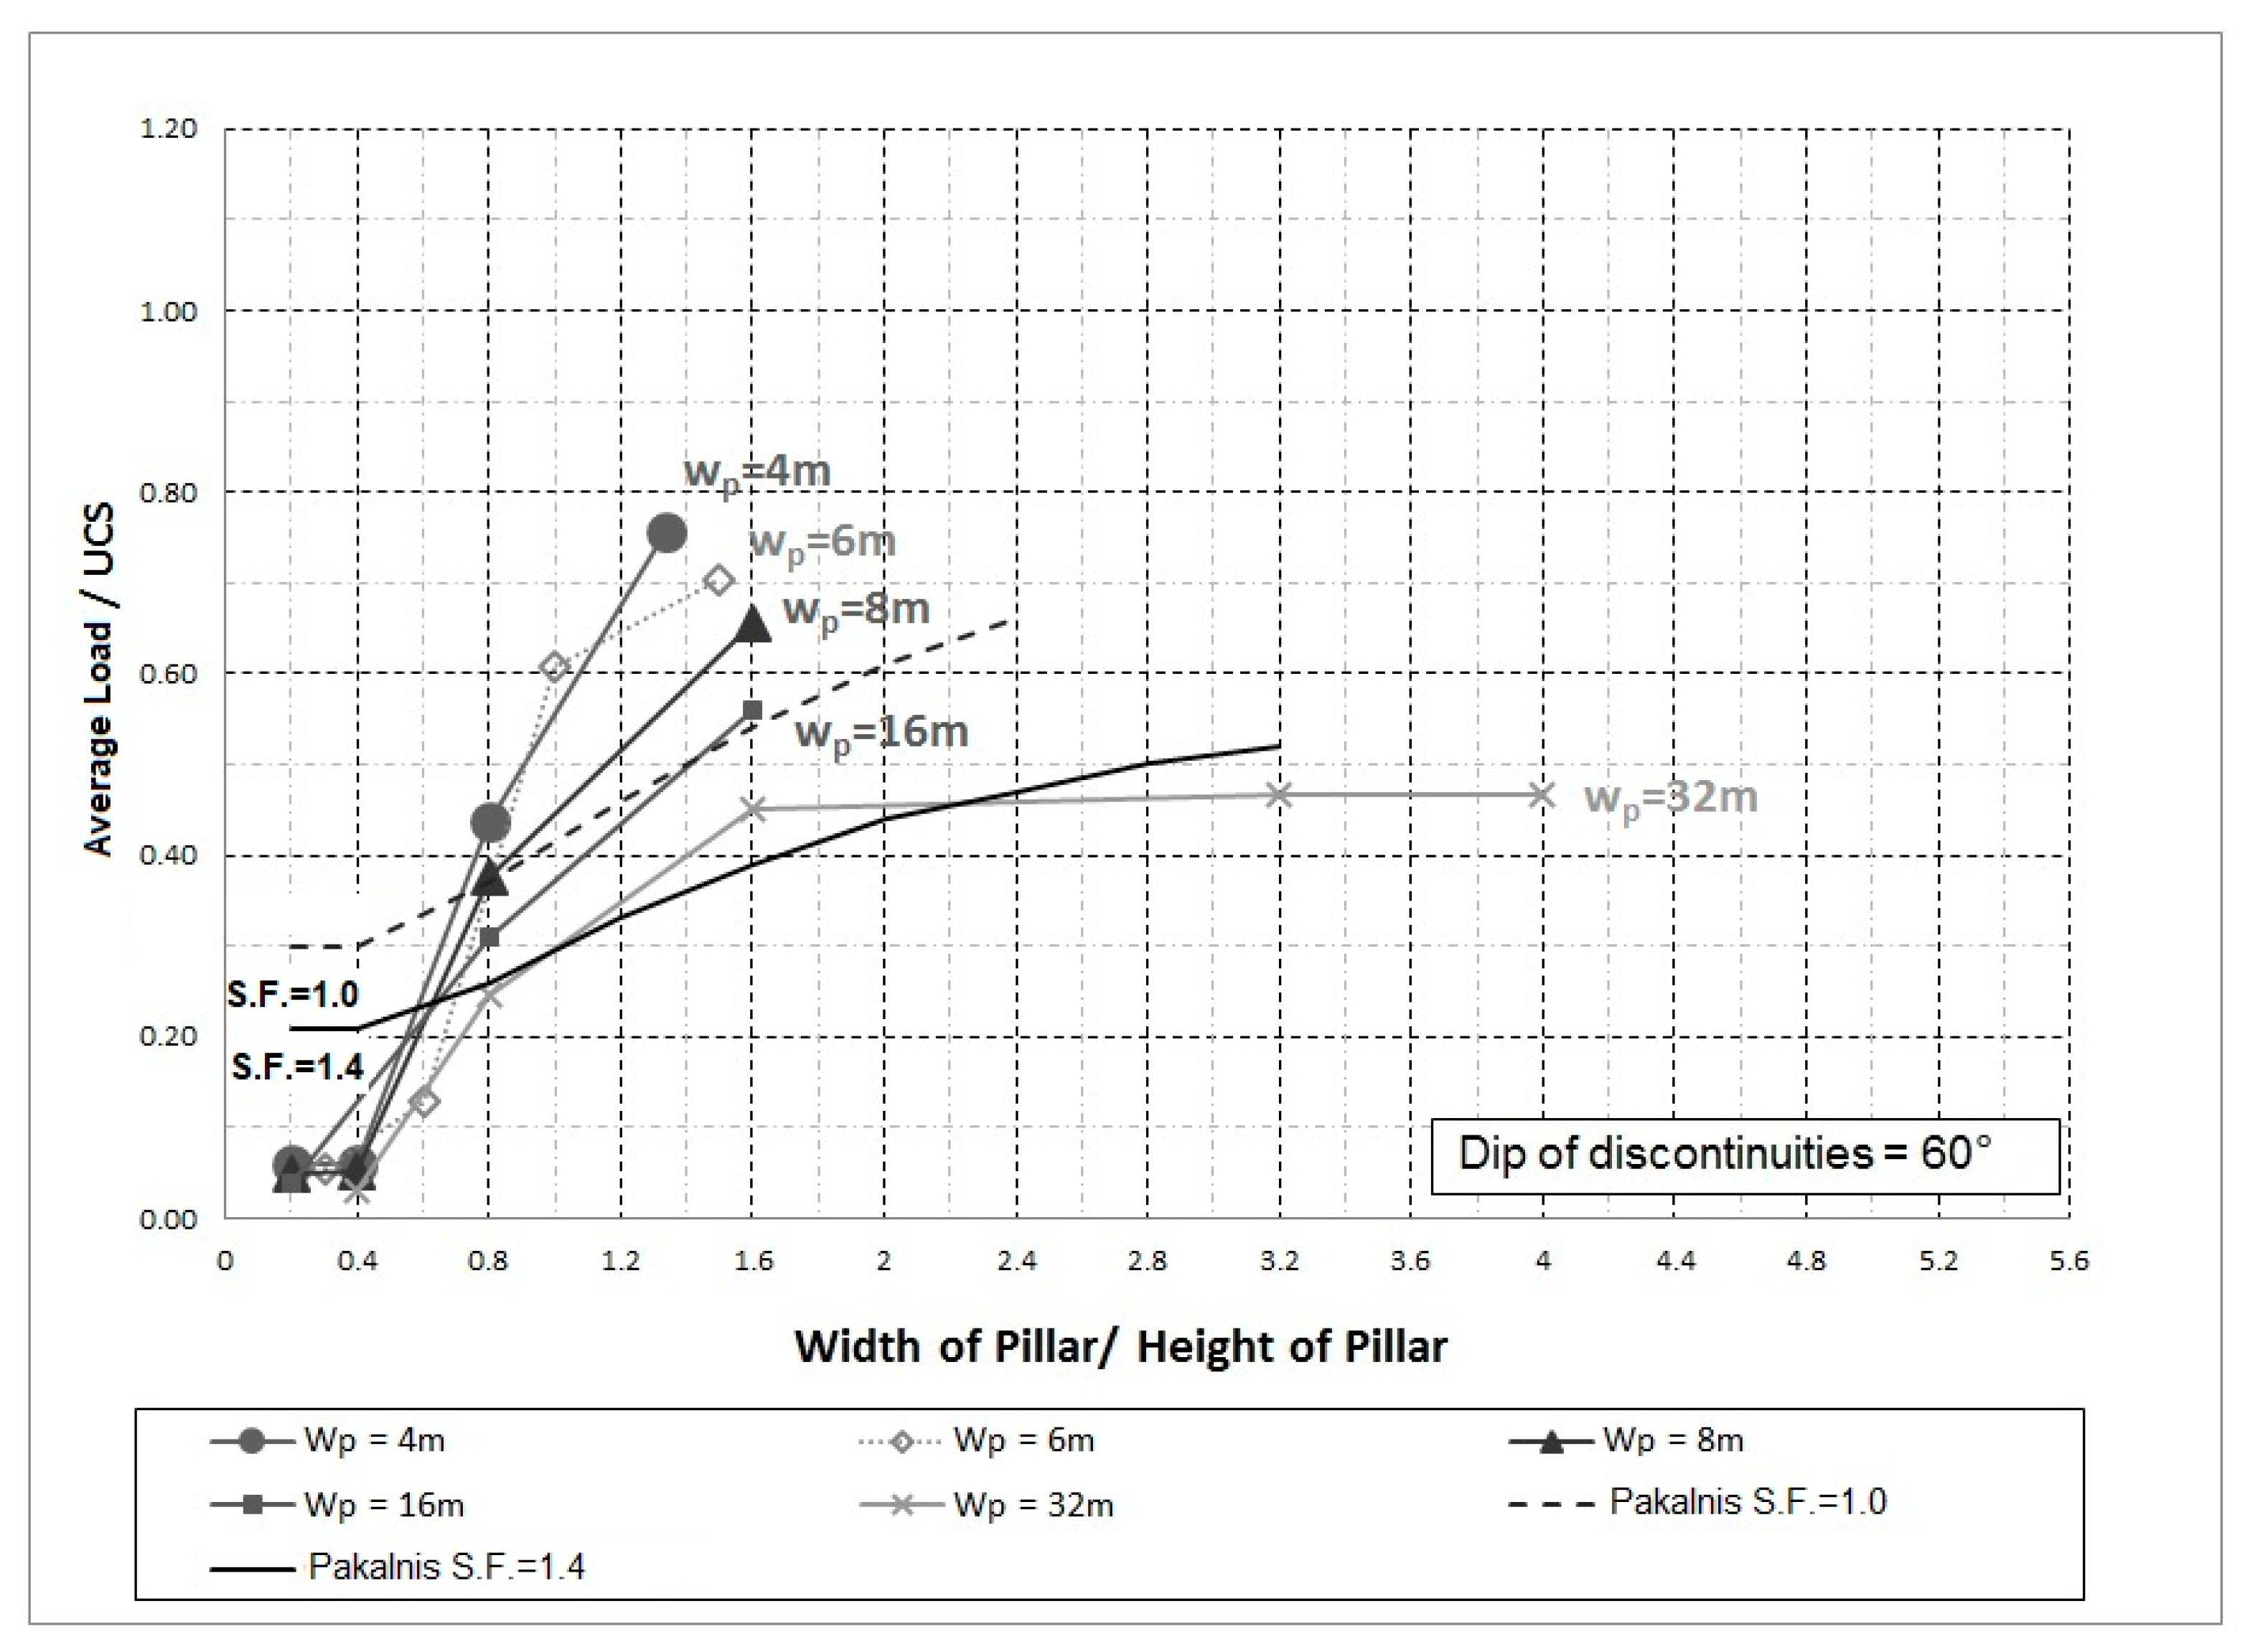
Similarly, Figure 10 shows the same ratio as in the previous figure, but in this case, the width of the pillar is maintained constant. In both figures, the width of the opening (excavation) is maintained constant at 20 m.
In both cases (constant Hp or Wp), the numerical modeling results are higher than the empirical values for Wp/Hp ratios less than 1.0, which is due to the fundamental role that the dip of discontinuities plays in the stability results and buckling effects.
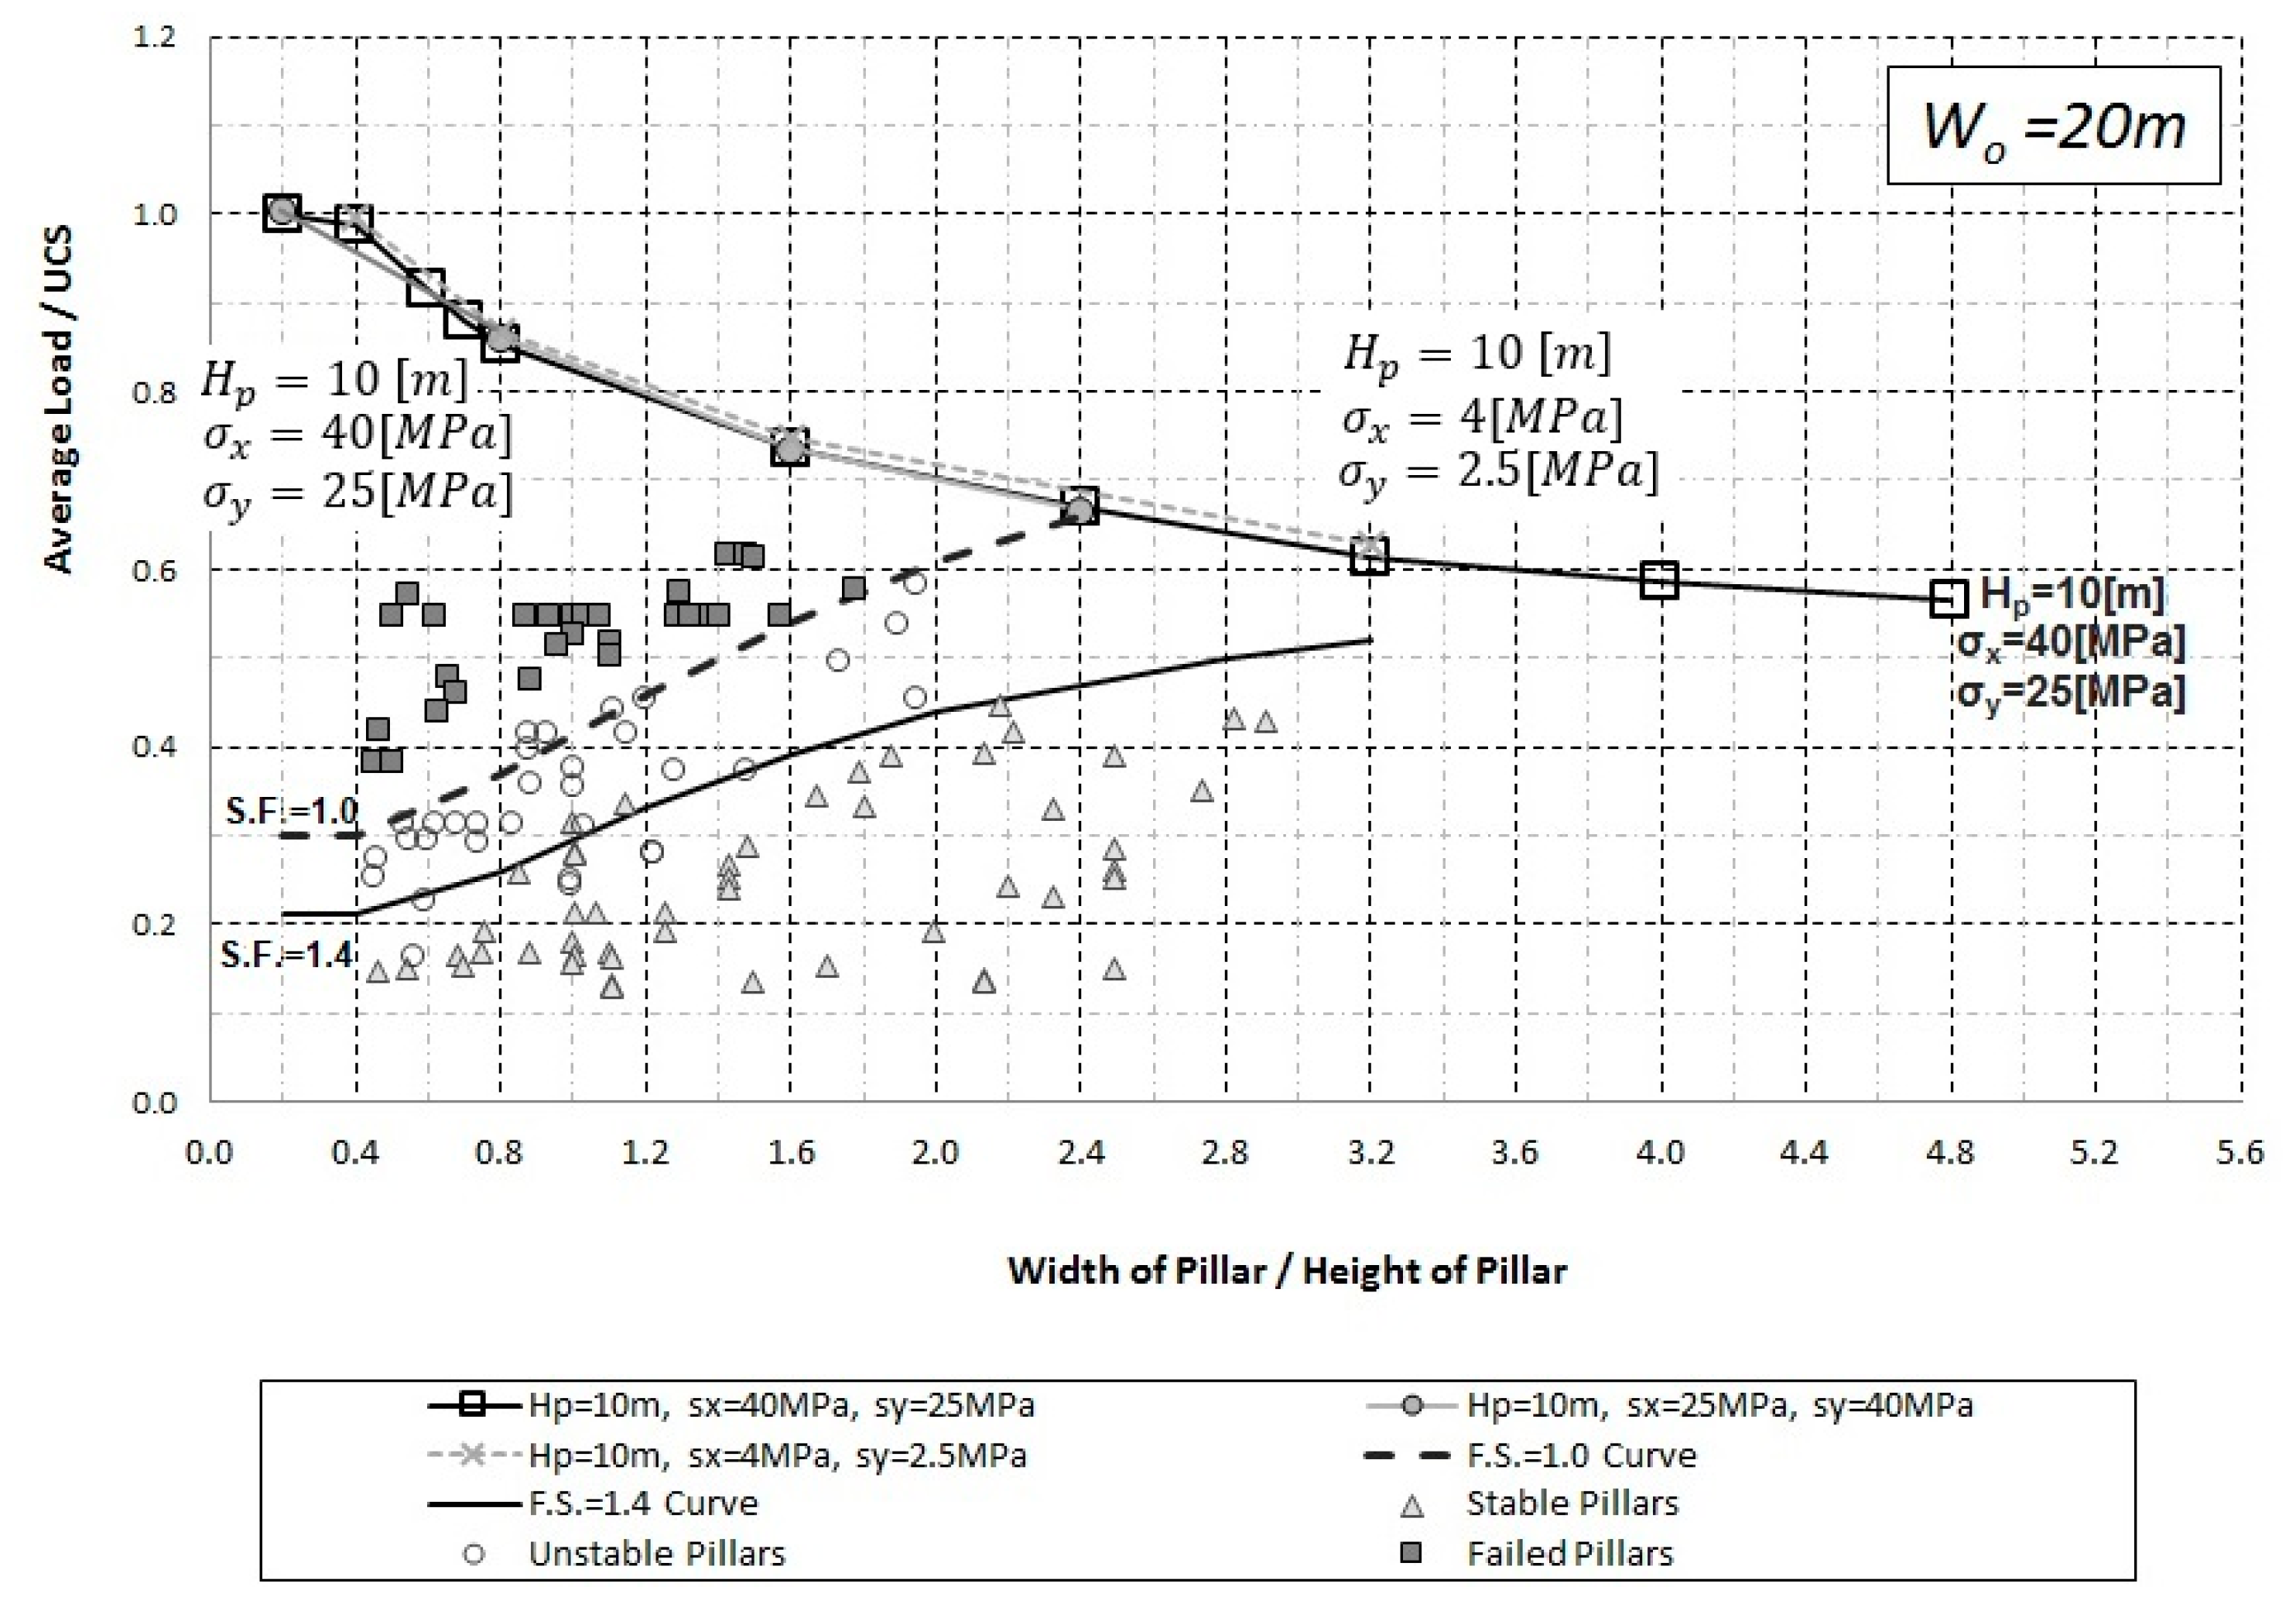
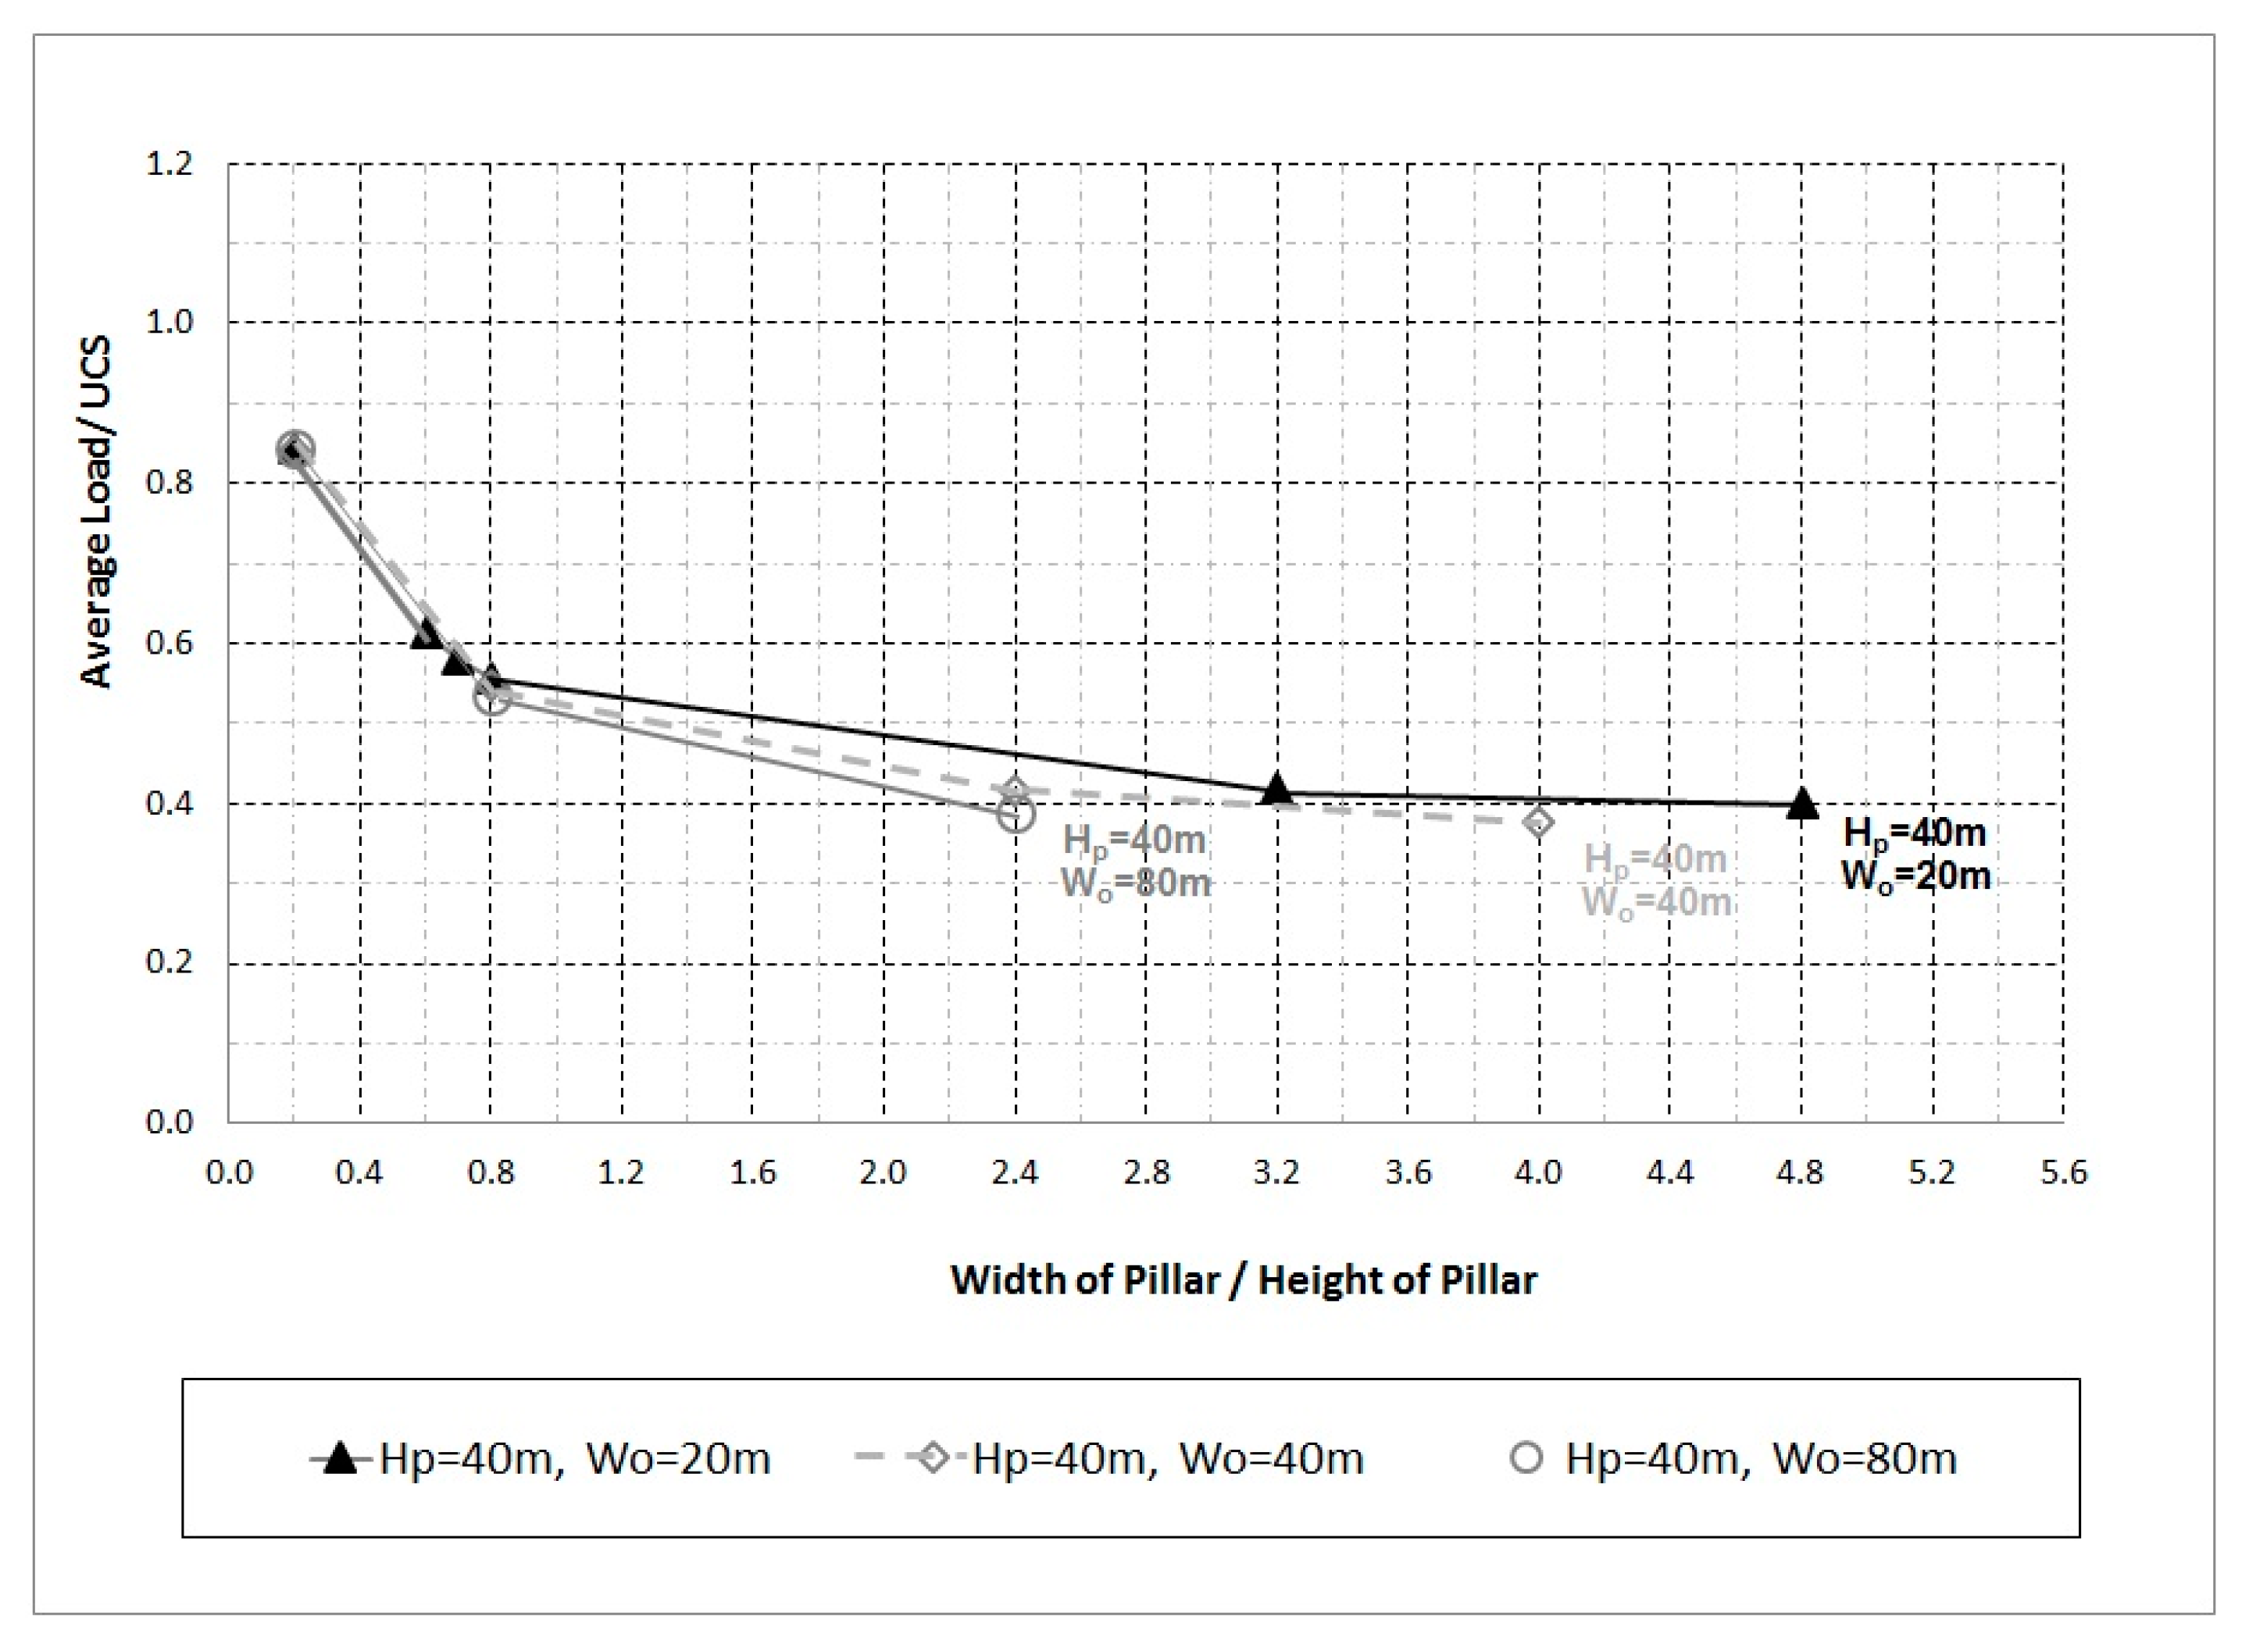
To evaluate the effect of the in situ stress, related to the depth of overburden, the results obtained for a width of opening Wo = 20 m and constant height Hp = 10 m were analyzed against the in situ stress ratio (σh/σv). The results are shown in Figure 11, where it can be noticed that there is little difference between the failure envelopes when the same in situ stress ratio is set but with different magnitudes, that is, when σh = 40 MPa and σv = 25 MPa and when σh = 4 MPa and σv = 2.5 MPa were used. Therefore, there will be negligible differences in the failure envelope when the in situ stress ratio is constant. Similarly, in Figure 12, it is shown that changing the excavation size (Wo) has negligible effects on the envelope obtained. This allows us to consider that the results obtained are valid in other geometric and stress situations.
From the masonry-type model results, it can be deduced that when the pillar width-to-height ratio is maintained constant, the strength of the pillar decreases as the pillar is scaled up. On the other hand, it also shows that maintaining the height constant and increasing the pillar width, the maximum average stress in the pillar decreases and the strength increases proportionally to its width. It also shows that when the width is maintained constant and the height is increased, the maximum load that can withstand the pillar decreases as the area remains constant. It is important to notice that, so far (except for Figure 8), no consideration has been made regarding the presence of discontinuities in different orientation and in the frequency of the discontinuities. Similar results were obtained by [24] on uniaxial compressive tests on intact rock specimens. Based on field data, [25] also showed that increasing the pillar height and maintaining a constant width generates a reduction in the strength of the rock pillar.
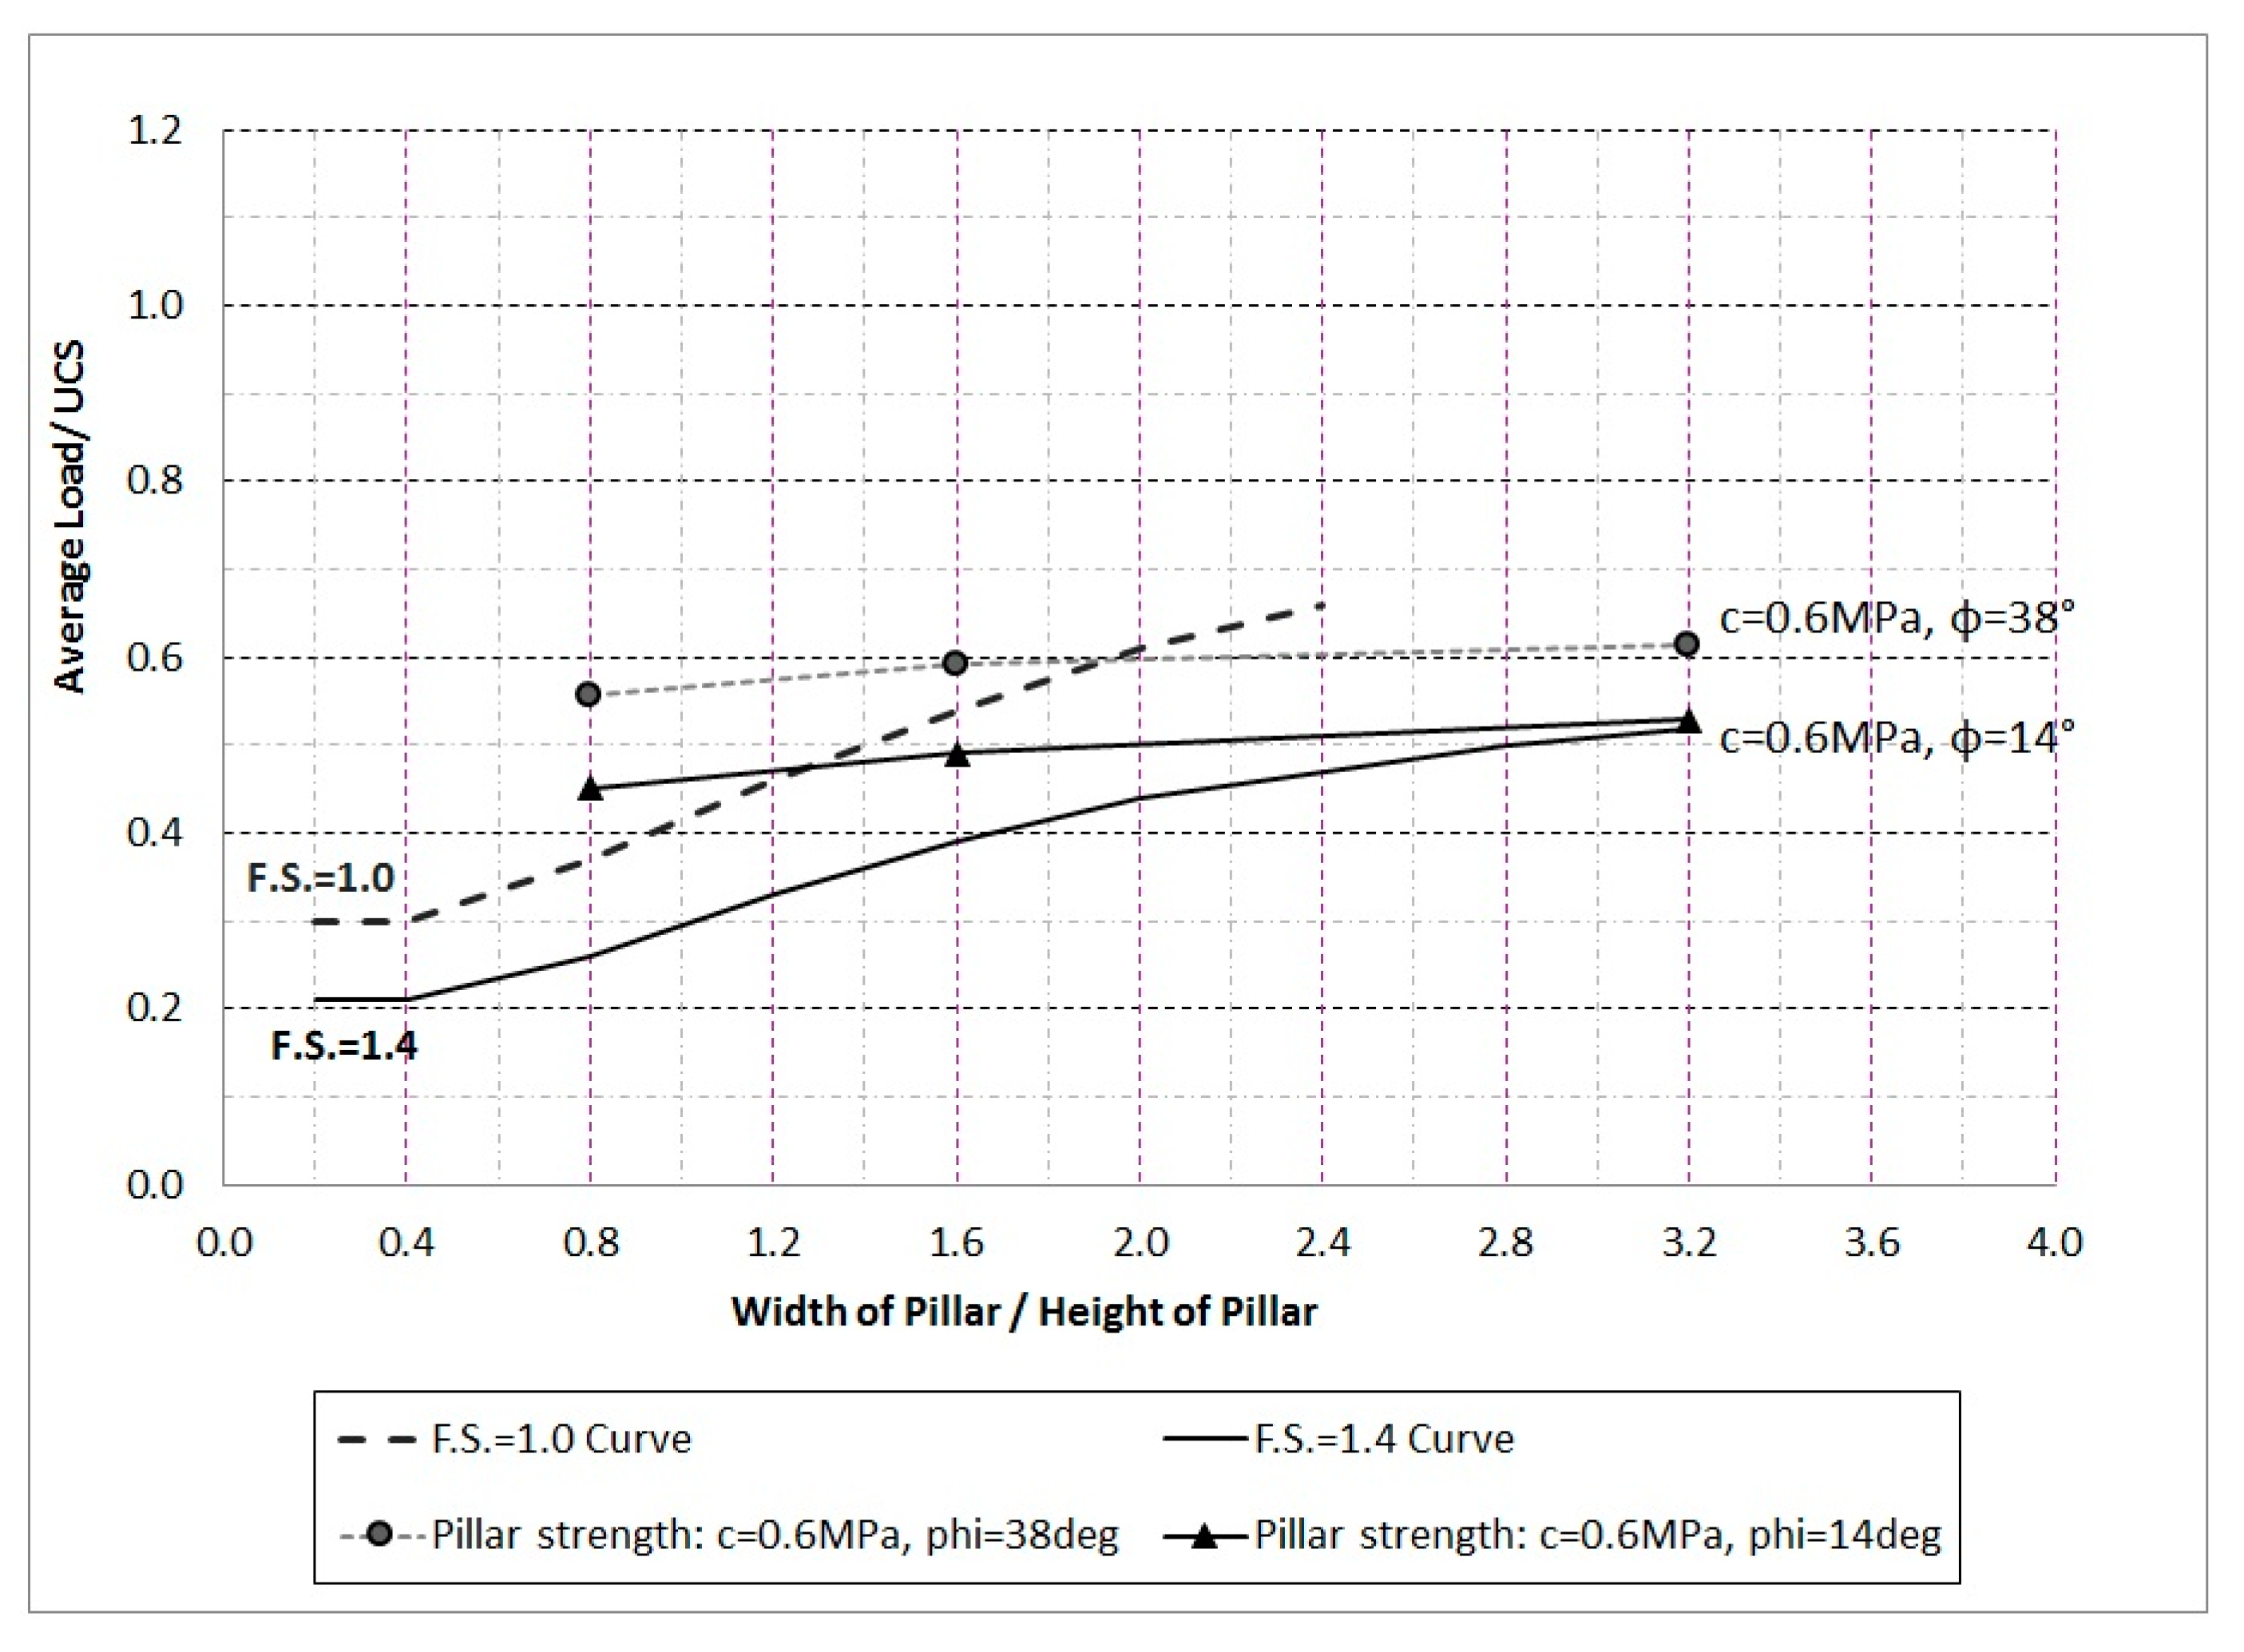
As was mentioned before, a typical value of shear strength for discontinuities was used for most of the analysis performed. Discontinuity friction angle was varied from 14° to 38°, while the cohesion was maintained constant at 0.6 MPa. Results are shown in Figure 13, where it can be observed that the shape of the curve is maintained, but the average load to UCS ratio decreases by about 30 to 25% along the Wp/Hp values.
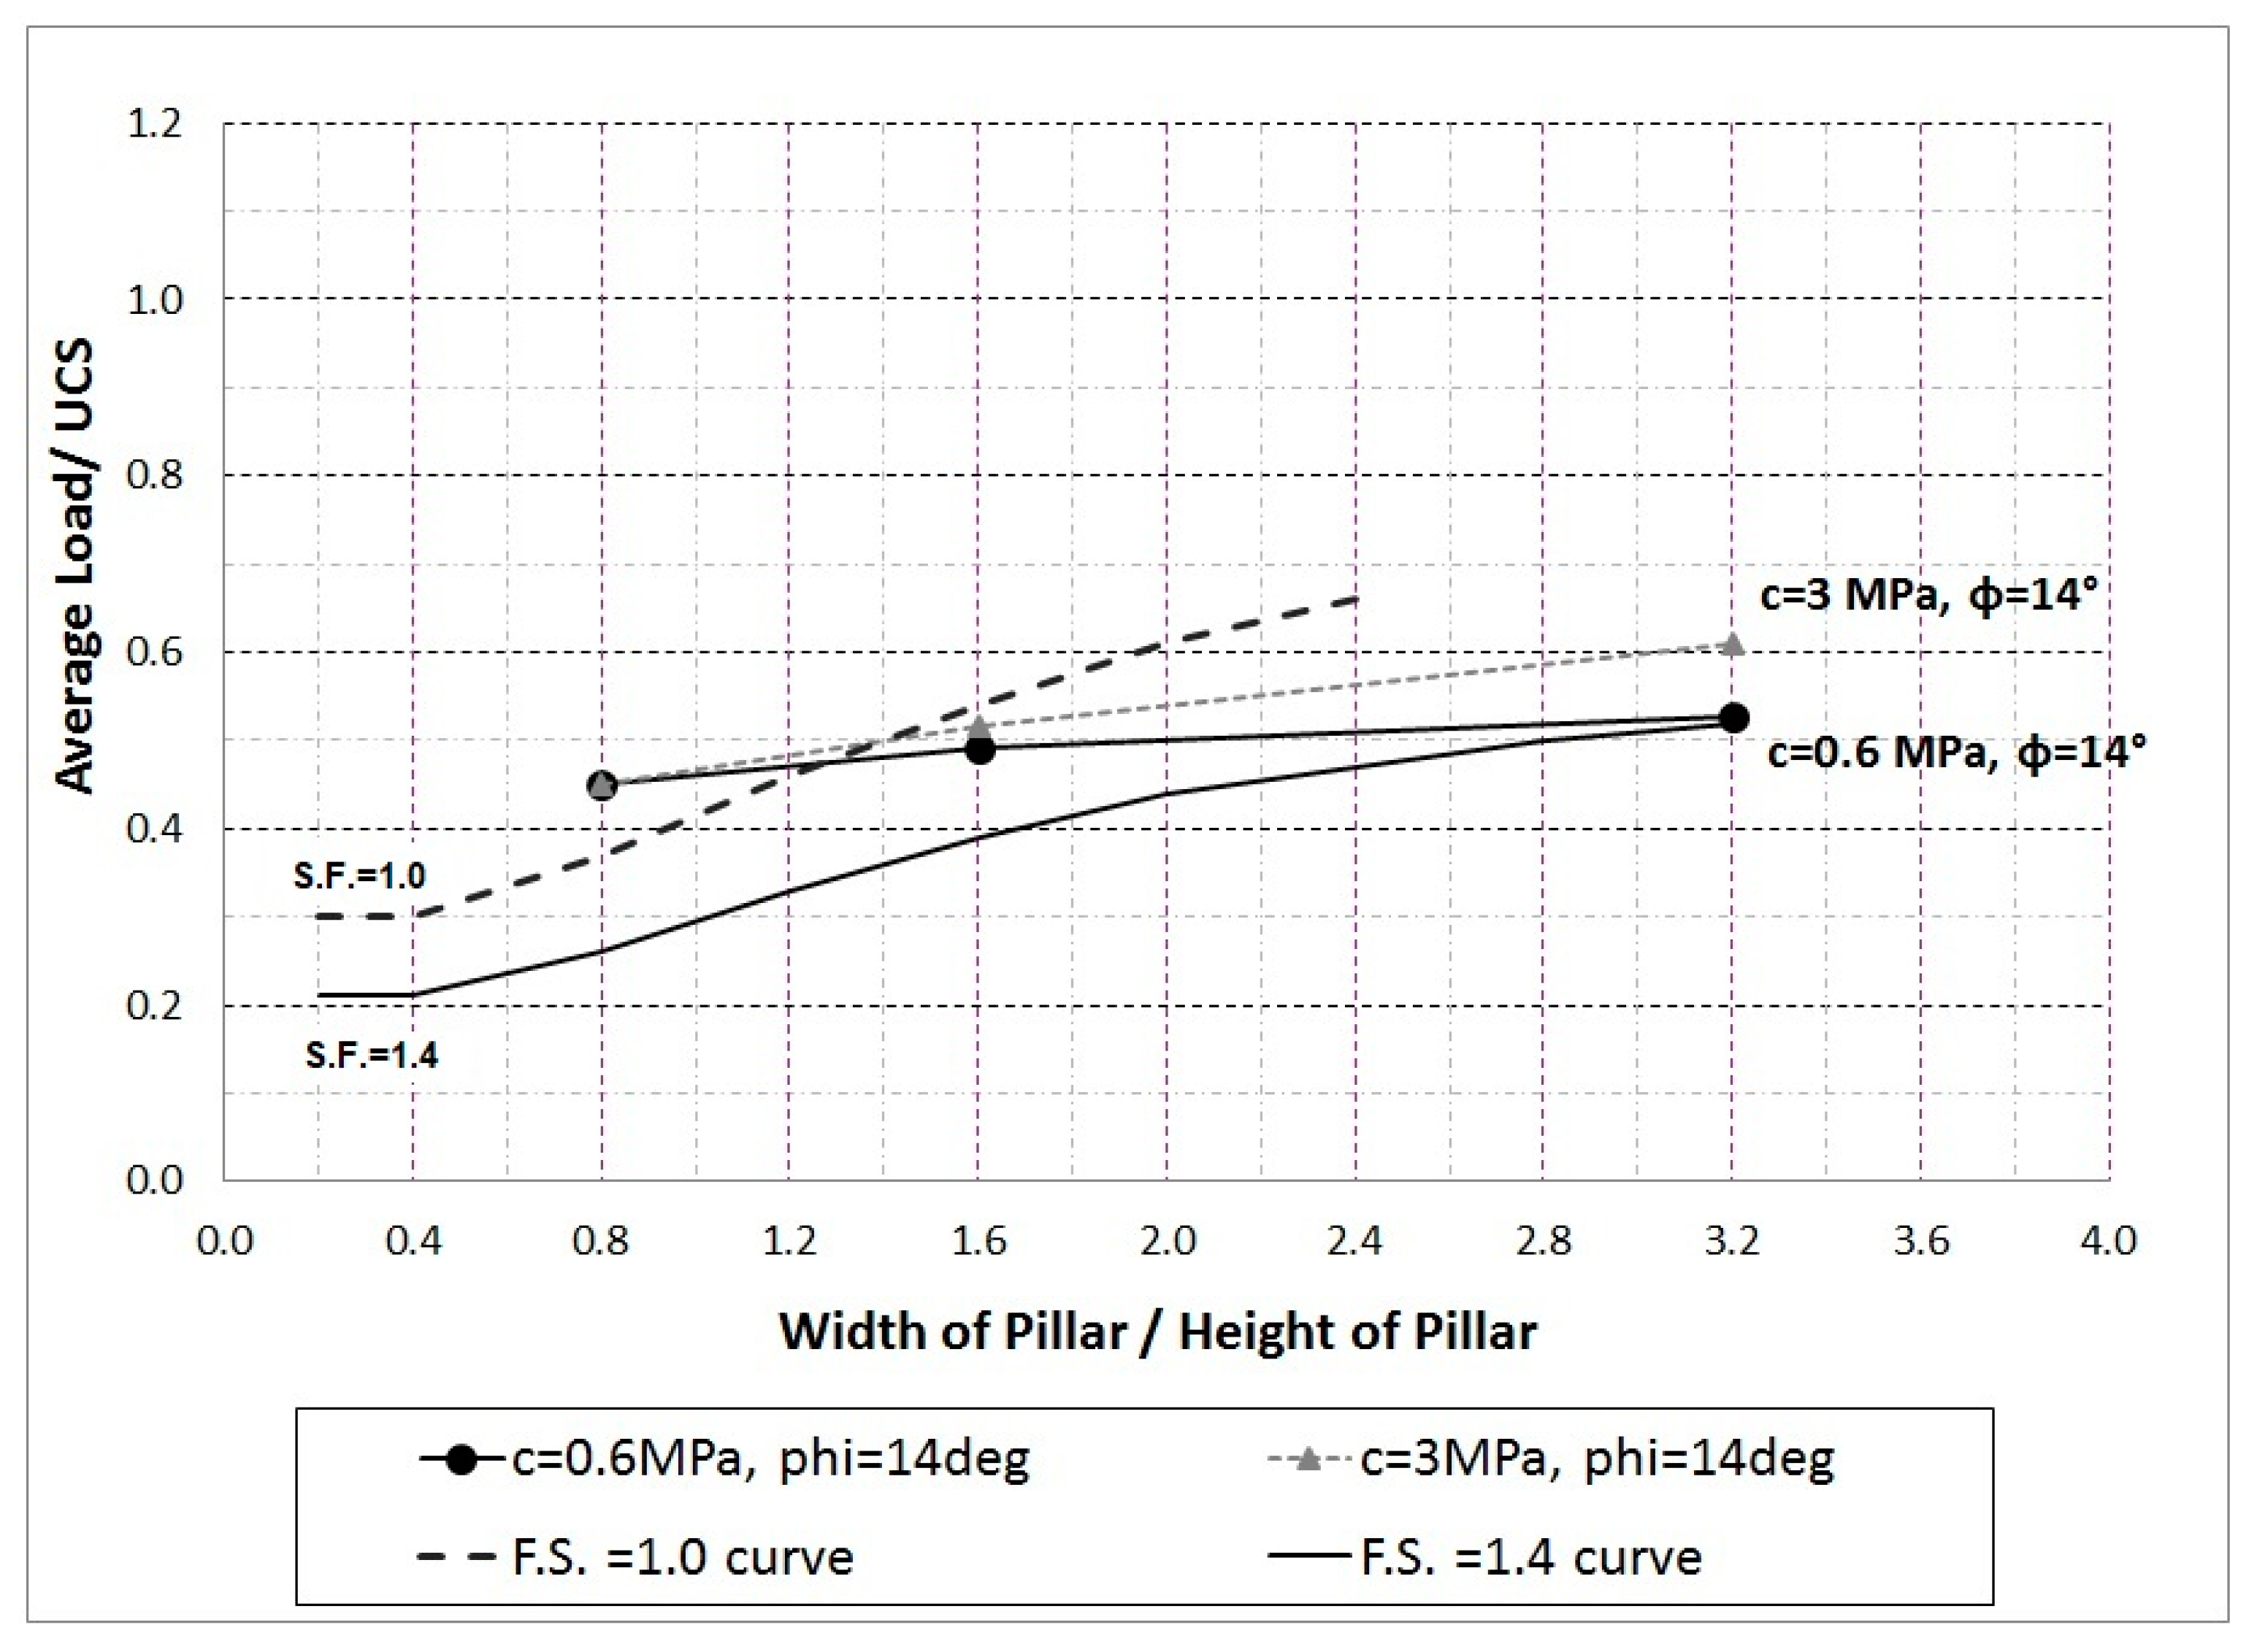
Similarly, Figure 14 shows the shift of the failure envelope when the cohesion of the discontinuities is varied, keeping the friction angle constant at 14°. From Figure 14, it can be noticed that for Wp/Hp ratios lower than 1.5, there are only slight changes in the onset of failure, but it becomes significant at higher values of Wp/Hp.
From Figure 9 and Figure 10, it is observed that within 0.3 to 1.0 width-to-height ratio, the results deviate from those presented by [14]. Until now, the results of the numerical model have only considered the effect of horizontal and vertical discontinuities (masonry model); therefore, it is assumed that the values reported in these two figures should be higher than those with discontinuities in other dipping angles. To estimate the effect of the discontinuities dipping at angles other than vertical and horizontal, the empirical reduction factor DDF, shown in Table 1, is applied to the numerical modeling results. When this factor is applied to the results of Figure 9 and Figure 10, and assuming the worst-case scenario of 60° dip of discontinuities, the resulting failure envelopes are shown in Figure 15 and Figure 16.
When these two figures are compared with the results of Figure 9 and Figure 10, the importance of the presence of discontinuities for pillar stability is confirmed, especially for width-to-height ratios less than 1.0. The effect of discontinuities also allows us to confirm that the numerical model, based on the masonry-type model and the empirical results, follows the same trend as those documented by [14].
7. Conclusions
This paper evaluates the use of a masonry-type constitutive model for the analysis of rock pillar stability using numerical modeling. This constitutive model consists of a three-part shear stress failure envelope that depends on typical failures modes observed in masonry walls. This constitutive model resembles the rock mass considering the strength of the intact rock and discontinuities. The validity of this masonry-type constitutive model was established using the modeling results and comparing them with existing empirical data commonly used in the pillar failure criterion, such as of [14]. The following conclusions are based on the numerical modeling results of different geometries and shear parameters on rock pillars:
- -
- Failure criteria for rock mass based on masonry theory allow considering failure mechanisms commonly observed in rock pillars and masonry walls, using a three-stage failure envelope. This model considers the shear strength of discontinuities and the intact strength of the rock (UCS).
- -
- Masonry-type failure envelope for rock pillars is independent from the in situ stress magnitudes applied when the stress ratio (σh/σv) is maintained constant.
- -
- When the discontinuity dipping angle is not taken into account, in pillars with constant height, the strength decreases rapidly for the pillars’ Wp/Hp ratio, ranging from 0.2 to 1.2. For Wp/Hp values higher than 3.0, there are minor differences in the strength of pillars. In pillars with a constant width, the differences in strength are small for Wp/Hp values lower than 1.0, and negligible for values of Wp/Hp, higher than 1.0.
- -
- The effect of the discontinuity dipping angle was studied through the use of the empirically derived Large Discontinuity Factor LDF obtained from field data. When this factor is included in the model, similar strength envelopes to those derived from field observations are obtained. The stability of pillars is predominantly influenced by the dip of discontinuity when Wp/Hp is 1.0 or less.
- -
- From modeling, it can be deduced that discontinuity effects are not the only cause of rapidly decreasing the stress to reach failure in slender pillars. Buckling effects may explain this observed behavior.
- -
- The described model based on the masonry theory allows the distinction between different modes of failure of rock pillars as observed in the field. Additionally, the results showed that when a discontinuity dip factor is taken into account, some pillar geometries present a more favorable stability behavior than others, which should also be considered in practice.
Author Contributions
E.T., performed the numerical model, R.M., and E.T., analyzed the data, R.M., C.C. wrote, edited the manuscript. All authors have read and agreed to the published version of the manuscript.
Funding
This research received no external funding.
Institutional Review Board Statement
Not applicable.
Informed Consent Statement
Not applicable.
Data Availability Statement
Data is contained within the article or [19].
Conflicts of Interest
The authors declare no conflict of interest.
References
- Coates, D.F. Rock Mechanics Principles, Mines Branch Monograph 874 (Revised); Department of Energy, Mines and Resources: Ottawa, ON, Canada, 1981. [Google Scholar]
- Jeffrey, O.; Esterhuizen, G.S. Improving Hard Rock Pillar Design by Including Rock Mass Classification and Failure Mechanisms; 51st US Rock Mechanics/Geomechanics Symposium: San Francisco, CA, USA, 2017. [Google Scholar]
- Yu, Y.; Chen, S.; Deng, K.; Wang, P.; Fan, H. Subsidence mechanism and stability assessment methods for partial extraction mines for sustainable development of mining cities. A review. Sustainability 2018, 10, 113. [Google Scholar] [CrossRef] [Green Version]
- Esterhuizen, G.; Dolinar, D.; Ellenberger, J. Pillar strength in underground stone mines in the United States. Int. J. Rock Mech. Min. Sci. 2011, 48, 42–50. [Google Scholar] [CrossRef]
- Obert, L.; Duvall, W.I. Rock Mechanics and the Design of Structures in Rock; Wiley: Hoboken, NJ, USA, 1967. [Google Scholar]
- Hedley, D.G.F.; Grant, F. Stope and Pillar Design for the Elliot Lake Uranium Mines. Can. Inst. Min. Metall. Bull. 1972, 65, 37–44. [Google Scholar]
- Bieniawski, Z.T. Rock Mechanics Design in Mining and Tunneling; A. A. Balkema: Rotterdam, The Netherlands, 1984; p. 272. [Google Scholar]
- Von Kimmelmann, M.R.; Hyde, B.; Madgwick, R.J. The use of computer applications at BCL Limited in planning pillar extraction and design of mining layouts. In Proceedings of the Design and Performance of Underground Excavations: ISRM Symposium, Cambridge, UK, 3–6 September 1984; pp. 53–63. [Google Scholar]
- Stacey, T.R.; Page, C.H. Practical Handbook for Underground Rock Mechanics; TransTech: Clausthal-Zellerfeld, Germany, 1986; p. 145. [Google Scholar]
- Krauland, N.; Soder, P. Determining pillar strength from pillar failure observations. Eng. Min. J. 1987, 188, 34–40. [Google Scholar]
- Potvin, Y.; Hudyma, M.; Miller, H.D.S. Rib Pillar Design in Open Stoping. Can. Inst. Min. Metall. Bull. 1989, 82, 31–36. [Google Scholar]
- Sjöberg, J. Failure modes and pillar behaviour in the Zinkgruvan mine. In Proceedings of the 33rd U.S. Symposium on Rock Mechanics (USRMS), Santa Fe, New Mexico, 3–5 June 1992; A. A. Balkema: Rotterdam, The Netherlands, 1992; pp. 491–500. [Google Scholar]
- Bieniawski, Z.T.; Alber, M.; Kalamaras, G.S. Time Dependent Strength of Coal Strata for Long-Term Pillar Stability. In Proceedings of the 13th Conference on Ground Control in Mining, Morgantown, WV, USA, 2–4 August 1994; pp. 81–90. [Google Scholar]
- Lunder, P.J.; Pakalnis, R. Determining the Strength of Hard Rock Mine Pillars. Bull. Can. Inst. Min. Metall. 1997, 90, 51–55. [Google Scholar]
- Gill, D.E.; Leite, M.H.; Labrie, D. Designing Mine Pillars with the Convergence-Confinement Method. Int. J. Rock Mech. Min. Sci. Geomech. Abstr. 1994, 31, 687–698. [Google Scholar] [CrossRef]
- Dialer, C. Masonry and rock mechanics—An interdisciplinary look at two related materials. In Proceedings of the 6th North American Masonry Conference, Philadelphia, PA, USA, 6–9 June 1993. [Google Scholar]
- Mann, W.; Müller, H. Failure of Shear—Stressed Masonry—an Enlarged Theory, Test and Application to Shear Walls. In Proceedings of the British Ceramic Society, Darmstadt, Germany, 1 January 1982; pp. 223–235. [Google Scholar]
- Esterhuizen, G.; Dolinar, D.; Ellenberger, J.; Prosser, L. Pillar and Roof Span—Design Guidelines for Underground Stone Mines; National Institute for Occupational Safety and Health (NIOSH): Pittsburgh, PA, USA, 2011.
- Tapia, E. Modelamiento Numérico de Pilares en Roca Mediante Analogía al Criterio de Falla en Albañilería. Universidad de Chile—Facultad de Ciencias Físicas y Matemáticas: Santiago, Chile, 2015. Available online: http://repositorio.uchile.cl/handle/2250/137537 (accessed on 20 January 2019).
- Willoner, A. Characterisation of Rock Mass Quality and Prediction of Mass Behaviour, El Teniente, Chile: An Investigation into the Parameters which Influence the Strength of Healed Joints in Hypogene Mineralized Andesite at El Teniente Copper Mine; International Journal of Rock Mechanics & Mining Sciences: Sewell, Chile, 2000. [Google Scholar]
- Carranza, M. Características de las Estructuras Geológicas de Bloques caídos, Nivel de Producción, Mina Esmeralda; Memoria para optar al título de Geólogo, Universidad de Chile: El Teniente, Chile, 2006. [Google Scholar]
- Gavia, B. Resistencia en Vetillas Selladas del Yacimiento; Memoria para Optar al Título de Geóloga, Universidad de Chile: El Teniente, Chile, 2005. [Google Scholar]
- Megson, T.H.S. Structural and Stress Analysis, 2nd ed.; Elsevier: Amsterdam, The Netherlands, 2005. [Google Scholar]
- Dirige, P.; Archibald, J.A. The effects of geometry on the uniaxial compressive strength properties of intact rock core specimens. In Proceedings of the 41st U.S. Symposium on rock mechanics (USRMS), Golden, CO, USA, 17–21 June 2006. [Google Scholar]
- Hudson, J.; Brown, E.; Fairhurst, C. Shape of the complete stress-strain curve for rock. In Proceedings of the 13th Symposium on Rock Mechanics, Urbana, IL, USA, 1 January 1972; pp. 773–795. [Google Scholar]
Figure 1.
Masonry from [17]. (a) Stress state acting on a masonry panel, (b) stress state acting on a brick.
Figure 1.
Masonry from [17]. (a) Stress state acting on a masonry panel, (b) stress state acting on a brick.

Figure 2.
Modes of failure in masonry: (a) adherence failure, (b) diagonal traction failure, and (c) toe compression or foundation failure.
Figure 2.
Modes of failure in masonry: (a) adherence failure, (b) diagonal traction failure, and (c) toe compression or foundation failure.

Figure 3.
Failure envelope for masonry design.

Figure 4.
(a) Representation of normal stresses acting on the brick unit of rock, (b) distribution of shear stresses on the edges of the unit.
Figure 4.
(a) Representation of normal stresses acting on the brick unit of rock, (b) distribution of shear stresses on the edges of the unit.

Figure 5.
Diagonal traction failure: (a) locations of all eight nodes considered, (b) stress representation.
Figure 5.
Diagonal traction failure: (a) locations of all eight nodes considered, (b) stress representation.

Figure 6.
Empirically developed Pillar Stability Graph [12].
Figure 6.
Empirically developed Pillar Stability Graph [12].

Figure 7.
Vertical stresses between openings, Wp = 32 m, Hp = 40 m.

Figure 8.
Pillar stability curves with varying LDF factor, Hp = 10 m.

Figure 9.
Empirical stability chart and modeling results—failure envelopes for different pillar heights Hp.
Figure 9.
Empirical stability chart and modeling results—failure envelopes for different pillar heights Hp.

Figure 10.
Empirical stability chart and modeling results—failure envelopes for different pillar widths Wp.
Figure 10.
Empirical stability chart and modeling results—failure envelopes for different pillar widths Wp.

Figure 11.
Empirical stability chart and modeling results—failure envelopes for different far field stresses σh, σv.
Figure 11.
Empirical stability chart and modeling results—failure envelopes for different far field stresses σh, σv.

Figure 12.
Modeling results—failure envelopes for different widths of opening Wo.

Figure 13.
Effect of discontinuity friction angle on pillar strength.

Figure 14.
Effect of discontinuity cohesion on pillar strength.

Figure 15.
Failure envelopes considering the discontinuity dip angle for constant pillar height.

Figure 16.
Failure envelopes considering the discontinuity dip angle for constant pillar width.


Table 1.
Discontinuity dip factor (DDF). Table extracted from [18].
Table 1.
Discontinuity dip factor (DDF). Table extracted from [18].
| Discontinuity | Pillar Width-to-Height Ratio | ||||||||
|---|---|---|---|---|---|---|---|---|---|
| Dip (°) | |||||||||
| ≤0.5 | 0.6 | 0.7 | 0.8 | 0.9 | 1.0 | 1.1 | 1.2 | >1.2 | |
| 30° | 0.15 | 0.15 | 0.15 | 0.15 | 0.16 | 0.16 | 0.16 | 0.16 | 0.16 |
| 40° | 0.23 | 0.26 | 0.27 | 0.27 | 0.25 | 0.24 | 0.23 | 0.23 | 0.22 |
| 50° | 0.61 | 0.65 | 0.61 | 0.53 | 0.44 | 0.37 | 0.33 | 0.30 | 0.28 |
| 60° | 0.94 | 0.86 | 0.72 | 0.56 | 0.43 | 0.34 | 0.29 | 0.26 | 0.24 |
| 70° | 0.83 | 0.68 | 0.52 | 0.39 | 0.30 | 0.24 | 0.21 | 0.20 | 0.18 |
| 80° | 0.53 | 0.41 | 0.31 | 0.25 | 0.20 | 0.18 | 0.17 | 0.16 | 0.16 |
| 90° | 0.31 | 0.25 | 0.21 | 0.18 | 0.17 | 0.18 | 0.16 | 0.15 | 0.15 |
Table 2.
Frequency factor (FF). Extracted from [18].
Table 2.
Frequency factor (FF). Extracted from [18].
| Average Frequency of Large Discontinuities per Pillar | 0.0 | 0.1 | 0.2 | 0.3 | 0.5 | 1.0 | 2.0 | 3.0 | >3 |
|---|---|---|---|---|---|---|---|---|---|
| Frequency factor (FF) | 0.00 | 0.10 | 0.18 | 0.26 | 0.39 | 0.63 | 0.86 | 0.95 | 1.00 |
Publisher’s Note: MDPI stays neutral with regard to jurisdictional claims in published maps and institutional affiliations. |
© 2021 by the authors. Licensee MDPI, Basel, Switzerland. This article is an open access article distributed under the terms and conditions of the Creative Commons Attribution (CC BY) license (http://creativecommons.org/licenses/by/4.0/).
Share and Cite
MDPI and ACS Style
Moffat, R.; Caceres, C.; Tapia, E. Rock Pillar Design Using a Masonry Equivalent Numerical Model. Energies 2021, 14, 890. https://doi.org/10.3390/en14040890
AMA Style
Moffat R, Caceres C, Tapia E. Rock Pillar Design Using a Masonry Equivalent Numerical Model. Energies. 2021; 14(4):890. https://doi.org/10.3390/en14040890
Chicago/Turabian StyleMoffat, Ricardo, Cristian Caceres, and Eugenia Tapia. 2021. "Rock Pillar Design Using a Masonry Equivalent Numerical Model" Energies 14, no. 4: 890. https://doi.org/10.3390/en14040890
Note that from the first issue of 2016, this journal uses article numbers instead of page numbers. See further details here.