
Role of Integrated Approaches in Water Resources Management: Antofagasta Region, Chile
by
 , ,
, ,
Ashwani Kumar Tiwari
1,2,3,* ,
,
Enrico Suozzi
2,
Carlos Silva
3,
Marina De Maio
2 and
Mariachiara Zanetti
2 1
School of Environmental Sciences, Jawaharlal Nehru University, Delhi 110067, India
2
DIATI—Department of Environment, Land and Infrastructure Engineering, Politecnico di Torino, 10129 Turin, Italy
3
Facultad de Ingeniería y Ciencias, Universidad Adolfo Ibáñez, Santiago 2640, Chile
*
Author to whom correspondence should be addressed.
Sustainability 2021, 13(3), 1297; https://doi.org/10.3390/su13031297
Submission received: 2 January 2021
/
Revised: 20 January 2021
/
Accepted: 22 January 2021
/
Published: 26 January 2021
(This article belongs to the Special Issue Sustainable Water, Economic Management and Governance Issues)
Abstract
:Water is essential for the survival of all living beings and plays a significant role in the growth of any country′s economy. At present, water depletion and pollution are a serious challenge due to anthropogenic, geogenic and climate change activities worldwide, including in Chile. The Antofagasta region is located in northern Chile and is the heart of its mining industry, playing a significant role in the country′s economy. The Antofagasta region′s main challenge is water shortage and contamination. Due to it, the region′s local population is facing major difficulties in obtaining the necessary water for domestic, industrial, irrigation, and other uses. Therefore, a water resources management plan is essential for the region to maintain a sustainable environment. Considering the above points, significant parameters, such as slope, aspect, elevation, hillshade, drainage, drainage density and river basin—maps of the Antofagasta region prepared using the digital elevation model (DEM) data in geographic information system (GIS) environment. Besides, a pollution risk level assessment of the study area′s cities/villages done using GIS application. The important created maps and the identification of pollution risk of cities/villages of the present study could provide significant information to policymakers and help them make a suitable water management plan for the area.
1. Introduction
Chile is an important country in South America for a total covered area approximately equal to 2,919,299 square miles (7,560,950 square km). Located in the southwest of South America, Chile is a narrow strip of land between the Andes to the east and the Pacific Ocean, to the west. Chile has a boundary with Peru in the north, Bolivia in the northeast, Argentina in east, and the Pacific Ocean in the west. Chile is divided into 16 regions and has a diverse climate, such as northern region belongs to world′s driest desert with a semi-arid climate, the center region of the country belongs to a Mediterranean climate, Easter Island has humid subtropical climate and east and south regions including alpine tundra and glaciers are belong to oceanic climate [1]. Chile has four significant seasons, summer from January to March, autumn during the April to June, winter during the July to September, and spring during the October to December. Mining, products manufacturing, and agriculture sectors are the main contributor to the Chilean economy. In the Chilean economy, the mining sector is a major contributor, with around a 10% of de GDP [2], and most of the mining areas are in the northern region of the country. In another aspect, the mining and related activities threatens the quality of environmental matrix, including water scarcity in the northern region of Chile [3]. Use of huge volumes of water during the mining and its related processes cause threatens to the supply for water resources for other important uses in life [4]. Consumption of water in the mining industry is estimated to rise in all territory due to an increase in mining developments and a decline in ore concentration, causing greater processing needs [5]. In 2014, estimated water consumption was 14.8 m3/s in the copper mining industry, while forecasts showing that it will be increased to around 24.6 m3/s by 2025 [5]. In addition, the natural and anthropogenic (rapid urbanization, mining, extensive agriculture, domestic disposal etc.) factors are responsible for water scarcity [3,6]. In Chile, the sparsely populated southern region has an abundance of water as compared to the densely populated central and northern regions [7].
A combined approach of remote sensing (RS) data and geographic information system (GIS) can play an essential role in hazard monitoring, natural resources exploration, heritage management, sustainable management of resources etc. [8,9,10,11,12]. Furthermore, integrated RS and GIS application play a significant role in managing water resources, such as groundwater recharge zones identification, water quality monitoring, flood-prone area mapping, and watershed management, among others [9,10,11,12,13,14,15,16,17,18]. Therefore, in the recent era, the RS and GIS approach is essentially required to because it can provide essential information to policymakers for taking quick decisions for water resources management of any area.
In the Antofagasta region, water shortage and contamination are a significant problem. Due to them, the region′s local habitat faces serious challenges in obtaining water for drinking, industrial, irrigation, and other uses [3,19,20]. A desalination practice has been recognized as a secure source of water to fulfil the water necessity of different uses (DGA in Spanish, Direccion General de Aguas). However, water shortage and contamination are still key concerns, and to achieve this goal, many primary and secondary data information is required. Therefore, the present study′s objective encompasses (i) to provide important information on essential hydrogeological parameters derived from a DEM using GIS and (ii) identification of pollution level risk of cities/villages of the Antofagasta region, Chile. The present study could play a significant role in sustainable water resources protection and management in the area.
2. Material and Methods
2.1. Study Area
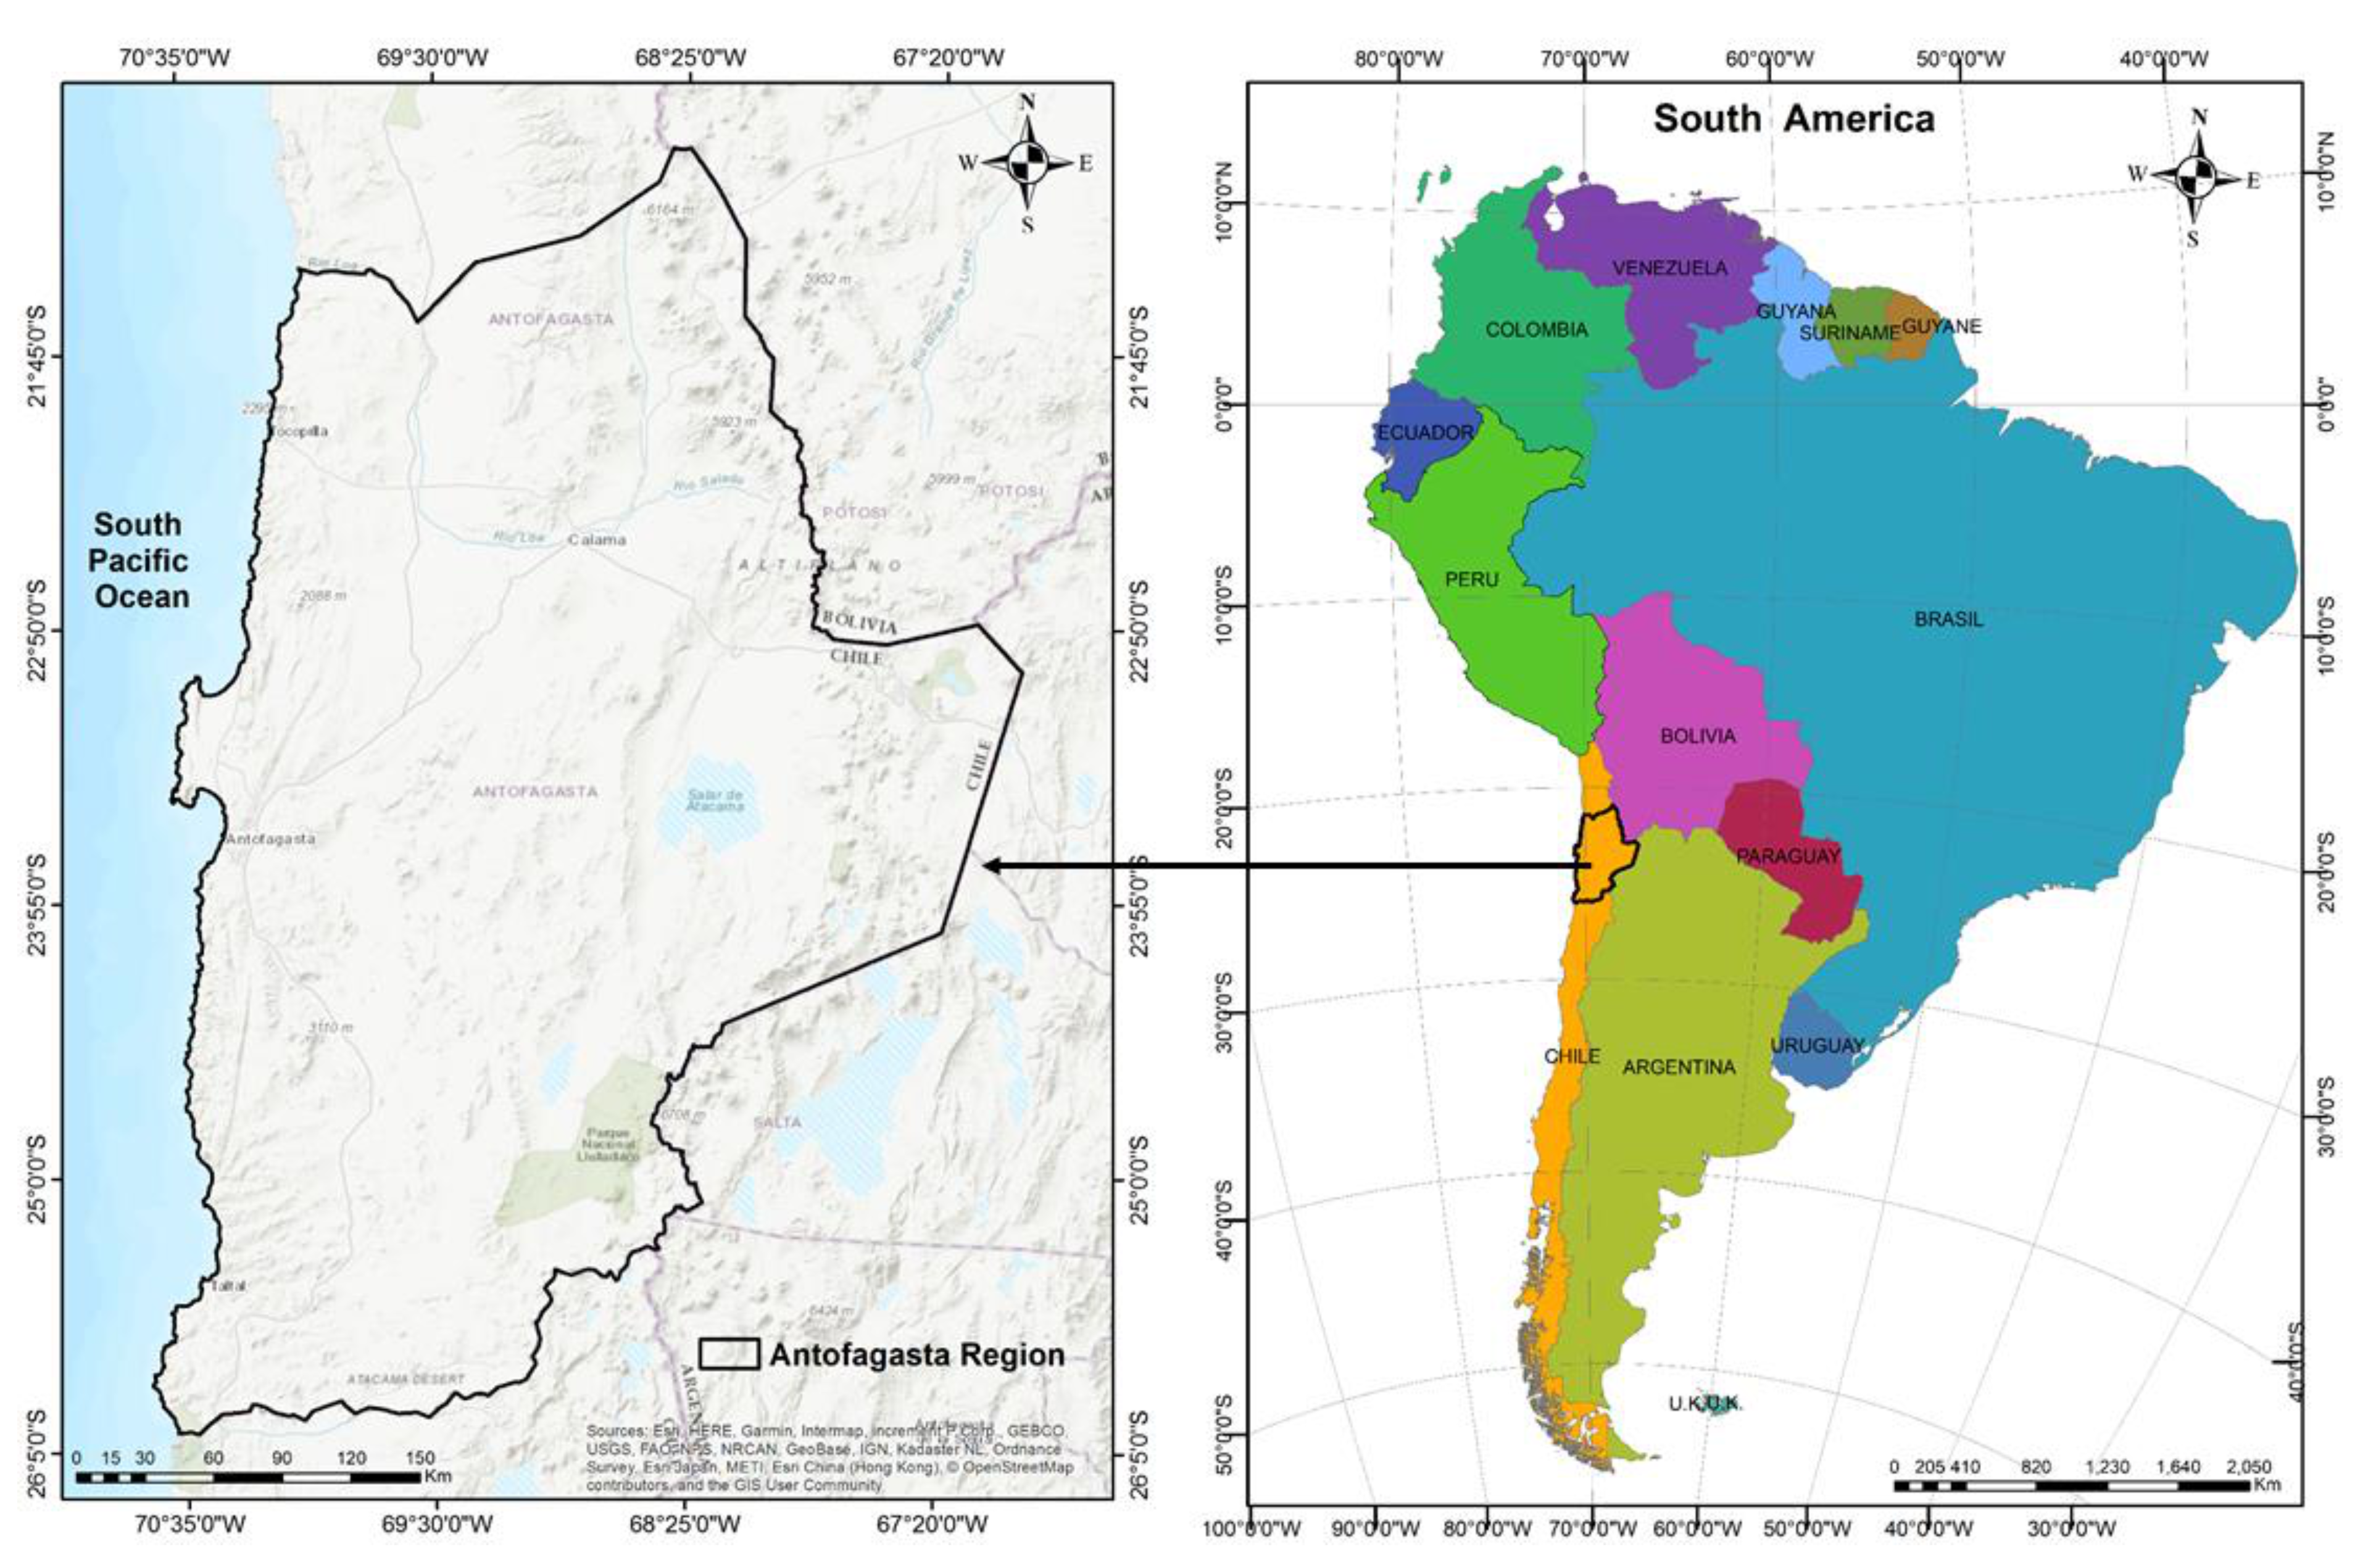
In Chile, the Antofagasta region is one of the most important administrative division in the sixteen administrative regions and second-largest region of the country with having more than 126,000 km2 geographical area (Figure 1). The region has three provinces, Antofagasta, El Loa and Tocopilla. It has a border with the Tarapacá region in the north and with the Atacama region in the south and borders Bolivia and Argentina to the east. The region has a population of 402,669 as per the 2015 census. Antofagasta has an average annual temperature of 16.8 °C and July is the coldest month, with an average low temperature of 11.8 °C, and an average high temperature of 16.5 °C [1]. In Chile, the Antofagasta region is called the mining industry′s heart, generating 53% of the mining output, led by copper and followed by potassium nitrate, gold, iodine, and lithium in the area.
2.2. Significant Maps Creations
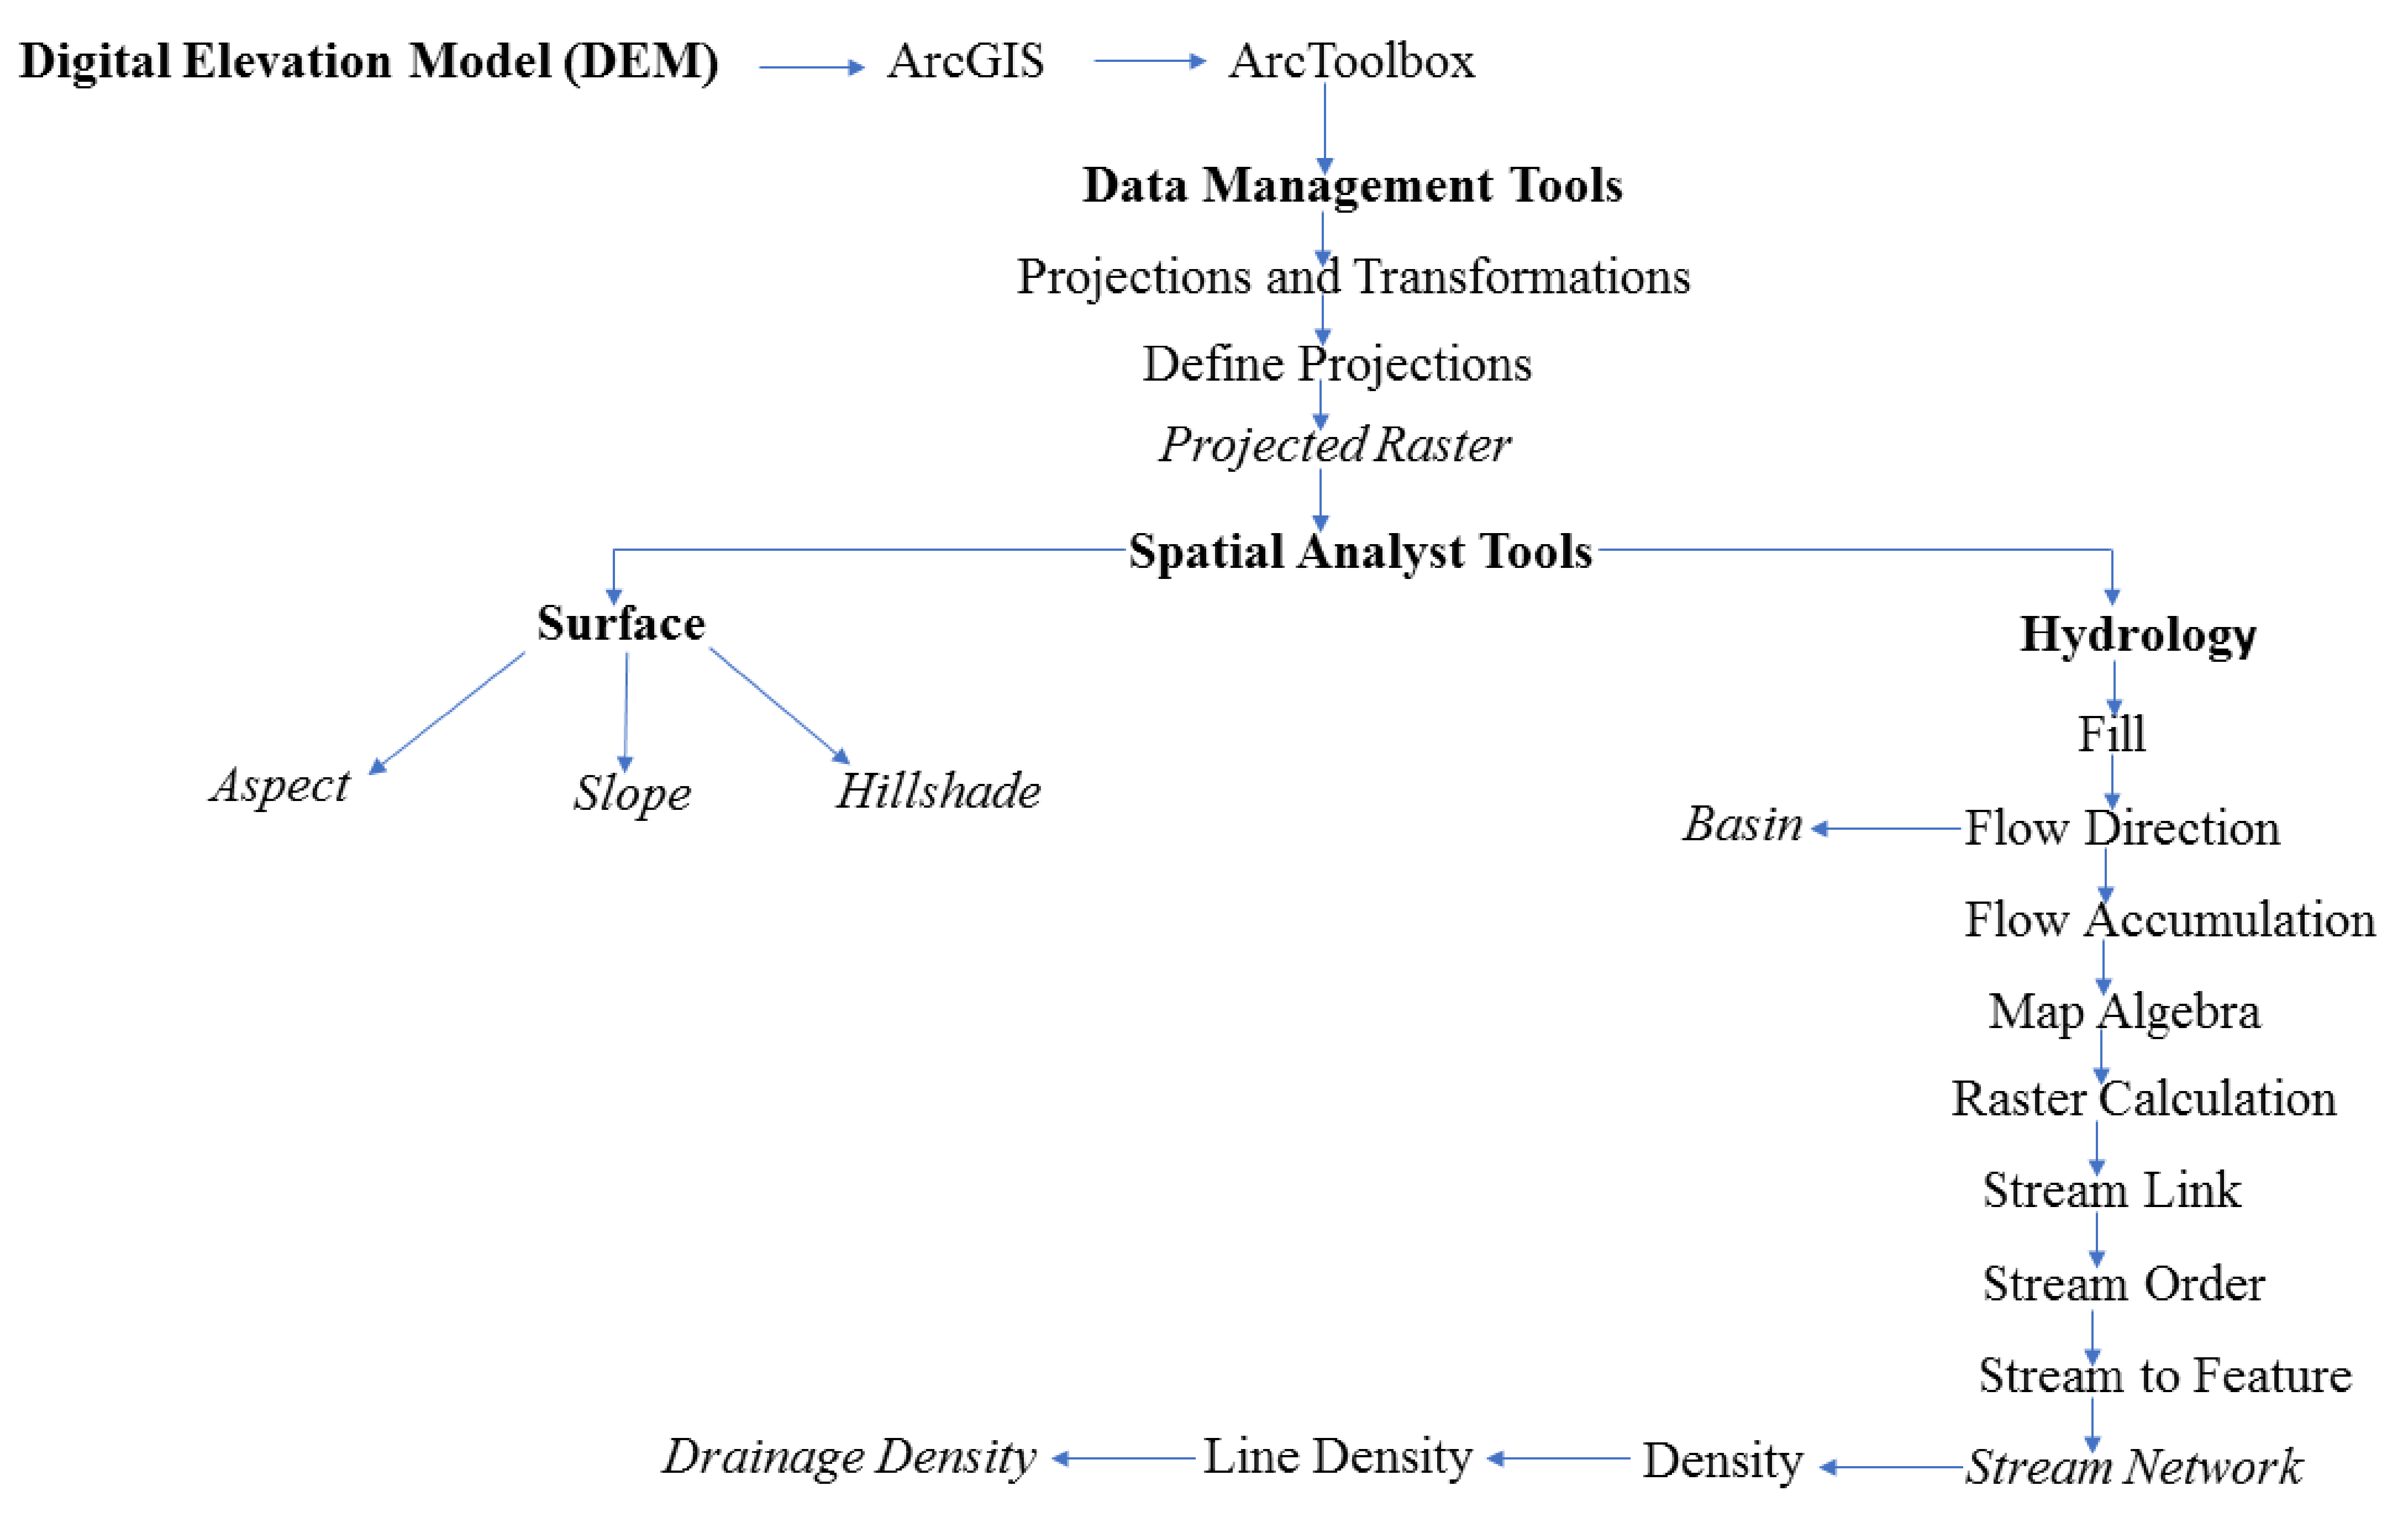
The digital elevation model (DEM) was developed by Shuttle Radar Topography Mission (SRTM), an international research effort, SRTM model was downloaded from the United States Geological Survey (USGC) to create the significant hydrological maps in a geographic information system (GIS) platform. Use of the DEM data in a GIS environment is faster to create many significant features. Therefore, in the present research, DEM data used in a GIS environment to create some important features, such as aspect, elevation, hillshade, slope, basin and stream network and drainage density of the Antofagasta region, Chile (Figure 2). Moreover, Chile′s geological map has been collected from the National Geology and Mining Service, Santiago, Chile, and the Antofagasta region′s geological map was acquired using GIS.
2.2.1. Elevation
The elevation defined as height elevated above a reference point, which usually means sea level. The elevation is an important parameter that provides an essential role in managing water resources [21,22,23,24]. For example, in groundwater recharge, the regions with lower elevation are considered a good recharge zone and the areas with higher elevation considered a less potential recharge zone [25]. In the study area, elevation classified in five classes, such as <500 masl (metres above sea level), 701–1500 masl, 1501–3000 masl, 3001–4500 masl and >4500 masl based on the values (Figure 3). Around two-third area (75.5%) of the Antofagasta region has a high to a very high elevation, while 2.4% coast area has elevation less than 500 masl and 22.1% of the area has an elevation between 501–1500 masl, respectively (Table 1, Figure 3).
2.2.2. Slope
The slope is an important parameter in hydrology, and it has its own significance in affecting the run-off, movement of surface water and potential infiltration [26]. In the case of groundwater resources management, slope plays a significant role in the movement of water and permitting the infiltration of water into the aquifer system [27,28]. The slope can be calculated in percent (0–100%) or in degree from horizontal (0–90°), and the velocity of water directly associated with the angle of slope and depth. Information about the slope category is essential in the study of groundwater recharge mapping. An area with flat slopes has a very good capability for recharging groundwater and followed by moderate slopes. In contrast, the area with steeper slopes has poor recharging capacity. In the Antofagasta region, half (50%) of the area has a slope of less than 5 degrees and 25.6% of the area between slope 5 to 10 degrees (Table 1; Figure 4). However, the rest of the area of the Antofagasta region has slope above 15 degrees (Table 1)
2.2.3. Hillshade
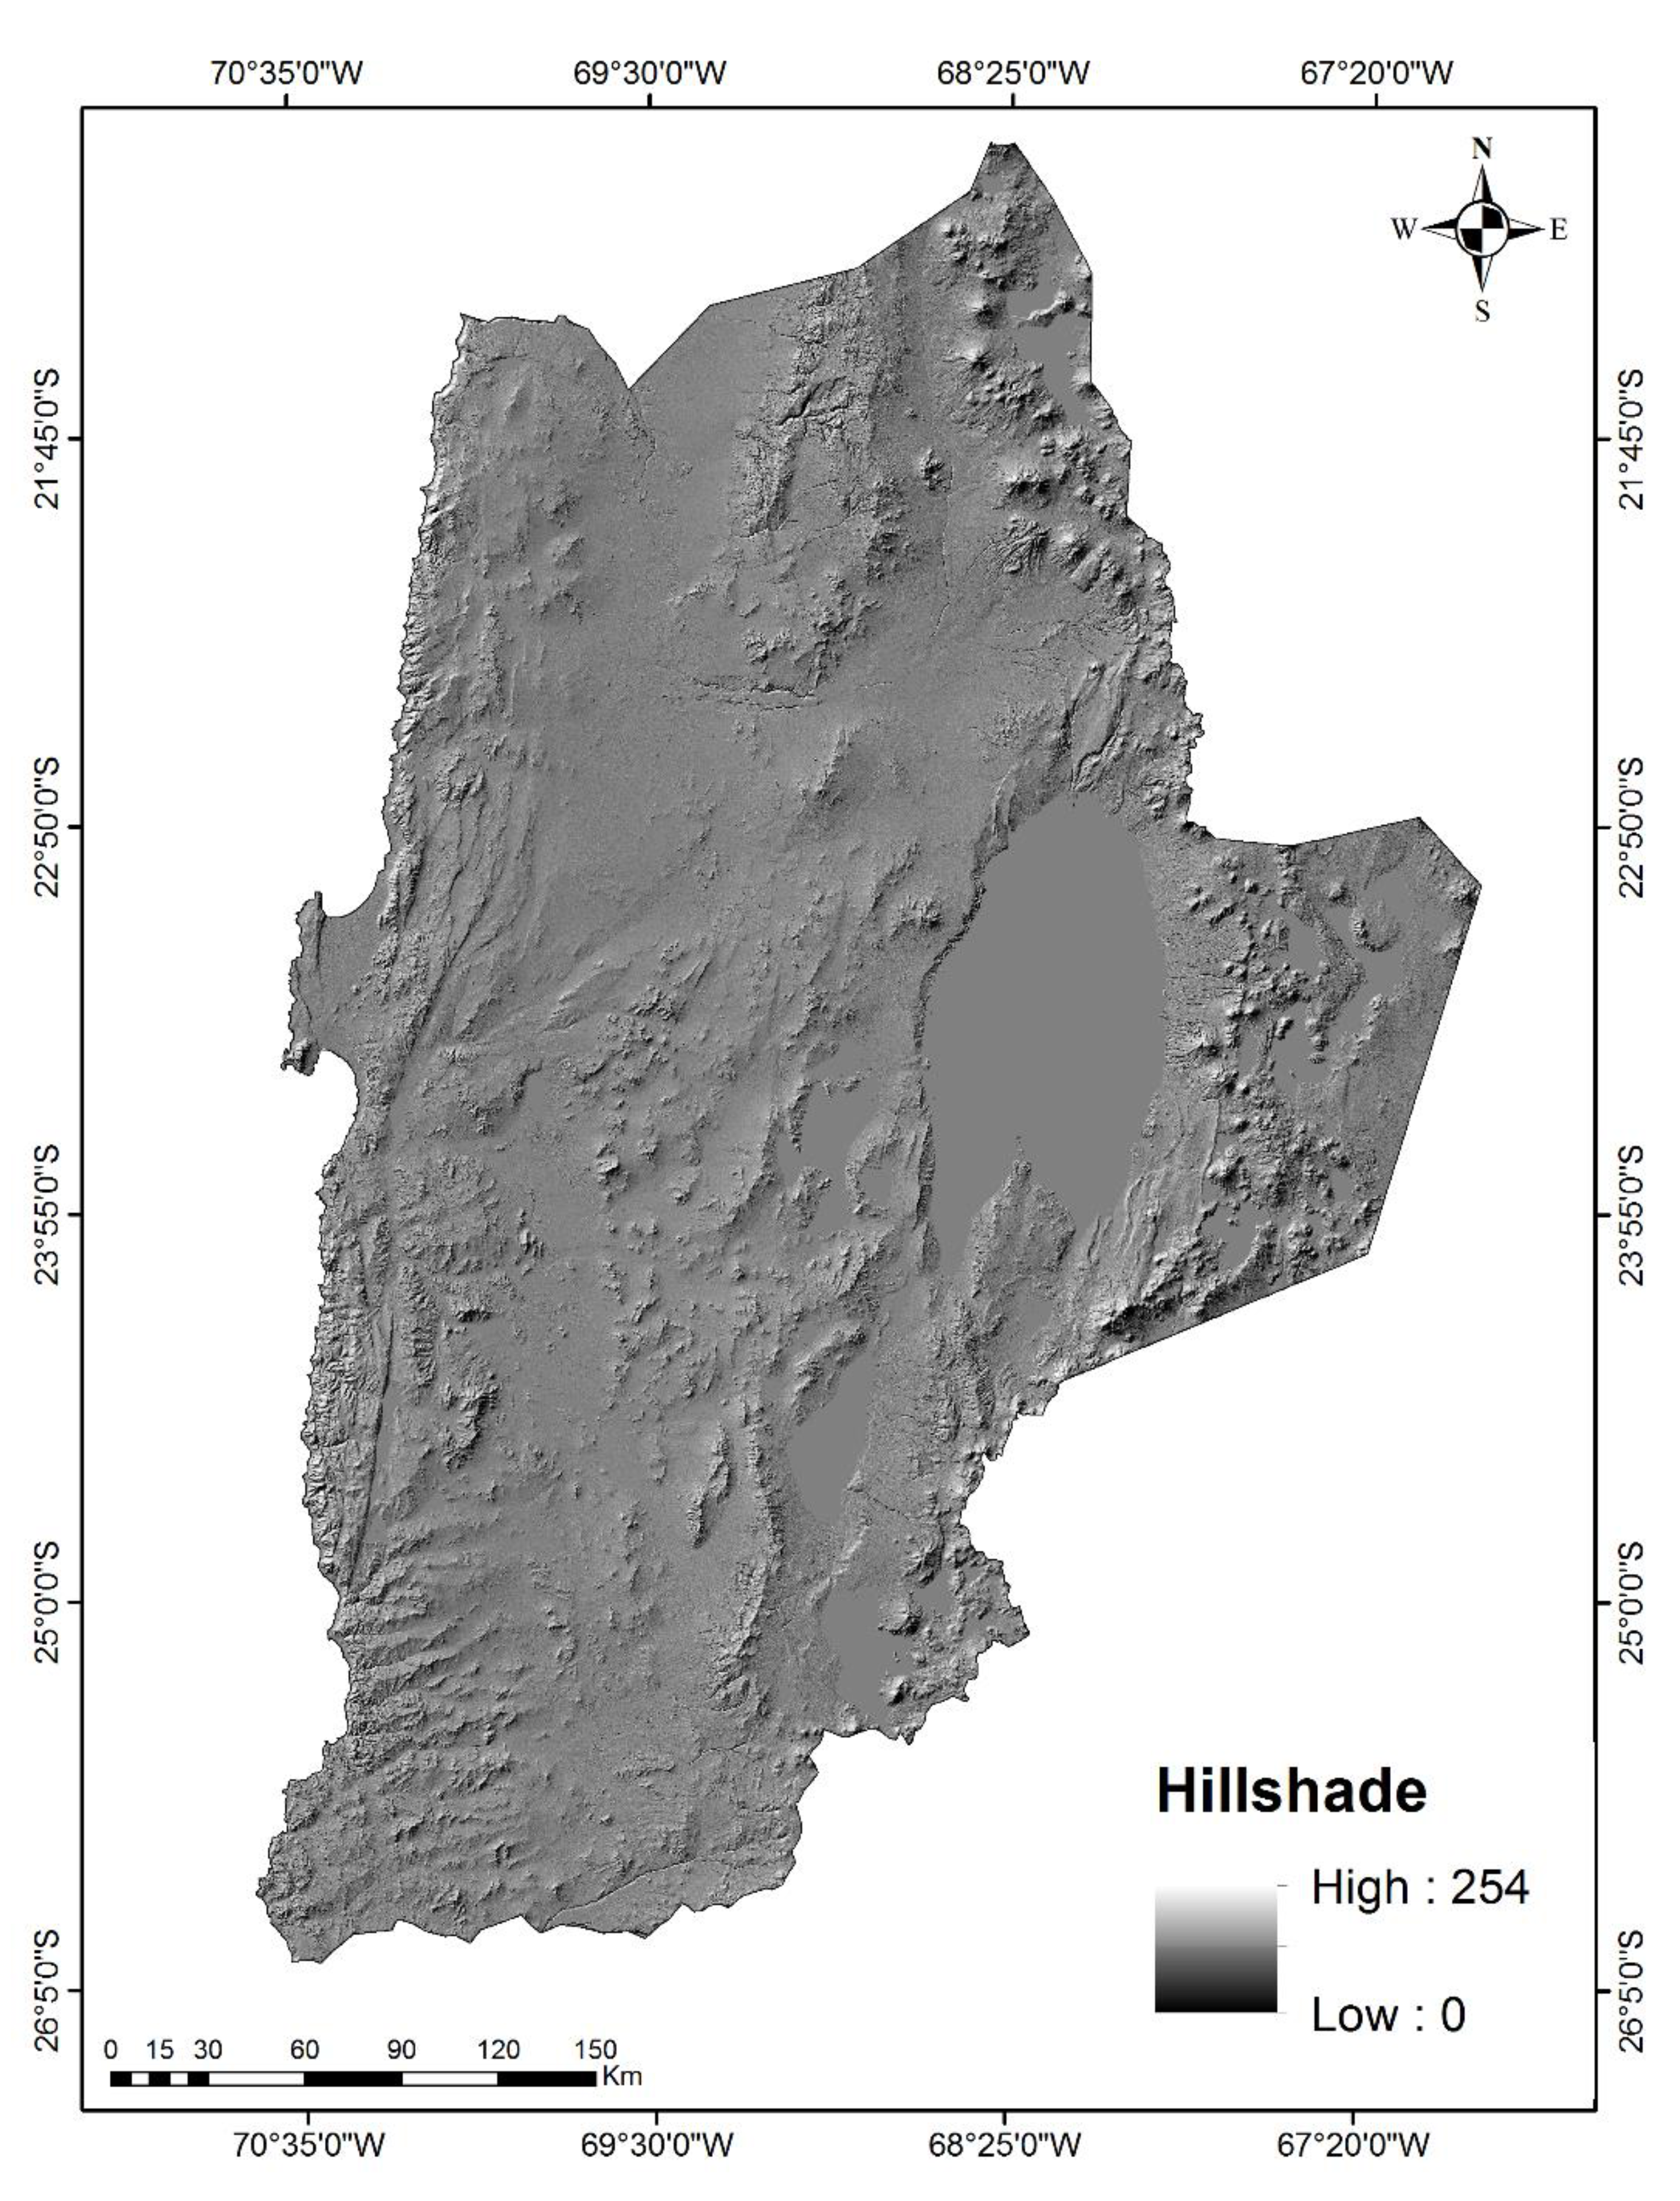
A hillshade is a 3D image (grayscale) of the surface, by the sun′s relative position considered for shading the image. This event uses the properties of altitude and azimuth to indicate the position of the sun, in this case, the standard value (Azimuth 315° and Altitude 45°) [29]. The sun altitude is 45°, and the sun azimuths are 0°, 45°, 90°, 135°, 180°, 225°, 270°, and 315° in the hillside map [30]. It provided important information to researchers to consider for the management of environmental matrices, such as landslide, groundwater potential mapping and others [29,30,31,32]. Figure 5 shows that the hillshade image of the Antofagasta region of Chile.
2.2.4. Aspect
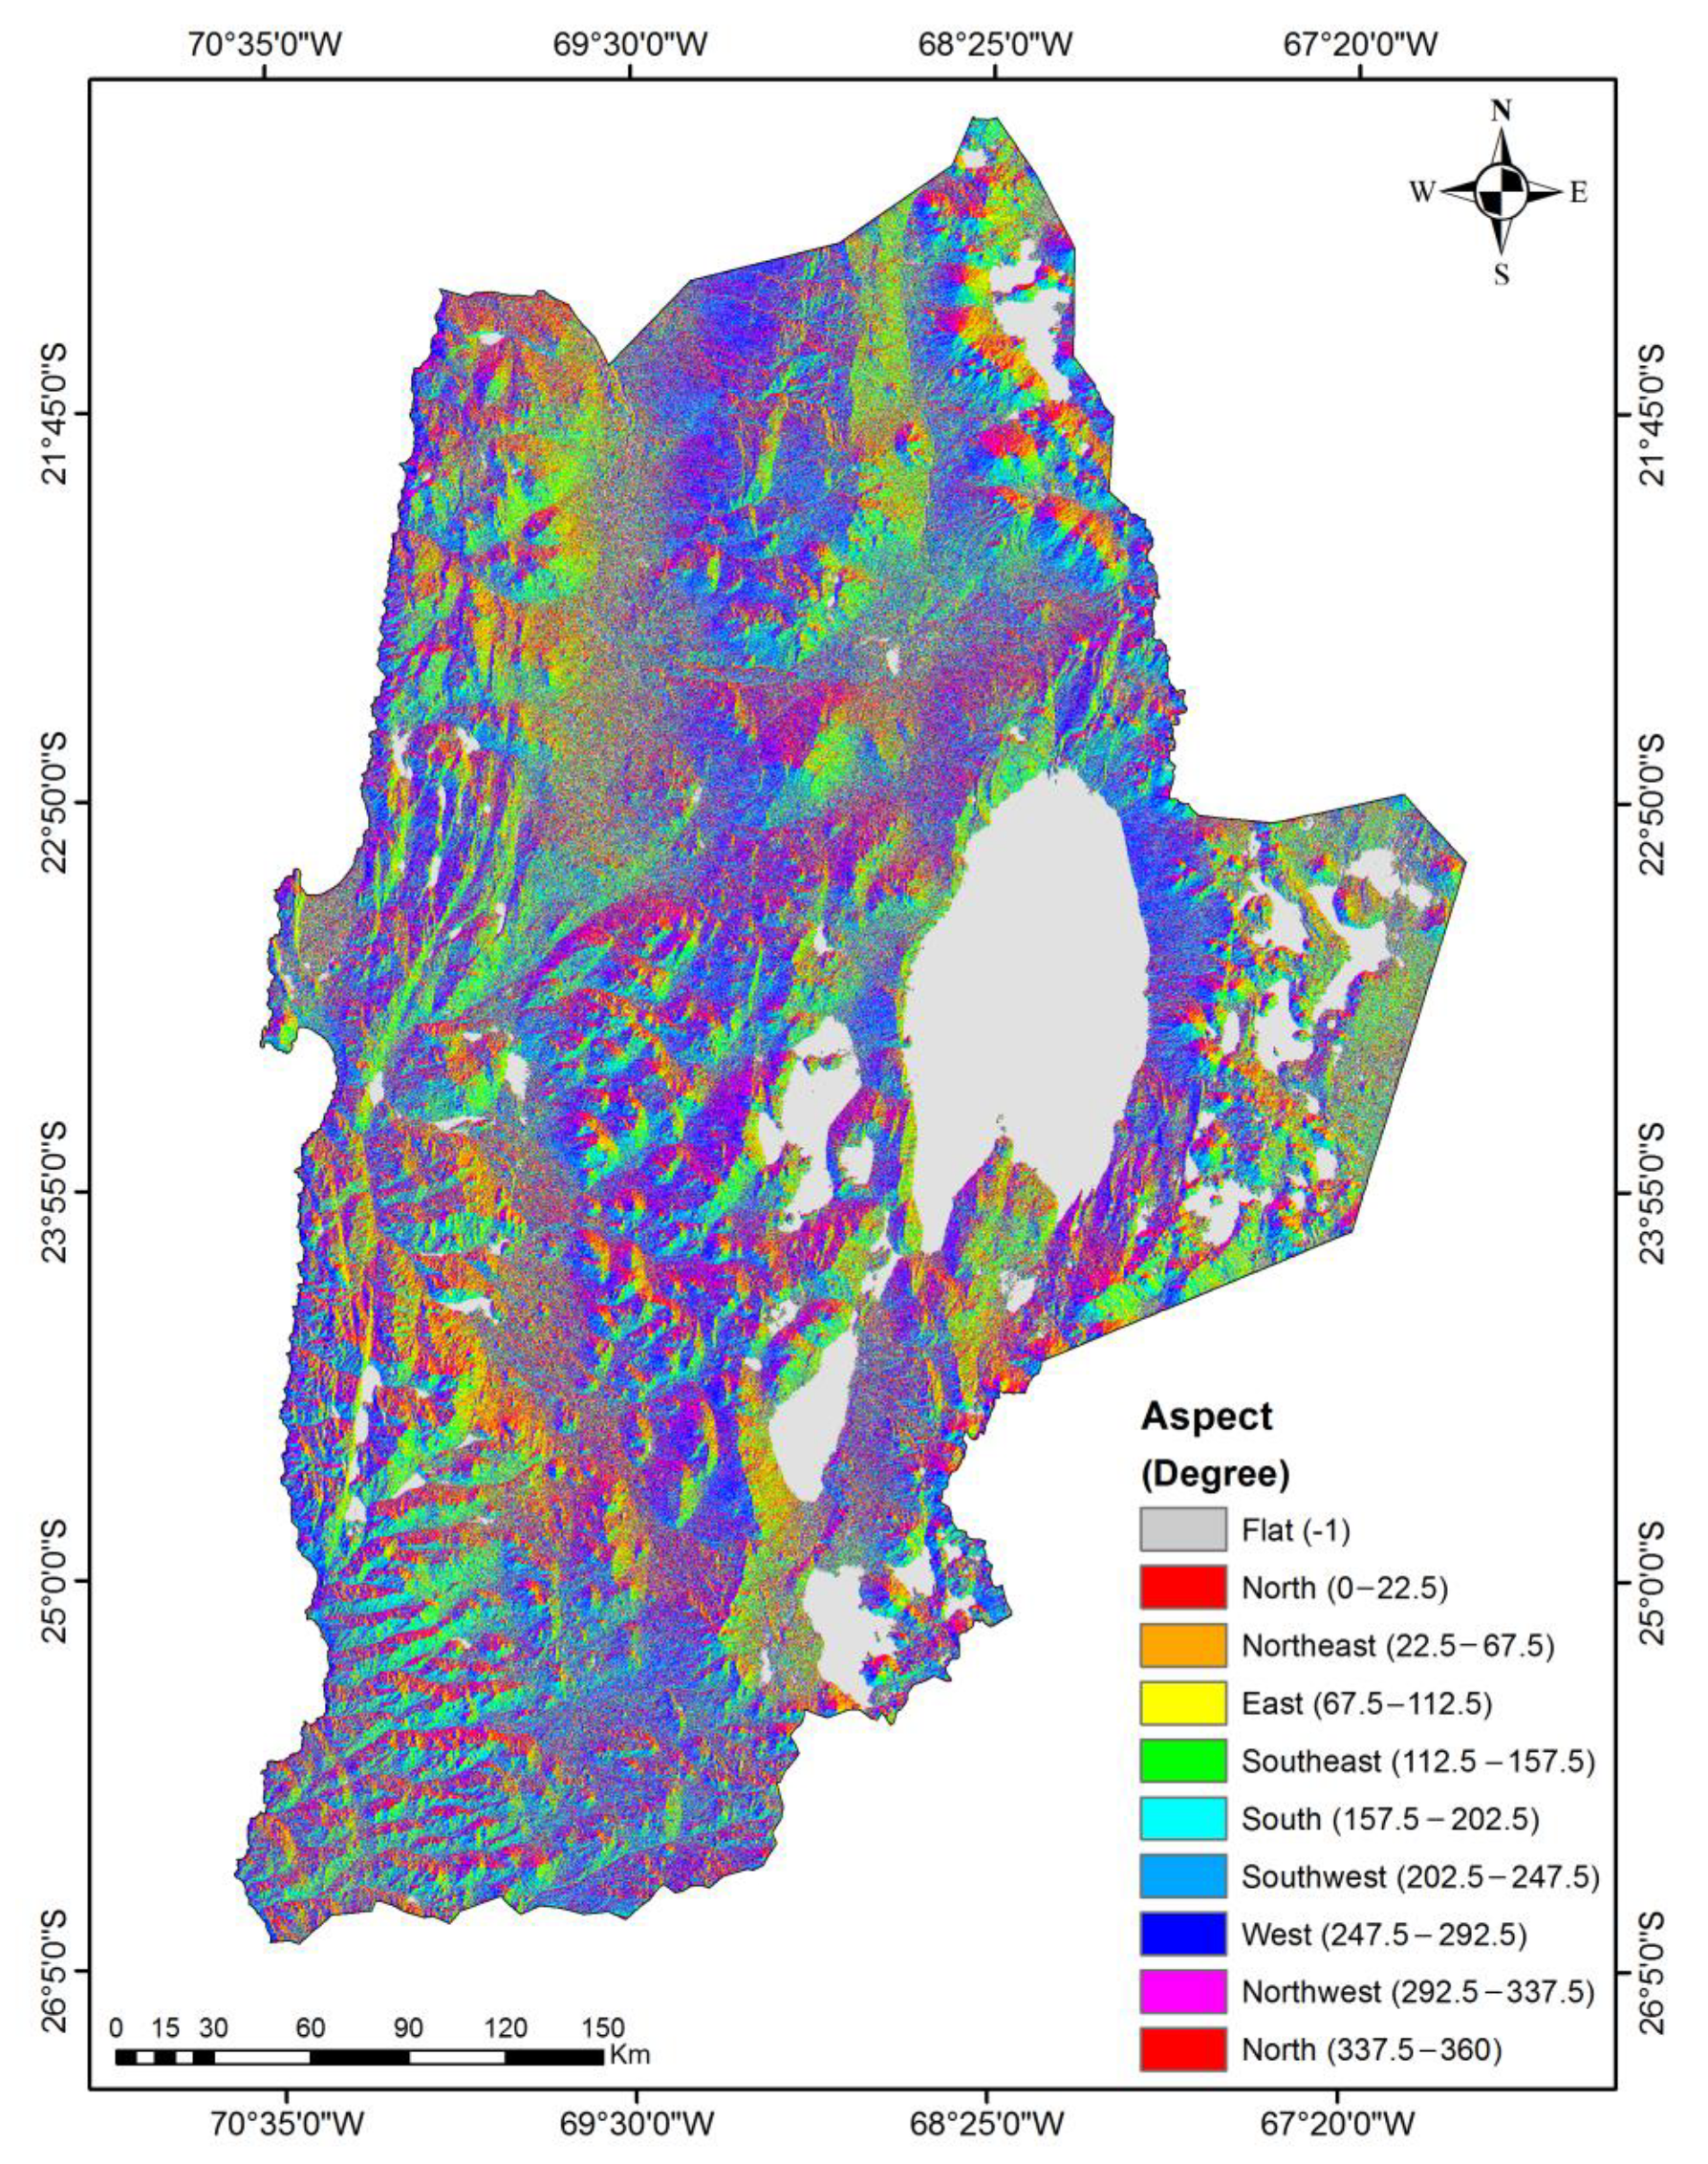
Aspect is the horizontal direction of the highest slope (i.e., the facing direction). It can convey as the actual number of the direction or can expressed as one of the nine key compass directions, such as flat, north (N), north-east (NE), east (E), south-east (SE), south (S), south-west (SW), west (W), and north-west (NW) [33]. Aspect is measured clockwise in degrees to 360 from the north. For environmental management, aspect can play an important role. Singh et al., [34] have considered aspect as a significant parameter to identify the potential groundwater recharge zones in New Zealand. Singh et al., [34] have described that the flat terrain receives less solar radiation than elevations with a northerly aspect and more than elevations with a southerly aspect. Due to this reason, flat terrain oblations a similar volume of solar radiation to elevations by a westerly and easterly aspect. Thereby, a southern aspect contributes most to percolation in the recharging of groundwater as compared to the northern aspect. Because northern slopes are considered to contribute minimum to recharge due to higher evapotranspiration that reduces the amount of water for percolation [34]. The Antofagasta region has 14.1% of the area in the west direction, 8.1% of the area in the east direction and 12% of the area is flat, while 33.4% of the area has north, northeast and northwest direction and has 32.4% of the area with south, southeast and southwest direction, respectively (Table 1, Figure 6).
2.2.5. River Basin
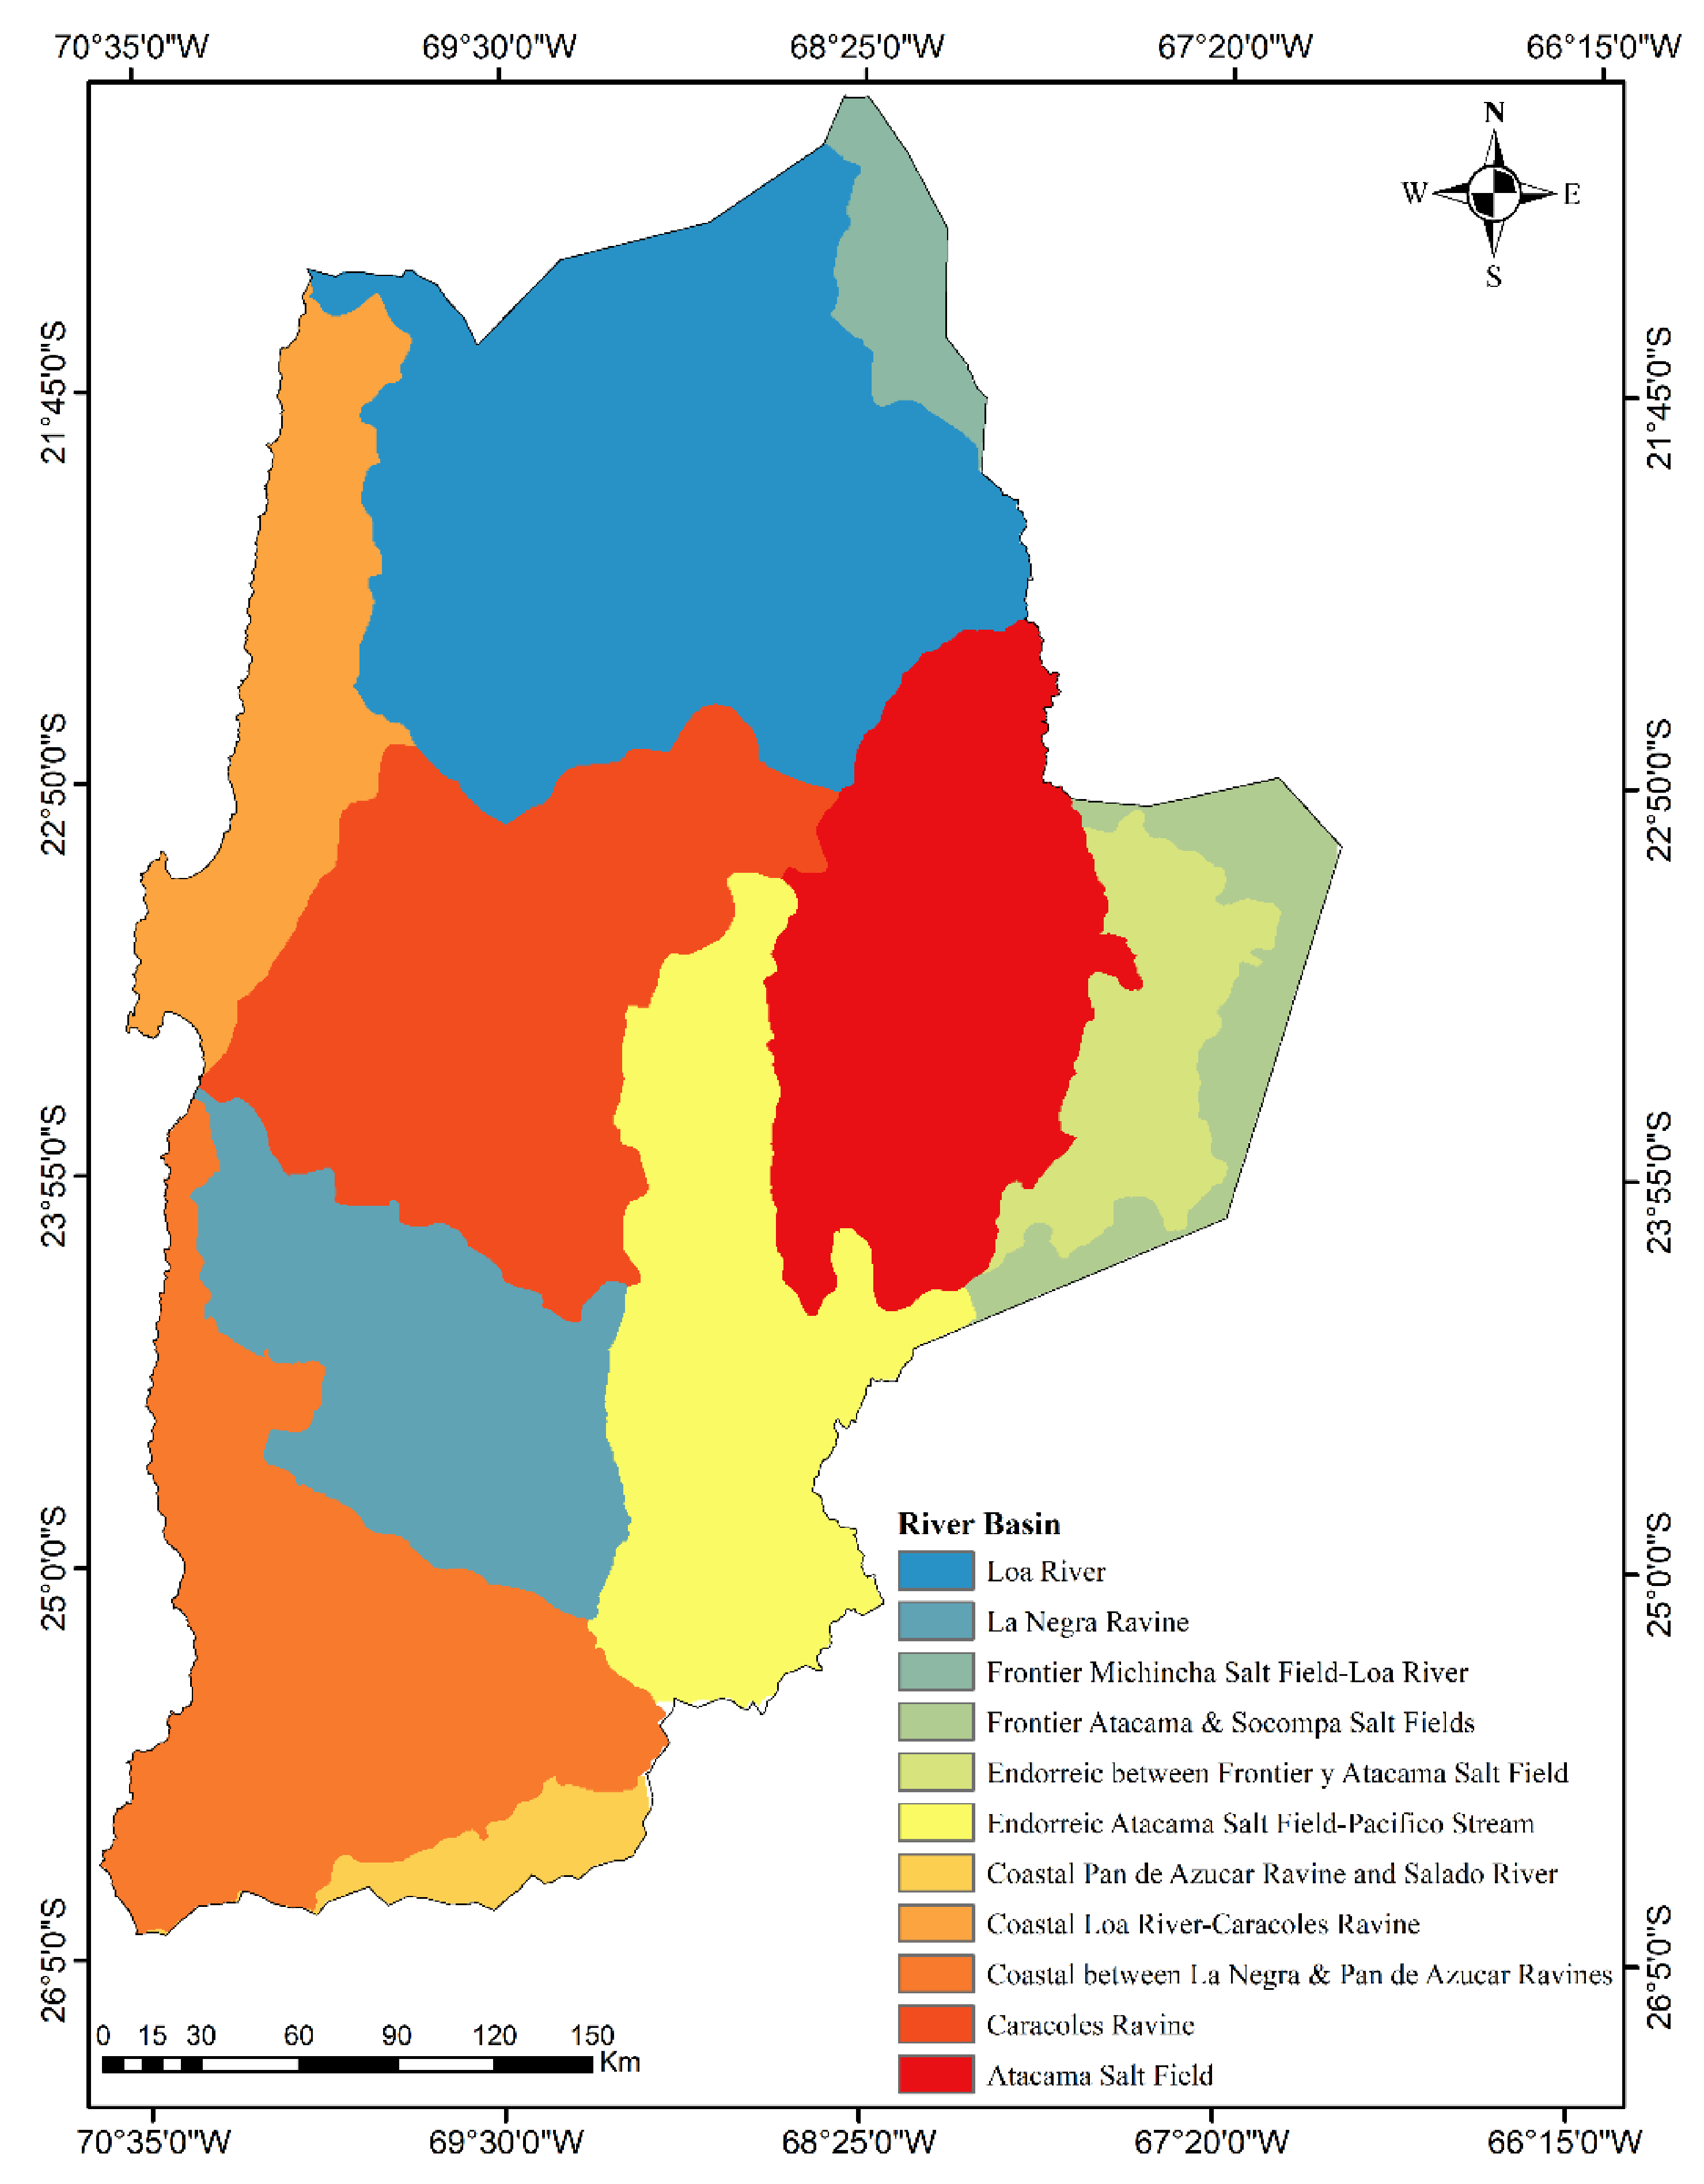
A region of land drained by a river and its tributaries is called a river basin and it has some typical characteristics, such as a watershed, confluence, starting source of the river among others. To make a proper decision for water resources use, planning, and management within the river basin, information on the river′s hydrological system is essential [35]. Furthermore, the river basin study plays an important role to make a strong scientific decision for environmental management in the different research fields. The Antofagasta region has 11 important major and minor river basin system in the area (Figure 7). Around 21.5% of the area has covered by the Loa river basin of the region and followed by the Caracoles basin (14.5%), La Negra and Pan de Azucar Ravine (13.4%), and the Endorreic Atacama Salt Field-Pacifico Stream basin (11.5%). Moreover, other basins in the region have covered the rest of the area, respectively (Table 1).
2.2.6. Drainage Systems
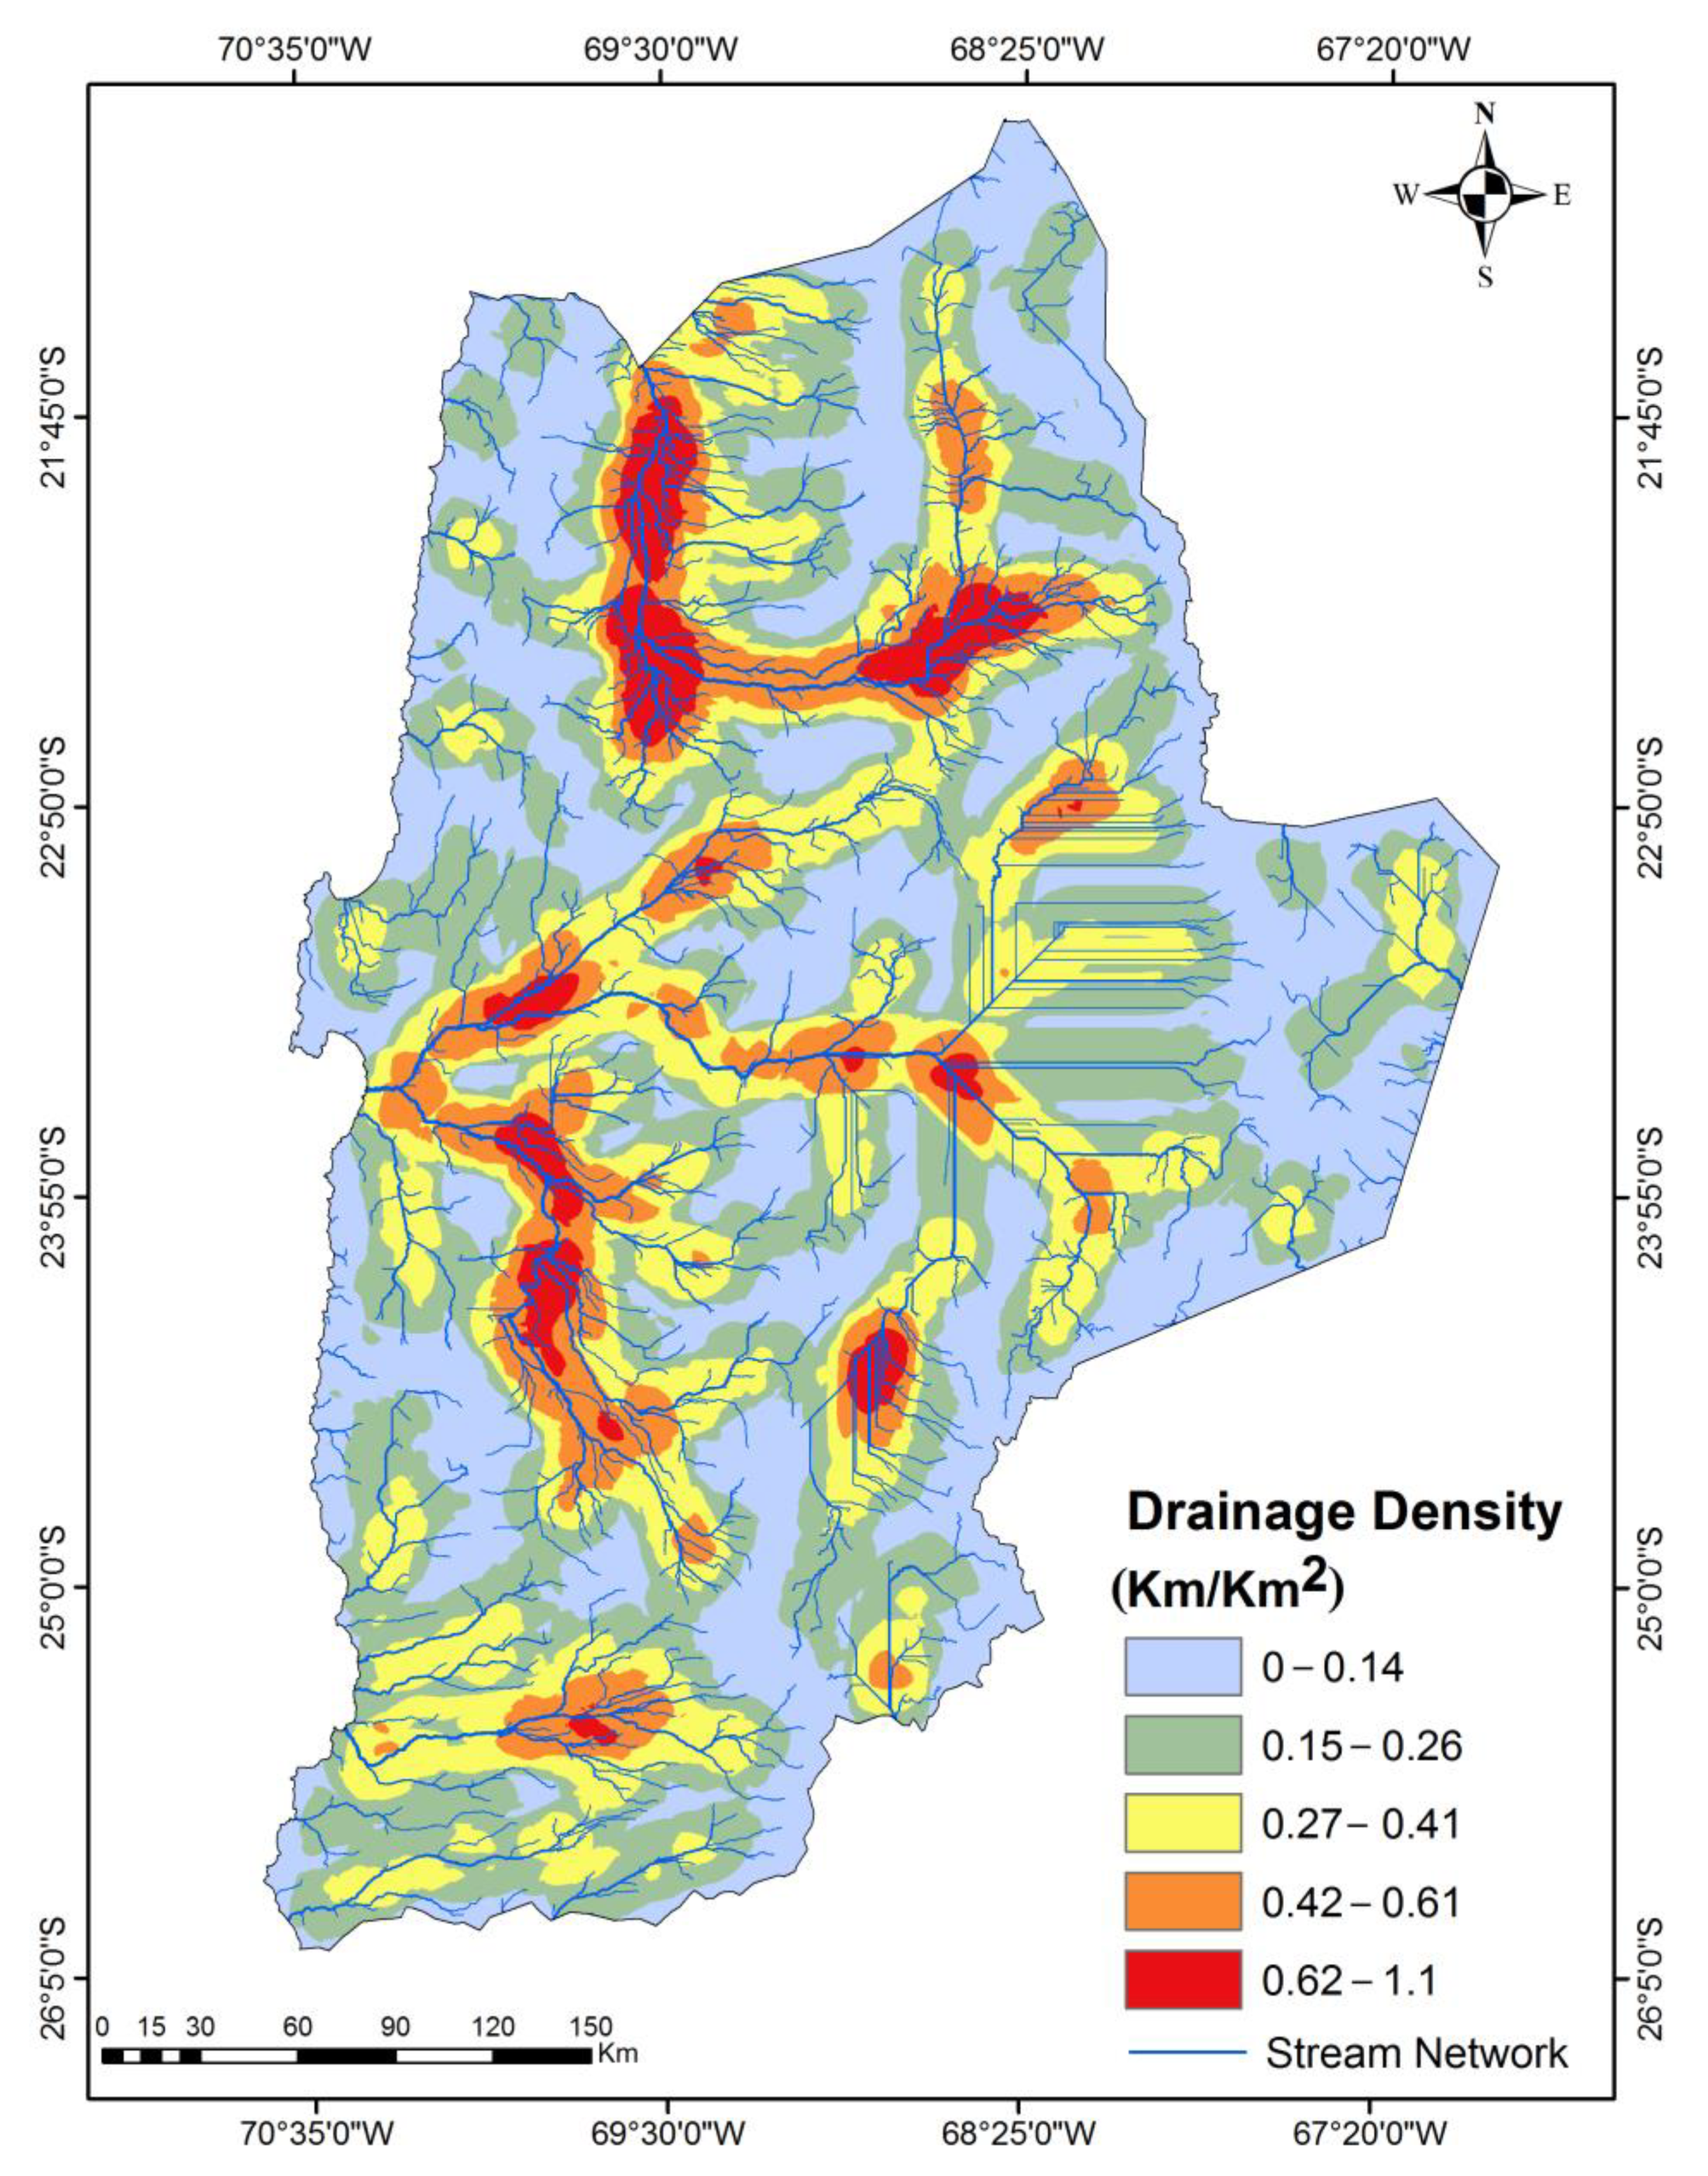
Drainage systems are an essential part of the geomorphology and formed by the rivers, streams and lakes in a specific drainage basin. Drainage systems also well-known as river systems and controlled by the topography and gradient of the land. Drainage systems can fall into one of the numerous types recognized as drainage patterns. Drainage patterns are categorized based on their form and texture. Their pattern builds in response to the subsurface geology and local topography of the basin. Zernitz et al., [36] has described details about drainage patterns and their significance importance. Drainage can play a significant role in any area′s water resources management [21,37,38]. Chowdhury et al., [39] suggested that drainage density can indirectly reveal the suitability for groundwater recharge of any area due to its association by surface runoff and permeability. Hence, drainage density can be considered one of the important factors for identifying artificial groundwater recharge zones. Lower drainage density is considered a good recharge category compared to the high drainage density. The region of Antofagasta mostly has a dendritic drainage pattern (Figure 8). Furthermore, the region′s drainage density varied from 0.0 to 1.1 Km/Km2 and more than half (64.1%) of the area between 0.0—0.26 Km/Km2 and the rest of the region has a value above the 0.26 Km/Km2 (Table 1).
2.2.7. Geology
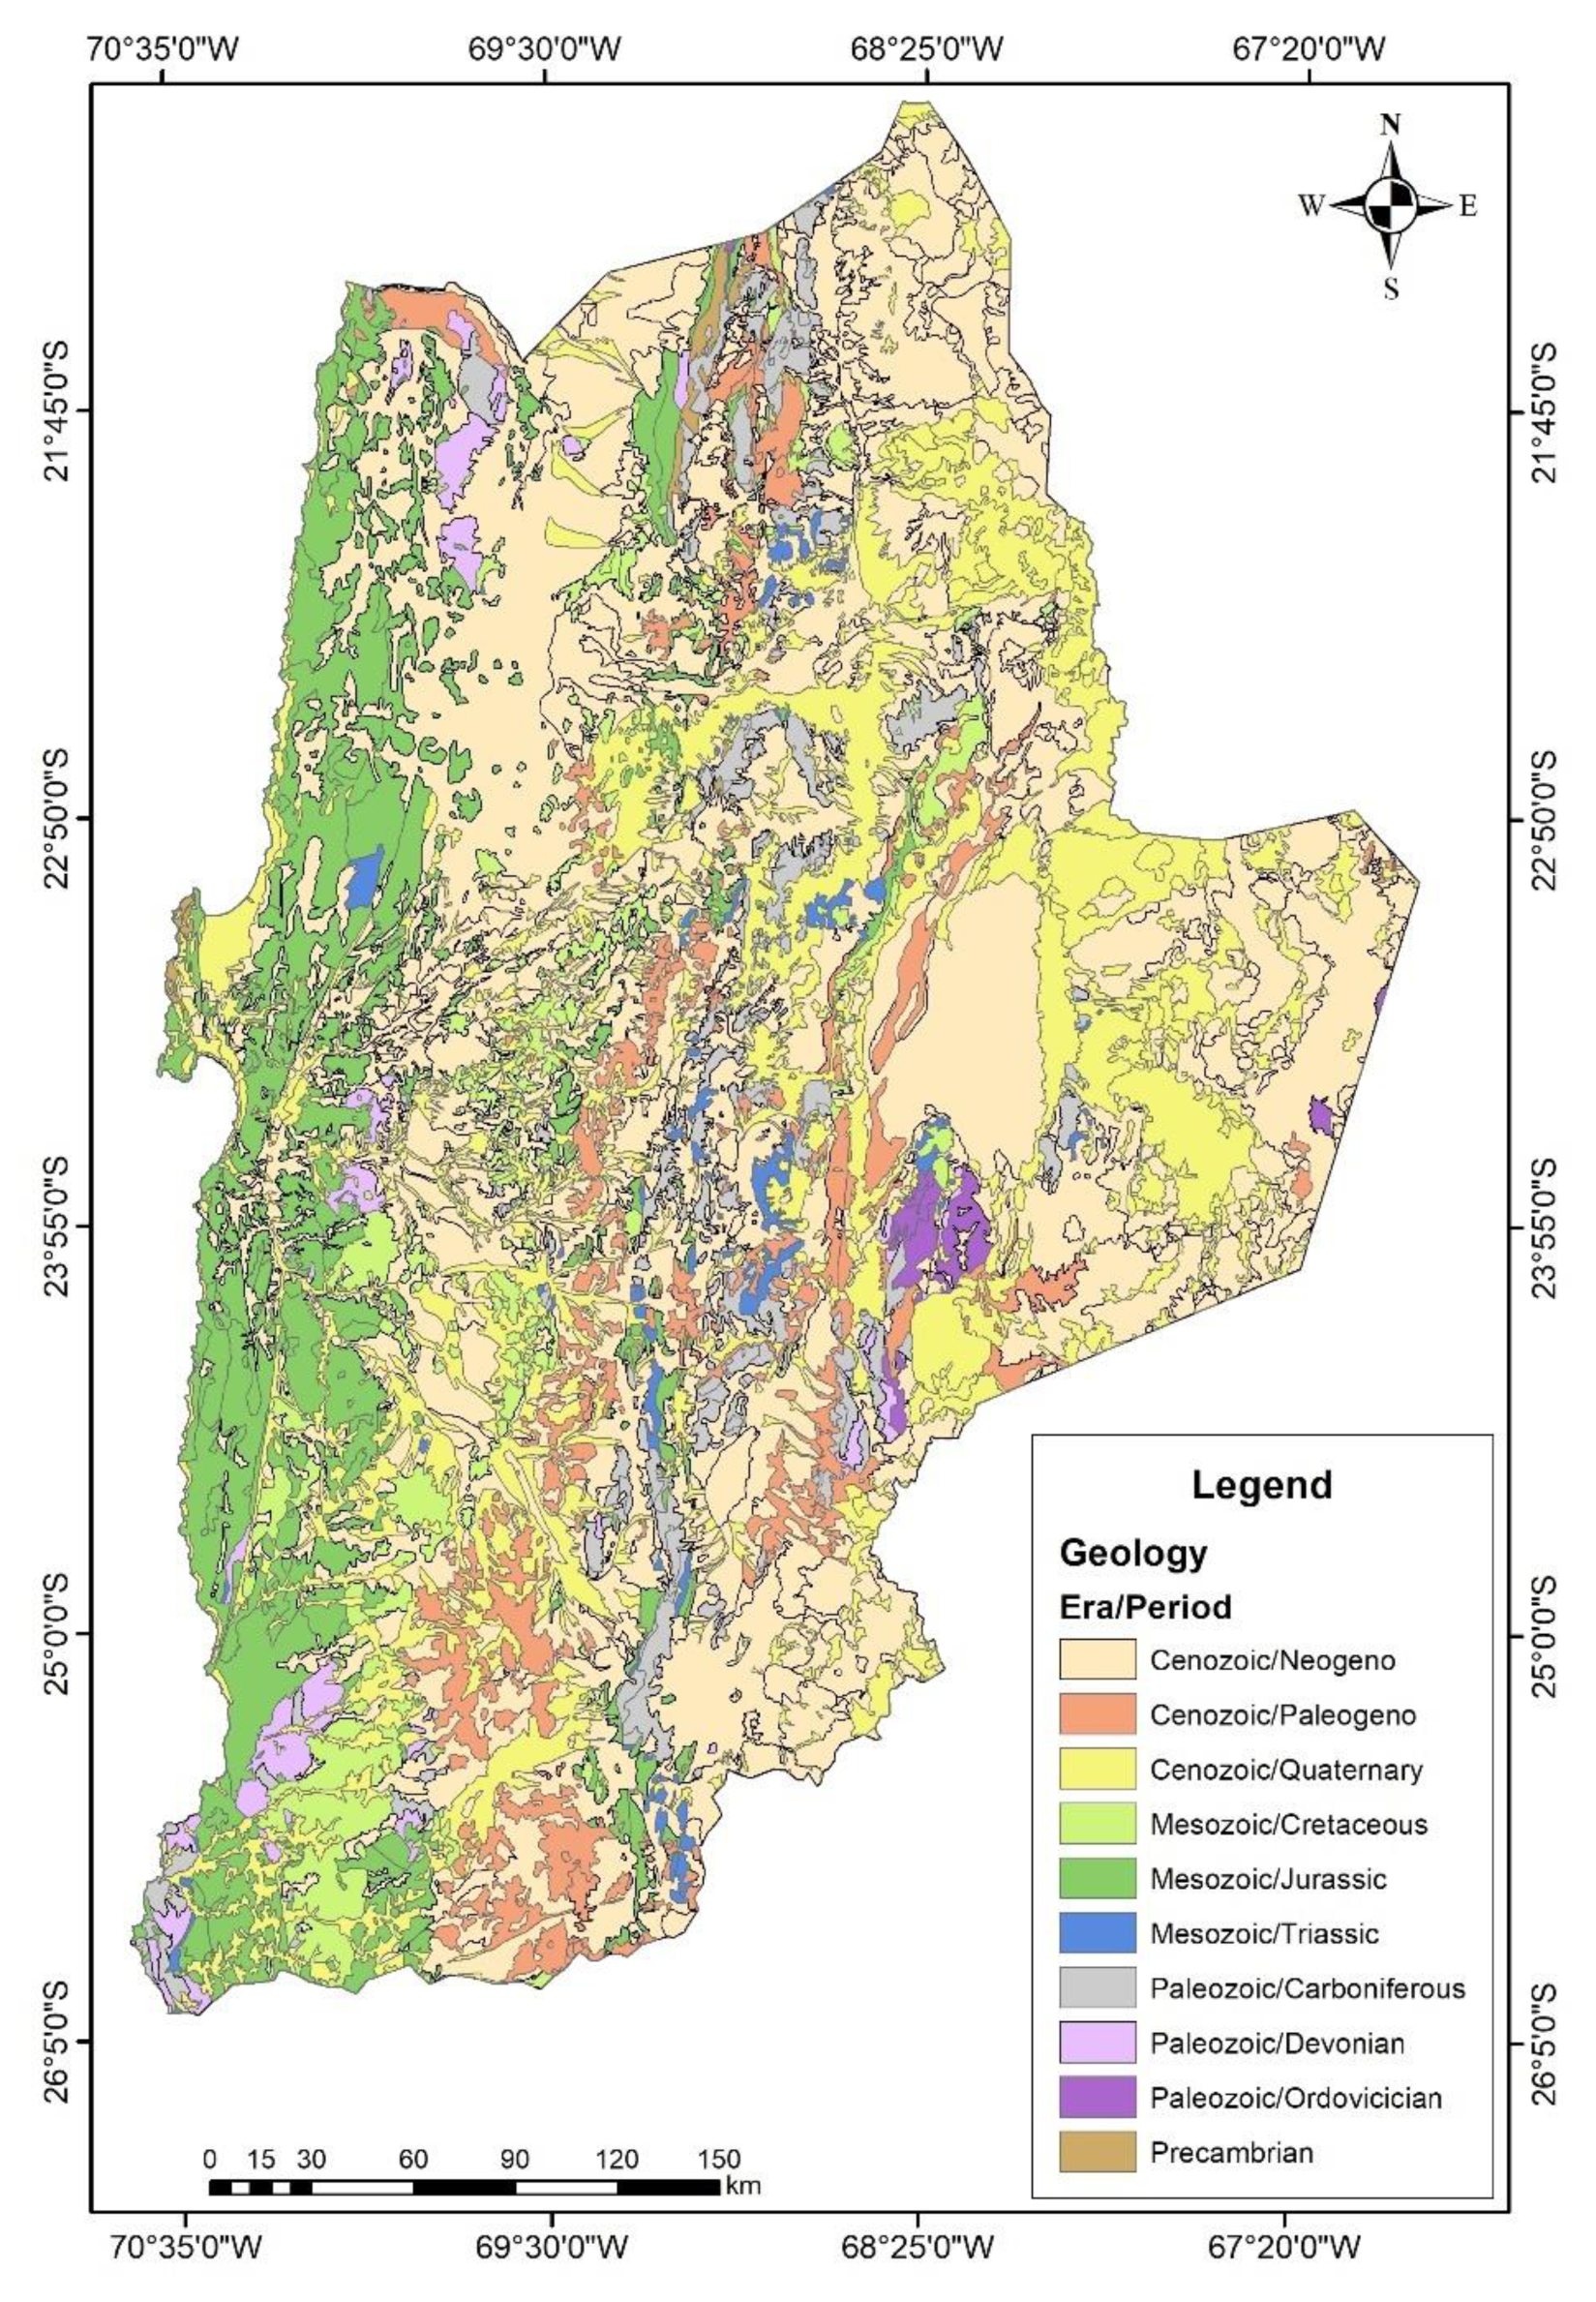
Special attention is needed to protect recharge areas in dense urban, agricultural and heavy industrial areas [40]. Furthermore, [40] has suggested that the protection can depend on the aquifer types and its geological cover. The geological formations are having a significant relationship with the recharging of aquifers. In the present study, the Antofagasta region has complex geology with several geological environments (Supplementary Figure S1). Therefore, complex geology of the study area has divided into four eras and nine periods (Figure 9). The three geological environments, such as the clastic sedimentary sequences of piedmont, alluvial, colluvial or fluvial (MP1c), the alluvial deposits, subordinately colluvial or lacustrine (Qa) and the sedimentary sequences of an alluvial, pediment or fluvial fans (M1c) are coved more than 40% of the area of the Antofagasta region (Supplementary Figure S1).
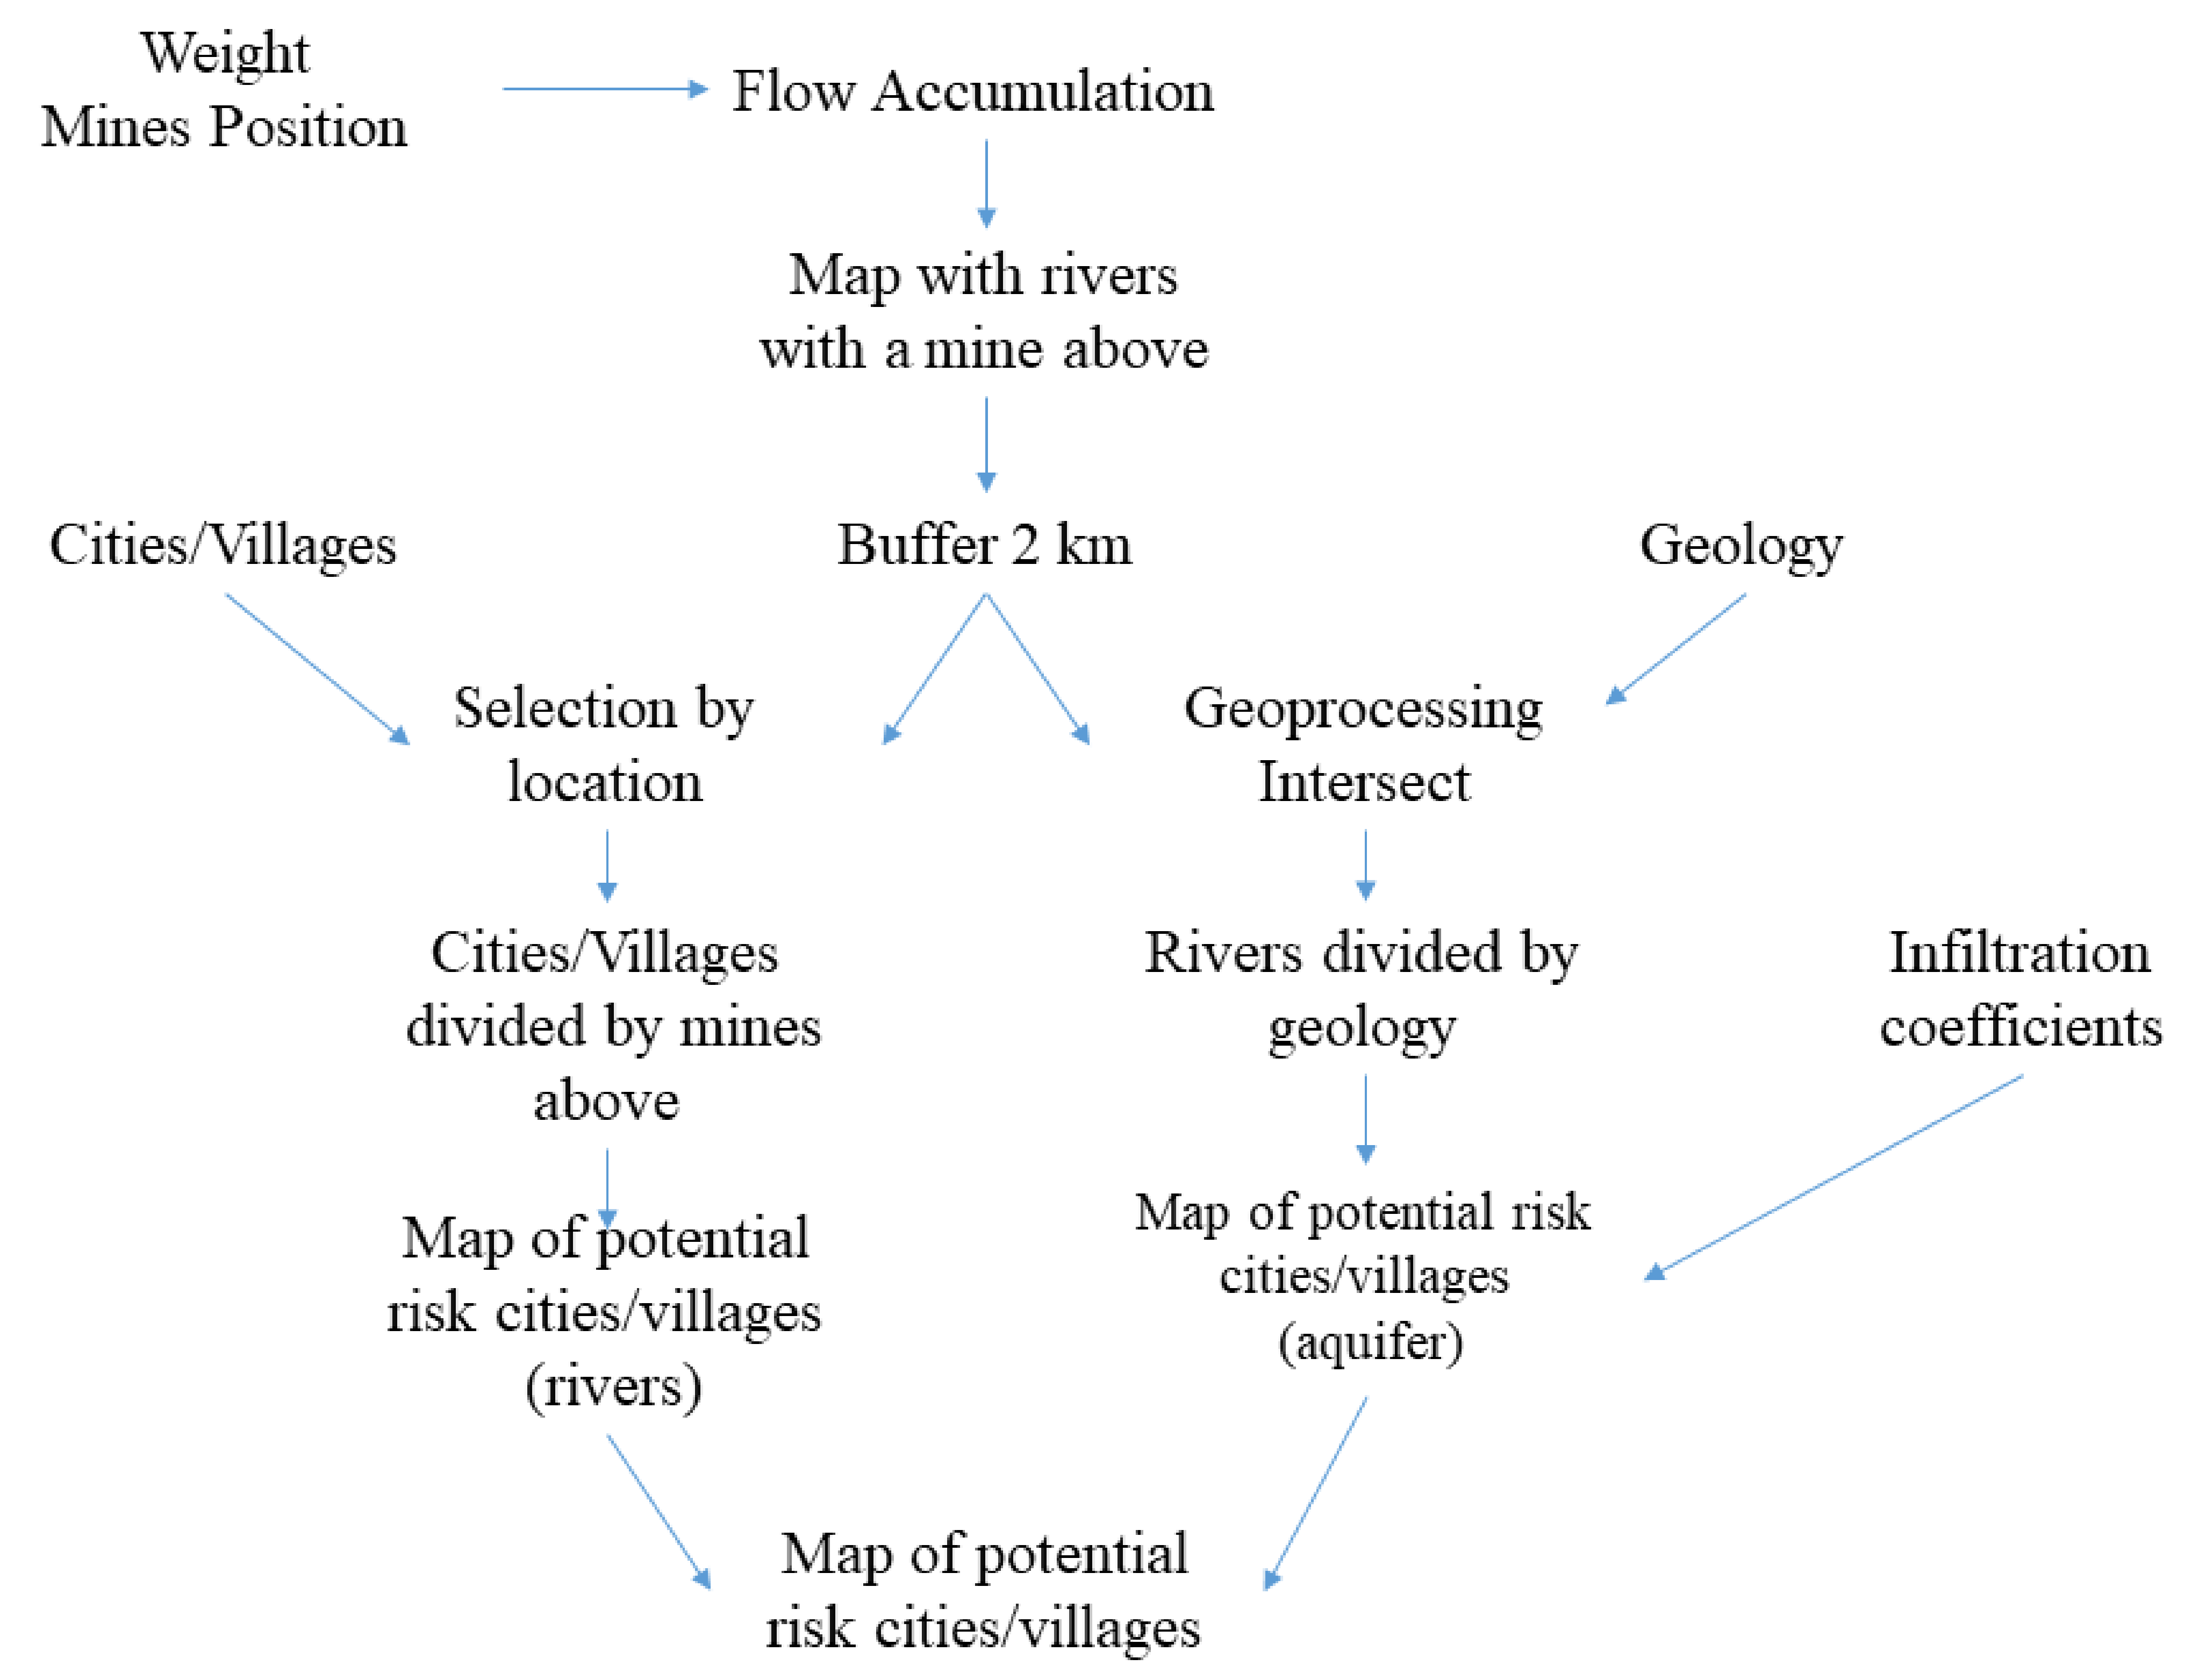
2.3. Pollution Level Risk Identification
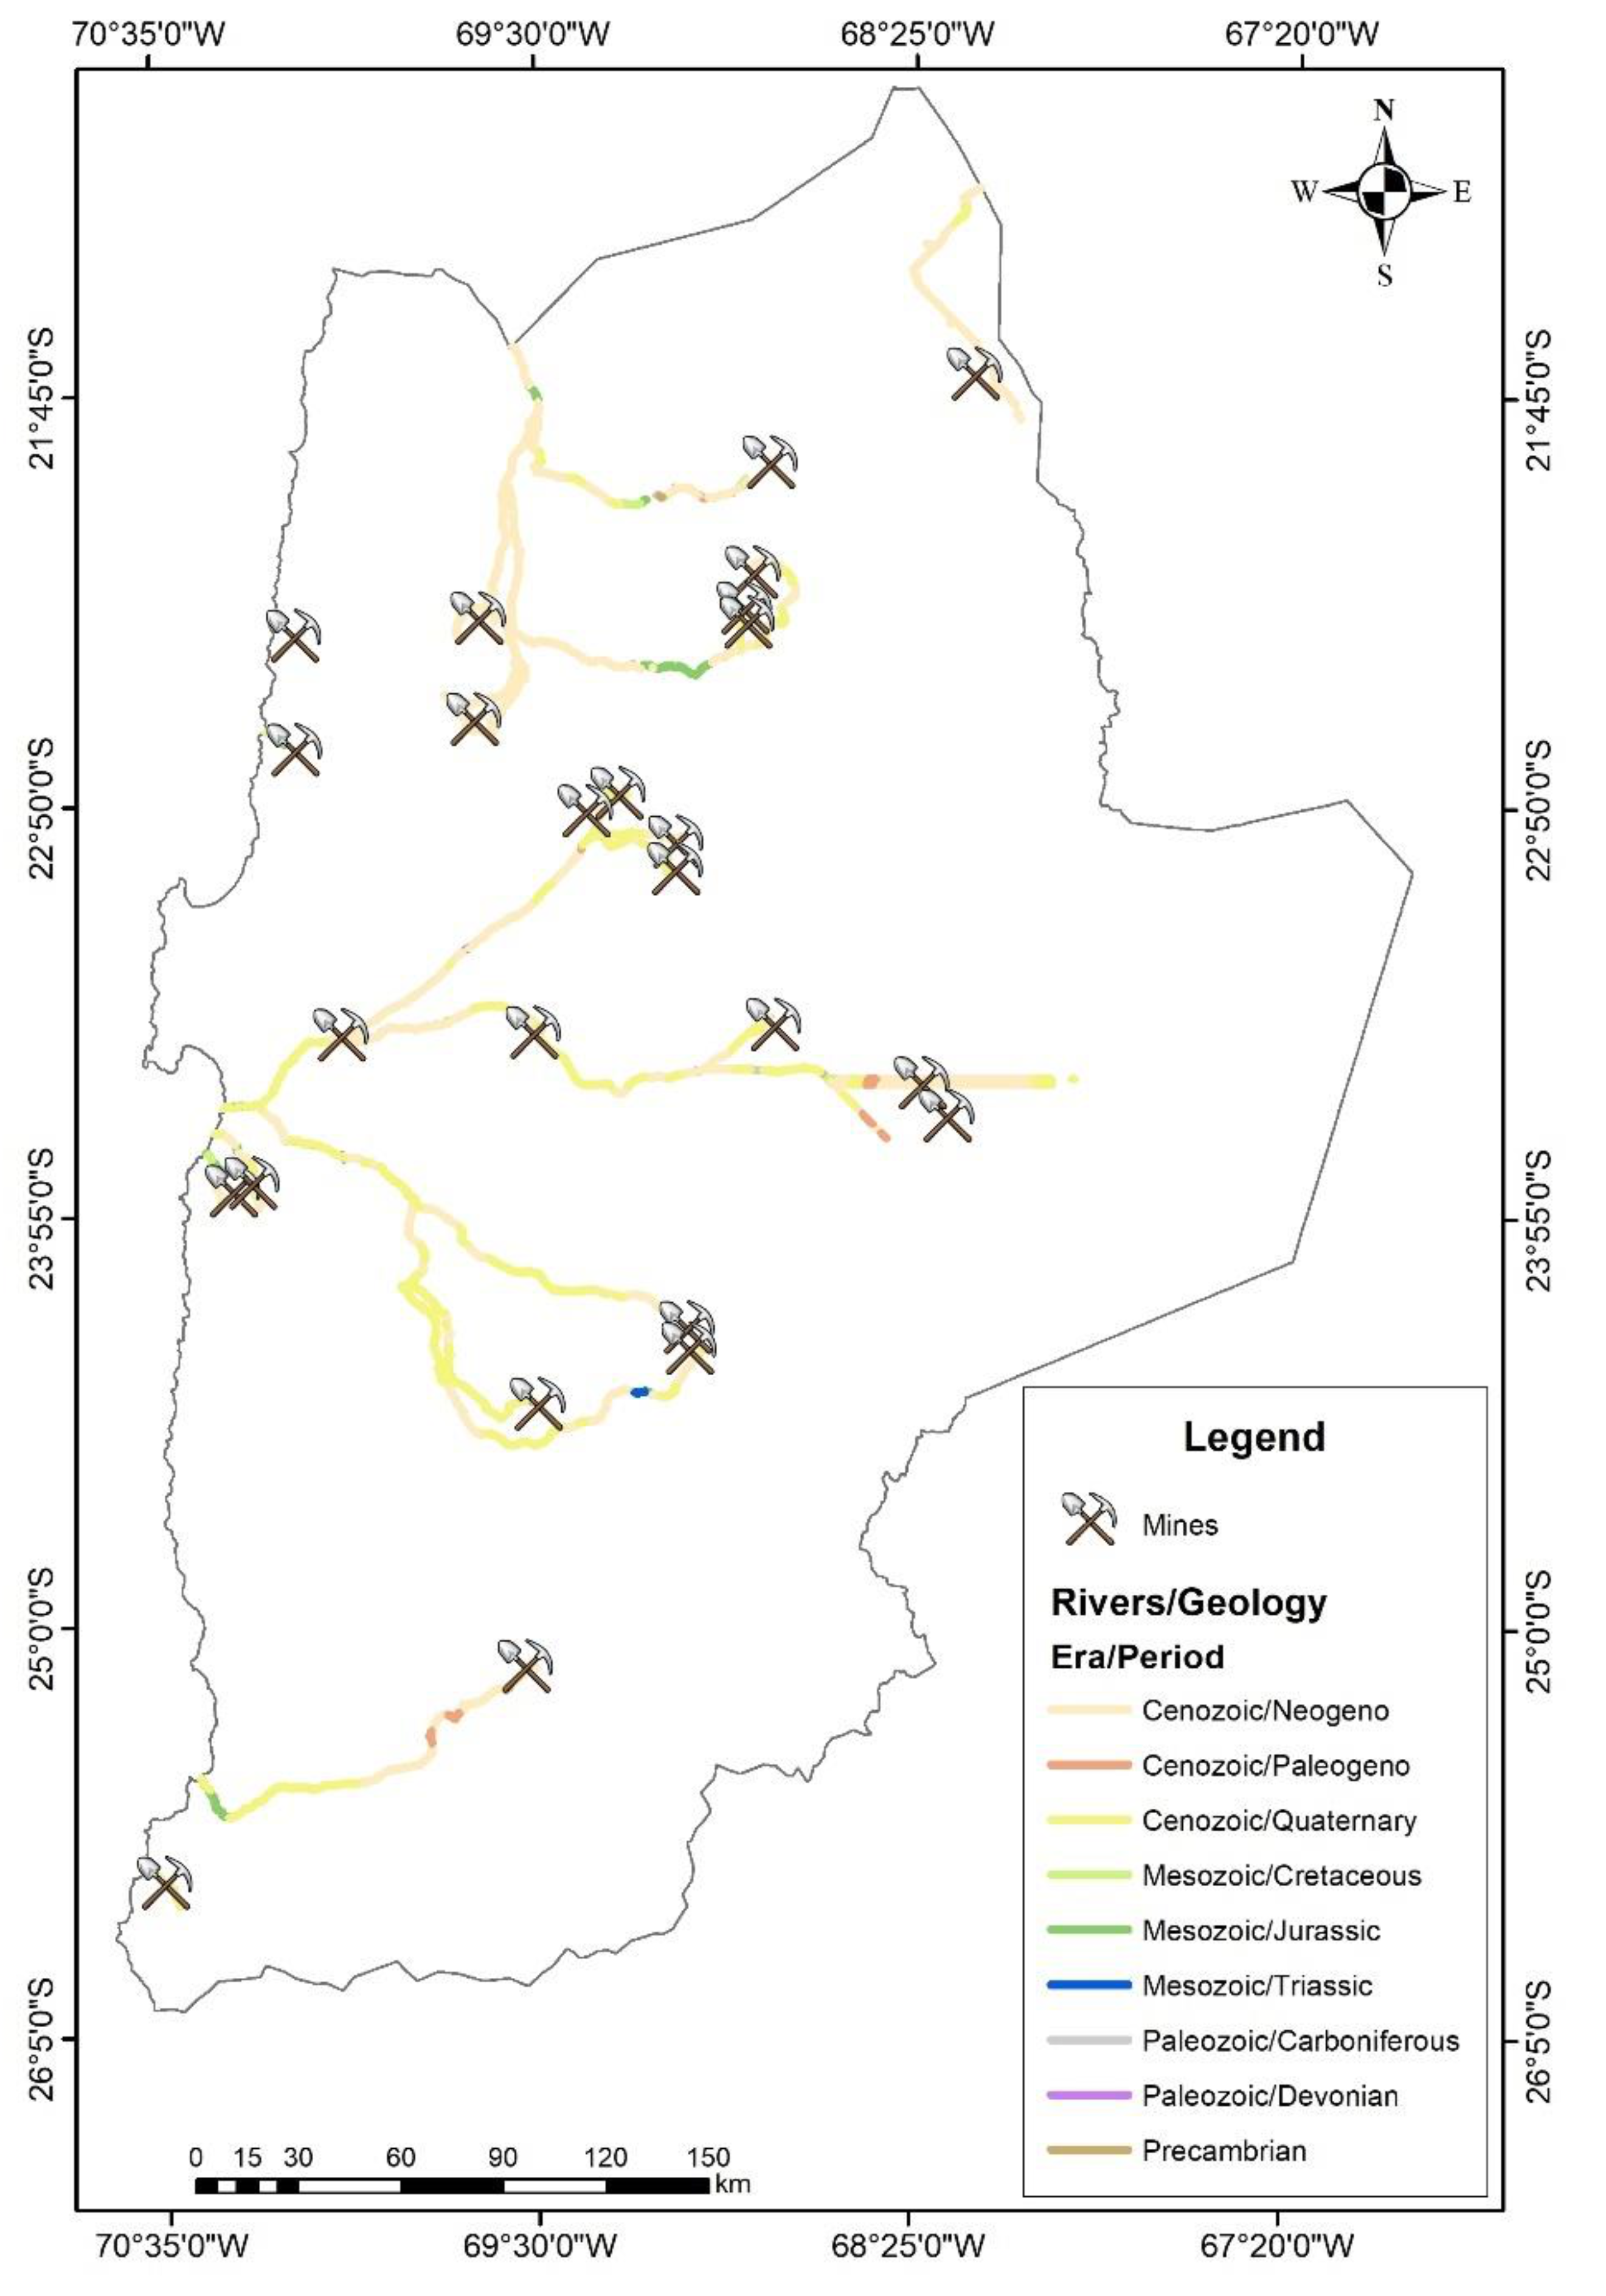
Starting from the previous data and adding the pollution factors (mines) and the elements at risk (cities and villages), it will be possible to identify which areas need a priority study in the case of water resource management. With the proposed methodology, which derives from the use of different techniques of watercourses and aquifer vulnerability analysis as DRASTIC [41], SINTACS [42], GOD [43], it is possible to investigate the different river stretches and how they may contaminate both underground water and be a potential risk factor for population and crops. At the end of the procedure, it will be possible to understand which cities have the most critical conditions indicated by colors ranging from green to red, as well as which stretches of river have the greatest probability of polluting the underlying aquifer. The infiltration recharge is an important parameter that plays a significant role in assessing aquifer vulnerability because it helps transport the pollutant to the aquifer [42]. Therefore, a part of the SINTACS method (infiltration recharge calculation) was applied in a GIS environment to achieve the present research′s second objective (Figure 10). Detail about the role and important of SINTACS parameters in aquifer vulnerability assessment are described elsewhere [42]. In the present study, the potential infiltration index was assigned based on the area′s bibliography and geological reports. The potential infiltration index was used in the SINTACS method to estimate net recharge of the area, through the inverse water budget [44,45,46,47]. The potential infiltration coefficient XR (that can assume values between 0 and 1) was estimated on the surface lithology of the hydrogeological complex, and other parameters that depend on different lithology characteristics [48]. Each lithological formation represented by era and period in Figure 11 has been divided by type of complex and a potential infiltration coefficient has been assigned to each one. Therefore, the final potential infiltration index for each lithology was assigned based on the type of complex, the average value of the complex derived by the bibliography [49], and the area′s geological era.
3. Results and Discussions
Much of the drinking water in the Antofagasta region comes from treatment plants. As a result, much of the water from the mines have to be treated to be made drinkable. However, irrigation systems pump water directly from the aquifer that is fed by rivers. Therefore, it is necessary to analyze the main watercourses in relation to the cities served by the number of upstream mines and the geological era/period of the study area (Figure 11). Moreover, detail about the upstream mines and the lithology in which they have their beds is shown in Supplementary Figure S2. This expeditious methodology made it possible to identify which areas could be a source of aquifer recharge and which cities/villages were more at risk if they had to use the water from the rivers/stream for different purposes.
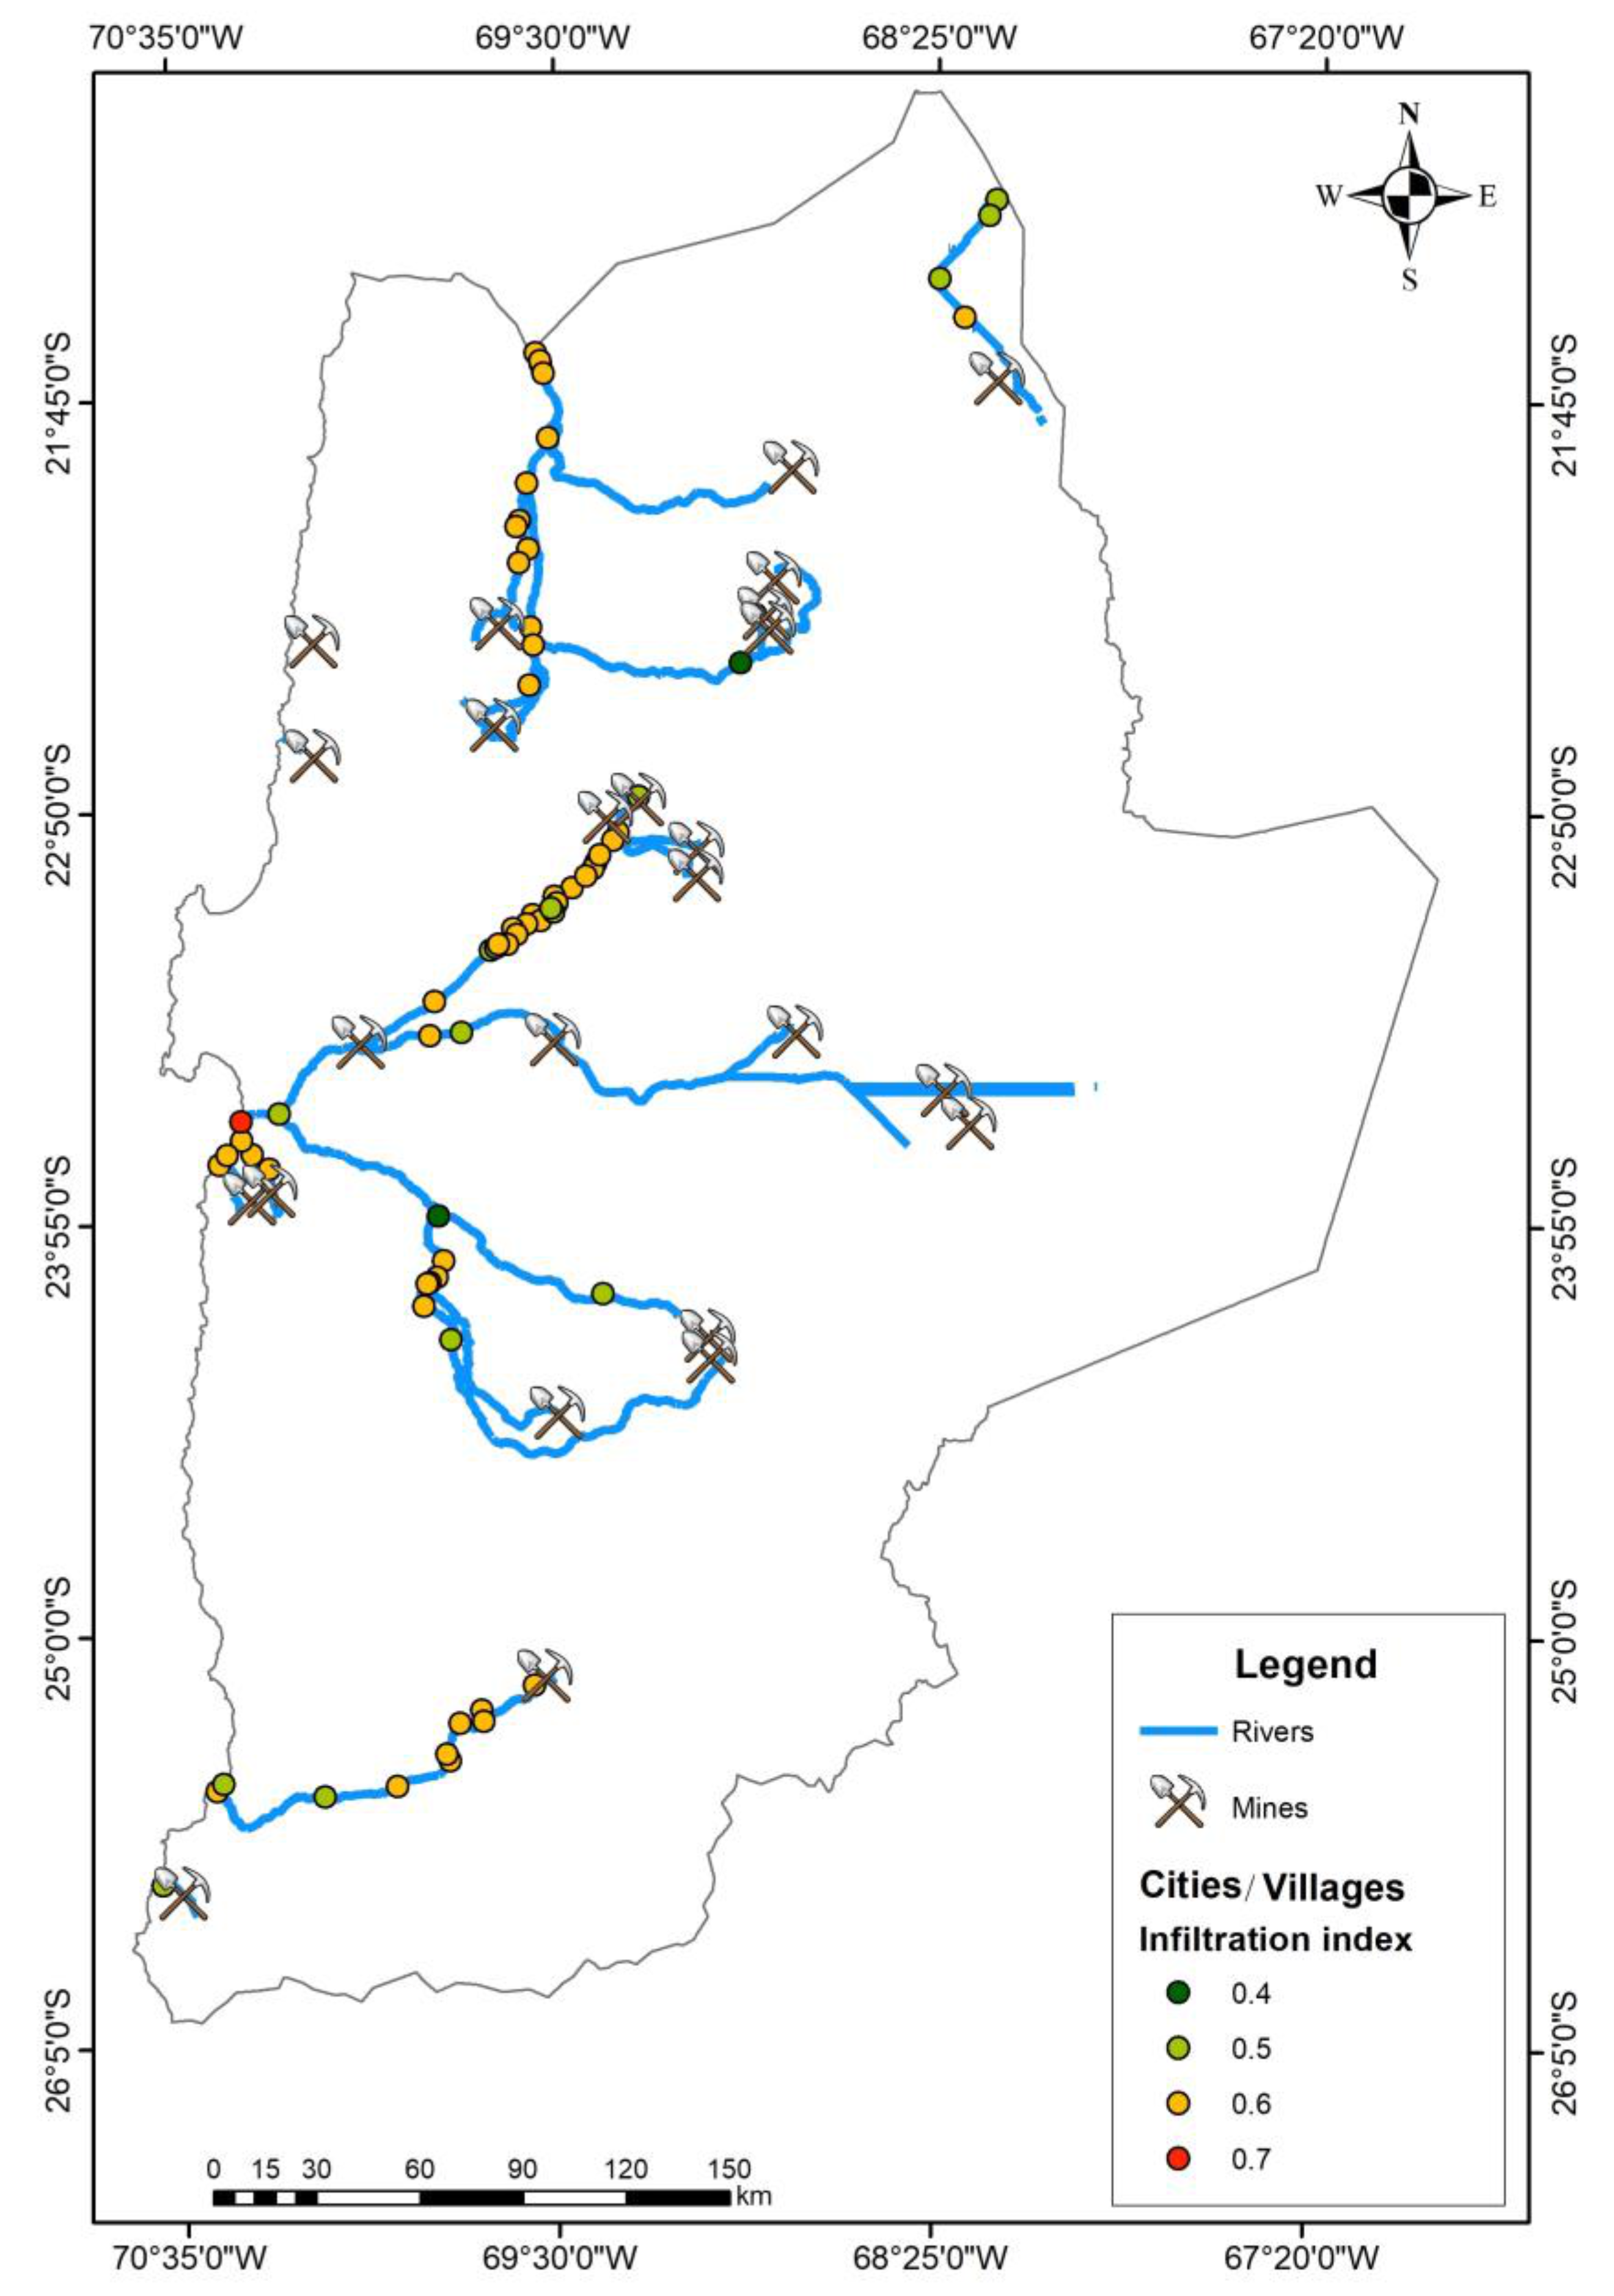
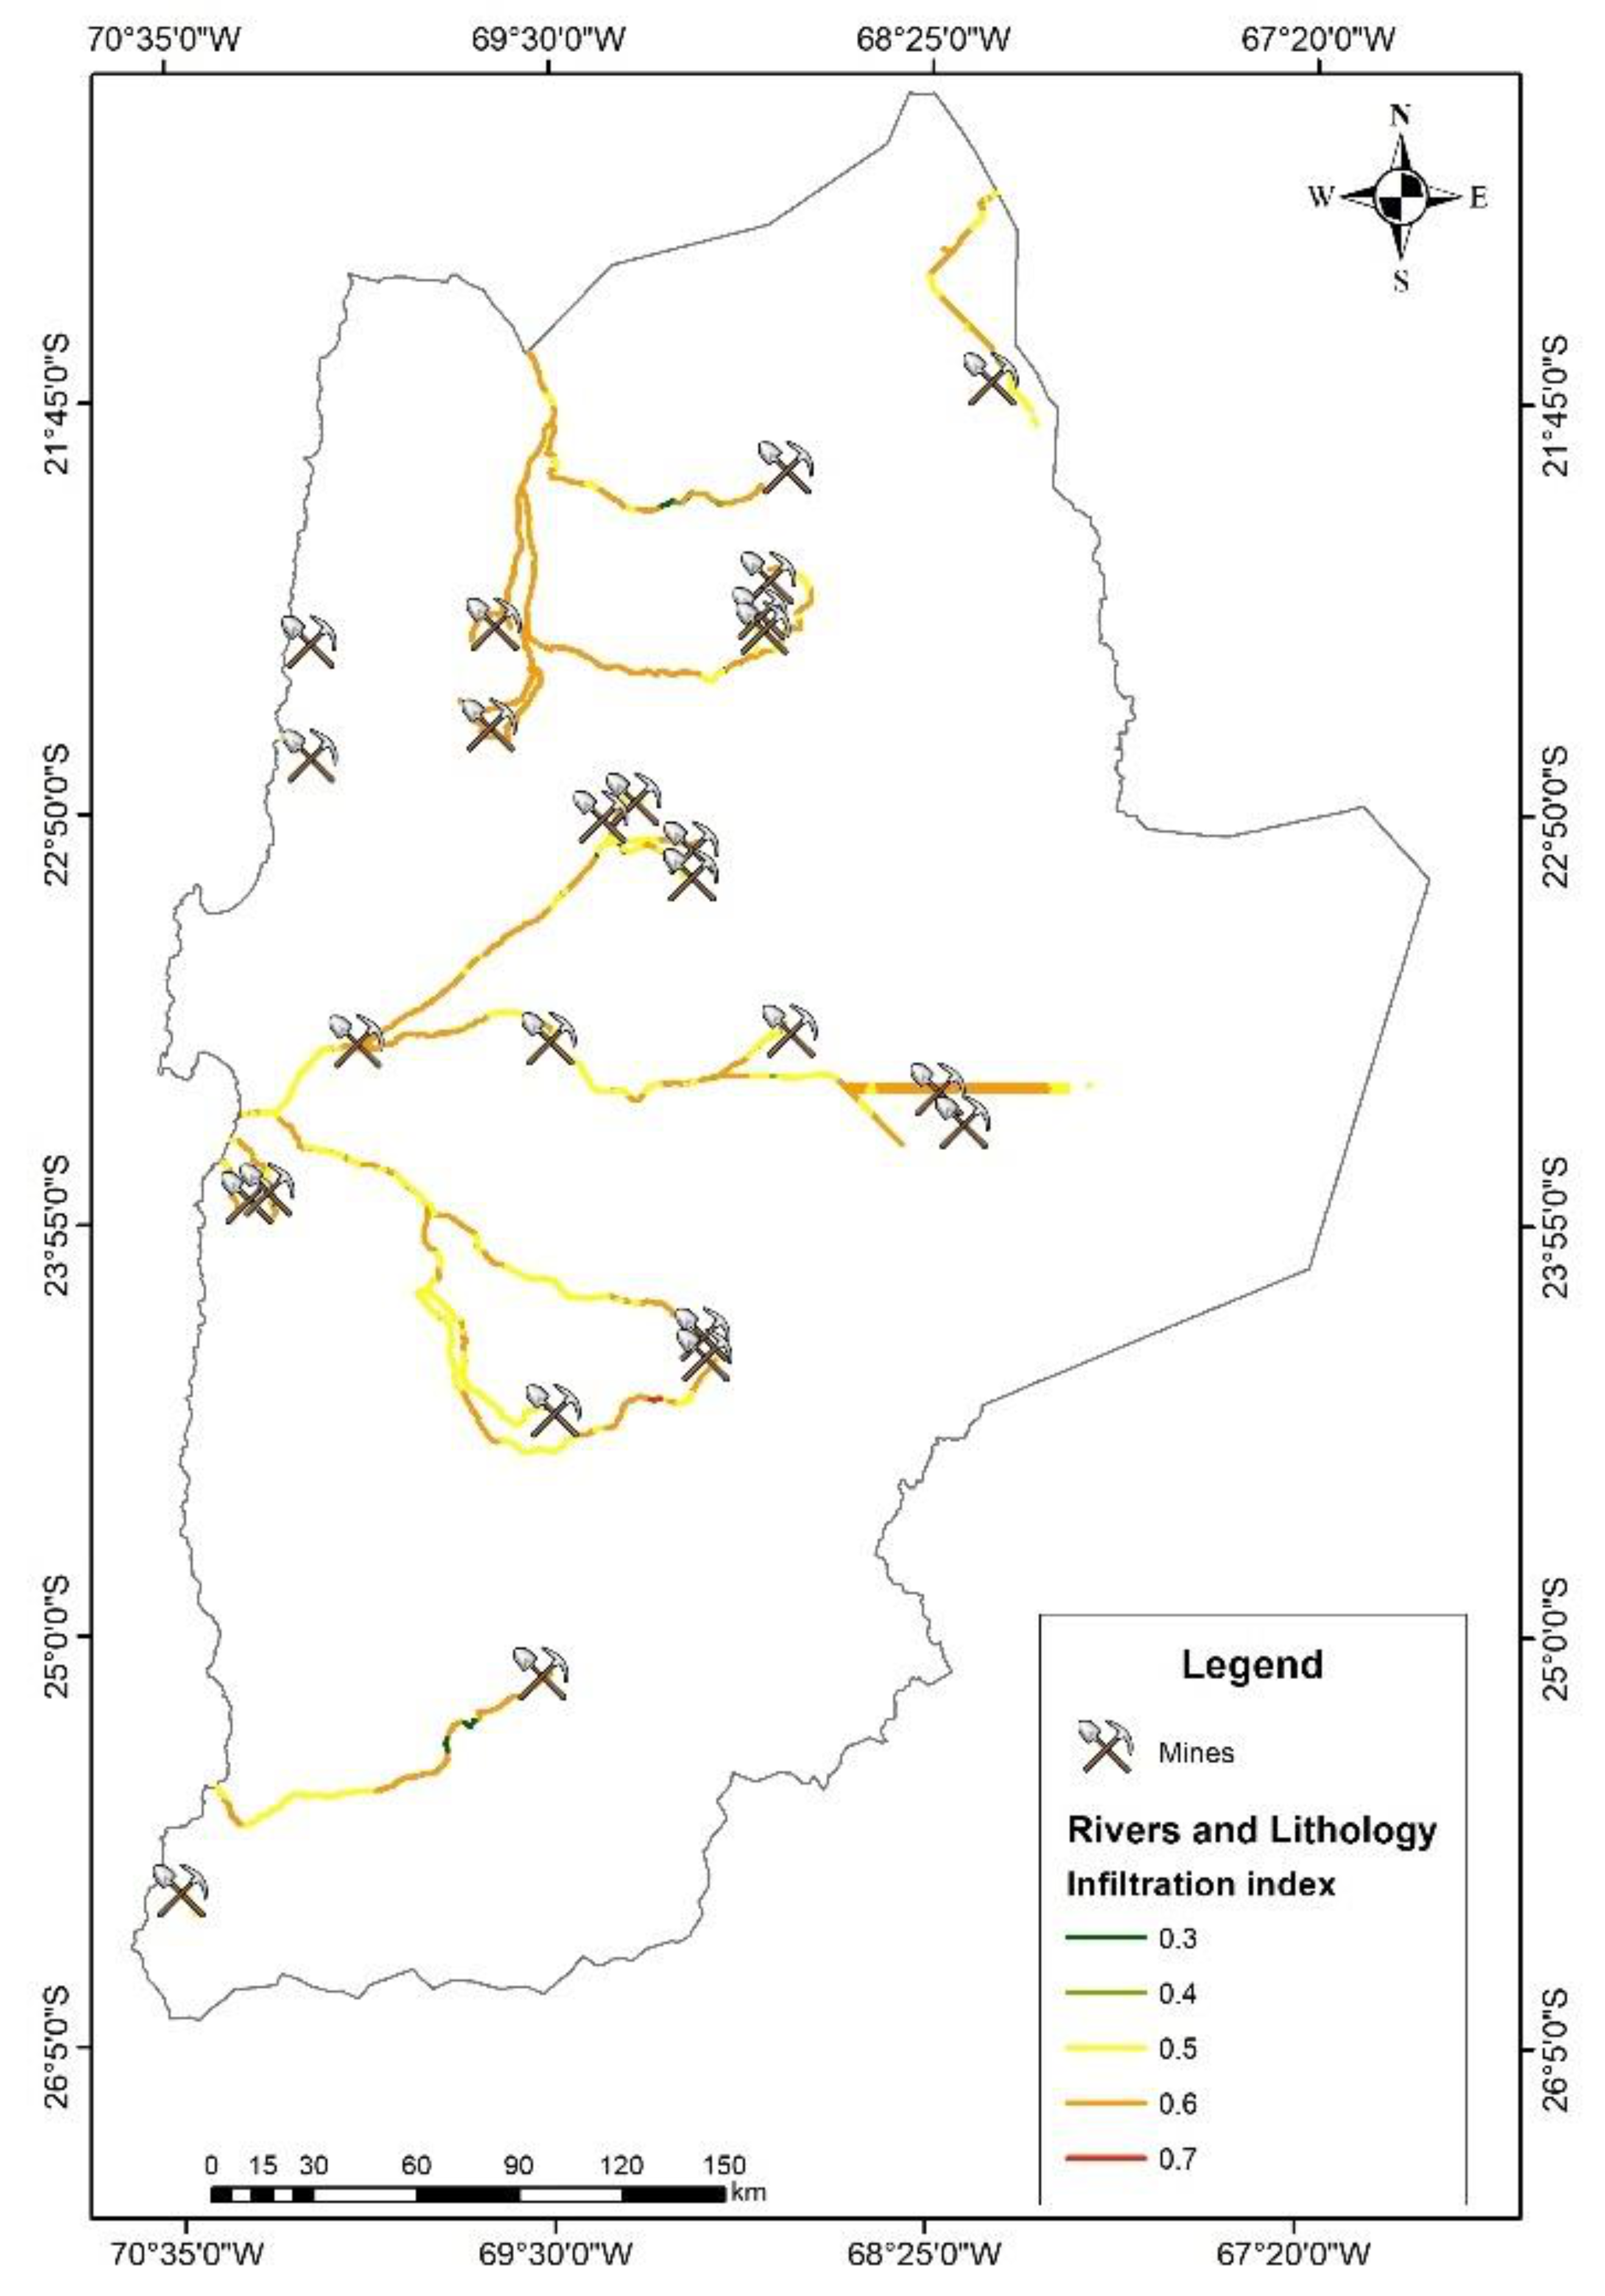
Starting from the identification of the rivers previously carried out by ArcHydro, it has been gone to extrapolate all the rivers that are downstream of a mine and all the cities/villages that are at a maximum distance of 2 km from the river itself. Each section of the river was then subdivided according to the geological era/period (Figure 11) and lithology crossed (Supplementary Figure S2). Moreover, by carrying out an in-depth study of the geolithological map and by using a parameter of SINTACS method (recharge parameter “I”) was possible to define an infiltration coefficient for each lithology (Figure 12 and Figure 13).
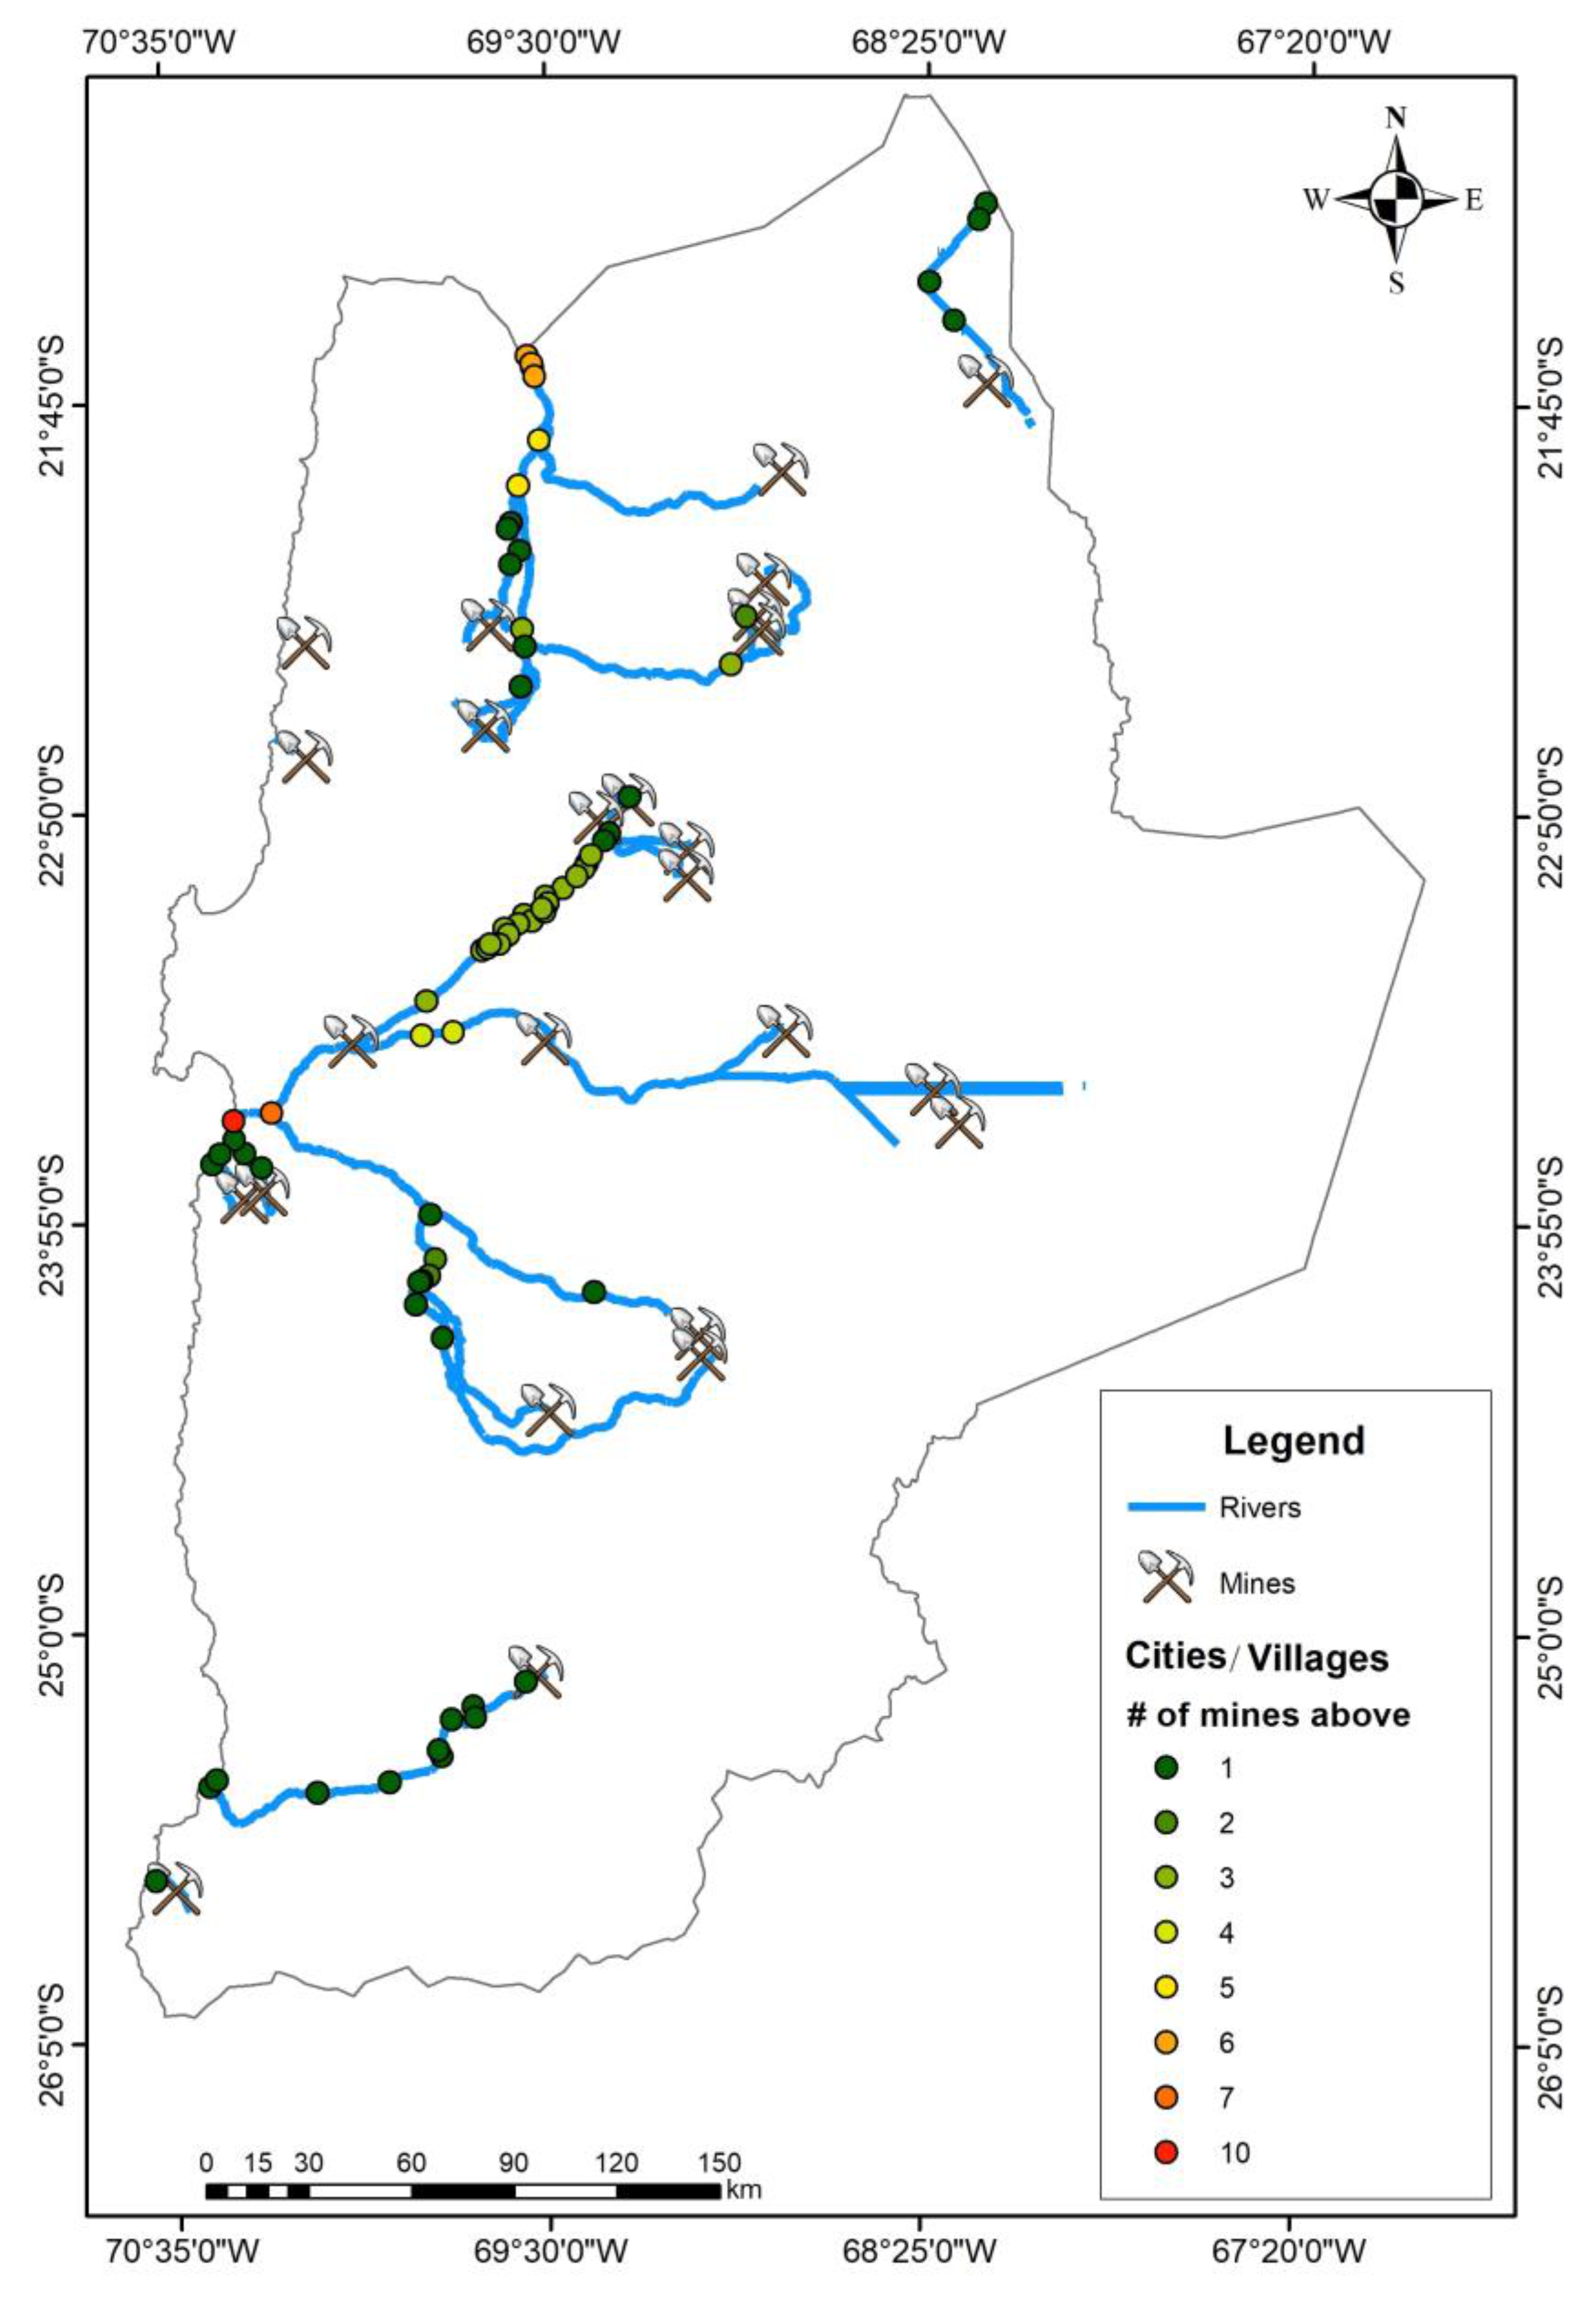
Using the recharge part of the SINTACS method, it is possible to quickly identify which sections are most vulnerable to the pollutants because the river flows through a more permeable lithology. On the other hand, by observing the cities/villages, it is easier to identify those that may have a greater possibility of using contaminated water, if it is extracted from the aquifer due to their location. At the same time, using again the ArcHydro tool and specifically the flow accumulation a binary weight raster was added where 1 equals a mine and 0 the remaining territory.
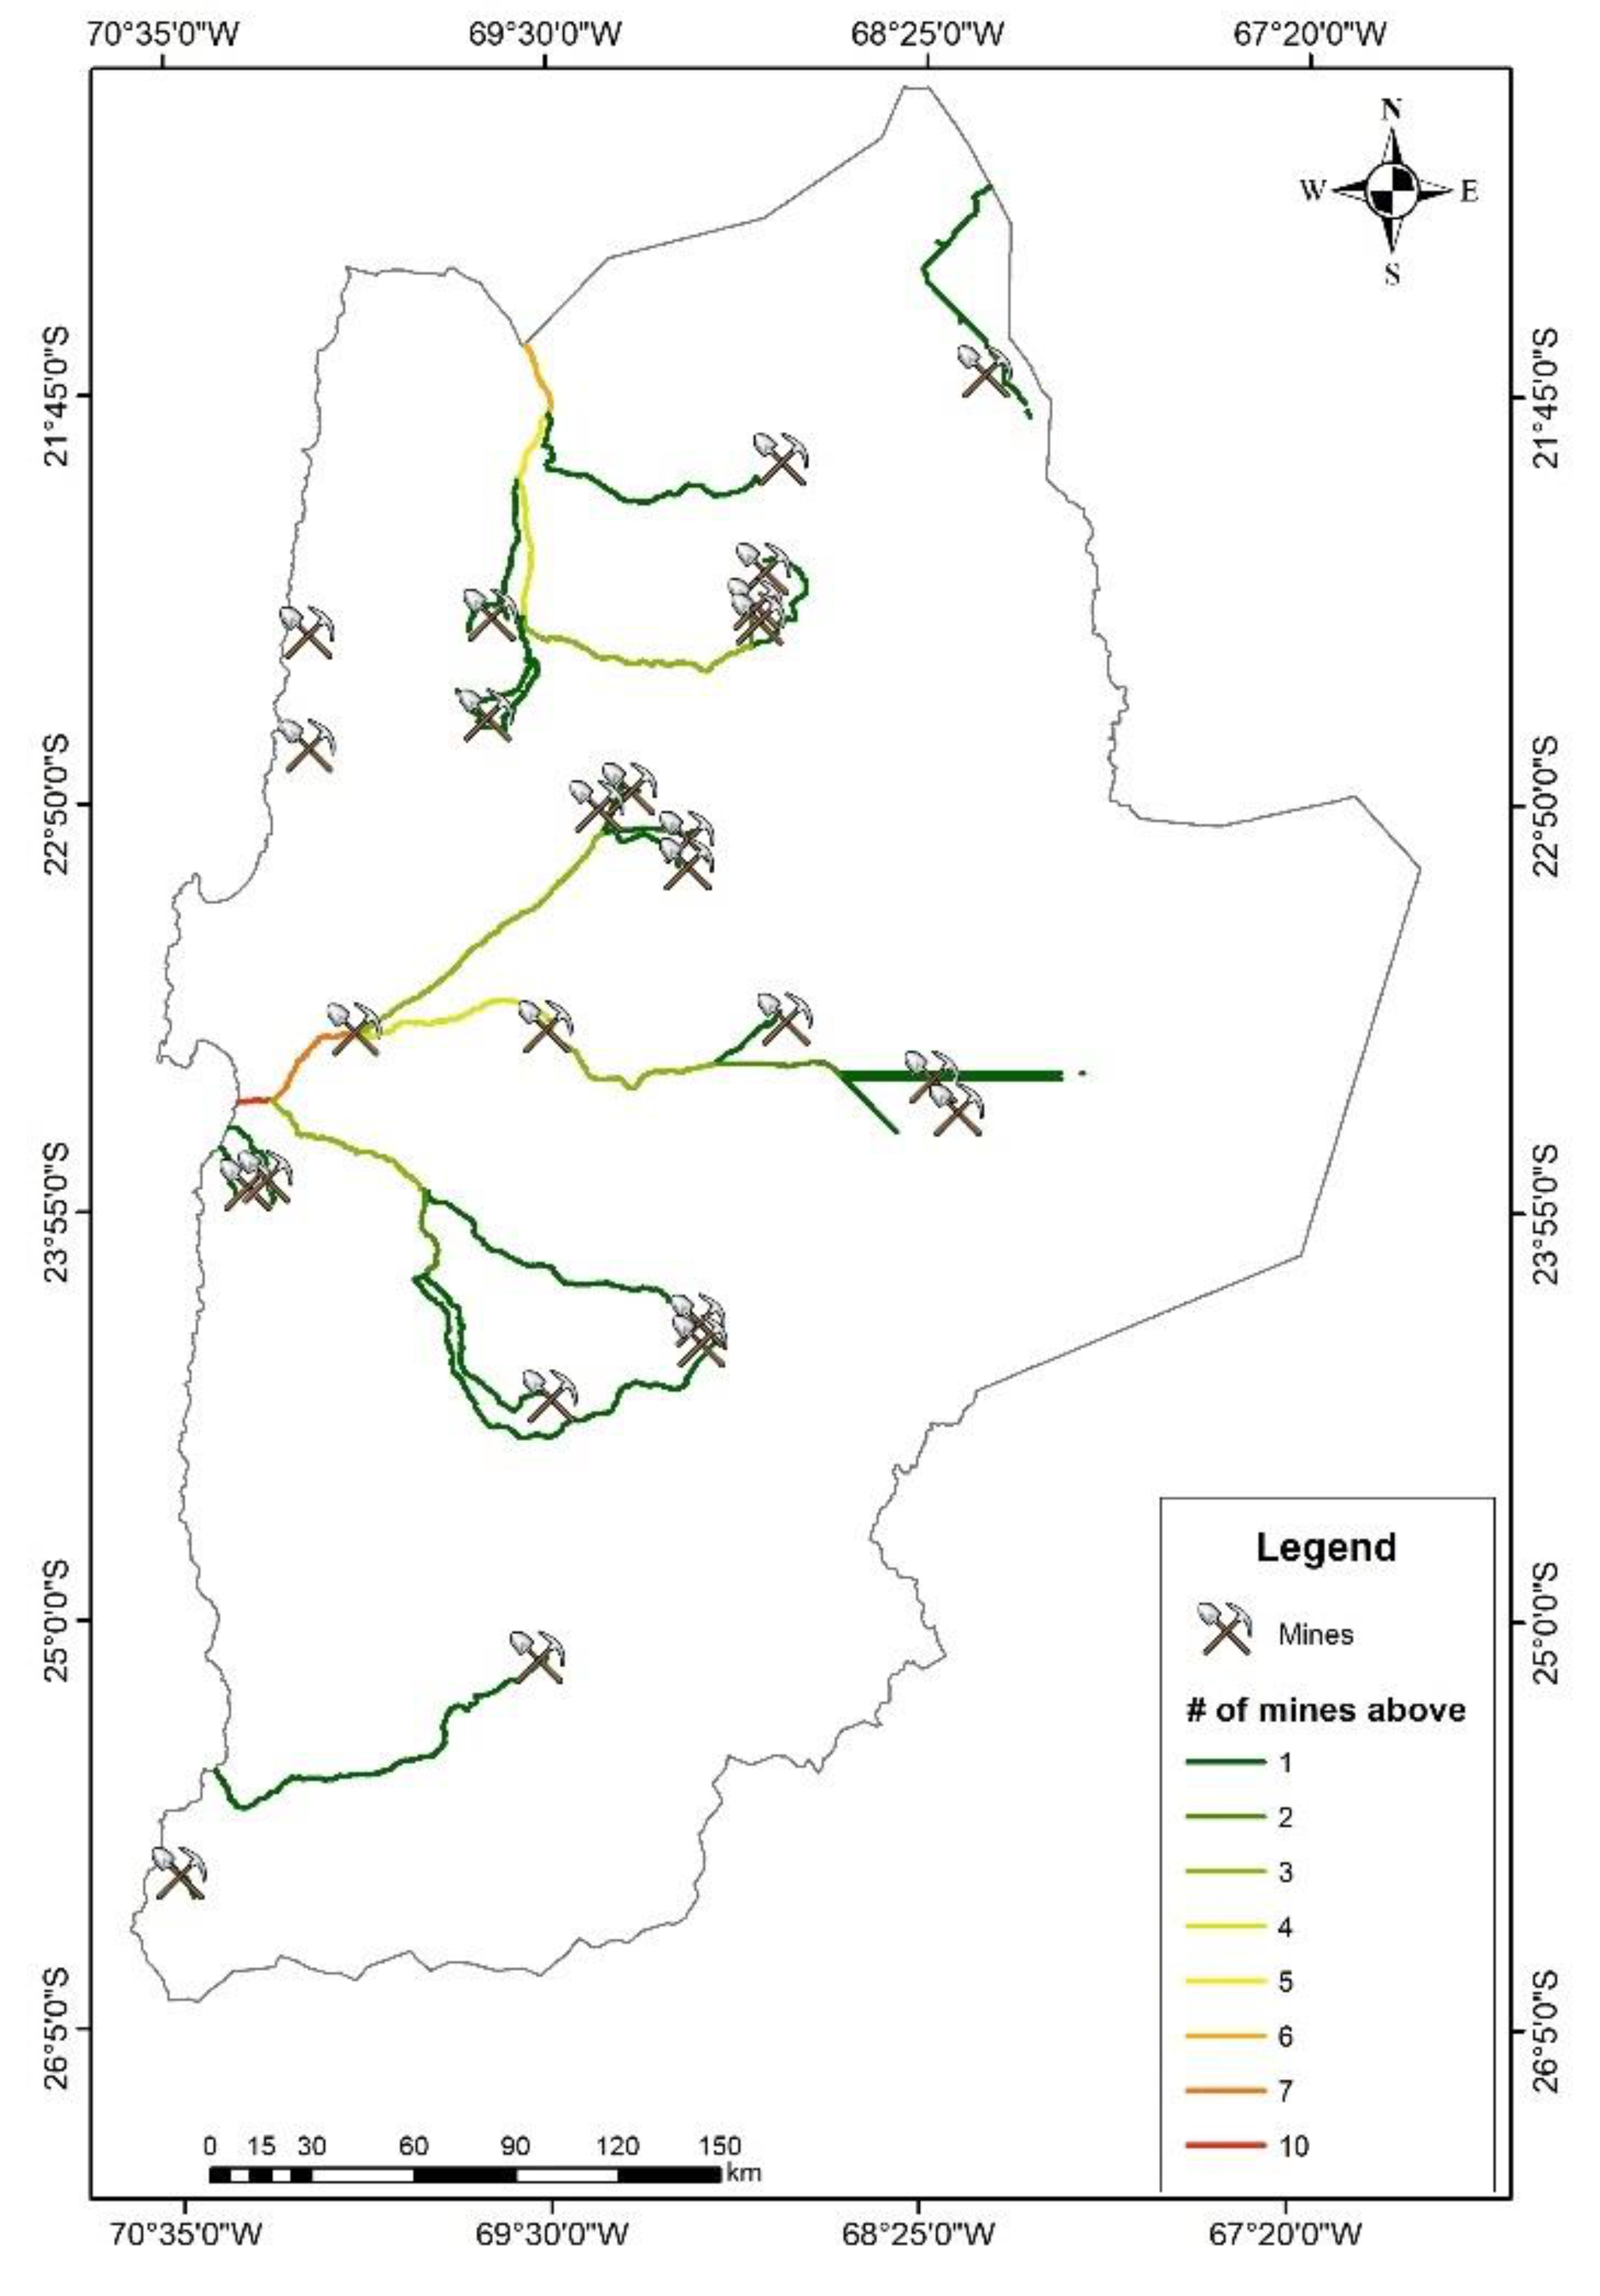
The result is a new representation, colored on the map from green to red (Figure 14 and Figure 15) which represents starting from mountain (green section) the number of mines that the river meets along its path or the tributaries that in turn are fed by water from mines until they reach the sea or the regional border (Figure 15). The number of upstream mines was represented not only in a punctual form to see which town was most at risk of possible pollution but also along the river′s course. It is possible that along some sections, there are crops and that therefore the use of polluted water could impact the crops and secondarily on the people who eat the food produced in those plots. This classification is a method derived from Strahler [50] to identify and classify types of streams based on their numbers of tributaries.
By integrating these two data and using the cities/villages as an observation point, it has been possible to identify a pollution risk index (Figure 16). This assessment based on the simplification that cities/villages derive their water from rivers. The aquifer from which the water collected is recharge by the infiltration of the river/stream. Using this methodology, it is easier to identify the areas that most need to be safeguarded, and by further integrating the information with chemical sample data, it would be possible to further discretize the different areas.
4. Conclusions
To achieve the present study′s first objective, DEM data used in a GIS environment to create some important maps of the Antofagasta Region, Chile. A total of six significant maps (elevation, slope, hillshade, aspect, river basin and drainage network and density) of the study area created using DEM data in a GIS environment. Furthermore, a geological map of the Antofagasta region also developed using the GIS platform. These seven parameters are very important in the field of hydrology. On the other hand, to succeed the second objective of the study, a part of the SINTACS method applied in GIS to identify the level of pollution risk of the cities/villages in the Antofagasta region of Chile. The result suggested the cities/villages in the region had a lower to a high pollution risk. Some of the cities/villages were at a high and medium risk pollution level in the Loa river basin, while in the Caracoles Ravine basin, most of the cities/villages were at a medium pollution risk level and one city/village at a very high and high pollution risk. However, the cities/villages from the southern region of the study area were under very low to low pollution risk levels. The outcome of the present research is providing baseline information that could help researchers, local and national government, mining authorities etc. to develop a plan for the sustainable management of water resources in the region at the current and future scenario.
Supplementary Materials
The following are available online at https://www.mdpi.com/2071-1050/13/3/1297/s1, Figure S1: Geological map of the Antofagasta region, Figure S2: Map of mines and river divided by geological unit.
Author Contributions
A.K.T. collected essential information of the study area, designed the research and drafted the present manuscript. The manuscript was read and revised by A.K.T., E.S., C.S. and M.Z. Late M.D.M. provided software support and helped during the preparation of the manuscript at the initial phase. E.S. calculated the PR index and handled software with A.K.T. The current project supervised by M.Z. and C.S. All authors have read and agreed to the published version of the manuscript.
Funding
This research has been funded by the European Commission under H2020-MSCA-RISE-2018 program.
Institutional Review Board Statement
Not applicable.
Informed Consent Statement
Not applicable.
Data Availability Statement
Publicly available datasets were used in the present research. The geological map of Chile has been collected from the National Geology and Mining Service, Santiago, Chile.
Acknowledgments
The data collected as part of a project “REMIND—Renewable Energies for Water Treatment and Reuse in Mining Industries” (grant number 823948). The authors are grateful to the European Commission under H2020-MSCA-RISE-2018 program for financial support. The authors are thankful to the Facultad de Ingeniería y Ciencias, Universidad Adolfo Ibáñez, Santiago, Chile (supported by the project: ANID/FONDAP/15110019 (SERC-CHILE) and to the DIATI- Department of Environment, Land and Infrastructure Engineering at Politecnico di Torino, Turin, Italy for providing research facilities. We thank the anonymous reviewers and editor for their valuable suggestions to improve the manuscript.
Conflicts of Interest
The authors declare no conflict of interest.
In Memoriam
Marina De Miao was a Professor of Applied Geology and GIS in the DIATI at Politecnico di Torino, Turin, Italy. She gave her full support and assistance during the preparation and writing of the present manuscript. She passed away during the finalization of this manuscript. Her contributions to this manuscript will always be remembered. We will always miss you, Marina De Maio.
References
- Araya-Osses, D.; Casanueva, A.; Román-Figueroa, C.; Uribe, J.M.; Paneque, M. Climate change projections of temperature and precipitation in Chile based on statistical downscaling. Climate Dynamics 2020, 54, 4309–4330. [Google Scholar] [CrossRef]
- ReporteMinero. 2018. Available online: https://www.reporteminero.cl/noticia/noticias/2018/04/sector-minero-aporta-el-10-del-pib-nacional (accessed on 14 December 2020).
- Aitken, D.; Rivera, D.; Godoy-Faúndez, A.; Holzapfel, E. Water scarcity and the impact of the mining and agricultural sectors in Chile. Sustainability 2016, 8, 128. [Google Scholar] [CrossRef] [Green Version]
- Babidge, S. Contested value and an ethics of resources: Water, mining and indigenous people in the Atacama Desert, Chile. Aust. J. Anthropol. 2016, 27, 84–103. [Google Scholar] [CrossRef]
- COCHILCO. Proyeccion de Consumo de Agua en la Mineria del Cobre 2014–2025; Comision Chilena del Cobre: Santiago de Chile, Chile, 2014. Available online: http://www.cochilco.cl/descargas/estudios/informes/agua/2015_Informe_Proyeccion_consumo_de_agua_vf.pdf (accessed on 15 January 2015). (In Spanish)
- Molinos-Senante, M.; Donoso, G. Water scarcity and affordability in urban water pricing: A case study of Chile. Util. Policy 2016, 43, 107–116. [Google Scholar] [CrossRef]
- Valdés-Pineda, R.; Pizarro, R.; García-Chevesich, P.; Valdés, J.B.; Olivares, C.; Vera, M.; Abarza, A. Water governance in Chile: Availability, management and climate change. J. Hydrol. 2014, 519, 2538–2567. [Google Scholar] [CrossRef]
- Pandey, A.; Dabral, P.P.; Chowdary, V.M.; Yadav, N.K. Landslide hazard zonation using remote sensing and GIS: A case study of Dikrong river basin, Arunachal Pradesh, India. Environ. Geol. 2008, 54, 1517–1529. [Google Scholar] [CrossRef]
- Avtar, R.; Sahu, N.; Aggarwal, A.K.; Chakraborty, S.; Kharrazi, A.; Yunus, A.P.; Kurniawan, T.A. Exploring renewable energy resources using remote sensing and GIS—A review. Resources 2019, 8, 149. [Google Scholar] [CrossRef] [Green Version]
- Hadjimitsis, D.; Agapiou, A.; Alexakis, D.; Sarris, A. Exploring natural and anthropogenic risk for cultural heritage in Cyprus using remote sensing and GIS. Int. J. Digital Earth 2013, 6, 115–142. [Google Scholar] [CrossRef]
- Agapiou, A.; Lysandrou, V.; Alexakis, D.D.; Themistocleous, K.; Cuca, B.; Argyriou, A.; Hadjimitsis, D.G. Cultural heritage management and monitoring using remote sensing data and GIS: The case study of Paphos area, Cyprus. Comput. Environ. Urban Syst. 2015, 54, 230–239. [Google Scholar] [CrossRef]
- Dahdouh-Guebas, F. The use of remote sensing and GIS in the sustainable management of tropical coastal ecosystems. Environ. Dev. Sustain. 2002, 4, 93–112. [Google Scholar] [CrossRef] [Green Version]
- Balasubramanian, A. Digital Elevation Model (DEM) in GIS, Report No. 3.; University of Mysore: Mysore, India, 2017. [Google Scholar] [CrossRef]
- Senthilkumar, M.; Gnanasundar, D.; Arumugam, R. Identifying groundwater recharge zones using remote sensing & GIS techniques in Amaravathi aquifer system, Tamil Nadu, South India. Sustain. Environ. Res. 2019, 29, 15. [Google Scholar]
- Usali, N.; Ismail, M.H. Use of remote sensing and GIS in monitoring water quality. J. Sustain. Dev. 2010, 3, 228. [Google Scholar] [CrossRef]
- Brivio, P.A.; Colombo, R.; Maggi, M.; Tomasoni, R. Integration of remote sensing data and GIS for accurate mapping of flooded areas. Int. J. Remote. Sens. 2002, 23, 429–441. [Google Scholar] [CrossRef]
- Barnali, D.; Venkatesh, U. GIS and Geocomputation for Water Resource Science and Engineering; Wiley American Geophysical Union: Hoboken, NJ, USA, 2015; p. 568. ISBN 978-1-118-82618-8. [Google Scholar]
- Chowdary, V.M.; Ramakrishnan, D.; Srivastava, Y.K.; Chandran, V.; Jeyaram, A. Integrated water resource development plan for sustainable management of Mayurakshi watershed, India using remote sensing and GIS. Water Resour. Manag. 2009, 23, 1581–1602. [Google Scholar] [CrossRef]
- Romero, L.; Alonso, H.; Campano, P.; Fanfani, L.; Cidu, R.; Dadea, C.; Farago, M. Arsenic enrichment in waters and sediments of the Rio Loa (Second Region, Chile). Appl. Geochem. 2003, 18, 1399–1416. [Google Scholar] [CrossRef]
- Godfrey, L.V.; Herrera, C.; Gamboa, C.; Mathur, R. Chemical and isotopic evolution of groundwater through the active Andean arc of Northern Chile. Chem. Geol. 2019, 518, 32–44. [Google Scholar] [CrossRef]
- Bhuiyan, C. Hydrogeological factors: Their association and relationship with seasonal water table fluctuation in the composite hardrock Aravalli terrain, India. Environ. Earth Sci. 2010, 60, 733–748. [Google Scholar] [CrossRef]
- Chandra, S.; Singh, P.K.; Tiwari, A.K.; Panigrahy, B.; Kumar, A. valuation of hydrogeological factor and their relationship with seasonal water table fluctuation in Dhanbad district, Jharkhand, India. ISH J. Hyd. Eng. 2015, 21, 193–206. [Google Scholar] [CrossRef]
- Tiwari, A.K.; Nota, N.; Marchionatti, F.; De Maio, M. Groundwater-level risk assessment by using statistical and geographic information system (GIS) techniques: A case study in the Aosta Valley region, Italy. Geomat. Nat. Haz. Risk. 2017, 8, 1396–1406. [Google Scholar] [CrossRef]
- Misra, A.; Kumar, A.; Bhambri, R.; Haritashya, U.K.; Verma, A.; Dobhal, D.P.; Upadhyay, R. Topographic and climatic influence on seasonal snow cover: Implications for the hydrology of ungauged Himalayan basins. India J. Hydrol. 2020, 24, 124716. [Google Scholar] [CrossRef]
- Murthy, K.S.R. Ground water potential in a semi-arid region of Andhra Pradesh-a geographical information system approach. Int. J. Remote Sens. 2000, 21, 1867–1884. [Google Scholar] [CrossRef]
- Kumar, A.; Krishna, A.P. Assessment of groundwater potential zones in coal mining impacted hard-rock terrain of India by integrating geospatial and analytic hierarchy process (AHP) approach. Geocarto. Int. 2018, 33, 105–129. [Google Scholar] [CrossRef]
- Patil, S.G.; Mohite, N.M. Identification of groundwater recharge potential zones for a watershed using remote sensing and GIS. Int. J. Geomat. Geosci. 2014, 4, 485–498. [Google Scholar]
- Tiwari, A.K.; Lavy, M.; Amanzio, G.; de Maio, M.; Singh, P.K.; Mahato, M.K. Identification of artificial groundwater recharging zone using a GIS-based fuzzy logic approach: A case study in a coal mine area of the Damodar Valley, India. Appl. Water Sci. 2017, 7, 4513–4524. [Google Scholar] [CrossRef]
- Verbovšek, T.; Popit, T.; Kokalj, Ž. VAT Method for Visualization of Mass Movement Features: An Alternative to Hillshaded DEM. Remote Sens. 2019, 11, 2946. [Google Scholar] [CrossRef]
- Oh, H.J.; Kim, Y.S.; Choi, J.K.; Park, E.; Lee, S. GIS mapping of regional probabilistic groundwater potential in the area of Pohang City, Korea. J. Hydrol. 2011, 399, 158–172. [Google Scholar] [CrossRef]
- Van Den Eeckhaut, M.; Poesen, J.; Verstraeten, G.; Vanacker, V.; Moeyersons, J.; Nyssen, J.; Van Beek, L.P.H. The effectiveness of hillshade maps and expert knowledge in mapping old deep-seated landslides. Geomorphology 2005, 67, 351–363. [Google Scholar] [CrossRef]
- Fagbohun, B.J. Integrating GIS and multi-influencing factor technique for delineation of potential groundwater recharge zones in parts of Ilesha schist belt, southwestern Nigeria. Environ. Earth Sci. 2018, 77, 69. [Google Scholar] [CrossRef]
- Johnson, L.E. Geographic Information Systems in Water Resources Engineering; CRC Press: New York, NY, USA, 2016. [Google Scholar]
- Singh, S.K.; Zeddies, M.; Shankar, U.; Griffiths, G.A. Potential groundwater recharge zones within New Zealand. Geosci. Front. 2019, 10, 1065–1072. [Google Scholar] [CrossRef]
- Rocha, P.C.; Santos, A.A. Hydrological analysis in water basins. Mercator Fortaleza 2018, 17, e17025. [Google Scholar] [CrossRef]
- Zernitz, E.R. Drainage patterns and their significance. J. Geol. 1932, 40, 498–521. [Google Scholar] [CrossRef]
- Houston, J. Groundwater recharge through an alluvial fan in the Atacama Desert, northern Chile: Mechanisms, magnitudes and causes. Hydrol. Process. 2002, 16, 3019–3035. [Google Scholar] [CrossRef]
- Tiwari, A.K.; Singh, P.K.; Chandra, S.; Ghosh, A. Assessment of groundwater level fluctuation by using remote sensing and GIS in West Bokaro coalfield, Jharkhand, India. ISH J. Hyd. Eng. 2016, 22, 59–67. [Google Scholar] [CrossRef]
- Chowdhury, A.; Jha, M.K.; Chowdary, V.M. Delineation of groundwater recharge zones and identification of artificial recharge sites in West Medinipur district, West Bengal, using RS, GIS and MCDM techniques. Environ. Earth Sci. 2010, 59, 1209. [Google Scholar] [CrossRef]
- Chambel, A. The role of groundwater in the management of water resources in the World. Proc. Int. Assoc. Hydrol. Sci. 2015, 366, 107. [Google Scholar] [CrossRef]
- Aller, L.; Bennett, T.; Lehr, J.; Petty, R.; Hackett, G. DRASTIC: A Standardized System for Evaluating Groundwater Pollution Potential Using Hydrogeological Setting EPA/600/2-87/035 Robert S Kerr Environmental Research Laboratory; USEPA: Ada, OK, USA, 1987. [Google Scholar]
- Civita, M.; De Maio, M. Assessing and mapping groundwater vulnerability to contamination: The Italian combined approach. Geofísica Int. 2004, 43, 513–532. [Google Scholar] [CrossRef] [Green Version]
- Foster, S. Fundamental Concepts in Aquifer Vulnerability, Pollution Risk and Protection Strategy. In Proceedings of the Vulnerability of Soil and Groundwater to Pollutants International Conference, Noordwijk Aan Zee, The Netherlands, 30 March 1987; Netherlands Organization for Applied Scientific Research: The Hague, The Netherlands, 1987. [Google Scholar]
- Civita, M. L’infiltrazione potenziale media annua nel massiccio del Matese (Italia meridionale). Conv. Intern. Acque Sotterranee Palermo 1973, 2, 129–142. [Google Scholar]
- Civita, M.; de Maio, M. SINTACS: Un Sistema Parametrico per la Valutazione e la Cartografia Della Vulnerabilità Degli Acquiferi All’inquinamento; Pythagoras: Bologna, Italy, 1997. [Google Scholar]
- Manfreda, S.; Sdao, F.; Sole, A. Hydrogeological Water Balance in Carbonate Hydro-Structure. In Proceedings of the 2nd IASWE/WSEAS International Conference on WaterResources, Hydraulics & Hydrology (WHH 2007), Portoroz, Slovenia, 15–17 May 2007; WSEAS: Cambridge, UK; pp. 216–222. [Google Scholar]
- Canora, F.; Musto, M.A.; Sdao, F. Groundwater Recharge Assessment in the Carbonate Aquifer System of the LauriaMounts (Southern Italy) by GIS-Based Distributed Hydrogeological Balance Method. In Computational Science and Its Applications–ICCSA 2018, Lecture Notes in Computer Science; Gervasi, O., Ed.; Springer: Cham, Switzerland, 2018. [Google Scholar]
- Borzì, I.; Bonaccorso, B.; Aronica, G.T. The Role of DEM Resolution and Evapotranspiration Assessment in Modeling Groundwater Resources Estimation: A Case Study in Sicily. Water 2020, 12, 2980. [Google Scholar] [CrossRef]
- Civita, M. Idrogeologia Applicata e Ambientale; CEA Editore: Roma, Italy, 2005; ISBN 978-8808087416. [Google Scholar]
- Strahler, A.N. Quantitative analysis of watershed geomorphology. Eos Trans. Am. Geophys. Union 1957, 38, 913–920. [Google Scholar] [CrossRef] [Green Version]
Figure 1.
Location map of the Antofagasta region, Chile.

Figure 2.
Methodology flow chart.

Figure 3.
Elevation map of the Antofagasta region.

Figure 4.
Slope map of the Antofagasta region.

Figure 5.
Hillshade map of the Antofagasta region.

Figure 6.
Aspect map of the Antofagasta region.

Figure 7.
River basin map of the Antofagasta region.

Figure 8.
Drainage density and pattern map of the Antofagasta region.

Figure 9.
Geological map of the Antofagasta region.

Figure 10.
Methodology flowchart for pollution risk identification.

Figure 11.
Map of mines and river divided by geological era/period.

Figure 12.
Map of cities/villages infiltration index.

Figure 13.
Map of river and lithology infiltration index.

Figure 14.
Map of cities/villages divided by the number of mines above.

Figure 15.
Map of river sections divided by the number of mines above.

Figure 16.
Cities/villages divided by risk value.


Table 1.
Area and percentage distribution of elevation, slope, aspect, basin and drainage density of the Antofagasta region, Chile.
Table 1.
Area and percentage distribution of elevation, slope, aspect, basin and drainage density of the Antofagasta region, Chile.
| Parameter | Area (km2) | Percentage (%) |
|---|---|---|
| Elevation (masl) | ||
| <500 | 2973 | 2.4 |
| 501–1500 | 27,948 | 22.1 |
| 1501–3000 | 50,888 | 40.3 |
| 3001–4500 | 36,346 | 28.8 |
| >4500 | 8099 | 6.4 |
| Slope (degree) | ||
| <5 | 63,007 | 50.0 |
| 5.1–10 | 32,294 | 25.6 |
| 10.1–15 | 14,028 | 11.1 |
| 15.1–20 | 7566 | 6.0 |
| >20 | 9358 | 7.4 |
| Aspect (degree) | ||
| Flat | 15,085 | 12 |
| North | 7383 | 5.8 |
| Northeast | 11,652 | 9.2 |
| East | 10,233 | 8.1 |
| Southeast | 10,657 | 8.4 |
| South | 13,350 | 10.6 |
| Southwest | 16,970 | 13.4 |
| West | 17,831 | 14.1 |
| Northwest | 16,278 | 13 |
| North | 6814 | 5.4 |
| River Basin | ||
| Loa River | 27,148 | 21.5 |
| Frontier Michincha Salt Field-Loa River | 2676 | 2.1 |
| Coastal Loa River-Caracoles Ravine | 8367 | 6.6 |
| Atacama Salt Field | 15,572 | 12.4 |
| Caracoles Ravine | 18,293 | 14.5 |
| Frontier Atacama and Socompa Salt Fields | 4052 | 3.2 |
| Endorreic between Frontier y Atacama Salt Field | 5311 | 4.2 |
| Endorreic Atacama Salt Field-Pacifico Stream | 14,439 | 11.5 |
| La Negra Ravine | 11,342 | 9.0 |
| Coastal between La Negra and Pan de Azucar Ravines | 16,853 | 13.4 |
| Coastal Pan de Azucar Ravine and Salado River | 1949 | 1.5 |
| Drainage Density (Km/Km2) | ||
| 0–0.14 | 40,773 | 32.3 |
| 0.15–0.26 | 40,115 | 31.8 |
| 0.27–0.41 | 27,637 | 21.9 |
| 0.42–0.61 | 12,849 | 10.2 |
| 0.62–1.1 | 4879 | 3.9 |
Publisher’s Note: MDPI stays neutral with regard to jurisdictional claims in published maps and institutional affiliations. |
© 2021 by the authors. Licensee MDPI, Basel, Switzerland. This article is an open access article distributed under the terms and conditions of the Creative Commons Attribution (CC BY) license (http://creativecommons.org/licenses/by/4.0/).
Share and Cite
MDPI and ACS Style
Tiwari, A.K.; Suozzi, E.; Silva, C.; De Maio, M.; Zanetti, M. Role of Integrated Approaches in Water Resources Management: Antofagasta Region, Chile. Sustainability 2021, 13, 1297. https://doi.org/10.3390/su13031297
AMA Style
Tiwari AK, Suozzi E, Silva C, De Maio M, Zanetti M. Role of Integrated Approaches in Water Resources Management: Antofagasta Region, Chile. Sustainability. 2021; 13(3):1297. https://doi.org/10.3390/su13031297
Chicago/Turabian StyleTiwari, Ashwani Kumar, Enrico Suozzi, Carlos Silva, Marina De Maio, and Mariachiara Zanetti. 2021. "Role of Integrated Approaches in Water Resources Management: Antofagasta Region, Chile" Sustainability 13, no. 3: 1297. https://doi.org/10.3390/su13031297
Note that from the first issue of 2016, this journal uses article numbers instead of page numbers. See further details here.