

Abstract
Ceria nanoparticles (NPs) are fundamental in heterogeneous catalysis because of their ability to store or release oxygen depending on the ambient conditions. Their oxygen storage capacity is strictly related to the exposed planes, crystallinity, density and distribution of defects. In this work a study of ceria NPs produced with a ligand-free, physical synthesis method is presented. The NP films were grown by a magnetron sputtering based gas aggregation source and studied by high resolution- and scanning-transmission electron microscopy and x-ray photoelectron spectroscopy. In particular, the influence of the oxidation procedure on the NP reducibility has been investigated. The different reducibility has been correlated to the exposed planes, crystallinity and density and distribution of structural defects. The results obtained in this work represent a basis to obtain cerium oxide NP with desired oxygen transport properties.
Export citation and abstract BibTeX RIS
1. Introduction
Materials based on reducible oxides play a relevant role in various fields and applications, like catalysis, energy conversion and storage [1], biomedicine and memories [2]. Their importance in catalysis is based on their oxygen storage capacity (OSC), i.e. the possibility of easily and reversibly up-taking and releasing oxygen and/or charge, which makes them very efficient in promoting redox reactions with a unique regeneration ability [1]. Reducibility is determined by the material capacity of easily forming and filling oxygen vacancies and by oxygen transport properties within the material. Among reducible oxides, cerium oxide is certainly one of the most important industrial and environmental catalyst supports. Reduced dimensionality effects in cerium oxide have shown to substantially increase reducibility, due to the high surface-to-bulk ratio, the higher oxygen ion mobility, and pronounced changes in the electronic structure [3–5]. In particular, catalysts made of metal nanoparticles (NPs) supported on nanocrystalline cerium oxide showed a substantial reduction in the oxygen vacancy formation energy compared to extended surfaces, with a minimum at a specific size [4], and with a consequent enhanced reactivity, that can be due also to oxygen transfer to the supported metal NPs [6]. On the basis of these considerations, studies of fundamental properties of cerium oxide nanosystems, in particular in the form of NPs, are essential to understand the working principles of ceria-based nanocatalysts and to rationalize their design. For instance, it is fundamental to define the atomic structure of the NPs; this property, together with the NP size, can determine the chemical reactivity [7]. Different synthesis procedures can produce NPs with various shapes and consequently different exposed crystallographic planes [8]. The specific exposed facet influences the energy of formation of oxygen vacancies, the stability [9] and the interaction with absorbed molecules [10, 11], affecting the catalytic activity of the NPs.
Physical synthesis of NPs can have some advantages with respect to the most used chemical routes, as the procedure is generally single-step, it does not use organic precursors, and it can produce ligand-free nanocrystals, making the experimental analysis of the properties more straightforward. In particular, gas aggregation sources have been widely employed for the realization of metal, semiconductor and oxide NP assemblies [12–17], also with hybrid core–shell structure [18–21]. Few experiments have been reported on cerium oxide NPs produced by physical synthesis. Tschöpe et al [22, 23] studied ceria NPs realized by magnetron sputtering and inert gas condensation, observing the high non-stoichiometry of these systems. This observation was related with the sample preparation method. In a more recent paper on cerium oxide NPs obtained with a gas aggregation source, our group investigated the effect of the size on the reducibility of ceria NPs [24].
In this work we present the results of a study on CeO2−x NPs produced by combining magnetron sputtering with a gas aggregation source. We concentrated our studies on the NP reducibility for three different systems, having the same size, but a different density and distribution of structural defects. This was made possible by a combination of a high resolution (HR) electron microscopy and spectroscopy work. The NPs have been characterized in morphology and structure by HR- and scanning (S-) transmission electron microscopy (TEM), and electron energy loss spectroscopy (EELS) was used to map the Ce3+ and Ce4+ ions distribution in individual NPs. Oxidation-reduction activity of the NPs was investigated by x-ray photoemission spectroscopy (XPS). The aim of this work is to define the role of the structural defects in ceria NPs in order to improve the understanding of the basic processes of their reduction and oxidation, which are fundamental for ceria NP applications.
2. Experimental
The cerium oxide NP films were prepared in a high vacuum (HV) system (base pressure p = 5 × 10⁻⁹ mbar) equipped with a magnetron sputtering based gas aggregation source, an electrical quadrupole for mass spectroscopy and filtering (QMF), a deposition chamber and a XPS chamber for the in situ chemical characterization, as previously described [24, 25]. Pure Ce (99.9%) was used as target with Ar as sputtering and aggregation gas. The discharge power and Ar+ flux values were P = 30 W and f = 40 sccm. The average NP size, as selected with the QMF during the experiment, was 〈d〉 = 8.5 nm for all the samples, with a size dispersion characterized by a value of σ = 1.7 nm, as verified by analyzing the STEM images [24]. NPs were deposited at room temperature (RT) on Si wafers with SiOx as native oxide for oxidation/reduction experiments. Lacey grids were used for TEM analysis. Three different types of samples were prepared:
- (1)Ceria NP films obtained by oxidation in the deposition chamber, by exposure to O2 gas that was flown through a leak valve. The partial pressure of O2 was pO2 = 1 × 10⁻⁶ mbar (post-oxidized sample).
- (2)Ceria NP films grown by flowing O2 directly into the gas aggregation chamber (directly oxidized sample).
- (3)Ceria NP films oxidized by residual oxygen in the HV system (sample oxidized in HV).
In all cases the growth was performed at RT. The amount of deposited NPs is given in terms of nominal thickness of an equivalent continuous film with the same density as CeO2. The nominal film thickness for the post- oxidized sample and the sample oxidized in HV was t = 10 nm, while for the directly oxidized sample the film thickness was t = 14 nm. The nominal thickness t was obtained by measuring the deposition rate with a quartz microbalance.
After deposition, the samples were analyzed with in situ XPS. Recently, we have observed that x-ray beam irradiation and the HV environment required for XPS gave origin to some degree of reduction, as shown in Ce 3d core level analysis [24]. Nevertheless, it was still possible to investigate the behavior of NPs during the oxidation–reduction cycles, monitoring the relative Ce3+ concentration from the ratio between the intensities of the XPS signal from Ce3+ and Ce4+ ions, respectively. This method, already used for ultrathin films, allowed to compare the different behavior of NPs of different size [24]. In this work we are interested to compare the OSC capacity of the differently growth NPs films, measuring the relative variation of the Ce3+/Ce4+ ions ratio when the samples are submitted to the same reducing and oxidizing cycles. After their preparation and first characterization with XPS, the films were transferred immediately to a different UHV apparatus in the same laboratory to perform reduction and oxidation cycles. For the reduction process the samples were heated in UHV at T = 520 K, T = 770 K and T = 1020 K for 30 min; for the oxidation process the samples were heated at T = 1020 K in O2 (P = 1 × 10⁻⁷ mbar) for 30 min. After each step we acquired an XPS spectrum in order to monitor the evolution of the relative Ce+3 ions concentration, performing a fitting procedure previously described [24]. NPs were also deposited on Lacey grids and transferred in N2 atmosphere to the electron microscopy facilities. The high resolution-high angle annular dark field (HR-HAADF)-STEM of the directly and post oxidized samples and the STEM-EELS experiments for all samples were carried out at EMAT on an aberration-corrected Titan 80–300 microscope operating at 120 kV [26] equipped with an Enfinium HR spectrometer (Gatan, Inc.). The relatively low accelerating voltage was combined with a small probe current (50 pA) in order to minimize beam-induced changes in the valence of the Ce ions [27]. To model the spectra, the EELSMODEL software package [28, 29] was used, where a power-law background was combined with two cerium M4,5 edge reference spectra (for Ce3+ and Ce4+). The intensities of the two reference components as well as the power law background were fitted to the acquired spectra. The HR-HAADF-STEM data of the sample oxidized in HV and the HR-TEM images of the directly oxidized sample were acquired on a JEOL JEM-2200FS working at 200 kV (point resolution of 0.19 nm). The HR-TEM images have been analyzed using the STEM CELL software package [30, 31].
3. Results and discussion
Figure 1 reports the XPS spectra of Ce 4d, Si 2p (figure 1(a)), O 1s (figure 1(b)) and Ce 3d (figure 1(c)) core-levels, taken from the samples prepared with the three different oxidation procedures (see the experimental section).
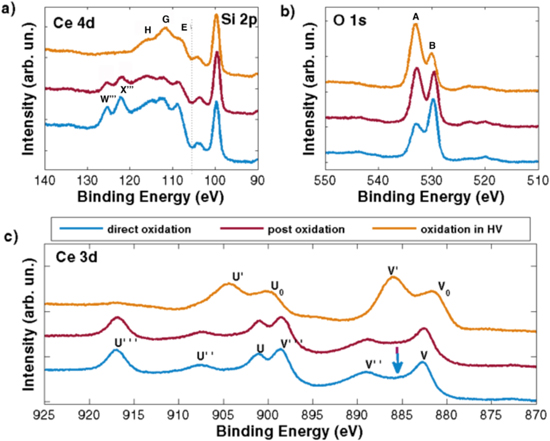
Figure 1. (a) Si 2p and Ce 4d XPS spectra; (b) O 1s XPS spectra and (c) Ce 3d XPS spectra of the as deposited samples. The light-blue line corresponds to the directly oxidized sample, the violet line to the post-oxidized sample and the orange line to the sample oxidized in HV.
Download figure:
Standard image High-resolution imageIn the Ce 4d photoemission spectra (left side in figure 1(a)) five different features can be identified, labeled as E, G, H, W‴ and X‴ following the notation of [32]. In the same spectra, Si 2p peaks are also present, corresponding to emission from bulk Si and native Si oxide at binding energy B.E. = 99.9 eV and B.E. = 104.0 eV respectively. It is important to know that, because of the multiplet splitting effect [33], the interpretation of the features in Ce 4d binding energy region is complex. We will use these features in order to discuss qualitatively any difference between the deposited samples, and in order to understand the effect of the oxidation procedure. Another factor that makes the analysis of such spectra complex is that the Ce 4d core level photoemission peaks are very close to the Si 2p one; furthermore, it has been demonstrated that complex reactions occur at the Si/CeOx interface leading to silicates formation, although in our case the presence of the SiOx strongly limits the reaction [33]. In spite of the difficulties of the Ce 4d XPS spectra analysis, some useful information can be obtained, because of the different escape depth values of the photoelectrons emitted from the Ce 4d (λ ≈ 1.8 nm) and Ce 3d (λ ≈ 1.1 nm). Therefore, Ce 4d XPS spectra probe a region deeper in the NP core than the Ce 3d ones. The energy peaks labeled W‴ and X‴ (on the left side of figure 1(a)) refer to the 4d5/2 and 4d3/2 components, and are associated to emission from Ce4+ ions [32]. They are both present in directly and post-oxidized samples, even if the Ce4d/Si2p intensity ratio is higher in the second case. This behavior is due to the different amount of NPs deposited in the two samples (see the experimental methods section). In contrast, W‴ and X‴ are completely absent in the spectrum from the sample oxidized in HV (orange line). The E, G and H peaks, visible in the spectrum of the sample oxidized in HV, can be attributed to a multiplet observed previously in emission from Ce3+ ions [32] (the peaks labeled D and F in [32] are not visible in our spectra). Although some structures in the same region are also present in the spectra taken from the post-oxidized and directly oxidized samples, it is not completely clear if their origin is the same in these two cases, as similar peaks could be attributed to emission from Ce4+ ions [32]. Nevertheless, it is reasonable to deduce that while the spectrum from the sample directly or post-oxidized can be ascribed mainly to Ce4+, the spectrum from sample oxidized in HV can be attributed mainly to Ce3+. The O 1s XPS spectra of the three samples, reported in figure 1(b), show two peaks labeled A and B separated by approximately 3 eV. Peak B (higher binding energy) is assigned to the lattice oxygen in CeO2, while peak A can be due to the superposition of contributions with different origin: chemisorbed OH groups coming from residual water in the HV chamber, presence of oxide ions at the NP surface with low coordination [34], or oxygen in the native oxide layer of the Si/SiOx substrate. The ratio between the intensity of the A and B peak is largest in the sample oxidized in HV, which has the highest Ce3+ concentration, it decreases in the post-oxidized sample and it shows the lowest value in the directly oxidized sample, consistently with its larger thickness compared to the other two samples. Figure 1(c) reports Ce 3d XPS data. The spectra of the directly and post-oxidized samples have a lineshape similar to previously observed data from CeO2 [32]. They have six peaks, labeled U‴, U'', U, V‴, V'', V (see figure 1(c)). The peaks V‴, V'', V arise from ionization of a 3d5/2 electron, while the U‴, U'' and U are due to emission from 3d3/2 core level [35]. If we consider the XPS spectrum of the sample oxidized in HV, it shows four peaks (labeled V0, U0, V', U') in figure 1(c) as in previously observed XPS spectra of Ce3+, thus of Ce2O3 compound [32]. It is clear that the sample oxidized in HV shows mainly Ce3+ related features, while the other two samples (the post oxidized and the directly oxidized samples) show mainly Ce4+ related features, in agreement with data shown in figure 1(a). We can deduce that the information obtained by the XPS results is similar within the depth (approximately between 1 and 2 nm) probed by the Ce 4d and the Ce 3d data.
We performed a microscopy analysis in order to evaluate the crystallinity, the exposed planes and the oxidation state distribution of the single NPs. The structure and morphology of the NPs were studied by HR-TEM and HAADF-STEM techniques. In figure 2 STEM images taken from the NPs grown with the three different procedures are shown. The particles obtained by post oxidation (see figure 2(a)) show a monocrystalline fluorite type structure exposing mainly the (111) and (100) surfaces, while the particles obtained by direct oxidation (see figure 2(b)) show a polycrystalline structure, probably responsible of a higher concentration of defects, and an irregular surface termination. A HAADF-STEM image of the sample oxidized in HV is shown in figure 2(c), with a higher magnification with respect to figures 2(a) and (b). Some small agglomerates are present in this case, but images from a single NP show a situation similar to figure 2(a), with a predominant monocrystalline structure and dominant (111) and (100) surfaces.
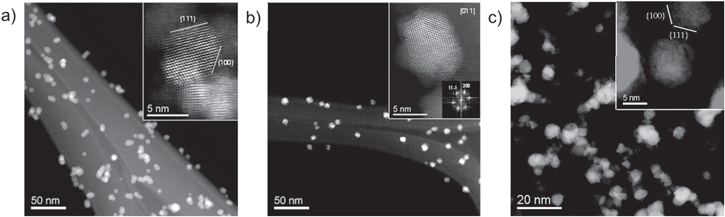
Figure 2. STEM images of CeO2−x nanoparticles of comparable size obtained by (a) post oxidation in the deposition chamber, (b) direct oxidation in the aggregation chamber, (c) oxidation in HV. The insets show high-resolution HAADF images.
Download figure:
Standard image High-resolution imageA HR-TEM image of a single NP of the directly oxidized sample is instead shown in figure 3(a). In order to make more evident its polycrystalline structure we performed a false color periodicity analysis based on the FFT, reported in figure 3(b). The periodicity analysis has been carried out masking and separating different components in the FFT, that correspond to different crystalline structures [36].
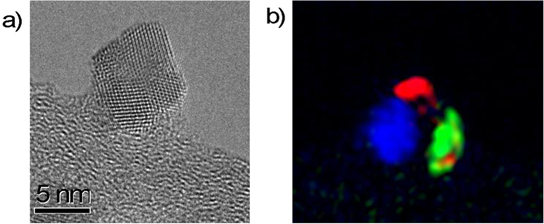
Figure 3. (a) HR-TEM image of a single ceria NP directly oxidized. (b) Polycrystalline structure of the directly oxidized sample as shown in false color as deduced by selection of the nodes of the FFT of image in (a) (see text for details).
Download figure:
Standard image High-resolution imageBy acquiring the Ce M4,5 edge spectra in STEM-EELS point-by-point (a so called spectrum image) it was possible to evaluate the spatial distribution of Ce3+ and Ce4+ ions inside individual particles, with a close to atomic resolution. An electron beam accelerating voltage of 120 keV was chosen in order to minimize beam-induced changes in the valence of the Ce ions [26, 37]. The spectra were modeled with a power-law background combined with Ce3+ and Ce4+ reference spectra (from CeF3 and bulk CeO2, respectively [37]) and fitted at each point of the spectrum image. The resulting coefficients multiplying the two references were used to generate the Ce3+ and Ce4+ maps. This analysis shows that, in the case of the post oxidized sample, Ce ions in the 3+ valence state can be found mainly in the surface region of the particles, forming a shell which is almost 0.7 nm thick (figure 4(a)). A different oxidation state distribution can be observed in the directly oxidized NPs, which show a not negligible concentration of Ce3+ ions even in the core region (see figure 4(b)). This may be explained by assuming that during NP growth in the gas aggregation region, where the NPs form, small CeO2 clusters with Ce3+ ions at the surface are formed, which interact with each other, and subsequently coalesce into larger NPs; thus the Ce3+ ions, that for the post oxidized NPs are confined at the surface, in this case are found also within the NP core, between two domains. The Ce3+ ions are distributed differently in the two cases, although the Ce 3d XPS spectra, sensitive to the surface oxidation state, are very similar. Figure 4(c) shows an EELS map of a small agglomerate of Ce NPs oxidized in HV. In this case the agglomerate was formed during deposition on the lacey grid. It must be reminded that the only difference between the samples oxidized in HV and the post-oxidized samples is the absence of exposure to oxygen after deposition on the substrate (see the experimental section). The oxidation state distribution within the single NP oxidized in HV looks similar to the post-oxidized sample: a core–shell structure, with a Ce4+ core and a Ce3+ shell (almost 1 nm thick), is observed. The very high concentration of surface Ce3+ ions, observed by XPS for this sample (figure 1(c)), is probably affected by air exposure during sample transfer to the TEM facility. The surface of the NP shows a significant concentration of Ce3+ ions, probably due to the higher stability of oxygen vacancies in the near surface region and to a partial hydroxylation of the defective surface sites. Figure 4(d) shows the ratio between the Ce3+ to Ce4+ average concentration as a function of NP size, resulting from EELS analysis (results from the sample oxidized in HV are not shown because of the strong variation of the oxidation state due to air exposure). In the case of the post oxidized sample the Ce3+/Ce4+ concentration decreases with the particle size, as previously observed on similar samples [26, 38], consistently with the formation of a reduced shell over an oxidized core. In NPs prepared by direct oxidation the Ce3+/Ce4+ concentration also decreases with increasing size, but it is systematically higher than in post oxidized samples. This behavior can be ascribed to the higher concentration of defects in the directly oxidized NPs, which consist of different crystal grains randomly oriented.

Figure 4. EELS maps of Ce3+ (red) and Ce4+ (green) oxidation state distribution after model-based fitting with Ce M4,5 reference spectra from Ce3+ and Ce4+, in the case of (a) post oxidation in the deposition chamber, (b) direct oxidation in the aggregation chamber, and (c) oxidation in HV. The scale bar in (c) is different from (a) and (b), and the image in (c) shows an EELS map of a small agglomerate of NPs, instead of a single NP, like in (a) and (b). (d) Ce3+/Ce4+ ratio as a function of the NP size. The error bars correspond to 10% relative errors in the determination of the ratios.
Download figure:
Standard image High-resolution imageFigure 5 reports Ce 3d XPS spectra of a complete reduction and oxidation cycle of the directly oxidized film. The spectra labeled A, B, C and D were acquired after the reduction cycle obtained by annealing in UHV at increasing temperature (from RT to 1020 K with steps of 250 K), while the spectrum denoted with E corresponds to the oxidation cycle obtained by annealing in presence of oxygen at 1020 K. By increasing the annealing temperature in UHV, the main Ce3+ related features (indicated with red arrows in figure 5) increase in intensity. In spite of the difficulties in obtaining absolute values of the concentration of Ce3+ [24], it was possible to monitor the behavior of NPs in reducing and oxidizing conditions. Ce 3d XPS spectra were fit with a linear combination of the Ce3+ and Ce4+ reference spectra, as described in [24]. Figure 6(a) reports the intensity of the Ce3+ component (relative to the total spectrum intensity) of the different samples after preparation and as a function of the annealing temperature.
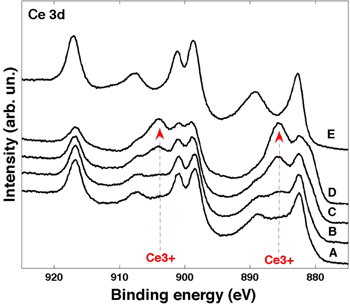
Figure 5. Ce 3d XPS spectra for a complete reduction and oxidation cycle: spectrum (A)–(D) are acquired on the sample at RT, and after annealing in UHV at 520 K, 770 K and 1020 K, respectively; spectrum E is acquired on the sample after annealing in the presence of oxygen at 1020 K. The red arrows indicate the position of the main Ce3+-related features.
Download figure:
Standard image High-resolution image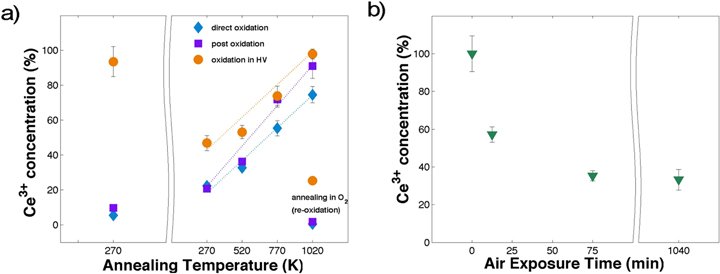
Figure 6. (a) Ce3+ XPS concentration resulting from the fitting of the XPS spectra acquired on the as deposited samples in the growth chamber (left side) and at different annealing temperatures under reducing and oxidizing conditions in a second UHV chamber (right side). (b) Ce3+ XPS concentration resulting from the fitting of the XPS spectra acquired on the as deposited sample oxidized in HV after exposure to air for different time intervals.
Download figure:
Standard image High-resolution image
First, it is possible to observe that air exposure, necessary for the transfer from the growth system to the second UHV chamber in order to perform the reduction and oxidation cycles, affects the Ce3+ concentration in all samples in different ways (see the points at 270 K in the left and right panels of figure 6(a). In the directly and post oxidized samples, the variation is small, and the Ce3+ concentration increases from 10% to almost 20%. If we consider the sample oxidized in HV the effect is more important and in the opposite direction, in fact the Ce3+ concentration now is 50% lower. To study in detail the effect of the air exposure on the oxidation state of the sample oxidized in HV we have acquired Ce 3d XPS spectra after air exposure for different times, in particular 0 min–15 min–75 min–24 h. The results of the fitting of the spectra in terms of Ce3+ concentration are reported in figure 6(b).
The Ce3+ concentration is significantly modified at the early stages of exposure (from 0 min to 75 min), then it reaches a plateau at approximately 30% Ce3+ concentration. The slight increase of Ce3+ concentration observed for the directly and post oxidized samples after air exposure is possibly ascribed to OH absorption, while the sample oxidized in HV, being mainly composed by Ce2O3, is instead oxidized under air exposure. The evolution of the Ce3+ concentration obtained by the fitting of the Ce3d XPS spectra during the reduction and oxidation cycles are reported on the right side of figure 6(a). The behavior of the three samples is clearly different. The increase of the Ce3+ concentration as a function of temperature was fit by a straight line for all samples. The sample oxidized in HV shows the highest degree of reduction before and during the thermal treatment, and the slope of the Ce3+ concentration is 0.069 Ce3+ (%)/K. In addition, this sample is not completely re-oxidized in the oxidation conditions chosen, at variance with the other two samples, that result instead completely oxidized. In the directly oxidized sample the Ce3+ concentration, increases with a slope equal to 0.072 Ce3+(%)/K, a value comparable to the sample oxidized in HV. The directly oxidized sample is not completely reduced at the chosen conditions. In the post oxidized sample the Ce3+ concentration increases with the highest slope equal to 0.099 Ce3+(%)/K. Furthermore, above 770 K, the Ce3+ concentration is higher than in the directly oxidized sample, and at the highest reduction conditions chosen it shows a Ce3+ concentration of 91.9%. The differences in the degree of reduction of the three samples during the thermal treatments in UHV can be explained with the help of the results obtained by TEM analysis. The synoptic table 1 summarizes the results obtained for the different samples. In the post oxidized NPs the high degree of crystallinity and the low density of defects in the core region are very likely responsible for a high mobility of oxygen ions within the NP. Moreover, the presence of (100) exposed planes (with oxygen vacancy formation energy lower than (111) planes) is certainly relevant for the observed high reducibility. On the contrary, in the directly oxidized NP the polycrystalline structure, implying a high density of structural defects in the NP bulk, hinders oxygen ion mobility within the particle. The NPs oxidized in HV, having a rather high degree of reduction are less stable and tend to agglomerate. The formation of NP aggregates prevents an efficient re-oxidation of the NPs, and at the same time it could reduce the efficiency of ceria as a catalyst, as evidenced by Ce3+ concentration increase rate, see table 1. A possible strategy to overcome this difficulty could be to synthesize the NPs with the post-oxidation procedure (see table 1) and to use supports that could avoid the agglomeration, with a uniform distribution of active sites for NP adsorption.
Table 1. Synoptic table summarizing the results of the structural, morphological and chemical analysis and the Ce3+ concentration increase rate during the reduction cycle for the three samples.
| Sample | Structure | Surface orientation | Surface Ce3+ concentration | Distribution of Ce3+ ions | Ce3+ concentration increase rate with reducing cycles (%/K) |
|---|---|---|---|---|---|
| Post-oxidized NP | Single crystalline | (111) + (100) | Low | Mainly in the shell | 0.099 |
| Directly oxidized NP | Polycrystalline | Irregular | Low | Core and shell | 0.072 |
| HV oxidized NP | Single crystalline | (111) + (100) | Higha | Mainly in the shella | 0.069 |
aThe information have been acquired after air exposure that strongly affects the NPs oxidation state for the NPs oxidized in HV.
4. Conclusions
Non-stoichiometric ceria NPs have been physically synthesized with a magnetron gas aggregation source. Starting from a pure metallic cerium target, the NPs were oxidized in three different ways which give rise to different crystallinity and structural defects densities. It was possible to investigate the influence of the NPs characteristics on the reducibility of the system, tested by thermally induced oxidation and reduction cycles. The different behavior is related to the density and distribution of the structural defects inside the NPs identified by HR-TEM and S-TEM. This work shows that the mobility of oxygen ions is strongly influenced by the density of defects in the core of the NPs. Non-stoichiometric ceria NPs, with a core–shell structure (CeO2 core and Ce2O3 shell) exposing (111) and (100) planes, show a higher reducibility than polycrystalline NPs with an irregular structure, because of the absence of defects in the NP bulk. The obtained results are relevant for the understanding of nanocatalyst response, and are useful in view of the production of catalytic NPs with desired oxygen transport properties.
Acknowledgments
The authors gratefully acknowledge financial support by the Italian MIUR under grant FIRB RBAP115AYN (Oxides at the nanoscale: multifunctionality and applications). The activity is performed within the COST Action CM1104 'Reducible oxide chemistry, structure and functions'. The research leading to these results has received funding also from the European Union Seventh Framework Programme under Grant Agreement 312483—ESTEEM2 (Integrated Infrastructure Initiative–I3).