


Abstract
In metallized film capacitors, there exists an air gap of about 0.2 μm between the films, with a pressure ranging generally from 1–30 atm. Because of the created potential difference between the two films, a microdischarge is formed in this gap. In this paper, we use an implicit particle-in-cell Monte Carlo collision simulation method to study the discharge properties in this direct-current microdischarge with 0.2 μm gap in a range of different voltages and pressures. The discharge process is significantly different from a conventional high pressure discharge. Indeed, the high electric field due to the small gap sustains the discharge by field emission. At low applied voltage (∼15 V), only the electrons are generated by field emission, while both electrons and ions are generated as a stable glow discharge at medium applied voltage (∼50 V). At still higher applied voltage (∼100 V), the number of electrons and ions rapidly multiplies, the electric field reverses, and the discharge changes from a glow to an arc regime.
Export citation and abstract BibTeX RIS

Content from this work may be used under the terms of the Creative Commons Attribution 3.0 licence. Any further distribution of this work must maintain attribution to the author(s) and the title of the work, journal citation and DOI.
1. Introduction
Metallized film capacitors (MFCs) have been used as energy storage systems with high energy density [1] since the 1950s in pulsed power techniques. They have the significant advantage of self-healing and clearing a defect in a dielectric [2], which is the spontaneous extinction of a local electrical breakdown due to some defects. A dielectric film inevitably bears defects or impurities, forming a 'weak power point' or 'discharge point' in all kinds of capacitors. Such a breakdown will destroy the device for traditional film capacitors. However, by using MFCs, the arc discharge extinguishes without causing large damage except for the destruction of a small area of the metal layer around the defect. Hence, the capacitor can continue to operate without interruption and with just a small amount of capacitance loss. Therefore the lifetime of the capacitor is greatly extended. Improving the performance and lifetime of MFCs has been of great interest and is studied by many researchers.
In MFCs, a dielectric polymer film with several μm thickness is typically used as the storage medium, and a very thin (several nm) metal film is deposited on the polymer film as the electrode [3]. The metallized film will be tightly wound around a cylinder, after which the films will be processed by heat treatment to expel air from the winding as uniformly as possible. After the treatment, the pressure between the thin film layers of the capacitor can be up to tens of MPa [2]. However, even after experiencing tension control and thermal stabilization, the air in the segmented gaps cannot be totally removed, leading to a dielectric film/air/metal electrode system. In typical MFCs, the films are made of 7.5 μm polypropylene with a 1 nm metallized aluminum electrode and an air gap size of about 0.1–0.2 μm. The pressure in the air gaps ranges from one to tens of atmosphere, and the applied DC voltage to each air gap is several tens of V.
The dielectric film in MFCs inevitably bears defects or impurities, forming a weak power point. With increasing applied voltage, the film at this point will discharge first, forming a discharge channel. Because the high pressure air has a much lower electrical strength than the dielectric polymer film, and the air gap will withstand the high electric field strength during the charging of the capacitor, the breakdown and failure will most likely occur first in the air gaps [4, 5]. The charged particles produced by the air discharge will bombard the dielectric film and sometimes produce a breakdown in it, and finally self-healing will occur. Discharges initiated and sustained by field emission have been known for over 60 years [6, 7] and have been used in displays [8] and pulsed power devices [9], but we have still little knowledge about this kind of discharge in the sub-micrometer range. It is clear that understanding this discharging process is crucial to select the criterion that really controls the self-healing process and thus to improve the performance of MFCs. In fact, although many experimental efforts have been performed to study this process [1–4], no numerical simulations have been performed to investigate it up till now.
Besides the application and engineering implications for MFCs, studying this breakdown process will also improve our understanding of micro discharges (MDs) at atmospheric pressure [10]. As is well known, the breakdown in large gaps at atmospheric pressure follows the Paschen curve ( μm) [11–13]; that is, the breakdown voltage is obtained as a function of pd (pressure times gap size). The Paschen law is based on the electron multiplying effect by collisions when the electron mean free path is much smaller than the gap size. However, when the gap size is significantly reduced to sub-μm dimensions, as is the case for MFCs, the electron mean free path becomes comparable to the gap size, and then the Paschen law fails [14]. Indeed, experimental and theoretical studies have shown that for a small gap (
 μm) and high pressure, the breakdown voltage seriously deviates from the Paschen curve [10, 15–17]. Hence, the present study will also enable us to understand the fundamental physical processes involved in micro-gap discharges at sub-μm level, which has not been explored until now. Each layer of an MFC can be approximated as an ideal parallel-plate capacitor [2], where the dielectric layer and the air gap can be treated as two capacitors in series between the two electrodes. When an MFC is charging, the voltage applied to the metal films will be divided between the dielectric film and the air layer. About 1–10% of the total applied voltage is applied to the air layer; hence this corresponds to an amplitude of 10–100 V when a charging voltage of several thousand volts is used. The average thickness of the air layer is 0.1–0.2 μm, which can be deduced from the capacitance change after the capacitor is immersed in the transformer oil. Therefore, the corresponding local electric field strength in the air gap can reach
  Vm−1, which will lead to high field emission, as well as possible intense local ohmic heating [18]. As mentioned above, due to the small air gap, the mean free path of the electrons is comparable to the gap spacing. Thus, when the field emitted electrons pass across the air gap, they will induce far less than 10% ionization collisions, which is usually not sufficient to produce the avalanche process that appears in traditional high-pressure discharges [19].
2. Description of the model
In order to study the underlying physics of MFCs, we simulated the breakdown process in a single air layer of an MFC. As this discharge is generally at non-equilibrium, and the electron velocity distribution is typically non-Maxwellian, it is necessary to employ a particle-in-cell/Monte Carlo (PIC/MC) model [20]. We use an implicit PIC/MC method [21], which allows the use of much larger space and time steps, while keeping the same accuracy, to simulate the space-time evolution of the discharge behavior. Here we use a one-dimensional (1D) direct implicit method, in which the field equations are derived from direct summation and extrapolation of the equations of particle motion. Our method has been described in detail and tested widely before [22]. Generally, the implicit method is numerically stable over the spatial steps, but the spatial steps will limit the spatial resolution. The only numerical stability limit is the Courant condition ( , where Vth is the thermal velocity) and an empirical condition of
  . However, even if an implicit method yields a stable numerical solution, it would be at least physically wrong if the cell spacing cannot resolve the plasma sheath width. In the configuration considered here, the physical correctness is guaranteed by resolving the sheath properly; i.e., we used 1 nm cell spacing, whereas the Debye length at
  m−3 and an electron temperature of 5 eV is around 3 nm.
The air gap is simplified to a discharge between two parallel plate electrodes with a thickness of 0.2 μm. A direct current-voltage source with values of 15, 50, and 100 V is used to drive the discharge. At the boundaries, the electrons and ions are assumed to be absorbed. Electrons are emitted from the cathode by means of field emission (FE), and the FE current density is calculated by the Fowler–Nordheim equation with the emitter electric field E and the work function ϕ [23],
where  eV for aluminum,
  is the field enhancement factor (which accounts for the local roughness and defects), and the numerical constants
  , 4.52, and
  are explained in more detail in [23]. The constant
  has units of A eV V−2, the constant 4.52 in the exponent of 10, (
 ) has units of V
 , and the constant
  in the exponential function has units of m−1V
 . Thus the term in the exponential function is dimensionless, and the FE current density has units of Am−2. As the electron and ion numbers increase rapidly due to the FE electrons, a particle merging algorithm is used when the macro particle number exceeds a certain value (typically 400 per cell).
In this study, we focus on the discharge physics and not on the chemistry occurring in the air plasma. Therefore, argon gas is used instead of air, at a temperature of 300 K, to limit the calculation time. The pressure is varied as 1, 10, and 30 atm. The initial electron and ion temperatures are 3 eV and 300 K, respectively. A standard MC procedure [24] is used, in which only electron-atom and ion-atom collisions (i.e., electron impact ionization and excitation from the Ar ground state, and electron-Ar and Ar+-Ar elastic collisions) are considered, as the ionization degree is never larger than 1%, and Coulomb collisions are negligible [22]. The cross sections for these reactions are adopted from [25]. The simulation time-step is fixed at  s, and the simulations are run for 105 time-steps. The gap space is divided into 200 cells.
3. Results and discussion
From our simulations, three different discharge behaviors, i.e., a so-called low, medium, and high voltage mode, can be distinguished. When the applied voltage is 15 V and the pressure is 10 atm, the discharge is in the so-called low voltage mode. The corresponding space-time evolutions of (a) the electron density and (b) the electric field are shown in figure 1. Note that the cathode is at position 0, and the anode is at position 0.2 μm in all figures. The electrons are quickly generated from the cathode by FE, and therefore the electron density is higher close to the cathode. Further away from the cathode, the electron density will decrease, as no new electrons are generated by collisions, and the electron energy will increase due to heating by the electric field on its way toward the anode. The electron density increases quickly as a function of time until 0.6 ps. The profiles of electron density show that the electrons move toward the anode in this time frame. After 0.6 ps, the electron density varies slowly as a function of time until the discharge reaches a steady state at 0.8 ps; i.e., the electron density and electric field do not change anymore as a function of time. The maximum electron density is  m−3 at the cathode. At these conditions, nearly no ions are observed, because the energy of the electrons is typically insufficient to produce effective ionization. As the electron density is rather low, the electric field is nearly constant (
 Vm−1) in the entire simulated time and space, and it is only slightly larger than the initial electric field of
  Vm−1 when no electrons exist.
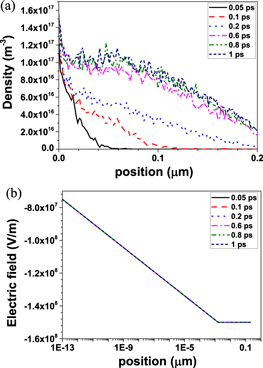
Figure 1. Space-time evolutions of (a) the electron density and (b) the electric field at 10 atm and 15 V applied voltage.
Download figure:
Standard image High-resolution imageThe maximum electron current density is around 6000 Am−2 and is also reached after 0.8 ps. It is nearly constant in the entire region between cathode and anode, as no new electrons are created by ionization in the region between cathode and anode. We have also found that the discharge can be stable over quite a long time, even during our longest simulations run ( ps). Hence, in the low voltage mode, the discharge behaves similarly to a plane electron diode [26], where the current is space-charge-limited [26]. The only difference is that the current is not only determined by the voltage but also by the collisions. Since there are only FE electrons but no ions in the gap, it is clear that the 15 V driving voltage cannot induce breakdown of the Ar gas. Thus, our simulations illustrate that at this low voltage mode, the MFCs can work unconditionally safely.
In order to obtain breakdown of the gas, it is necessary to increase the driving voltage, at least above the ionization threshold of 15.76 eV. When the applied voltage is between 20–95 V at a pressure of 10 atm, the discharge is in the medium-voltage mode. We show the results at 50 V because they are representative for this case. In this mode, some of the electrons will produce ionization, but the number of electrons produced by electron ionization is still much smaller than the number of FE electrons. The background gas is partially ionized, but no avalanche breakdown will occur, as the electrons will rapidly vanish at the anode. The corresponding space-time evolutions of (a) the electron and ion densities, (b) the electron and ion current densities, (c) the electric field, (d) the electron temperature, and (e) the ion temperature, are shown in figure 2. As shown in figure 2(a), the electrons are quickly generated by the FE from the cathode, similar to the low voltage mode, and the electron density gradually increases as a function of time. The electron density increases rapidly until 0.2 ps and then more slowly, until it reaches a steady state at 0.6 ps. At 0.05 ps, the electron density has again its maximum at the cathode and drops quickly toward the anode, but at later times it drops more slowly, because additional electrons are created by ionization on their way toward the anode. At 0.6 ps, the spatial distribution of the electron density becomes relatively uniform; that is, the discharge is mainly sustained by FE electrons, which will create a small amount of new electrons by ionization. The ions start to be generated after 0.05 ps. Near the cathode, the ion density is zero, since the collision mean free path of electrons is about 0.05 μm, but after 0.05 μm the ion density increases toward the anode. At 0.6 ps the ion density becomes even higher than the electron density after 0.05 μm, and at 1 ps, the ion density is clearly higher than the electron density. At 1 ps, the maximum electron and ion densities are  and
and  m−3 and are found at the cathode and the anode, respectively. Note the electron density becomes stable within 1ps, but the ion density will keep increasing to about 100 ps, and the final ion density will be increase to near 1020 m−3. The profiles of the electron and ion density are always similar after 1 ps.
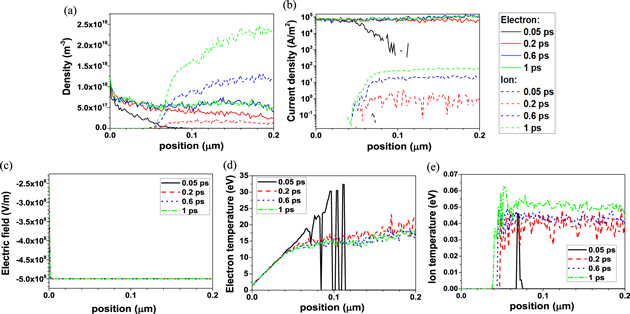
Figure 2. Space-time evolution of (a) the electron and ion densities, (b) the electron and ion current densities, (c) the electric field, (d) the electron temperature, and (e) the ion temperature at 10 atm and 50 V applied voltage.
Download figure:
Standard image High-resolution imageFigure 2(b) shows the electron and ion current densities. The electron current density drops quickly away from the cathode at 0.05 ps, as the electrons cannot yet reach the anode, but at later times it stays constant between cathode and anode ( Am−2), and it does not change as a function of time between 0.2–1 ps, because the current generating mechanism before breakdown in the bulk gas is FE. Therefore there is no further current rise in the discharge itself.
The ion current density is negligible at 0.05 ps, but it increases clearly with time, from 1.3 Am−2 at 0.2 ps to 100 Am−2 at 1 ps. Hence, it is clear that the current is still mainly carried by the electrons, created by FE.
Figure 2(c) shows that the electric field remains constant at a value of  Vm−1 in the entire simulated region, which is significantly larger than in the case of 15 V. Nevertheless, because the electron and ion densities (
 m−3) are still too low to modify the electric field, the latter is still nearly constant over the entire gap. It can be concluded that the discharge is still sustained by the FE electrons as in the low voltage mode, and the contribution of the bulk electrons, created by gas ionization, to the total electron population is still very small compared to the FE electrons.
Figure 2(d) and 3 shows the electron and ion temperatures. At 0.05 ps, the electron temperature increases linearly with space between 0–0.1 μm. As mentioned above, the electrons cannot yet reach further distances from the cathode at this short time. The ion temperature shows a non-zero value at 0.07 μm from the cathode, which has, however, no real meaning, as it corresponds to a negligible number of ions. At later times, the electron and ion temperatures are almost constant as a function of time (0.2–1 ps). The electron temperature gradually increases from 1 eV at the cathode to 20 eV at the anode. It shows a linear increase with space between 0 and 0.05 μm, and then the increase becomes more moderate due to the collisions between the electrons and the background gas, because the collision mean free path is ∼0.05 μm. The ion temperature is not defined below 0.04 μm, because no ions are present in the discharge in this region. It takes a constant value of about 0.04 eV in the rest of the discharge, because the ions can undergo many collisions and reach a thermal equilibrium with the background gas; thus the ion temperature is very close to the gas temperature ( eV). Thus we can conclude that in the medium voltage mode, there are mainly FE electrons and ions created by FE electrons in the discharge, so the 50 V driving voltage cannot yet induce an avalanche in the bulk gas. The whole discharge remains at steady state with a low ionization rate (much smaller than 1%), corresponding to a stable glow discharge regime observed in MDs at atmosphere pressure [27].
If the voltage increases further, to about 95 V and higher, the discharge will be sustained by the bulk electrons created by ionization in the gas. This is characteristic for the high voltage mode. Figure 3 shows the space-time evolutions of (a) the electron and ion densities, (b) the electron and ion current densities, (c) the electric field, (d) the electron temperature, and (e) the ion temperature at 100 V and 10 atm. In the initial stage the FE electrons are generated quickly, as in previous cases, but the electron density is much higher than at the lower voltages investigated, and it increases dramatically as a function of time (figure 3(a)). Moreover, after a first drop, it starts increasing as a function of distance from the cathode (which cannot, however, be observed clearly in figure 3(a) due to the logarithmic scale). Indeed, the number of electrons is quickly multiplied due to electron impact ionization, and this causes an avalanche. The maximum density in the bulk is 6 × 10²², 1023, 8 × 10²³, and 3 × 1025 m−3, respectively, at 0.05, 0.2, 0.6, and 1 ps. In contrast to figure 2, in figure 3 both the electron and ion density distributions do not reach equilibrium within 1 ps. This is probably due to the fact that in figure 3, the major part of the electron density comes from gas ionization, which is a slower process compared to field emission and distribution of electrons across the gap. Shortly after 1 ps, the number of particles rapidly increases beyond the capability of the code. The assumptions of the physical model are no longer valid, because the background gas heating is significant, and the self-magnetic field can no longer be neglected. Since the ionization is so strong and even, an avalanche-like process can be observed. We can conclude that the glow to arc transition will occur.
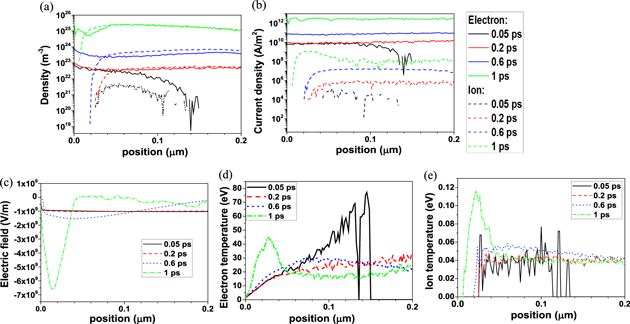
Figure 3. Space-time evolution of (a) the electron and ion densities, (b) the electron and ion current densities, (c) the electric field, (d) the electron temperature, and (e) the ion temperature at 10 atm and 100 V applied voltage.
Download figure:
Standard image High-resolution imageUnder these high voltage conditions, the ions are being generated very quickly (i.e., from 0.02 ps), and the ion density increases much faster than at the lower voltages investigated (15 V and 50 V). Moreover, its maximum is now found in the bulk center, due to bulk ionization. It is most interesting to see in figure 3(a) that the electron and ion densities at 1 ps show a quasi-neutral region in the bulk, ranging to the anode, with a maximum value of  m−3, which points out again that bulk ionization is sustaining the discharge. The FE electrons are only dominant in the sheath very near the cathode. Note that the high density
  m−3 in the quasi-neutral bulk region indicates that the system develops into an arc discharge, as the ionization rate is very high (ionization degree slightly below 10%). This is also clear from figure 3(b), which shows that the maximum electron current density is
  , 9 × 10¹⁰, 1011, and
  Am−2 at 0.05, 0.2, 0.6, and 1 ps, respectively, which is also characteristic for an arc discharge. The maximum ion current density is
  , 7 × 10⁵,
  , and 109 Am−2 at 0.05, 0.2, 0.6, and 1 ps, respectively, which is also very high, and characteristic for an arc discharge.
Figure 3(c) shows the electric field profiles at 0.05, 0.2, 0.6, and 1 ps. At 0.05 and 0.2 ps, the electric field profile is similar to the lower voltage cases, due to the low electron and ion densities. However, due to the presence of ions, some of the electron charges will be neutralized, and thus more electrons will be emitted by FE, leading to a stronger electric field of  Vm−1. At 0.6 ps, the electric field exhibits a shallow well-shaped distribution with a maximum amplitude of
  Vm−1. This is the intermediate stage for forming a reversion of the electric field and a plasma potential well. At 1 ps, since the electron and ion densities increase rapidly with time, a field reversion occurs when the electron and ion densities are high enough to shield a substantial part of the applied electric field. Consequently, the electric field at around 0.04–0.07 μm becomes positive, forming a potential barrier with values up to
  Vm−1 as a result of the quasi-neutral region of 0.06–0.2 μm. Thus two potential wells are observed at both sides of the barrier. This will prevent the electrons from being lost, explaining the high electron density values. The electron and ion densities reach their maximum values at this barrier. At the right side of the barrier, the electric field drops smoothly to a value of
  Vm−1 at the anode, because the electrons and ions show a quasi-neutral density. At the left side of the barrier near the cathode, a deep negative electric field potential well is formed with amplitude of
  Vm−1 at 0.015 μm, which corresponds to the sheath edge in the density profile of figure 3(a). In the sheath there are no ions, and nearly all electrons are created by FE. The number of electrons and ions rapidly increases from the sheath edge to the barrier, where the electrons and ions reach a quasi-neural density. Note that the barrier would move nearer to the cathode if the simulation continues after 1 ps, and a transition into an arc discharge would occur. However, our model is not really suitable to describe the discharge in the arc regime, where the magnetic field and gas heating cannot be neglected. It should be realized that in our PIC-MC model, we adopted a 1D electrostatic model, and we do not consider the magnetic field induced by the plasma current. Moreover, we also keep the density and temperature of the background gas fixed. Both assumptions are valid as long as the total ionization rate is not very high (i.e., ionization degree
  ) and the gas heating is not significant, which is indeed the case for the MDs operating in the glow regime. Therefore, the upper plasma density limit of our simulations is about
  m−3 at the operating conditions under study in the simulation time within 1 ps; larger densities than this value will be unreliable. At longer times, the plasma density would increase rapidly, and the calculations would collapse shortly.
Figure 3(d) and (e) shows the electron and ion temperatures. At 0.05 ps the electron temperature increases linearly with distance between 0–0.15 μm; this is the furthest distance the electrons can travel at this short time. At 0.2 ps, the situation is similar to the lower voltage cases, with a gradually increasing electron temperature as a function of distance from the cathode and a quite low ion temperature. The same is true at 0.6 ps, but now the electron and ion temperatures show a shallow peak in the bulk with values of 29 eV and 0.055 eV, respectively. This is the result of the corresponding electric field, which also shows a shallow well-shaped distribution. At 1 ps, the electrons and ions are significantly heated and exhibit peaks of 45 eV and 0.09 eV, respectively, due to the deep potential well in the electric field in front of the cathode.
Finally, figure 4 illustrates the pressure effect on the electron and ion density profiles at 1 ps and 100 V. It is clear that the electron and ion densities at 1 atm are much smaller than at 10 and 30 atm, where the densities exceed  m−3. There is only a small difference in density between 10 and 30 atm. This illustrates that it is easy to sustain a steady glow discharge at atmospheric pressure in this small gap discharge, while a transition from glow discharge to arc discharge is inevitable when the pressure is up to tens of atm. This fact may partially explain that the deterioration is more severe in the edge than in the center with the same radius, due to lower pressure [5, 28]. Note that increasing the pressure will lead to more collisions and lower energy bombarding to the film, thus decreasing the deterioration possibility and perhaps increasing the lifetime, if the capacitor is working under safe voltage [5, 28].

Figure 4. Pressure effect on the spatial distribution of the electron and ion densities at 1 ps and 100 V applied voltage.
Download figure:
Standard image High-resolution image
4. Conclusion
In summary, this study describes the micro-gap discharge process in MFCs for three different driving voltages. We can distinguish a low-, medium-, and high-voltage mode. At low voltage (15 V), only FE electrons exist without ions, and the micro-gap performs similarly to the case of an electron beam diode, with an electron current density of about 6000 Am−2 and a weak electric field of  Vm−1 at 1 ps. At medium voltage (50 V), ions are generated at around 0.05 ps, but the electron and ion densities (i.e., around
  m−3 and
  m−3) are still too low to induce a bulk electron sustained discharge. Hence, the discharge is mainly sustained by FE electrons, with electron and ion current densities of around 105 Am−2 and 100 Am−2 and an almost uniform electric field of
  Vm−1 in the entire gap at 1 ps. At high voltage (100 V) the electric field is reversed, and a positive electric field (of
  Vm−1) is observed in the bulk around 0.06 μm, forming a potential barrier. This potential barrier prevents the electrons from being lost, so the bulk electrons are rapidly multiplied, and at 1 ps an avalanche occurs, forming a quasi-neutral density region. Moreover, this leads to two potential wells at both sides of the barrier. A deep potential well near the cathode (with amplitude of
  Vm−1) results in significant heating of the electrons up to 45 eV. The qualitative predictions of this work can explain some observations in recent experiments [5, 28].
This simulation illustrates the basic physical processes of an MD in a micro-gap of MFCs, distinguishing three different operating voltage cases. At high voltage (100 V), the bulk electron and ion densities are very high ( m−3), as well as their maximum current density (
 Am−2 for the electrons and
  Am−2 for the ions), which indicates that a local transition of glow to arc discharge would occur, and damage of the dielectric film would be inevitable. At medium voltage, i.e., from 20–95 V, the electrons are generated with densities of
  m−3, and some ions might bombard the surface of the dielectric film, resulting in some deterioration of the film. At low voltage (∼15 V), however, no discharge will occur in the MFCs. Our simulations show that in sub-micrometer gas discharges, at low to medium voltages the discharge is mainly sustained by FE and not by bulk ionization, as the gap spacing is comparable to the electron ionization mean free path. Almost no avalanche will occur, a result which is totally different from conventional discharges. Therefore, the MFCs can work properly up to three times the ionization threshold, or about 50 V per layer. However, some ions will still be generated, and they may slightly harm the dielectric film if the voltage becomes higher (
 .
.
It should be noted that the calculations performed in this paper are for argon gas, whereas the discharge in metallized film capacitors is sustained in air. This might change the quantitative results, as different types of collisions can occur in air, i.e., not just elastic collisions, excitation and ionization, but also vibrational excitation of the N2 and O2 molecules, dissociation, dissociative ionization, (dissociative) attachment, and chemical reactions, as well as electron-ion and ion-ion recombination. However, the recombinations can be neglected, as the breakdown time in this paper is very short. In general, we think that the qualitative results of the present paper will also be valid in air.
Acknowledgments
This work was supported by the NSFC (11105057, 11275007). WJ and YZ gratefully acknowledge the China Scholarship Council and the Belgian Federal Science Policy Office for financial support. The authors thank Hua Li of Huazhong University of Science and Technology for suggestions for this work. The calculations were performed using the Turing HPC infrastructure at the CalcUA core facility of the Universiteit Antwerpen, a division of the Flemish Supercomputer Center VSC, funded by the Hercules Foundation, the Flemish Government (department EWI), and the Universiteit Antwerpen.