Optimizing control strategies for urine nitrification: narrow pH control band enhances process stability and reduces nitrous oxide emissions
 Valentin Faust
 Nico Boon
 Ramon Ganigué
 Siegfried E. Vlaeminck
 Kai M. Udert
- 1Eawag, Swiss Federal Institute of Aquatic Science and Technology, Dübendorf, Switzerland
- 2ETH Zürich, Institute of Environmental Engineering, Zürich, Switzerland
- 3Center for Microbial Ecology and Technology (CMET), Faculty of Bioscience Engineering, Ghent University, Gent, Belgium
- 4Centre for Advanced Process Technology for Urban Resource Recovery (CAPTURE), Gent, Belgium
- 5Research Group of Sustainable Energy, Air and Water Technology, Department of Bioscience Engineering, Faculty of Science, University of Antwerp, Antwerpen, Belgium
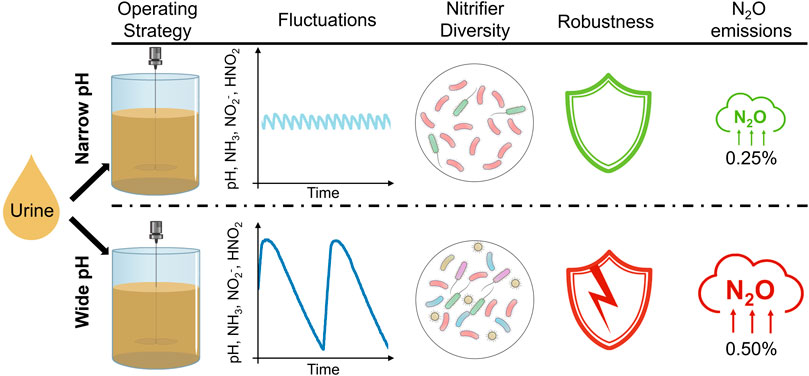
Nitrification is well-suited for urine stabilization. No base dosage is required if the pH is controlled within an appropriate operating range by urine feeding, producing an ammonium-nitrate fertilizer. However, the process is highly dependent on the selected pH set-points and is susceptible to process failures such as nitrite accumulation or the growth of acid-tolerant ammonia-oxidizing bacteria. To address the need for a robust and reliable process in decentralized applications, two different strategies were tested: operating a two-position pH controller (inflow on/off) with a narrow pH control band at 6.20/6.25 (∆pH = 0.05, narrow-pH) vs. a wider pH control band at 6.00/6.50 (∆pH = 0.50, wide-pH). These variations in pH also cause variations in the chemical speciation of ammonia and nitrite and, as shown, the microbial production of nitrite. It was hypothesized that the higher fluctuations would result in greater microbial diversity and, thus, a more robust process. The diversity of nitrifiers was higher in the wide-pH reactor, while the diversity of the entire microbiome was similar in both systems. However, the wide-pH reactor was more susceptible to tested process disturbances caused by increasing pH or temperature, decreasing dissolved oxygen, or an influent stop. In addition, with an emission factor of 0.47%, the nitrous oxide (N2O) emissions from the wide-pH reactor were twice as high as the N2O emissions from the narrow-pH reactor, most likely due to the nitrite fluctuations. Based on these results, a narrow control band is recommended for pH control in urine nitrification.
1 Introduction
Current fertilizer production relies heavily on energy-intensive nitrogen fixation using the Haber-Bosch process and the mining of non-renewable phosphorus reserves (Randall and Naidoo, 2018). Since urine is rich in these nutrients containing 80% of the nitrogen and 50% of the phosphorus found in domestic wastewater, on-site separation of urine and the recovery of its nutrients offers an alternative fertilizer production, which allows for a local shortcut in the nutrient cycle (Maurer et al., 2006). Urine-based fertilizer production could be of interest not only for terrestrial applications but is also being explored in the context of bioregenerative life support systems for Space applications, such as the European Space Agency’s Micro-Ecological Life Support System Alternative, MELiSSA (Clauwaert et al., 2017). However, before urine can be used as a fertilizer, it must be stabilized, which can be accomplished by nitrification, among other methods (Larsen et al., 2021). Without the addition of alkalinity, about 50% of the total ammoniacal-nitrogen (TAN) in urine is converted to nitrate. Despite this partial conversion, ammonia volatilization is prevented because the pH drops during nitrification shifts virtually all TAN to non-volatile ammonium (Faust et al., 2023).
Due to the limited alkalinity of urine, high pH fluctuations can occur during batch operation (Udert et al., 2003) and continuous flow operation (Sun et al., 2012), which in turn affect the activity of ammonia-oxidizing bacteria (AOB) and nitrite-oxidizing bacteria (NOB) and can lead to process failures. Fumasoli et al. (2016) suggested controlling the pH in the nitrification reactor with the urine influent using an on/off controller within a narrow range (ΔpH = 0.05), such as pH 5.80 to 5.85. Similar approaches were used by Volpin et al. (2020), Ren et al. (2021), and Jiang et al. (2021), who operated urine nitrification reactors at a narrow pH range of 6.2 ± 0.1 to achieve stable nitrification. According to Faust et al. (2023), stable nitrification, i.e., without nitrite accumulation, is most likely to occur in a pH range of 5.8 and 6.7, but again only a narrow pH control band of ΔpH = 0.05 was examined. However, process failures can occur despite keeping the pH changes within a narrow range. In particular, sudden increases in pH, high temperatures, and low dissolved oxygen concentrations can lead to continuous nitrite accumulation, as shown, for example, by Faust et al. (2022a) and Volpin et al. (2020). Nitrite in the effluent is a concern because it can increase N2O emissions during nitrification (Faust et al., 2022a), is toxic to plants (Oke, 1966), and can be lost to the gas phase during downstream processing, such as distillation for purification and concentration (Udert and Wächter, 2012). Another process disturbance, the cessation of the influent, can lead to a decrease in pH and to the growth of acid-tolerant AOB (Faust et al., 2022b), which can further decrease the pH and lead to the release of harmful nitrogen oxide (NOx) gases through chemical nitrite oxidation (Fumasoli et al., 2017).
A wider control band of ΔpH = 0.50, e.g., has not been reported so far but may foster a higher microbial diversity and a more robust process. A larger control band results in greater fluctuations not only in pH but also in free ammonia (NH3) due to the chemical speciation (pKa,25 °C ≈ 9.25), which affects the ammonia oxidation because NH3 is the substrate of AOB (Stein, 2019). A change in nitrite production from AOB can further lead to strong nitrite (NO2−) and, therefore, nitrous acid (HNO2) variations (pKa,25 °C ≈ 3.25). It has been shown that such environmental fluctuations can lead to higher microbial diversity due to ecological niche partitioning (Nguyen et al., 2021). This aligns with the intermediate disturbance hypothesis, which states that species diversity is maximized at intermediate disturbance intensities (Shibasaki et al., 2021). As previous studies have shown, increasing microbial diversity increases process robustness, i.e., functional stability (McCann, 2000; Wittebolle et al., 2009). Daims et al. (2001) therefore proposed increasing the diversity of nitrifiers in wastewater treatment, and thus the functional stability of the process, by forcing changes in the process regime. In the case of urine nitrification, functional stability means the partial conversion of TAN to nitrate without the formation of unwanted intermediates or by-products such as nitrite, nitric oxide or nitrous oxide (N2O).
The nitrifying species found so far in urine nitrification strongly depended on pH and whether alkalinity was added. In nitrification without added alkalinity, AOB of the lineages Nitrosomonas europaea (Fumasoli et al., 2017; Faust et al., 2023), Nitrosomonas eutropha (Fumasoli et al., 2015), or Nitrosospira spp. (Fumasoli et al., 2016) were found at a pH of 5.8 and 6.0. In partial urine nitritation reactors at pH 7 and 8.5, Nitrosomonas halophila and Nitrosomonas stercoris, respectively, were dominant (Faust et al., 2023). Nitrosomonas spp. were also found in partial urine nitritation using sequencing batch reactors with effluent pH values of about 5.7 (Chen et al., 2017; Zheng et al., 2017). At a pH below 5.5, the Nitrosomonas spp. were no longer active due to energy limitation (Fumasoli et al., 2015). Instead, the acid-tolerant AOB “Candidatus Nitrosacidococcus urinae” was found (Faust et al., 2022b), or, in the case of highly diluted urine (1:20), the AOB “Candidatus Nitrosoglobus” (Li et al., 2020). In urine nitrification with added alkalinity, AOB closely related to Nitrosomonas aestuarii or Nitrosomonas marina were found (De Paepe et al., 2018). In none of the above studies could NOB be unambiguously assigned to a genus, but NOB of the genus Nitrobacter were most likely (Coppens et al., 2016; De Paepe et al., 2018; Faust et al., 2023). For nitrification in bioregenerative life support systems, either open microbial communities (Sakano et al., 2002; Bornemann et al., 2015) or axenic and defined co-cultures (Lasseur et al., 1996) were proposed, e.g., Nitrosomonas europaea ATCC 19718 and Nitrobacter winogradskyi ATCC 25391 (Ilgrande et al., 2019).
To address the need for a robust and reliable process in decentralized applications, particularly for Space applications, this article explored two different operating strategies. The first strategy involved maintaining a narrow pH control band with pH set-points of 6.20 and 6.25 (ΔpH = 0.05), as previously employed in urine nitrification studies. The second strategy involved operating with a wider control band, with pH set-points of 6.00 and 6.50 (ΔpH = 0.50). It was hypothesized that a wider pH set-point range would result in greater microbial diversity, better reactor performance, and a more robust process.
2 Materials and methods
2.1 Reactor operation
Two aerobic 12-L continuous-flow stirred-tank reactors (CSTR) without sludge retention were operated for 70 days. Biomass from an existing fed-batch urine nitrification reactor (Forum Chriesbach, Dübendorf, CH) was used for the start-up (Faust et al., 2022a). The pH in the reactor was controlled with the urine influent (Table 1) using an on/off controller. In the “narrow-pH” reactor, the pH was controlled between 6.20 and 6.25 (ΔpH = 0.05), and in the “wide-pH” reactor, the pH was controlled between 6.00 and 6.50 (ΔpH = 0.50). When the lower pH set point was reached due to protons released during ammonia oxidation, the influent (pH = 9.1) was turned on to raise the pH until the higher pH set-point was reached. Both reactors were fed with anaerobically stored urine collected from waterless urinals and NoMix toilets (Gundlach et al., 2021) at Forum Chriesbach. The temperature in the reactor was controlled at 25°C, and the dissolved oxygen was maintained between 4 and 6 mg L−1 with an on/off controller. See Supplementary Material S1 (S1) for further details.
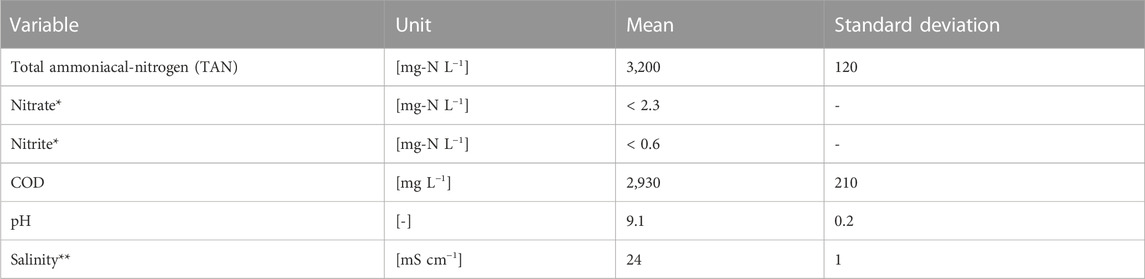
TABLE 1. Characterization of the urine used to feed the nitrification reactors. *The nitrate and nitrite concentrations were checked with colorimetric nitrate stripes (Nitrate Test 10–500 mg L−1, MQuant) and nitrite stripes (Nitrite Test 10–500 mg L−1, MQuant), respectively, but they were below the detection limit. **Electrical conductivity was used as a proxy for salinity.
2.2 N2O measurements
During the first week of operation, the N2O emissions were measured in the off-gas of the reactors. For the measurements, 1 L min−1 was diverted from the off-gas, dehumidified by cooling and measured with a nondispersive infrared sensor (NDIR, X-stream X2GP, Emerson) at a constant temperature of 60°C. The N2O emission factor (EFN2O) [%] was calculated using Eq. 1,
where Qair [L min−1] is the airflow, CN2O-N,off-gas [mg-N L−1] is the N2O concentration in the off-gas, Qinfluent [L min−1] is the influent pump rate, and CTN,influent [mg-N L−1] the TN concentration in the influent. To estimate CTN,influent, the measured TAN concentration was assumed to represent 90% of the total nitrogen in stored urine (Udert et al., 2006).
2.3 Ex-situ robustness tests
Starting on day 45, activated sludge from both 12-L reactors was used to perform ex-situ robustness tests in two 2-L CSTRs. Four different disturbances were used to induce process failures to test process robustness: i) increasing the temperature by 5°C, ii) increasing the pH set-points by 0.2 units, iii) decreasing the airflow resulting in a dissolved oxygen concentration of approximately 1.5 mg L−1, and iv) switching off the influent and concomitantly the pH control to test for the presence of acid-tolerant AOB (Table 2).
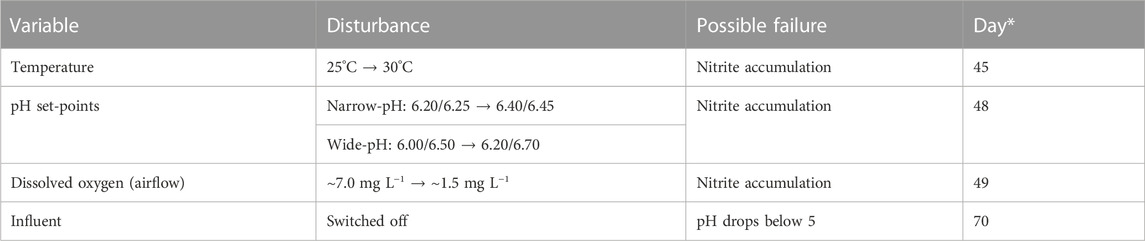
TABLE 2. Overview of robustness tests. *Day after the start of the experiment when sludge was extracted from the main reactors for conducting the ex-situ tests. The tests were performed when the rates were constant.
2.4 Switching functions and kinetic modelling
To quantify the effects of NH3, NH4+, HNO2, NO2−, and pH fluctuations on the nitrifiers and to model the process failures (Table 2), the switching functions and the kinetic parameters presented in Table 3 were used. Most of the kinetic parameters were determined for the activated sludge from the urine nitrification reactor used to inoculate the two 12-L reactors (Faust et al., 2023). The process disturbances were simulated using the dynamic modeling software SUMO 19 (Dynamita, France). A period of 15 days was simulated with either pH set-points of 6.20 and 6.25 (narrow-pH reactor) or 6.00 and 6.50 (wide-pH reactor) to reach a steady state before applying one of the disturbances in Table 2, except for the influent stop. In the model, it was assumed that the microbial composition in terms of AOB and NOB remains the same in both reactors. Eqs 2, 3 were used to model the growth of AOB and NOB (Tchobanoglous et al., 2014),
where rAOB, rNOB are the net growth rates [mg-COD L−1 d−1], μmax,AOB and μmax,NOB the maximum growth rates [d−1], bAOB and bNOB the decay rates [d−1], XAOB and XNOB the biomass concentrations [mg-COD L−1], and SFAOB and SFNOB the switching functions from Table 3 [-]. A maximum growth rate μmax,AOB of 1.21 d−1 and a decay rate bAOB of 0.2 d−1 were used for the AOB, and a maximum growth rate μmax,NOB of 1.02 d−1 and a decay rate bNOB of 0.17 d−1 were used for the NOB based on the findings of Jubany et al. (2008). More information and input parameters for the SUMO model can be found in SI 2.
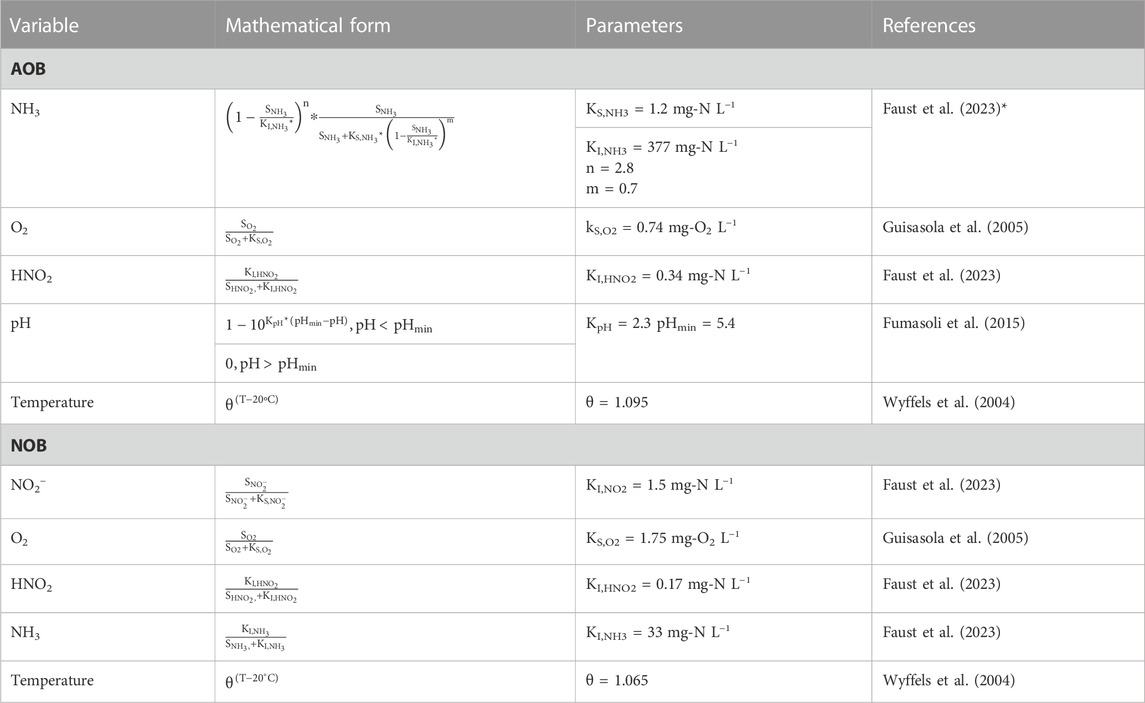
TABLE 3. Switching functions used to model the effect of NH3, NO2−, O2, HNO2, pH, and temperature on AOB and NOB. These switching functions and kinetic parameters were also used for the dynamic simulation in SUMO 19. *The effect of ammonia on AOB was modeled following Han and Levenspiel (1988) because the Haldane equation underestimated the inhibition at high concentrations. The kinetic parameters of Faust et al. (2023) were determined for urine nitrification and for AOB of the Nitrosomonas europaea lineage and NOB of the Nitrobacter genus.
2.5 Chemical and physical analyses
An optical oxygen sensor (Oxymax COS61D, Endress + Hauser) continuously measured dissolved oxygen. The pH (Orbisint CPS11D, Endress + Hauser) was also measured continuously and calibrated once a week to avoid pH drift. Electrical conductivity was measured with a standard conductivity cell (TetraCon 325, WTW) with automatic temperature correction to 25°C. Samples for the analysis of cations (ammonium, potassium, sodium, calcium and magnesium) and anions (nitrate, phosphate, sulfate and chloride) were filtered through a 0.45 µm GF/PET filter (Chromafil, Macherey-Nagel) and measured with ion chromatography (881 compact IC pro, Metrohm). Acid-base equilibria for nitrous acid/nitrite and ammonium/ammonia were calculated using the dissociation constants of Anthonisen et al. (1976) and corrected for ionic strength according to Davies (1967) (see SI 3 and SI 4). Dissolved COD and nitrite were measured with spectrophotometric cuvette tests (LCK114 and LCK 341, respectively, Hach Lange GmbH) using a spectrophotometer (DR 2113800, Hach Lange GmbH). Total and volatile suspended solids were measured according to APHA (2012) standard protocols.
2.6 Molecular analyses of the biomass
Biomass samples were collected from the 12-L reactors approximately every 2 weeks. Additional biomass was collected at the end of the robustness test when the influent was switched off to check for the presence of acid-tolerant AOB. Biomass samples were first stored at −80°C. The FastDNA Spin Kit for Soil (MP Biomedicals) was then used to extract genomic DNA. The procedure followed the manufacturer’s protocol, except that bead-beating steps (Bead Ruptor Elite, OMNI) were performed in a series of 4 × 20 s at 6 m s−1, separated by 2 min on ice according to the MIDAS field guide (McIlroy et al., 2015) to lyse the matrix. The extracted DNA was sent to LGC Genomics (Berlin, Germany) for 16S rRNA gene-based amplicon sequencing, library preparation and sequencing on an Illumina Miseq platform. The primer pair 341F (5'-CCTACGGGNGGCWGCAG-3')/785Rmod (5'GACTACHVGGTATCT AAKCC-3') was used, targeting the V3-V4 hypervariable region. Following the description of De Paepe et al. (2017), data were processed using the Mothur software package (v.1.40.5). Operational taxonomic units (OTU) with 97% similarity in the V3-V4 region of their 16S rRNA gene after applying OptiClust clustering were defined (Chen et al., 2013). Silva.nr_v138_1 database was used to assign the taxonomy (Cole et al., 2014), and singletons were removed (McMurdie and Holmes, 2014). Neighbor-joining trees, including bootstrapping (n = 500), were constructed using MEGA (version 11) software with the maximum composite likelihood method. Additional analyses were performed with NCBI Blast.
Alpha diversity, which quantifies the diversity within a sample, was quantified using Shannon (Eq. 4) and Simpson (Eq. 5) indices, with a higher index indicating a higher alpha diversity (Knight et al., 2018),
where ni is the number of individuals of a species, i.e., the operational taxonomic unit (OTU), and N is the total number of individuals. Beta diversity, which compares the microbial community among a group of samples, was calculated using Bray-Curtis dissimilarity principal coordinates analysis according to Python scikit-learn package v. 0.23.2 (Pedregosa et al., 2011), where biomass samples, which cluster close to each other, are similar in terms of the microbial community (Knight et al., 2018).
3 Results and discussion
3.1 Short-term pH fluctuations cause short-term nitrite fluctuations
The wide pH control band resulted in short-term pH fluctuations, along with large NH3, NO2−, and HNO2 variations (Figure 1). Increasing the pH from 6.00 to 6.50 resulted in higher ammonia oxidation rates due to the higher availability of the substrate NH3. As the ammonia oxidation rate increased relative to the nitrite oxidation rate, nitrite accumulated with a slight delay. Due to the higher nitrite concentration, NOB were less substrate limited, and the nitrite oxidation rate increased. As pH, and therefore the TAN fraction as NH3, decreased, the nitrite concentration also decreased because ammonia oxidation became slower relative to nitrite oxidation. The switching functions for the AOB and the NOB in the wide-pH reactor fluctuated considerably. The activity of AOB doubled from 35% of the maximum activity at pH = 6.00%–70% at pH = 6.50 during one pH cycle in the wide-pH reactor. The fluctuations in NOB were lower but still significant, going from 50% to 70% during one pH cycle in the wide-pH reactor. Therefore, the operational strategy with a wide pH control band resulted in fluctuations that significantly affected the nitrifiers.
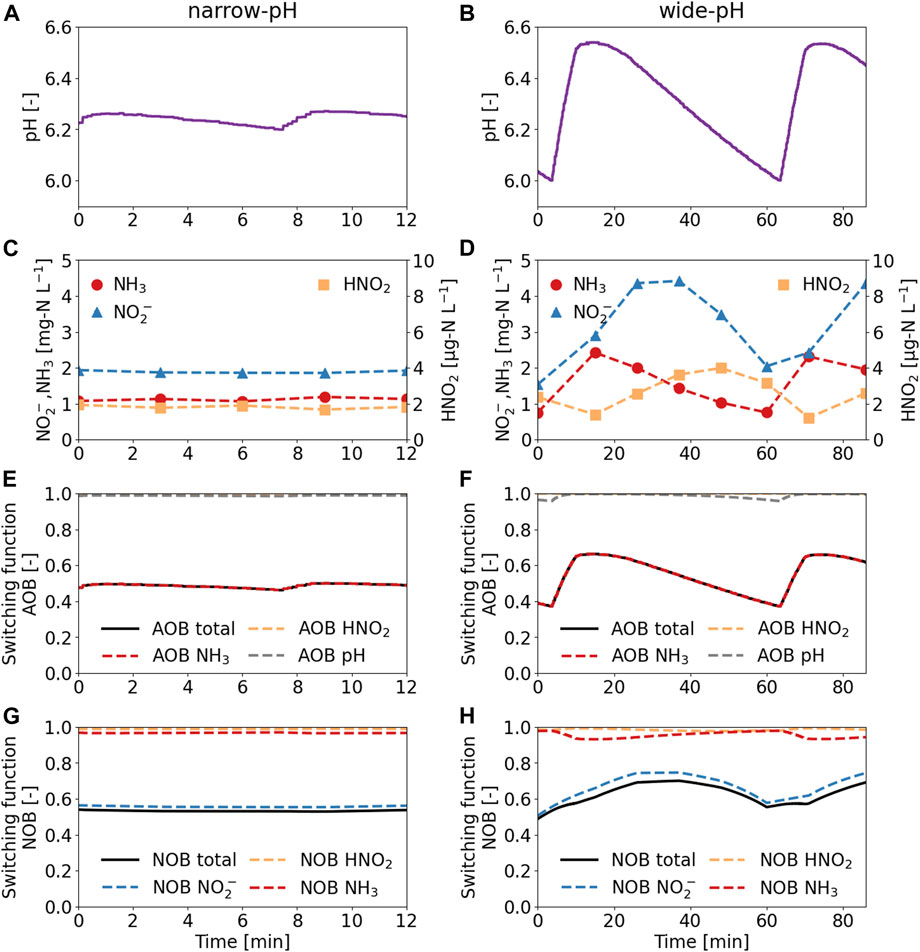
FIGURE 1. Short-term influence of two operational strategies on the pH, ammonia (NH3), nitrite (NO2−), and nitrous acid (HNO2) concentrations, and the switching functions. (A,C,E,G) The narrow-pH reactor was operated with pH set-points of 6.20 and 6.25. (B,D,F,H) The wide-pH reactor was operated with pH set-points of 6.00 and 6.50. Measurements were taken after 1 week of operation in the 12-L reactors. An increase in the switching functions indicates increased activity as the growth rate approaches the maximum growth rate (switching function = 1).
The influence of NH3 and HNO2 inhibition on the activity of the nitrifiers was limited because their concentrations were much lower than the inhibition constants (Table 3). The TAN and the NO3−-N concentrations remained constant at a ratio of about 1 g-N g-N−1, despite the fluctuations (see SI 5 for TAN and NO3−-N concentrations). Faust et al. (2023) reported that the amount of TAN being oxidized changes only slightly between pH 6.00 and 6.50 because the system is poorly buffered in this pH range. While slightly less nitrite was oxidized to nitrate at pH 6.50, changes in nitrate concentration were within the measurement uncertainty.
3.2 In the long-term, the wide-pH reactor has lower nitrification rates and higher nitrite concentrations
The volumetric nitrification rates initially decreased sharply but were fairly constant from day 30 onward, at 74 ± 15 mg-N L−1 d−1 for the narrow-pH reactor and 41 ± 8 mg-N L−1 d−1 for the wide-pH reactor (Figure 2A). The drop in activity was most likely due to biomass washout, as the biomass concentration in both reactors decreased sharply from approximately 3,500 mg-VSS L−1 to 300 mg-VSS L−1 (VSS in SI 6). The change from the fed-batch system with sludge retention to a CSTR caused a decrease in the solids retention time (SRT) and biomass washout. However, the volumetric nitrification rate continued to decrease even when the SRT exceeded 18 days, which is what is conservatively recommended for nitrification reactors at 25°C (Tchobanoglous et al., 2014). While the volumetric nitrification rates decreased, the specific nitrification rates were more constant and were slightly higher for the wide-pH reactor at 140 ± 60 mg-N g-VSS−1 d−1 than for the narrow-pH reactor at 100 ± 30 mg-N g-VSS−1 d−1 (specific rates and SRT in SI 6).
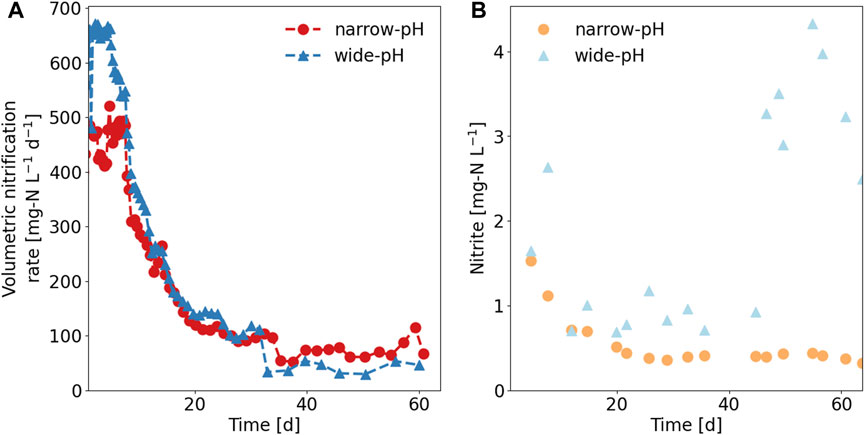
FIGURE 2. Performance of the two nitrification reactors. (A) Volumetric nitrification rate. (B) Nitrite concentrations in the reactors (nitrite was always measured at a pH of 6.20 in both reactors). Average nitrite concentrations were 0.6 ± 0.4 mg-N L−1 in the narrow-pH and 1.9 ± 1.2 mg-N L−1 in the wide-pH reactor.
The nitrite concentration, always measured at a pH of 6.2, was higher in the wide-pH reactor, but no continuous nitrite accumulation was observed in either reactor (Figure 2B). Therefore, ammonia oxidation was the rate-limiting nitrification step for both reactors throughout the experiment. Soluble COD removal was similar in both reactors, with approximately 90% of the soluble COD in the influent being removed, similar to the COD removal reported by Udert and Wächter (2012). Nitrate, TAN, chloride, phosphate, sulfate, sodium, and potassium concentrations did not differ between the two reactors (see SI 6 for anion and cation concentrations in the influent and reactors).
3.3 Short-term NO2− fluctuations lead to higher N2O emissions in the wide-pH reactor
The N2O emissions from the wide-pH reactor, with an emission factor of 0.47% ± 0.04% of the nitrogen load, calculated daily, were significantly (p < 0.05) greater than the N2O emission factor of 0.23% ± 0.01% for the narrow-pH reactor (see SI 7 for daily average). The N2O emission factor for the narrow-pH reactor was close to the 0.26% determined by Faust et al. (2022a) for N2O emissions during the aerated phase of a fed-batch urine nitrification reactor, which was also operated with a narrow pH control band. Over one pH cycle, the N2O emissions were fairly constant for the narrow-pH reactor (Figure 3A). In the wide-pH reactor, the N2O load in the off-gas fluctuated greatly (Figure 3B). These fluctuations followed a similar pattern as the pH dynamics but were observed with a slight delay. Since both nitrite concentrations and N2O emissions varied with a small time lag concerning pH (Figure 1), it is possible that it was not pH per se that caused higher N2O emissions but rather the higher nitrite concentrations. Faust et al. (2022a) also reported a strong correlation between N2O emissions and nitrite concentration during urine nitrification.
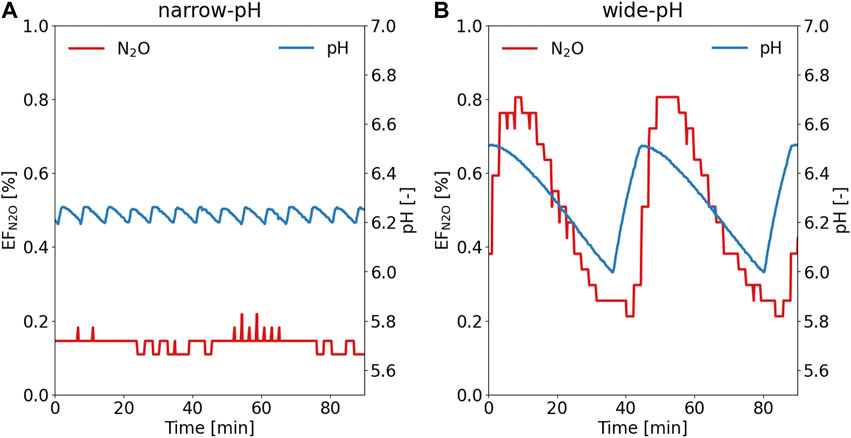
FIGURE 3. Typical pattern of N2O emission factor (EFN2O) in the off-gas during the pH cycle for the (A) narrow-pH reactor and (B) wide-pH reactor. The N2O measurement campaign was conducted during the first week of operation of the 12-L reactor.
3.4 Higher nitrifier diversity in the wide-pH reactor
The alpha diversity of AOB in the wide-pH reactor was significantly (p < 0.05) greater than in the narrow-pH reactor (see Figure 4A and SI 8 for Shannon and Simpson indices of AOB). The predominant AOB belonged to the N. europaea lineage in all samples, except for the last sample from the wide-pH reactor, where a higher relative abundance of an AOB was found that clustered strongly with N. halophila (Figure 4B and SI 9 for phylogenetic tree of major AOB). Since this was only the case for the last sample, it is difficult to determine if this was related to differences in operating conditions. Nitrosomonas europaea has previsouly been found in stable urine nitrification (Faust et al., 2023). Nitrosomonas halophila has been found in urine nitrification with high salinity of 50 mS cm−1 or in partial urine nitritation reactors at pH 7 (Faust et al., 2023). These selection criteria cannot explain the growth of N. halophila in the wide-pH reactor since both reactors had the same salinity, i.e. 24 mS cm−1. Although the nitrite concentration in the wide-pH reactor increased towards the end, it was still relatively low.
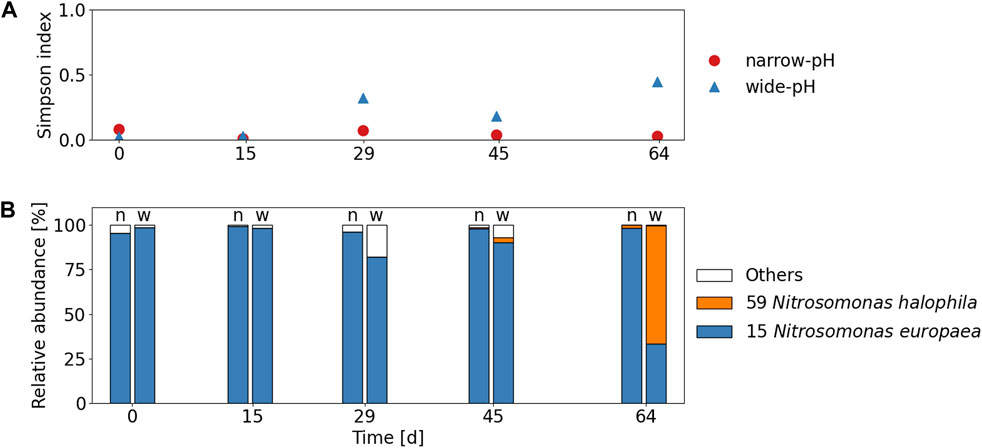
FIGURE 4. (A) Alpha diversity indices of AOB according to Simpson index. The mean Simpson indices, excluding the first sample, were 0.04 and 0.25 for the narrow-pH and the wide-pH reactor, respectively. (B) Relative read abundance of top two AOB species (OTUs) compared to all recognized AOB species in the narrow-pH reactor (n) and the wide-pH reactor (w).
The NOB species were not unambiguously identified, but several unknown Xanthobacteraceae spp. were found, to which also Nitrobacter belongs (Figure 5B and SI 10 for phylogenetic tree of major Xanthobacteraceae spp.). Nitrobacter members are supposedly r-strategists and are more commonly present in environments with abundant nitrite than K-strategists belonging to Nitrospira, growing at low nitrite concentrations (Nogueira and Melo, 2006). Similar to AOB, the alpha diversity of Xanthobacteraceae spp. that are at least potential NOB, was greater in the wide-pH reactor compared to the narrow-pH reactor, but the differences were not significant (p > 0.05) (see Figure 5A and SI 11 for Shannon and Simpson indices of Xanthobacteraceae spp.). However, since the NOB were not unambiguously identified, it is difficult to draw further conclusions about the NOB.

FIGURE 5. (A) Alpha diversity indices of Xanthobacteraceae spp. according to Simpson index. The mean Simpson indices, excluding the first sample, were 0.66 and 0.7 for the narrow-pH and the wide-pH reactor, respectively (B) Relative read abundance of top seven Xanthobacteraceae spp. (OTUs) compared to all recognized Xanthobacteraceae spp. in the narrow-pH reactor (n) and the wide-pH reactor (w).
Despite the different environmental conditions, the relative abundance of the top twelve OTU of all species, including heterotrophs, was similar in both reactors (Figure 6). Fluctuations in pH also did not affect the overall microbial diversity in terms of alpha diversity indices (Figure 7A and SI 12 for Shannon index), probably because most bacteria were heterotrophic organisms. Although pH also affects the acid-base equilibrium of organic substances, namely, acetate (pKa,25 °C ≈ 4.8) and propionate (pKa,25 °C ≈ 4.9), which are the major organic components in anaerobically stored urine (Heusser et al., 2023), the fluctuations were probably too small and too far away from the pKa values to have a major effect on heterotrophs.
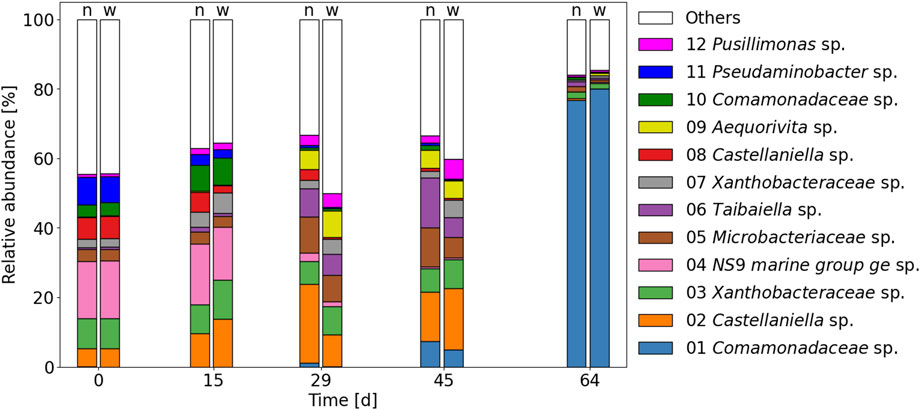
FIGURE 6. Microbial community composition at the genus level (top 12 OTUs) of the narrow-pH reactor (n) and the wide-pH reactor right (w) according to 16S rRNA amplicon sequencing.
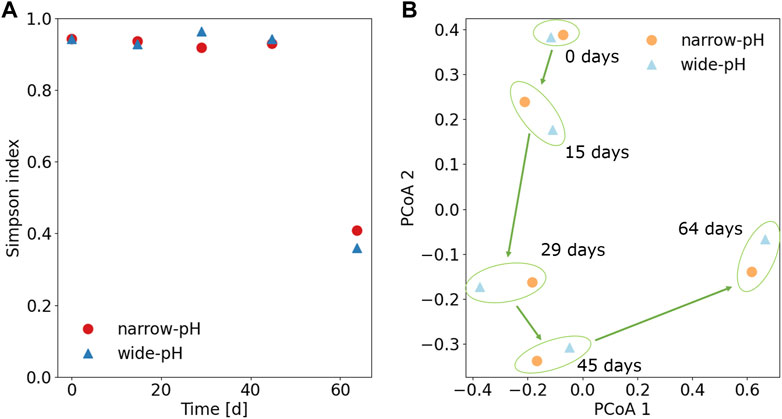
FIGURE 7. (A) Alpha diversity in terms of the Simpson index for the total microbiota. A value closer to 1 indicates a higher microbial diversity (B) Bray-Curtis dissimilarity principal coordinates analysis (PCoA) for the total microbiota. Biomass samples close to each other were similar in terms of the microbial community.
Time was found to be the primary determinant of microbial changes (Figure 7B). In particular, a major change in microbial composition occurred in the final sample when a species of the Comamonadaceae family became dominant, with relative abundances of about 80% in both reactors. Comamonadaceae sp. had the highest gene identity of 98.8% with Acidovorax defluvii, originally isolated from activated sludge (Schulze et al., 1999). Since both reactors were fed with the same influent, this could be related to the composition of the influent. The influent tank was replaced on day 49, and although it was unremarkable in terms of COD or TAN concentrations, it may have contained some organic substances that favored the growth of Comamonadaceae sp. (see SI6 for TAN and COD concentrations in the influent and reactors).
3.5 Urine nitrification operated with a wide pH control band is more susceptible to disturbances
Based on the ex-situ tests, the wide-pH reactor was slightly more susceptible to nitrite accumulation during process disturbances. A sudden temperature increase of 5°C did not result in continuous nitrite accumulation but caused a brief nitrite peak of about 10 mg-N L−1 in the wide-pH reactor (Figures 8A, B). Guo et al. (2010) reported that an increase in temperature promotes the AOB more than NOB, which was not observed in this experiment, or at least not to a degree that allowed continuous nitrite accumulation. The disturbance caused by a 0.20 pH increase resulted in continuous nitrite accumulation for the wide-pH reactor. In contrast, in the narrow-pH reactor, no continuous nitrite accumulation was observed (Figures 8C, D). The nitrite accumulation was irreversible even when the pH was lowered again. While reducing the pH decreased the NH3 concentration, which decreased AOB activity, it also increased the HNO2 concentration, which according to Faust et al. (2023), affects NOB more than AOB. The disturbance caused by a decrease in aeration resulted in a continuous nitrite accumulation for both reactors, with higher concentrations in the wide-pH reactor, which was reversible when the airflow was increased again (Figures 8E, F). Therefore, the NOB in urine were more sensitive to low dissolved oxygen concentrations than AOB, a feature often used to suppress NOB growth, for example, in partial nitritation/anammox systems (Hausherr et al., 2022). Due to the cessation of inflow, the pH of both reactors first dropped to about 5.5. Subsequently, in a second drop after more than 4 weeks, the pH dropped below 3 due to the growth of the acid-tolerant AOB “Candidatus (Ca.) Nitrosacidococcus urinae” (Figures 8G, H). While “Ca. Nitrosacidococcus urinae” was not detected in any samples from the narrow-pH reactor, a very low relative abundance of 0.007% and 0.002% was found in the wide-pH reactor on days 45 and 64, respectively. This may explain why the second drop occurred earlier in the sludge from the wide-pH reactor. The higher AOB diversity in the wide-pH reactor increased the likelihood of process failure due to the growth of acid-tolerant AOB.

FIGURE 8. Influence of disturbances on the nitrification process for the two activated sludges from the narrow and wide-pH reactor. Ex-situ tests were performed starting at day 45, when the rates in the 12-L reactors were constant. (A,B) Influence of a 5°C increase in temperature on nitrite concentration. (C,D) Influence of a 0.2 pH value increase on nitrite concentration. (E,F) Influence of a reduction in airflow, resulting in lower dissolved oxygen (DO) concentrations, on nitrite concentration. (G,H) Influence of an influent stop on pH and relative abundance of major AOB.
The dynamic simulation of the robustness tests, which excluded the growth of acid-tolerant AOB, also showed that the operation of urine nitrification with a wide pH control band was more prone to process failure (Figure 9). In all three simulations, nitrite accumulation occurred in the wide-pH reactor, while the narrow-pH reactor did not lead to NOB suppression. The kinetic parameters for oxygen affinity and temperature dependence were not determined specifically for urine nitrification, which may explain why the concentration profiles obtained in the simulations differed from the ex-situ tests. Nevertheless, the simulation results nicely showed that a wide pH control band was more susceptible to reactor disturbances when the microbial community composition of both reactors was the same. Despite significant differences in diversities, the distributions of AOB and NOB were very similar in both reactors, with N. europaea being the dominant AOB during the first three robustness tests. Therefore, is likely that the differences in robustness that were observed in the narrow-pH and the wide-pH reactors were not related to differences in microbial composition but rather directly related to the two different operational strategies, which resulted in different limitation and inhibition effects. More specifically, fluctuations in pH lead to fluctuations in the ammonia oxidation rate and hence the nitrite concentration (Figure 1). As nitrite is the substrate for NOB, this will increase the nitrite oxidation rate, but only up to a certain (pH dependent) turning point, as the conjugative acid, HNO2, inhibits nitrification. At this turning point, further increases in substrate concentration will reduce the growth rate due to the inhibitory effect. Overshooting the turning point must be avoided as this will lead to a decrease in the nitrite oxidation rate, resulting in further nitrite accumulation and a positive feedback loop. Due to the nitrite fluctuations, the wide pH reactor was more likely to reach this turning point, causing further nitrite accumulation (Figure 9).
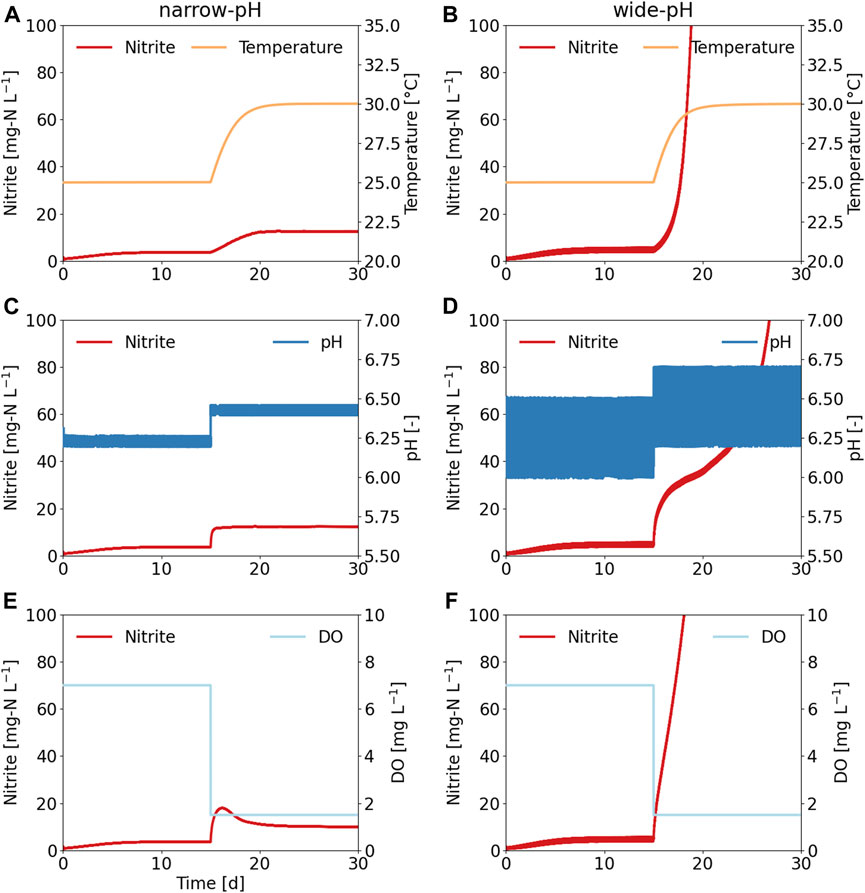
FIGURE 9. Simulations of process disturbances for a reactor operated with a narrow pH control band and wide pH control band. First, the reactor was operated with a narrow pH of 6.20–6.25 and wide pH of 6.00–6.50 for 15 days, and then one of three process disturbances was applied. (A,B) Influence of a 5°C increase in temperature on nitrite concentration. (C,D) Influence of a 0.2 pH value increase on nitrite concentration. (E, F) Influence of reducing the dissolved oxygen (DO) set-points on nitrite concentration.
Since nitrification is a two-step process and the process failures are mainly related to AOB being faster than NOB, leading to nitrite accumulation, increasing the diversity of AOB may even be counterproductive. If possible, only NOB diversity should selectively be increased. However, this was not possible with the current operational strategy because the fluctuations influence AOB and NOB (Figure 1). Increasing the microbial diversity of NOB selectively by repeated bioaugmentation may be a more appropriate approach (Daims et al., 2001).
4 Conclusion
• While operating urine nitrification with a wide pH control band (∆pH = 0.50) increased the nitrifier diversity, it did not increase the process robustness.
• An operating strategy with a narrow pH control band (∆pH = 0.05) is preferable because it reduces the risk of nitrite accumulation and results in lower N2O emissions.
• The modeling results suggest that observed differences in robustness between the narrow-pH and wide-pH reactors were likely attributed to different limitation and inhibition effects caused by the operational strategy.
• The hypothesis that larger environmental fluctuations would result in a more robust process was not confirmed.
Data availability statement
The original contributions in the form of 16S rRNA data presented in the study are publicly available. This data can be found here: https://www.ncbi.nlm.nih.gov/sra/PRJNA1016099. Other datasets presented in this study will be made available by the corresponding author upon request.
Author contributions
VF: Conceptualization, Data curation, Formal Analysis, Investigation, Methodology, Software, Validation, Visualization, Writing–original draft, Writing–review and editing. NB: Conceptualization, Supervision, Validation, Writing–review and editing. RG: Conceptualization, Supervision, Validation, Writing–review and editing. SV: Conceptualization, Supervision, Validation, Writing–review and editing. KU: Conceptualization, Funding acquisition, Project administration, Resources, Supervision, Validation, Writing–review and editing.
Funding
The author(s) declare financial support was received for the research, authorship, and/or publication of this article. The authors thank the MELiSSA foundation (www.melissafoundation.org) for supporting VF through the POMP2 program. RG gratefully acknowledges support from BOF startkrediet (BOF19/STA/044). Open access funding by Swiss Federal Institute of Aquatic Science and Technology (Eawag).
Acknowledgments
The authors thank Tim Lacoere from the Center of Microbial Ecology and Technology at Ghent University for his excellent support with the microbial community analysis. The authors also thank Sylvia Richter (Eawag) and Karin Rottermann (Eawag) for helping with the chemical analysis and Marco Kipf (Eawag) and Bettina Sterkele (Eawag) for technical support. Microbial data produced and analyzed in this paper were generated in collaboration with the Genetic Diversity Centre, ETH Zurich.
Conflict of interest
The authors declare that the research was conducted in the absence of any commercial or financial relationships that could be construed as a potential conflict of interest.
Publisher’s note
All claims expressed in this article are solely those of the authors and do not necessarily represent those of their affiliated organizations, or those of the publisher, the editors and the reviewers. Any product that may be evaluated in this article, or claim that may be made by its manufacturer, is not guaranteed or endorsed by the publisher.
Supplementary material
The Supplementary Material for this article can be found online at: https://www.frontiersin.org/articles/10.3389/fenvs.2023.1275152/full#supplementary-material
References
Anthonisen, A. C., Loehr, R. C., Prakasam, T. B. S., and Srinath, E. G. (1976). Inhibition of nitrification by ammonia and nitrous-acid. J. Water Pollut. Control Fed. 48, 835–852.
Bornemann, G., Wasser, K., Tonat, T., Moeller, R., Bohmeier, M., and Hauslage, J. (2015). Natural microbial populations in a water-based biowaste management system for space life support. Life Sci. Space Res. (Amst) 7, 39–52. doi:10.1016/j.lssr.2015.09.002
Chen, L., Yang, X., Tian, X., Yao, S., Li, J., Wang, A., et al. (2017). Partial nitritation of stored source-separated urine by granular activated sludge in a sequencing batch reactor. Amb. Express 7, 50. doi:10.1186/s13568-017-0354-9
Chen, W., Zhang, C. K., Cheng, Y., Zhang, S., and Zhao, H. (2013). A comparison of methods for clustering 16S rRNA sequences into OTUs. PLoS One 8, e70837. doi:10.1371/journal.pone.0070837
Clauwaert, P., Muys, M., Alloul, A., De Paepe, J., Luther, A., Sun, X., et al. (2017). Nitrogen cycling in Bioregenerative Life Support Systems: Challenges for waste refinery and food production processes. Prog. Aerosp. Sci. 91, 87–98. doi:10.1016/j.paerosci.2017.04.002
Cole, J. R., Wang, Q., Fish, J. A., Chai, B., Mcgarrell, D. M., Sun, Y., et al. (2014). Ribosomal database project: Data and tools for high throughput rRNA analysis. Nucleic Acids Res. 42, D633–D642. doi:10.1093/nar/gkt1244
Coppens, J., Lindeboom, R., Muys, M., Coessens, W., Alloul, A., Meerbergen, K., et al. (2016). Nitrification and microalgae cultivation for two-stage biological nutrient valorization from source separated urine. Bioresour. Technol. 211, 41–50. doi:10.1016/j.biortech.2016.03.001
Daims, H., Purkhold, U., Bjerrum, L., Arnold, E., Wilderer, P. A., and Wagner, M. (2001). Nitrification in sequencing biofilm batch reactors: Lessons from molecular approaches. Water Sci. Technol. 43, 9–18. doi:10.2166/wst.2001.0113
De Paepe, J., Lindeboom, R. E. F., Vanoppen, M., De Paepe, K., Demey, D., Coessens, W., et al. (2018). Refinery and concentration of nutrients from urine with electrodialysis enabled by upstream precipitation and nitrification. Water Res. 144, 76–86. doi:10.1016/j.watres.2018.07.016
De Paepe, K., Kerckhof, F. M., Verspreet, J., Courtin, C. M., and Van De Wiele, T. (2017). Inter-individual differences determine the outcome of wheat bran colonization by the human gut microbiome. Environ. Microbiol. 19, 3251–3267. doi:10.1111/1462-2920.13819
Faust, V., Gruber, W., Ganigué, R., Vlaeminck, S. E., and Udert, K. M. (2022a). Nitrous oxide emissions and carbon footprint of decentralized urine fertilizer production by nitrification and distillation. Acs Es&T Eng. 2, 1745–1755. doi:10.1021/acsestengg.2c00082
Faust, V., Van Alen, T. A., Op Den Camp, H. J. M., Vlaeminck, S. E., Ganigué, R., Boon, N., et al. (2022b). Ammonia oxidation by novel "Candidatus Nitrosacidococcus urinae" is sensitive to process disturbances at low pH and to iron limitation at neutral pH. Water Res. X 17, 100157. doi:10.1016/j.wroa.2022.100157
Faust, V., Vlaeminck, S. E., Ganigué, R., and Udert, K. M. (2023). Influence of pH on urine nitrification: Community shifts of ammonia-oxidizing bacteria and inhibition of nitrite-oxidizing bacteria. ACS ES&T Eng. (in press).
Fumasoli, A., Burgmann, H., Weissbrodt, D. G., Wells, G. F., Beck, K., Mohn, J., et al. (2017). Growth of nitrosococcus-related ammonia oxidizing bacteria coincides with extremely low pH values in wastewater with high ammonia content. Environ. Sci. Technol. 51, 6857–6866. doi:10.1021/acs.est.7b00392
Fumasoli, A., Etter, B., Sterkele, B., Morgenroth, E., and Udert, K. M. (2016). Operating a pilot-scale nitrification/distillation plant for complete nutrient recovery from urine. Water Sci. Technol. 73, 215–222. doi:10.2166/wst.2015.485
Fumasoli, A., Morgenroth, E., and Udert, K. M. (2015). Modeling the low pH limit of Nitrosomonas eutropha in high-strength nitrogen wastewaters. Water Res. 83, 161–170. doi:10.1016/j.watres.2015.06.013
Guisasola, A., Jubany, I., Baeza, J. A., Carrera, J., and Lafuente, J. (2005). Respirometric estimation of the oxygen affinity constants for biological ammonium and nitrite oxidation. J. Chem. Technol. Biotechnol. 80, 388–396. doi:10.1002/jctb.1202
Gundlach, J., Bryla, M., Larsen, T. A., Kristoferitsch, L., Grundl, H., and Holzner, M. (2021). Novel NoMix toilet concept for efficient separation of urine and feces and its design optimization using computational fluid mechanics. J. Build. Eng. 33, 101500. doi:10.1016/j.jobe.2020.101500
Guo, J., Peng, Y., Huang, H., Wang, S., Ge, S., Zhang, J., et al. (2010). Short- and long-term effects of temperature on partial nitrification in a sequencing batch reactor treating domestic wastewater. J. Hazard Mater 179, 471–479. doi:10.1016/j.jhazmat.2010.03.027
Han, K., and Levenspiel, O. (1988). Extended monod kinetics for substrate, product, and cell inhibition. Biotechnol. Bioeng. 32, 430–447. doi:10.1002/bit.260320404
Hausherr, D., Niederdorfer, R., Burgmann, H., Lehmann, M. F., Magyar, P., Mohn, J., et al. (2022). Successful mainstream nitritation through NOB inactivation. Sci. Total Environ. 822, 153546. doi:10.1016/j.scitotenv.2022.153546
Heusser, A., Dax, A., Mcardell, C. S., and Udert, K. M. (2023). High content of low molecular weight organics does not always affect pharmaceutical adsorption on activated carbon: The case of acetate, propionate and ethanol in source-separated urine. Water Res. X 21, 100199. doi:10.1016/j.wroa.2023.100199
Ilgrande, C., Defoirdt, T., Vlaeminck, S. E., Boon, N., and Clauwaert, P. (2019). Media optimization, strain compatibility, and low-shear modeled microgravity exposure of synthetic microbial communities for urine nitrification in regenerative life-support systems. Astrobiology 19, 1353–1362. doi:10.1089/ast.2018.1981
Jiang, J. X., Phuntsho, S., Pathak, N., Wang, Q. L., Cho, J., and Shon, H. K. (2021). Critical flux on a submerged membrane bioreactor for nitrification of source separated urine. Process Saf. Environ. Prot. 153, 518–526. doi:10.1016/j.psep.2021.07.039
Jubany, I., Carrera, J., Lafuente, J., and Baeza, J. A. (2008). Start-up of a nitrification system with automatic control to treat highly concentrated ammonium wastewater: Experimental results and modeling. Chem. Eng. J. 144, 407–419. doi:10.1016/j.cej.2008.02.010
Knight, R., Vrbanac, A., Taylor, B. C., Aksenov, A., Callewaert, C., Debelius, J., et al. (2018). Best practices for analysing microbiomes. Nat. Rev. Microbiol. 16, 410–422. doi:10.1038/s41579-018-0029-9
Larsen, T. A., Riechmann, M. E., and Udert, K. M. (2021). State of the art of urine treatment technologies: A critical review. Water Res. X 13, 100114. doi:10.1016/j.wroa.2021.100114
Lasseur, C., Verstraete, W., Gros, J. B., Dubertret, G., and Rogalla, F. (1996). Melissa: A potential experiment for a precursor mission to the moon. Adv. Space Res. 18, 111–117. doi:10.1016/0273-1177(96)00097-x
Li, J., Xu, K., Liu, T., Bai, G., Liu, Y., Wang, C., et al. (2020). Achieving stable partial nitritation in an acidic nitrifying bioreactor. Environ. Sci. Technol. 54, 456–463. doi:10.1021/acs.est.9b04400
Maurer, M., Pronk, W., and Larsen, T. A. (2006). Treatment processes for source-separated urine. Water Res. 40, 3151–3166. doi:10.1016/j.watres.2006.07.012
Mcilroy, S. J., Saunders, A. M., Albertsen, M., Nierychlo, M., Mcilroy, B., Hansen, A. A., et al. (2015). MiDAS: The field guide to the microbes of activated sludge. Oxford): Database, bav062.
Mcmurdie, P. J., and Holmes, S. (2014). Waste not, want not: Why rarefying microbiome data is inadmissible. PLoS Comput. Biol. 10, e1003531. doi:10.1371/journal.pcbi.1003531
Nguyen, J., Lara-Gutierrez, J., and Stocker, R. (2021). Environmental fluctuations and their effects on microbial communities, populations and individuals. FEMS Microbiol. Rev. 45, fuaa068. doi:10.1093/femsre/fuaa068
Nogueira, R., and Melo, L. F. (2006). Competition between Nitrospira spp. and nitrobacter spp. in nitrite-oxidizing bioreactors. Biotechnol. Bioeng. 95, 169–175. doi:10.1002/bit.21004
Pedregosa, F., Varoquaux, G., Gramfort, A., Michel, V., Thirion, B., Grisel, O., et al. (2011). Scikit-learn: Machine learning in Python. J. Mach. Learn. Res. 12, 2825–2830. doi:10.48550/arXiv.1201.0490
Randall, D. G., and Naidoo, V. (2018). Urine: The liquid gold of wastewater. J. Environ. Chem. Eng. 6, 2627–2635. doi:10.1016/j.jece.2018.04.012
Ren, J., Hao, D., Jiang, J., Phuntsho, S., Freguia, S., Ni, B. J., et al. (2021). Fertiliser recovery from source-separated urine via membrane bioreactor and heat localized solar evaporation. Water Res. 207, 117810. doi:10.1016/j.watres.2021.117810
Sakano, Y., Pickering, K. D., Strom, P. F., and Kerkhof, L. J. (2002). Spatial distribution of total, ammonia-oxidizing, and denitrifying bacteria in biological wastewater treatment reactors for bioregenerative life support. Appl. Environ. Microbiol. 68, 2285–2293. doi:10.1128/aem.68.5.2285-2293.2002
Schulze, R., Spring, S., Amann, R., Huber, I., Ludwig, W., Schleifer, K. H., et al. (1999). Genotypic diversity of Acidovorax strains isolated from activated sludge and description of Acidovorax defluvii sp. nov. Syst. Appl. Microbiol. 22, 205–214. doi:10.1016/s0723-2020(99)80067-8
Shibasaki, S., Mobilia, M., and Mitri, S. (2021). Exclusion of the fittest predicts microbial community diversity in fluctuating environments. J. R. Soc. Interface 18, 20210613. doi:10.1098/rsif.2021.0613
Stein, L. Y. (2019). Insights into the physiology of ammonia-oxidizing microorganisms. Curr. Opin. Chem. Biol. 49, 9–15. doi:10.1016/j.cbpa.2018.09.003
Sun, F. Y., Dong, W. Y., Shao, M. F., Li, J., and Peng, L. Y. (2012). Stabilization of source-separated urine by biological nitrification process: Treatment performance and nitrite accumulation. Water Sci. Technol. 66, 1491–1497. doi:10.2166/wst.2012.337
Tchobanoglous, G., Stensel, H. D., Tsuchihashi, R., Burton, F. L., Abu-Orf, M., Bowden, G., et al. (2014). Wastewater engineering: Treatment and resource recovery. New York, NY: McGraw-Hill Education.
Udert, K. M., Fux, C., Munster, M., Larsen, T. A., Siegrist, H., and Gujer, W. (2003). Nitrification and autotrophic denitrification of source-separated urine. Water Sci. Technol. 48, 119–130. doi:10.2166/wst.2003.0031
Udert, K. M., Larsen, T. A., and Gujer, W. (2006). Fate of major compounds in source-separated urine. Water Sci. Technol. 54, 413–420. doi:10.2166/wst.2006.921
Udert, K. M., and Wächter, M. (2012). Complete nutrient recovery from source-separated urine by nitrification and distillation. Water Res. 46, 453–464. doi:10.1016/j.watres.2011.11.020
Volpin, F., Jiang, J. X., El Saliby, I., Preire, M., Lim, S., Johir, M. A. H., et al. (2020). Sanitation and dewatering of human urine via membrane bioreactor and membrane distillation and its reuse for fertigation. J. Clean. Prod. 270, 122390. doi:10.1016/j.jclepro.2020.122390
Wittebolle, L., Marzorati, M., Clement, L., Balloi, A., Daffonchio, D., Heylen, K., et al. (2009). Initial community evenness favours functionality under selective stress. Nature 458, 623–626. doi:10.1038/nature07840
Wyffels, S., Van Hulle, S. W., Boeckx, P., Volcke, E. I., Van Cleemput, O., Vanrolleghem, P. A., et al. (2004). Modeling and simulation of oxygen-limited partial nitritation in a membrane-assisted bioreactor (MBR). Biotechnol. Bioeng. 86, 531–542. doi:10.1002/bit.20008
Keywords: resource recovery, decentralized treatment, microbial diversity, source separation, robustness, MELiSSA, process stability
Citation: Faust V, Boon N, Ganigué R, Vlaeminck SE and Udert KM (2023) Optimizing control strategies for urine nitrification: narrow pH control band enhances process stability and reduces nitrous oxide emissions. Front. Environ. Sci. 11:1275152. doi: 10.3389/fenvs.2023.1275152
Received: 09 August 2023; Accepted: 21 September 2023;
Published: 10 October 2023.
Edited by:
Maria Elisa Magri, Federal University of Santa Catarina, BrazilReviewed by:
Haoran Duan, The University of Queensland, AustraliaSamik Bagchi, Digested Organics, United States
Copyright © 2023 Faust, Boon, Ganigué, Vlaeminck and Udert. This is an open-access article distributed under the terms of the Creative Commons Attribution License (CC BY). The use, distribution or reproduction in other forums is permitted, provided the original author(s) and the copyright owner(s) are credited and that the original publication in this journal is cited, in accordance with accepted academic practice. No use, distribution or reproduction is permitted which does not comply with these terms.
*Correspondence: Kai M. Udert, kai.udert@eawag.ch