A Genetic Algorithm-Based Urban Cluster Automatic Threshold Method by Combining VIIRS DNB, NDVI, and NDBI to Monitor Urbanization


1
State Key Laboratory of Earth Surface Processes and Resource Ecology, Faculty of Geographical Science, Beijing Normal University, Beijing 100875, China
2
Beijing Advanced Innovation Center for Future Urban Design, Beijing University of Civil Engineering and Architecture, Beijing 100044, China
*
Author to whom correspondence should be addressed.
Remote Sens. 2018, 10(2), 277; https://doi.org/10.3390/rs10020277
Submission received: 9 December 2017
/
Revised: 5 February 2018
/
Accepted: 8 February 2018
/
Published: 11 February 2018
(This article belongs to the Special Issue Remote Sensing of Night Lights – Beyond DMSP)
Abstract
:Accurate and timely information related to quantitative descriptions and spatial distributions of urban areas is crucial to understand urbanization dynamics and is also helpful to address environmental issues associated with rapid urban land-cover changes. Thresholding is acknowledged as the most popular and practical way to extract urban information from nighttime lights. However, the difficulty of determining optimal threshold remains challenging to applications of this method. In order to address the problem of selecting thresholds, a Genetic Algorithm-based urban cluster automatic threshold (GA-UCAT) method by combining Visible-Infrared Imager-Radiometer Suite Day/Night band (VIIRS DNB), Normalized Difference Vegetation Index (NDVI), and Normalized Difference Built-up Index (NDBI) is proposed to distinguish urban areas from dark rural background in NTL images. The key point of this proposed method is to design an appropriate fitness function of GA by means of integrating between-class variance and inter-class variance with all these three data sources to determine optimal thresholds. In accuracy assessments by comparing with ground truth—Landsat 8 OLI images, this new method has been validated and results with OA (Overall Accuracy) ranging from 0.854 to 0.913 and Kappa ranging from 0.699 to 0.722 show that the GA-UCAT approach is capable of describing spatial distributions and giving detailed information of urban extents. Additionally, there is discussion on different classifications of rural residential spots in Landsat remote sensing images and nighttime light (NTL) and evaluations of spatial-temporal development patterns of five selected Chinese urban clusters from 2012 to 2017 on utilizing this proposed method. The new method shows great potential to map global urban information in a simple and accurate way and to help address urban environmental issues.
1. Introduction
Urbanization plays an important role in almost all dimensions of contemporary global changes. Despite the small fraction of overall land area that urban areas account for, cities are populated by more than 54% of people in the world, and the total population living in urban areas is expected to increase by more than 2 billion by 2050 [1]. Rapid urbanization is closely associated with a wide range of environmental issues such as urban heat islands [2], growing energy consumption [3], pollution emissions [4], ecological damage [5] and urban climate change [6]. As such, accurate and timely information related to the amount and spatial distributions of urban areas is crucial to understand urbanization dynamics and to address the environmental issues mentioned above.
Remote sensing technology has been applied for acquiring consistent and continuous data to study urban dynamics because of its ability to perform large-scale simultaneous observations and to obtain up-to-date and periodic information. Therefore, great strides have been made in remote sensing-based methods for mapping cities and monitoring urbanization at different scales [7]. Previous studies have utilized high and medium spatial resolution images to explore the progress of urbanization for individual metropolitan areas [8,9,10,11,12,13]. However, these relatively high resolution data are difficult to meet the needs of quick mapping urban dynamics at large scale of such urban clusters and global extents. The reasons for this shortcoming are that some methods based on high resolution data require labor-intensive work and a large number of cloud-free images in chosen months. Additionally, issues of spectral and spatial consistency from different scenes may exist, which also remains a challenge for high resolution data being applied in global urban studies. Instead, coarse resolution images which are more suitable at regional and global scales, such as MODIS and nighttime light data, have been extensively applied for discovering patterns of urban land-use changes [14,15,16,17].
In particular, nighttime light (NTL) data are valuable remote sensing data sources for detection of urban growth [18,19,20,21], because of their capability of indicating the intensity of human activities such as population density, socioeconomic development, and energy consumption. These data can help distinguish bright urban built-up areas from dim countryside background. There are two primary NTL sources—Defense Meteorological Satellite Program Operational Line-scan System (DMSP-OLS) and Suomi NPP Visible-Infrared Imager-Radiometer Suite Day/Night band (VIIRS DNB). The DMSP-OLS nighttime light images have been utilized in numerous previous studies for mapping urban land-use due to their appropriate temporal and spatial resolution [22,23]. Although they are widely recognized as useful data in the field of urban remote sensing at national, continental and global scales [24,25,26,27], the DMSP data have a set of weaknesses including coarse spatial resolution, six-bit quantization, saturation on urban cores and lack of on-board calibration [28,29]. By contrast, VIIRS DNB offers many improvements over DMSP-OLS in terms of higher resolution, dynamic range, 14-bit quantization, in-flight calibrations [18,30]. Hence, VIIRS DNB data are anticipated to be widely utilized in science applications particularly in urban studies instead of DMSP-OLS to avoid the limitations of the last generation.
Previous methods of urban extraction from NTL data can be generally grouped into three ways including classification-based, novel index-based, and threshold techniques-based methods. In the way of image classification, NTL images are recognized as a kind of grey-scale map such as Normalized Difference Vegetation Index (NDVI). Cao et al. [31] and Pandey et al. [32] used semi-automatic Support Vector Machines (SVM) with DMSP-OLS nighttime lights and SPOT Vegetation (SPOT-VGT) data to map urban areas. Nevertheless, accuracy of these methods is sensitive to the selection of training samples. For this reason, solid priori knowledge of urbanization dynamics is necessary while it is not always available in common situations. In terms of the index-based way, Zhang et al. [33] proposed Vegetation Adjusted NTL Urban Index (VANUI) by combining MODIS NDVI with NTL to study urban structures and achieved relatively good result on the global scale. Additionally, Sharma et al. [34] made fusion of MODIS and VIIRS data to design Urban Built-up Index (UBI) for urban studies. This kind of method would be more reliable and rational with more scientific explanations from the respect of urban mechanism. Lastly, owing to the fact that NTL data show brighter light in urban areas while dimmer in the countryside, the simple way to map urban land use is to select a suitable value also named threshold to segment images. As such, many previous approaches based on thresholding extract urban areas with pixel values higher than the threshold from DMSP-OLS nighttime light data [26,35,36,37]. Xie et al. [38] proposed an object-based method to estimate optimal thresholds for incompatible time series, but this method required reference images which were almost unavailable and this method was not suitable for 14-bit quantized VIIRS DNB because it was difficult to traverse the 14-bit data range for every urban object. Despite the fact that thresholding methods are acknowledged by their wide applications in urbanization detection, the difficulty of selecting the optimal thresholds remains a challenge for applications of this method. Moreover, some empirical and subjective way to determine thresholds even lead to poor accuracy and reliability. Accordingly, if the selection of optimal threshold values could be modified by an automatic way without any human interactions, it could greatly improve the reliability and utility of the threshold-based method. As such, Genetic Algorithms (GA) [39], automatic ways to produce optimal solution meaning thresholds in this paper, were employed to avoid difficulty and subjectivity in threshold value determination. Meanwhile, taking city cluster as study region can make a great trade-off between accuracy and efficiency. In some classification and index methods [31,32,33,34], the integration of NDVI images and light data show higher accuracy than employing nighttime lights as the only data source, because they can supplement each other. Generally, if the method could automatically select optimal thresholds for NTL data with supplement of other data sources to extract urban areas from city cluster, it would greatly improve the ability of quick mapping urban extents at large scales.
In this research, to address the difficulty of determining thresholds, we developed the Genetic Algorithm-based urban cluster automatic threshold (GA-UCAT) method to map urban areas by combining VIIRS DNB nighttime light data and MODIS NDVI and NDBI (Normalized Difference Built-up Index). By connecting biological individual with image value in the computer world, this new method modified from GA changes biological evolutions to optimization process. Because the modified fitness function of GA-UCAT represents the quality of segmentation results of urban areas, the best solution automatically produced by GA is the optimal thresholds for mapping urban extents. It is noted that even though details of GA-UCAT introduced in the methodology seem relatively complex and abstract, because of existing GA Toolbox, this method can be applied in an easy an efficient way. The results cover two parts including explanation of integration of three data sources and accuracy assessments by comparing with Landsat images. Finally, difference classifications of rural residential spots between land cover derived from VNIR data and land-use from NTL images, and spatial and temporal urbanization dynamics in five typical Chinese urban clusters are discussed.
2. Study Area and Data
2.1. Study Area
Chinese cities have been witnessing rapid urbanization with fast economic and population growth since the reform and opening-up policy. Typical Chinese urban agglomerations with different economic development levels have been selected for case study to validate the robustness and accuracy of this GA-UCAT method. They are Yangtze River Delta (YRD), Chengdu-Chongqing (CC), Changsha-Zhuzhou-Xiangtan (CZX), Beijing-Tianjin-Hebei Region (BTH), and Pearl River Delta (PRD) [40,41,42,43] (Figure 1). Except for CZX, the other four urban clusters belong to the state key construction project, while even those four vary from each other in size, population, per capital gross domestic product (GDP), and development rate. As such, they are suitable for robustness and accuracy assessments of the proposed method. In addition, according to previous state statistics data, urbanization and economic growth in these five regions are expected to maintain a high speed owing to their dominant geographic positions and policy supports. Therefore, to guide urban clusters to develop in a booming and continuous way, it is necessary to obtain up-dated and accurate information about urbanization dynamics of the selected Chinese city agglomerations.
2.2. Data
2.2.1. VIIRS DNB
VIIRS is the new-generation radiometer and VIIRS DNB nighttime lights make a huge leap forward over the DMSP-OLS. We used Version 1 VIIRS DNB Nighttime Lights monthly composited data from 2012 to 2017 which are available for download in NOAA National Geophysical Data Center (https://ngdc.noaa.gov/eog/viirs/download_dnb_composites.html). Because of the 14-bit quantization ranging from 0 to 16,384, VIIRS DNB data are more sensitive to lights from Earth, meaning that they are suitable data sources for detecting urbanization.
2.2.2. MODIS Data
Since 2000, MODIS has recorded data for long-term global study and it is one of the most popular data sources in a wide range of scientific applications [44]. We employed the 500 m annual MODIS Land Cover Type product (MCD12Q1) which is available to the public on the Internet (https://e4ftl01.cr.usgs.gov/MOTA/MCD12Q1.051/2013.01.01/). International Geosphere-Biosphere Program (IGBP), the most popular classification system in MCD12Q1, was selected for this paper to compare with results of GA-UCAT. The 500 m MODIS 8-day surface reflectance product (MOD09A1) is used to generate NDVI, NDBI, and Modified Normalized Different Water Index (MNDWI). NDVI combining near-infrared band (NIR) and red band reflectance (Equation (1)) has been widely utilized for representing vegetation cover. Zha et al. [45] proposed NDBI (Equation (2)) which is sensitive to the built-up areas and is promising to map urban land-use changes. Finally, MNDWI (Equation (3)) developed by Xu et al. [46] can mask water cover from images and this index performs well especially in urban areas. These three indexes are derived as:
where R, G, NIR, MIR are reflectance in red, green, near-infrared, and intermediate infrared band respectively.
2.2.3. Landsat 8 OLI
Landsat 8 Operational Land Imager (OLI) and Google Earth tiled maps were selected as validation data for accuracy assessments and discussion respectively. Landsat 8 OLI images in 2015 were downloaded from the Sharing Project of Landsat 8 surface reflectance product on the website of the Remote Sensing and Digital Earth Institute of the Chinese Academy of Sciences [47].
3. Methods
Thresholding techniques have been widely used to extract urban areas from nighttime light data because of their great simplicity when an optimal threshold is available. However, there is always a problem of figuring out the optimal threshold in an effective and automatic way. This difficulty challenges applications of this method to monitor urban dynamics from NTL images. Therefore, we proposed a Genetic Algorithm-based urban cluster automatic threshold (GA-UCAT) method to map urban areas from the VIIRS DNB image. NDVI and NDBI data were combined with VIIRS DNB to improve the accuracy of this method because using these three data together can describe urban characteristics in a better way.
To address the problem of determining optimal thresholds, we chose the Genetic Algorithms proposed by John Holland [48], because this method can efficiently search for the overall near optimal value. Firstly, it is necessary to explain the way of connecting GA with remote sensing images such as VIIRS NTL data. In Genetic Algorithms, an individual in the population represented by chromosome is converted to sequential binary code in the computer code world. Then, it is easy to connect this binary code with image values by the way of changing binary to decimal. Thus, GA and remote sensing data are connected by the transformation of chromosome and image DN values. Secondly, the way of GA methods to determine the optimal threshold for classification needs to be well explained. Fitness function is the key point of the GA related to optimization issues. Therefore, in GA-UCAT, we modified the fitness function to represents the quality of segmentation results by combining VIIRS DNB, NDVI, and NDBI. The best individual produced by modified fitness function means the optimal threshold for extracting urban extents from NTL images in our method.
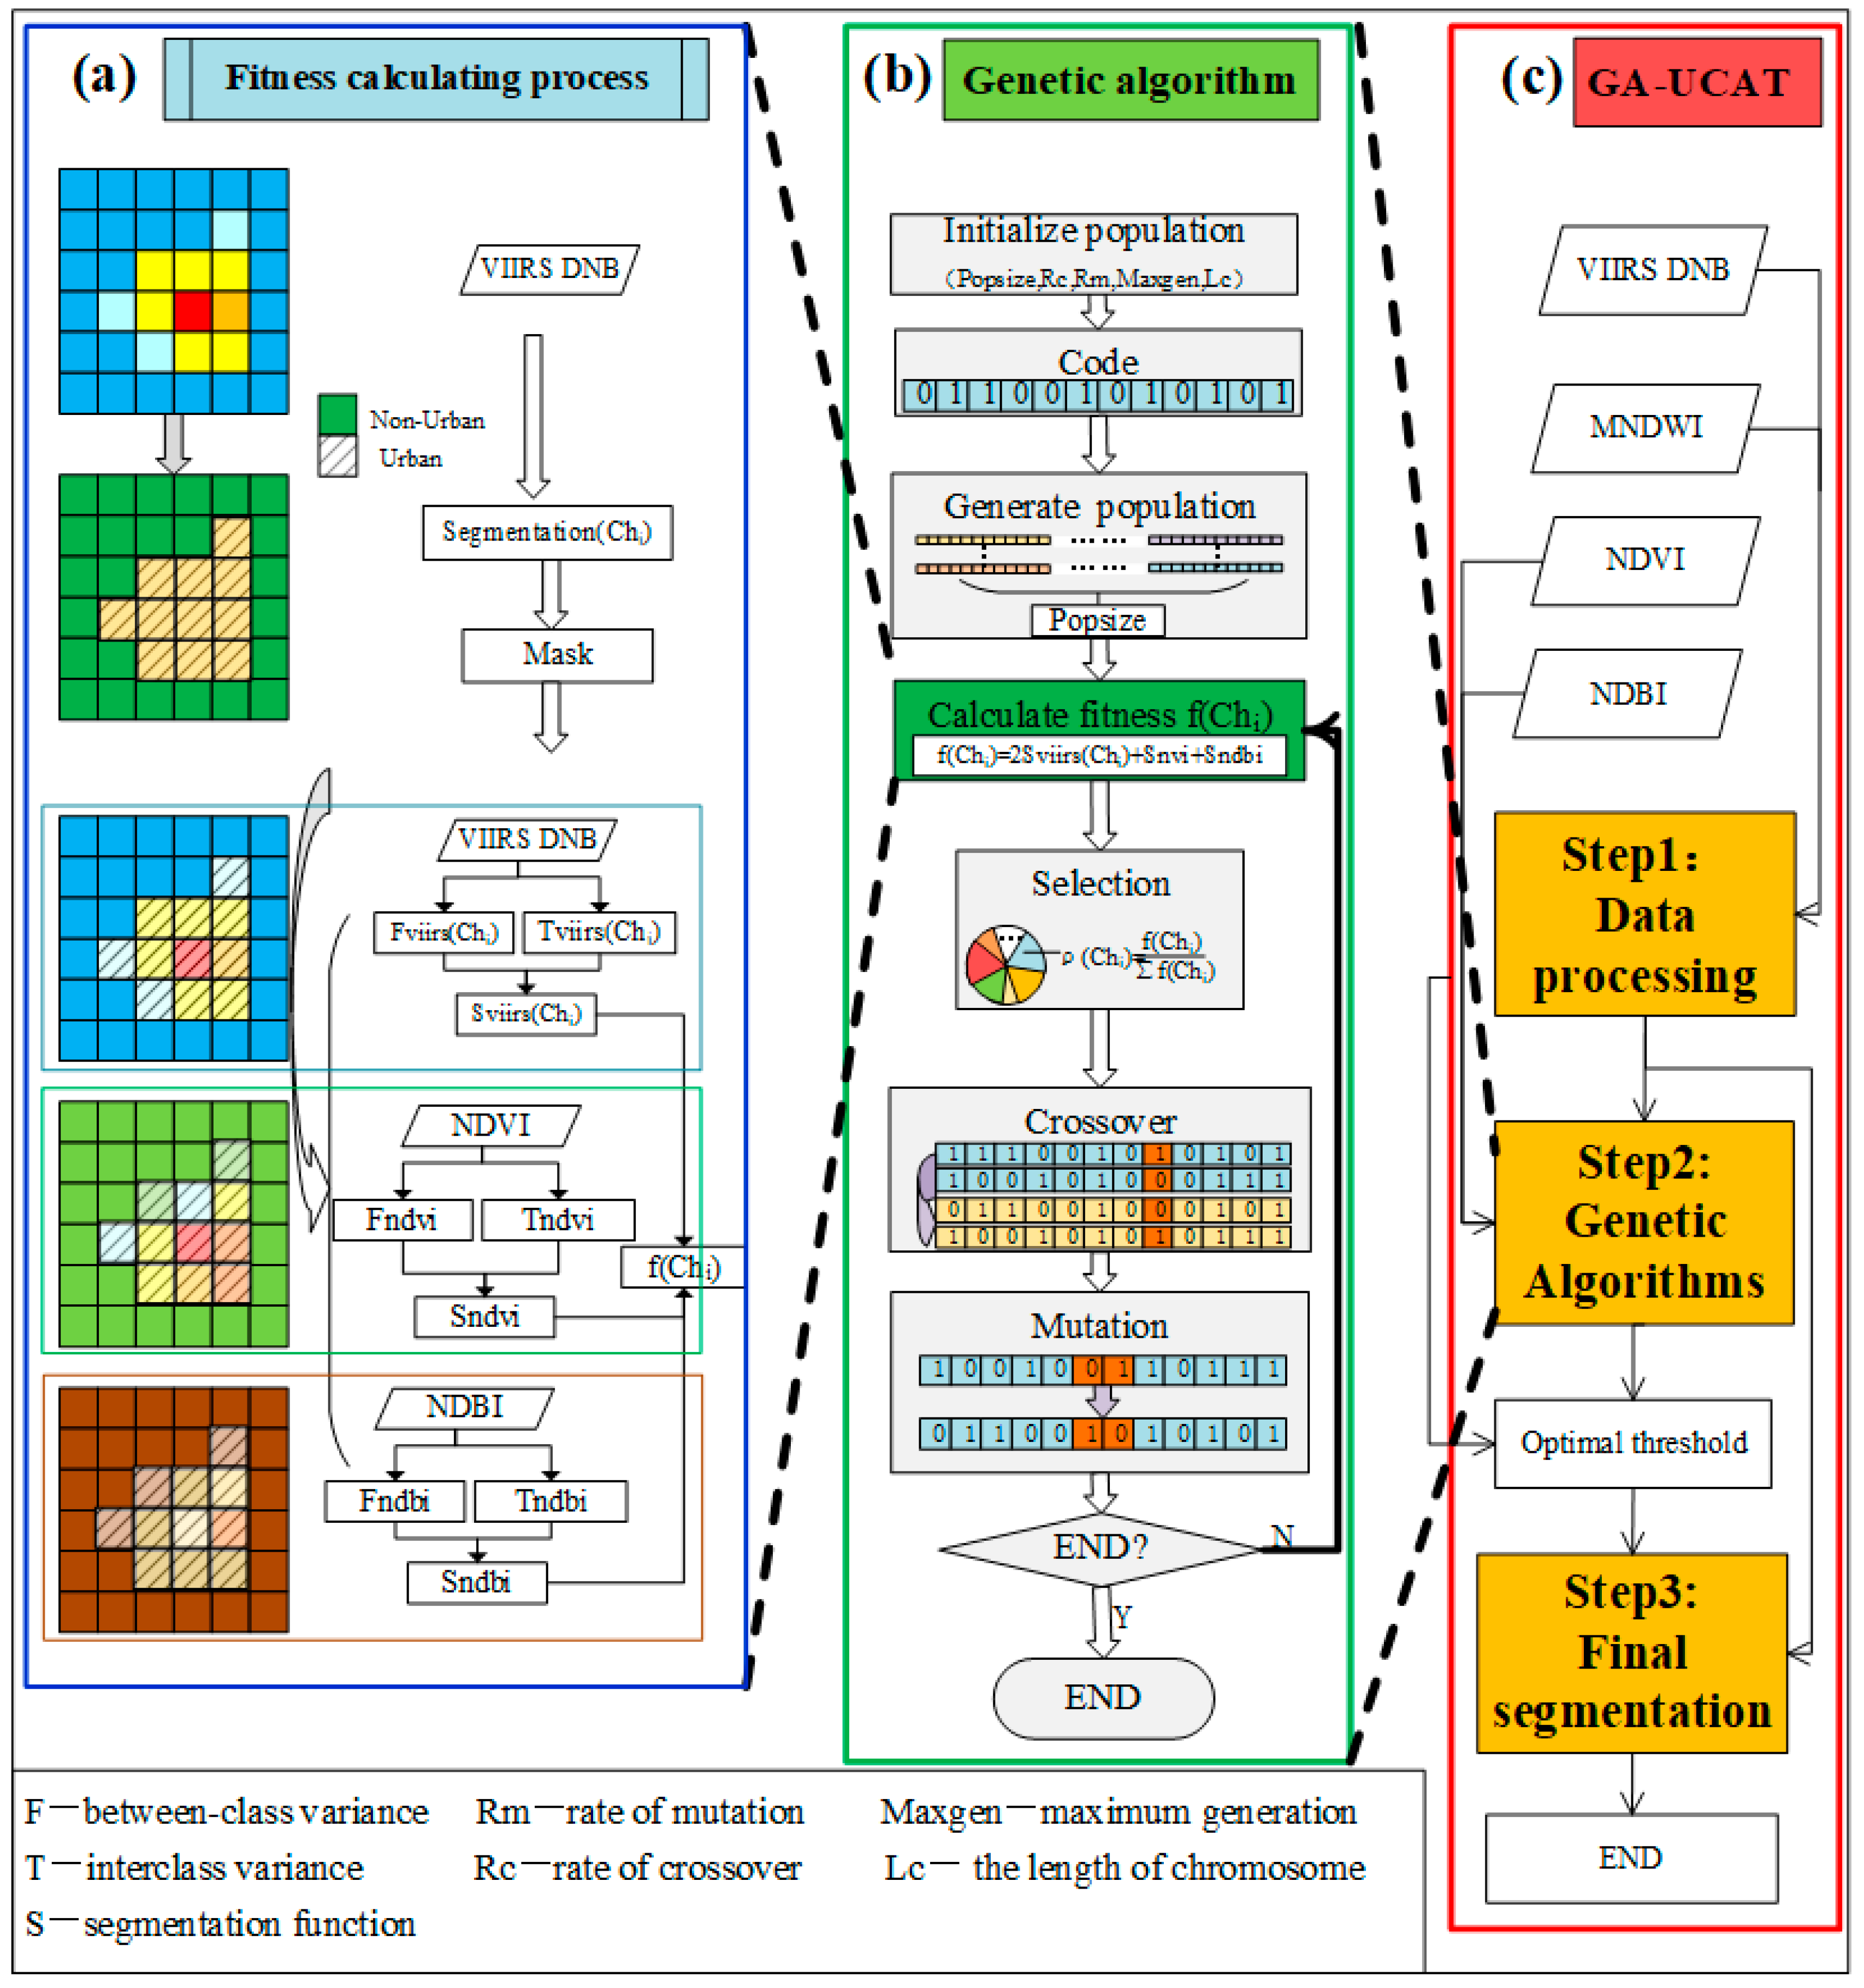
This proposed method is divided into three major steps including data processing, modified Genetic Algorithms, and final segmentation. In order to fully explain how this method works, we provide details about the core process in the flow chart (Figure 2). Particularly, fitness calculating process (Figure 2c) is the core of GA and the process of modified GA (Figure 2b) is the key part of this new method. Namely, Figure 2c is key part of (b) while (b) is an important step of (a). Thus, fitness calculation is the crucial part in GA-UCAT and it is explained with details in methodology.
3.1. Data Processing
VIIRS DNB and MODIS data were projected to Albers Conic Equal Area and then they were co-registered and resampled to the same resolution as MODIS data, 500 m. After that, NTL data were filtered by MNDWI to exclude water cover.
3.2. Modified Genetic Algorithms Process
There are four basic parts in GA including population initializing, coding, fitness function, and genetic process. Still, it is a bit abstract to think about how these biological processes produce optimal thresholds for NTL images. Population initialization is preparations for GA and it sets the computing environment of iterative optimization. The rule of coding is a bridge to connect chromosome and image DN value. Modified fitness function calculating is the most important part in this method because its results are the rule to measure whether the individual is the best one. Therefore, in order to convert thresholding selection problems to the optimal solution of fitness function, we combined between-class variance and inter-class variance to establish fitness function in GA-UCAT. The genetic process including selection, crossover, and mutation contributes to figure out the overall optimal result instead of being trapped in local extremes. Figure 2b with examples vividly shows the way these biological processes are represented in the computer world.
3.2.1. Population Initializing
Population initialization is the first stage of GA to set parameters. According to repeated tests of different parameters, the accuracy of this method is not sensitive to this process. Thus, in this paper, we set population quantity (100), crossover rate (0.1), mutation rate (0.05), the number of maximum generation (50) and the length of chromosome (12) from preliminary tests. All these four parameters occur in Figure 2b.
3.2.2. Coding
In GA-UCAT, coding means a transformation from chromosome to a sequential binary code in the computer code world and these codes are easily converted to decimal format representing image values (such as converting “000,001,101,010” to DN = 106). Accordingly, the best chromosome figured out by GA is the binary format of optimal DN value for thresholding technics.
3.2.3. Fitness Function Calculating
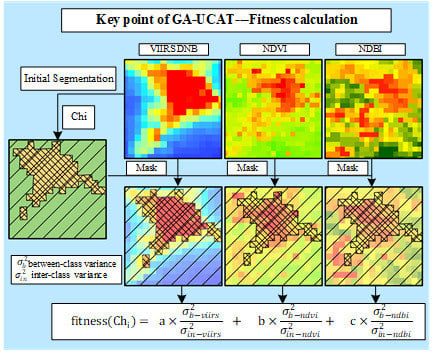
GA works follow “survival of the fittest”, the principle of biological evolutions. In the computer code world, the fittest meaning the optimal solution is selected by fitness function. Accordingly, in order to establish proper fitness function to measure the quality of classification, two indicators including between-class variance also named Otsu [49] and inter-class variance were chosen in GA-UCAT. Furthermore, to obtain better accuracy, this study incorporated the integration of VIIRS DNB, NDVI, and NDBI in modified fitness function and this is explain in Section 4.1. The fitness calculation is divided into following four parts and to fully explain this process, chromosome of “000,001,101,010” is taken as an example.
Firstly, the initial segmentation of NTL data was carried by the decimal value of chromosome (Chi). For example, NTL is classified by 106 (decimal format of “000,001,101,010”). This value divided the VIIRS DNB image into two parts C0 and C1 representing urban and non-urban areas respectively:
where u and n are DN values in urban and non-urban areas. The n0 and n1 are the amount of urban and non-urban pixels respectively.
Secondly, VIIRS DNB, NDVI, and NDBI images were masked by the initial segmentation image, the result of previous step. This part assumed that if the Chi such as 106 is the optimal threshold for NTL data, segmentation of the Chi would achieve best accuracy in all of these three data sources.
In the third part, between-class variance and inter-class variance are calculated as and :
where ua, na, and imga represent DN average of C0, C1 and the whole image respectively.
In the last stage, because the maximum between-class variance and minimum inter-class variance both represent the best quality of thresholding segmentation, we built a segmentation function by using divide . By combining segmentation function of VIIRS DNB, NDVI, and NDBI, the fitness function was built as follows:
where , ω, and ε represent weights of the segmentation function of three data sources respectively. After repeated experiments, setting as twice the sum of ω and ε (scale of 2:1:1), can achieve high accuracy in all case studies. It is mainly because this scale contributes to balance the weight of NTL and VNIR. The fitness value of Chi (like 106) is calculated and all individuals in the population need to calculate fitness value in the same way.
3.2.4. Genetic Process
The genetic process covers three parts: selection, crossover, and mutation. Selection is used to pick up the best individual with the highest fitness value, which is exactly the process of determining optimal threshold. The Roulette Wheel Selection (RSS) was chosen in this process because of its simplicity and effectiveness. In addition, crossover and mutation were processes allowing GA to search for overall optimal values without being trapped in the local extremums. There are two conditions for the modified GA meeting the end of loop: when fitness values do not change in five continuous generations or when the number of generations achieve the maximum generation which is set in the initialization.
3.3. Final Segmentation
After the process of GA with modified fitness function, an optimal threshold of NTL data is determined to segment bright urban extents from dark background. It is worth noting that this paper utilized and modified Genetic Algorithms Toolbox for MATLAB from the University of Sheffield [50] and this toolbox allows greater possibility for the GA-UCAT method to be employed by other researchers.
3.4. Accuracy Assessments of Ga-Ucat Method
Lastly, this method was validated by compared with classification results of Landsat 8 OLI images. The Maximum Likelihood Classification (MLC) method was utilized to classify three classes including vegetation, water, and impervious areas from Landsat data. After MLC, vegetation and water cover of classification results were merged into non-urban areas while the impervious areas were recognized as urban extents. Then, accuracy assessments were conducted from qualitative and quantitative respects.
4. Results
4.1. GA-UCAT
Results of GA-UCAT cover four parts including case study in PRD, spectral characteristics of data sources, details inside the algorithm, and comparison with MCD12Q1. A case study in the Pearl River Delta was conducted to prove whether incorporating f VIIRS DNB, NDVI, and NDBI is the best choice for the proposed method (Figure 3). Compared to the Landsat 8 OLI classification image (Figure 3f) with higher resolution, the result of solely employing NTL underestimates urban areas but the other two VNIR images of indexes overestimate them particularly NDVI (Figure 3b). However, the combination of them in the GA-UCAT method (Figure 3d) performs well by comparison with the validation data (Figure 3e,f). From the case study in 2015, it was found that by integrating all three data together rather than using them singly, the GA-UCAT method shows more similarity to validation data in terms of spatial patterns of urban distributions.
The following two parts aimed to explain why GA-UCAT combine NTL with NDVI and NDBI perform better than using VIIRS DNB separately. From the spectral respect, Figure 4 shows that these three data sources can express characteristics of urbanization to some extent and by complementing each other they are expected to show the entire appearance of urban areas. This finding results from data features that pixel values of urban areas are higher in NDBI and NTL images while lower in NDVI. Because these three data are adept at expressing urban characteristics from different aspects, they can supplement one another. Additionally, when small noise brought by clouds or other reasons occurs, the integration of them can mitigate this negative influence. As such, combining them together in GA-UCAT is a better way to display entire characteristics of urban land use.
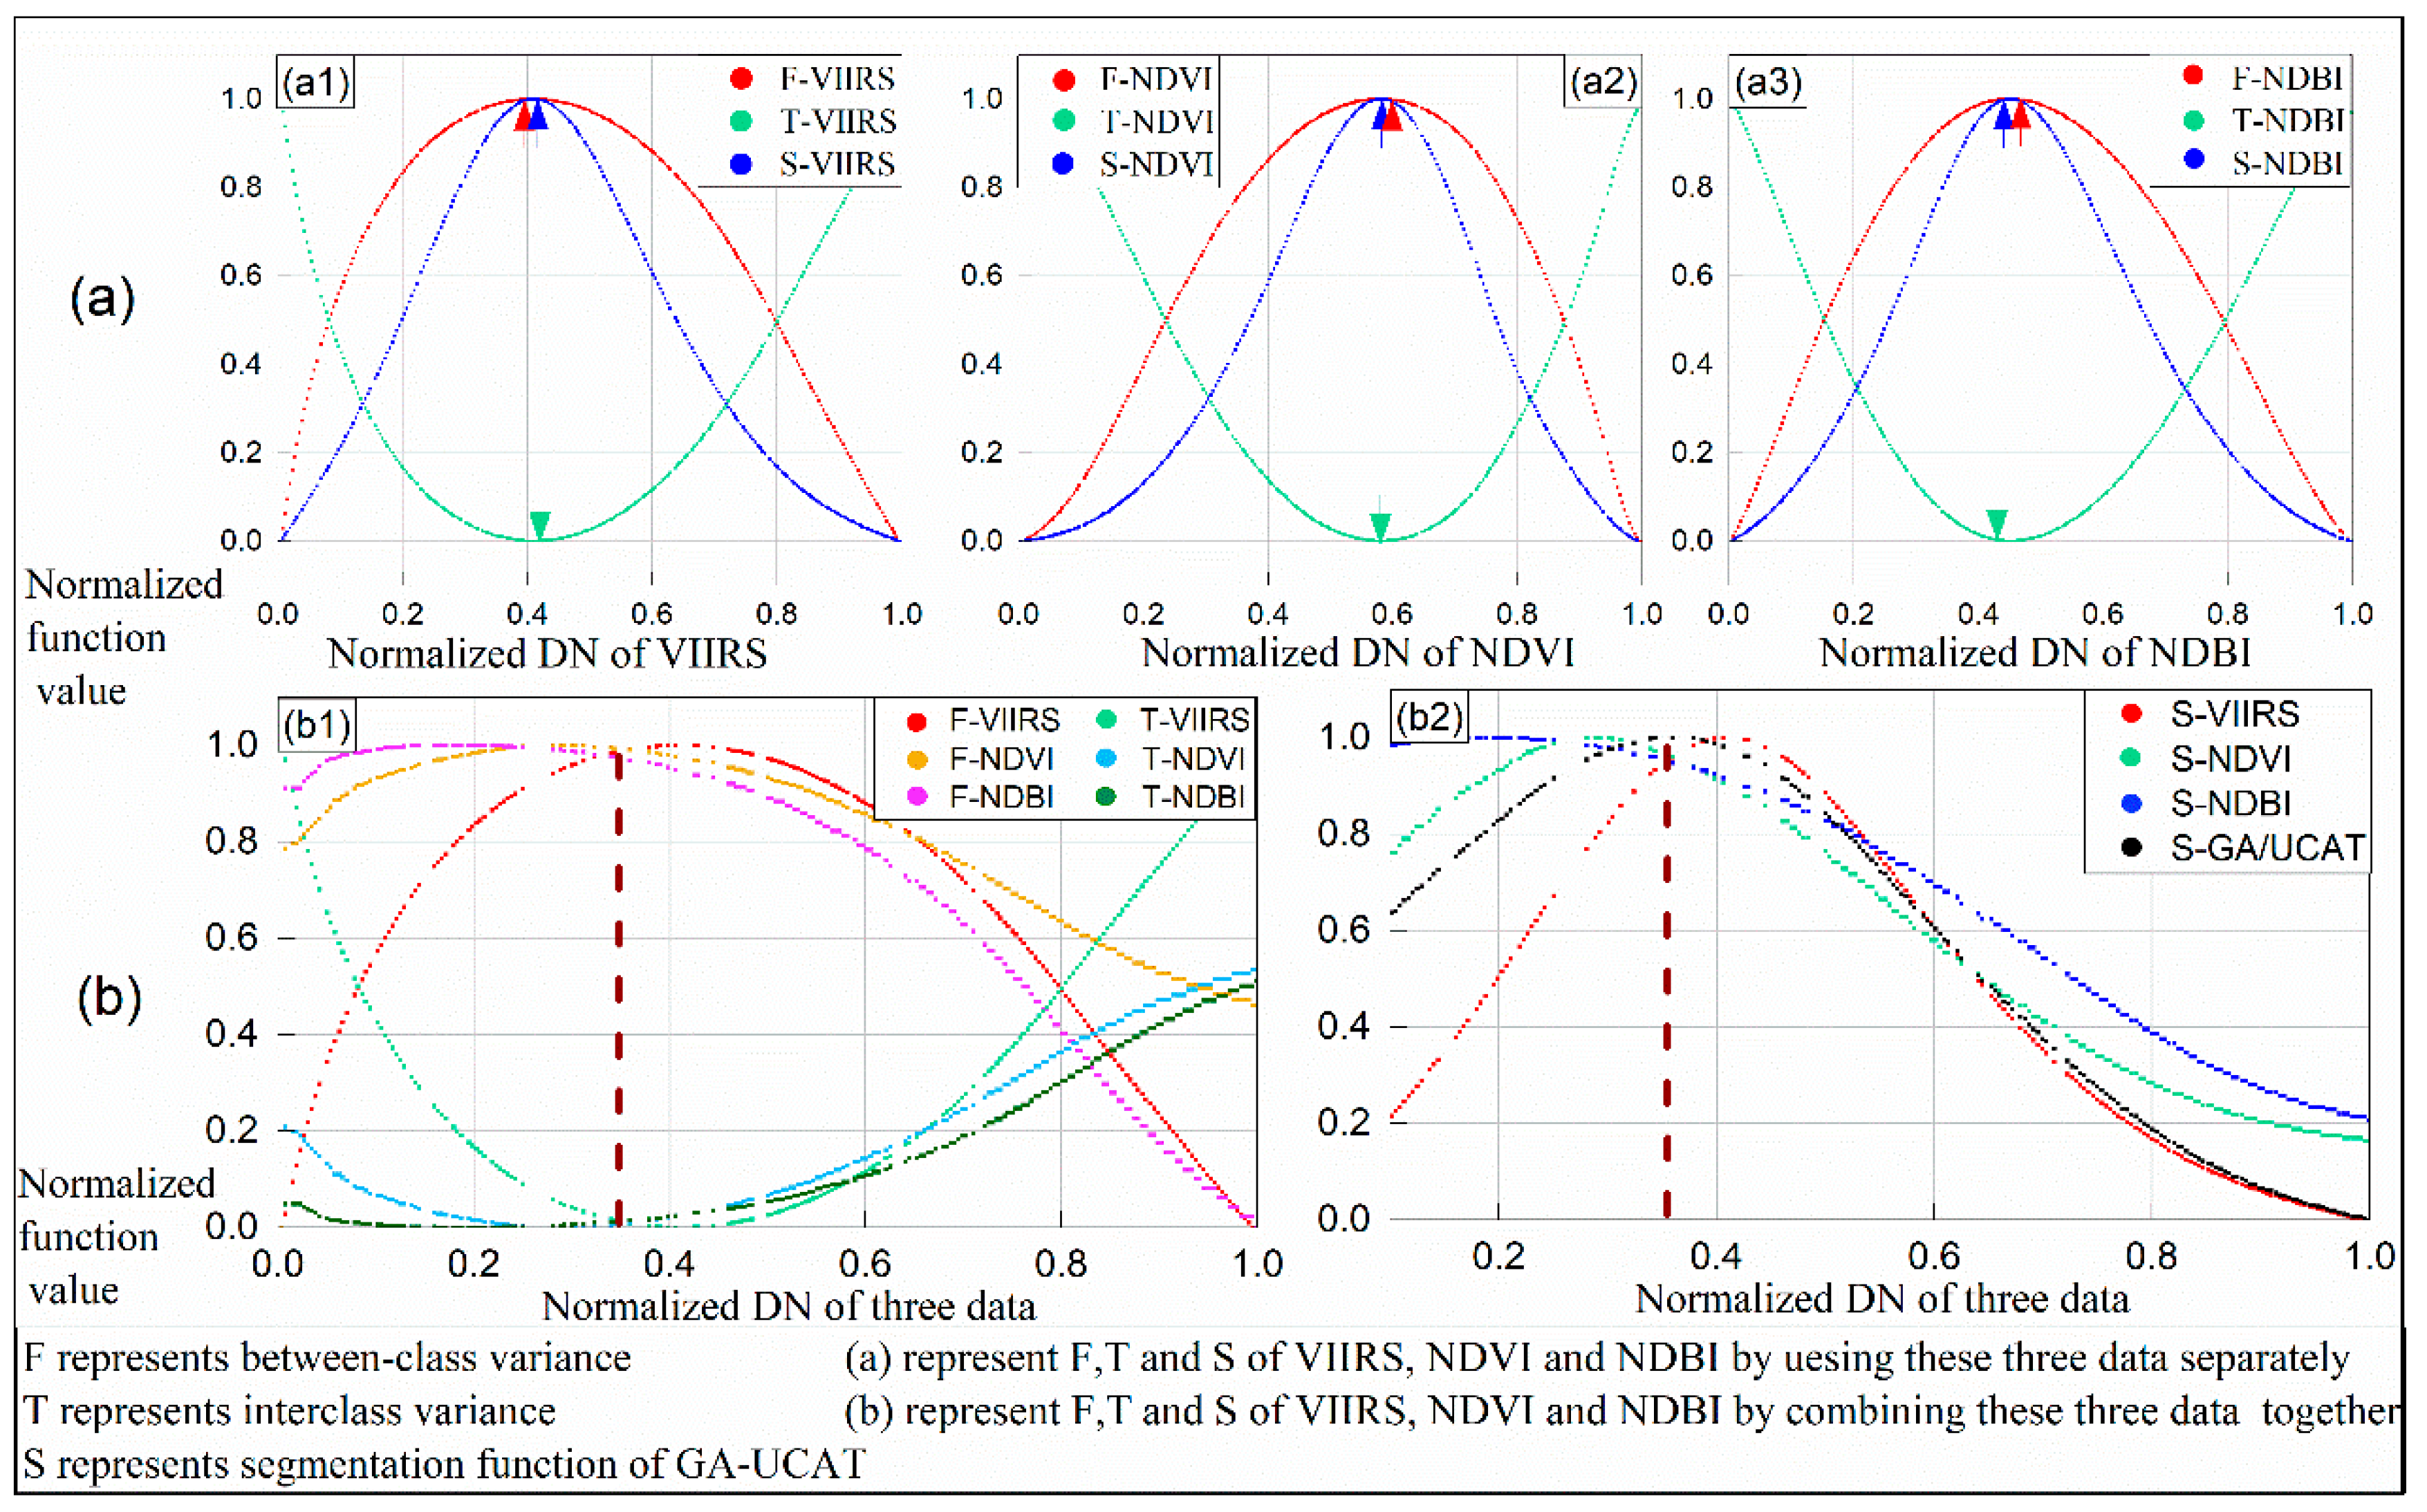
Furthermore, Figure 5 investigates the detailed performance of three data sources in the modified fitness function. The between-class and inter-class variance (represented by F and T respectively in Figure 5) of VIIRS DNB, NDVI, and NDBI (Figure 5a) show generally similar tendency with a unimodal distribution while different in details. It is known that if the DN values could make between-class variance maximum and inter-class variance minimum at the same time, this value would achieve the best segmentation result. However, Figure 5a shows there is always a small gap between the best DN values of those two indicators especially in NDBI (Figure 5(a3)). This gap turns DN optimal values of the segmentation function (S in Figure 5) to be offset from the best solution. On the other hand, Figure 5b shows the situation of combining all three data together in GA-UCAT. The selected threshold represented by dashed lines (Figure 5b) obtains the best segmentation by matching between-class variance maximum and inter-class variance minimum of these three data sources. Namely, from the inside details of this method, integration of these data together proves to be a better way to determine an optimal threshold.
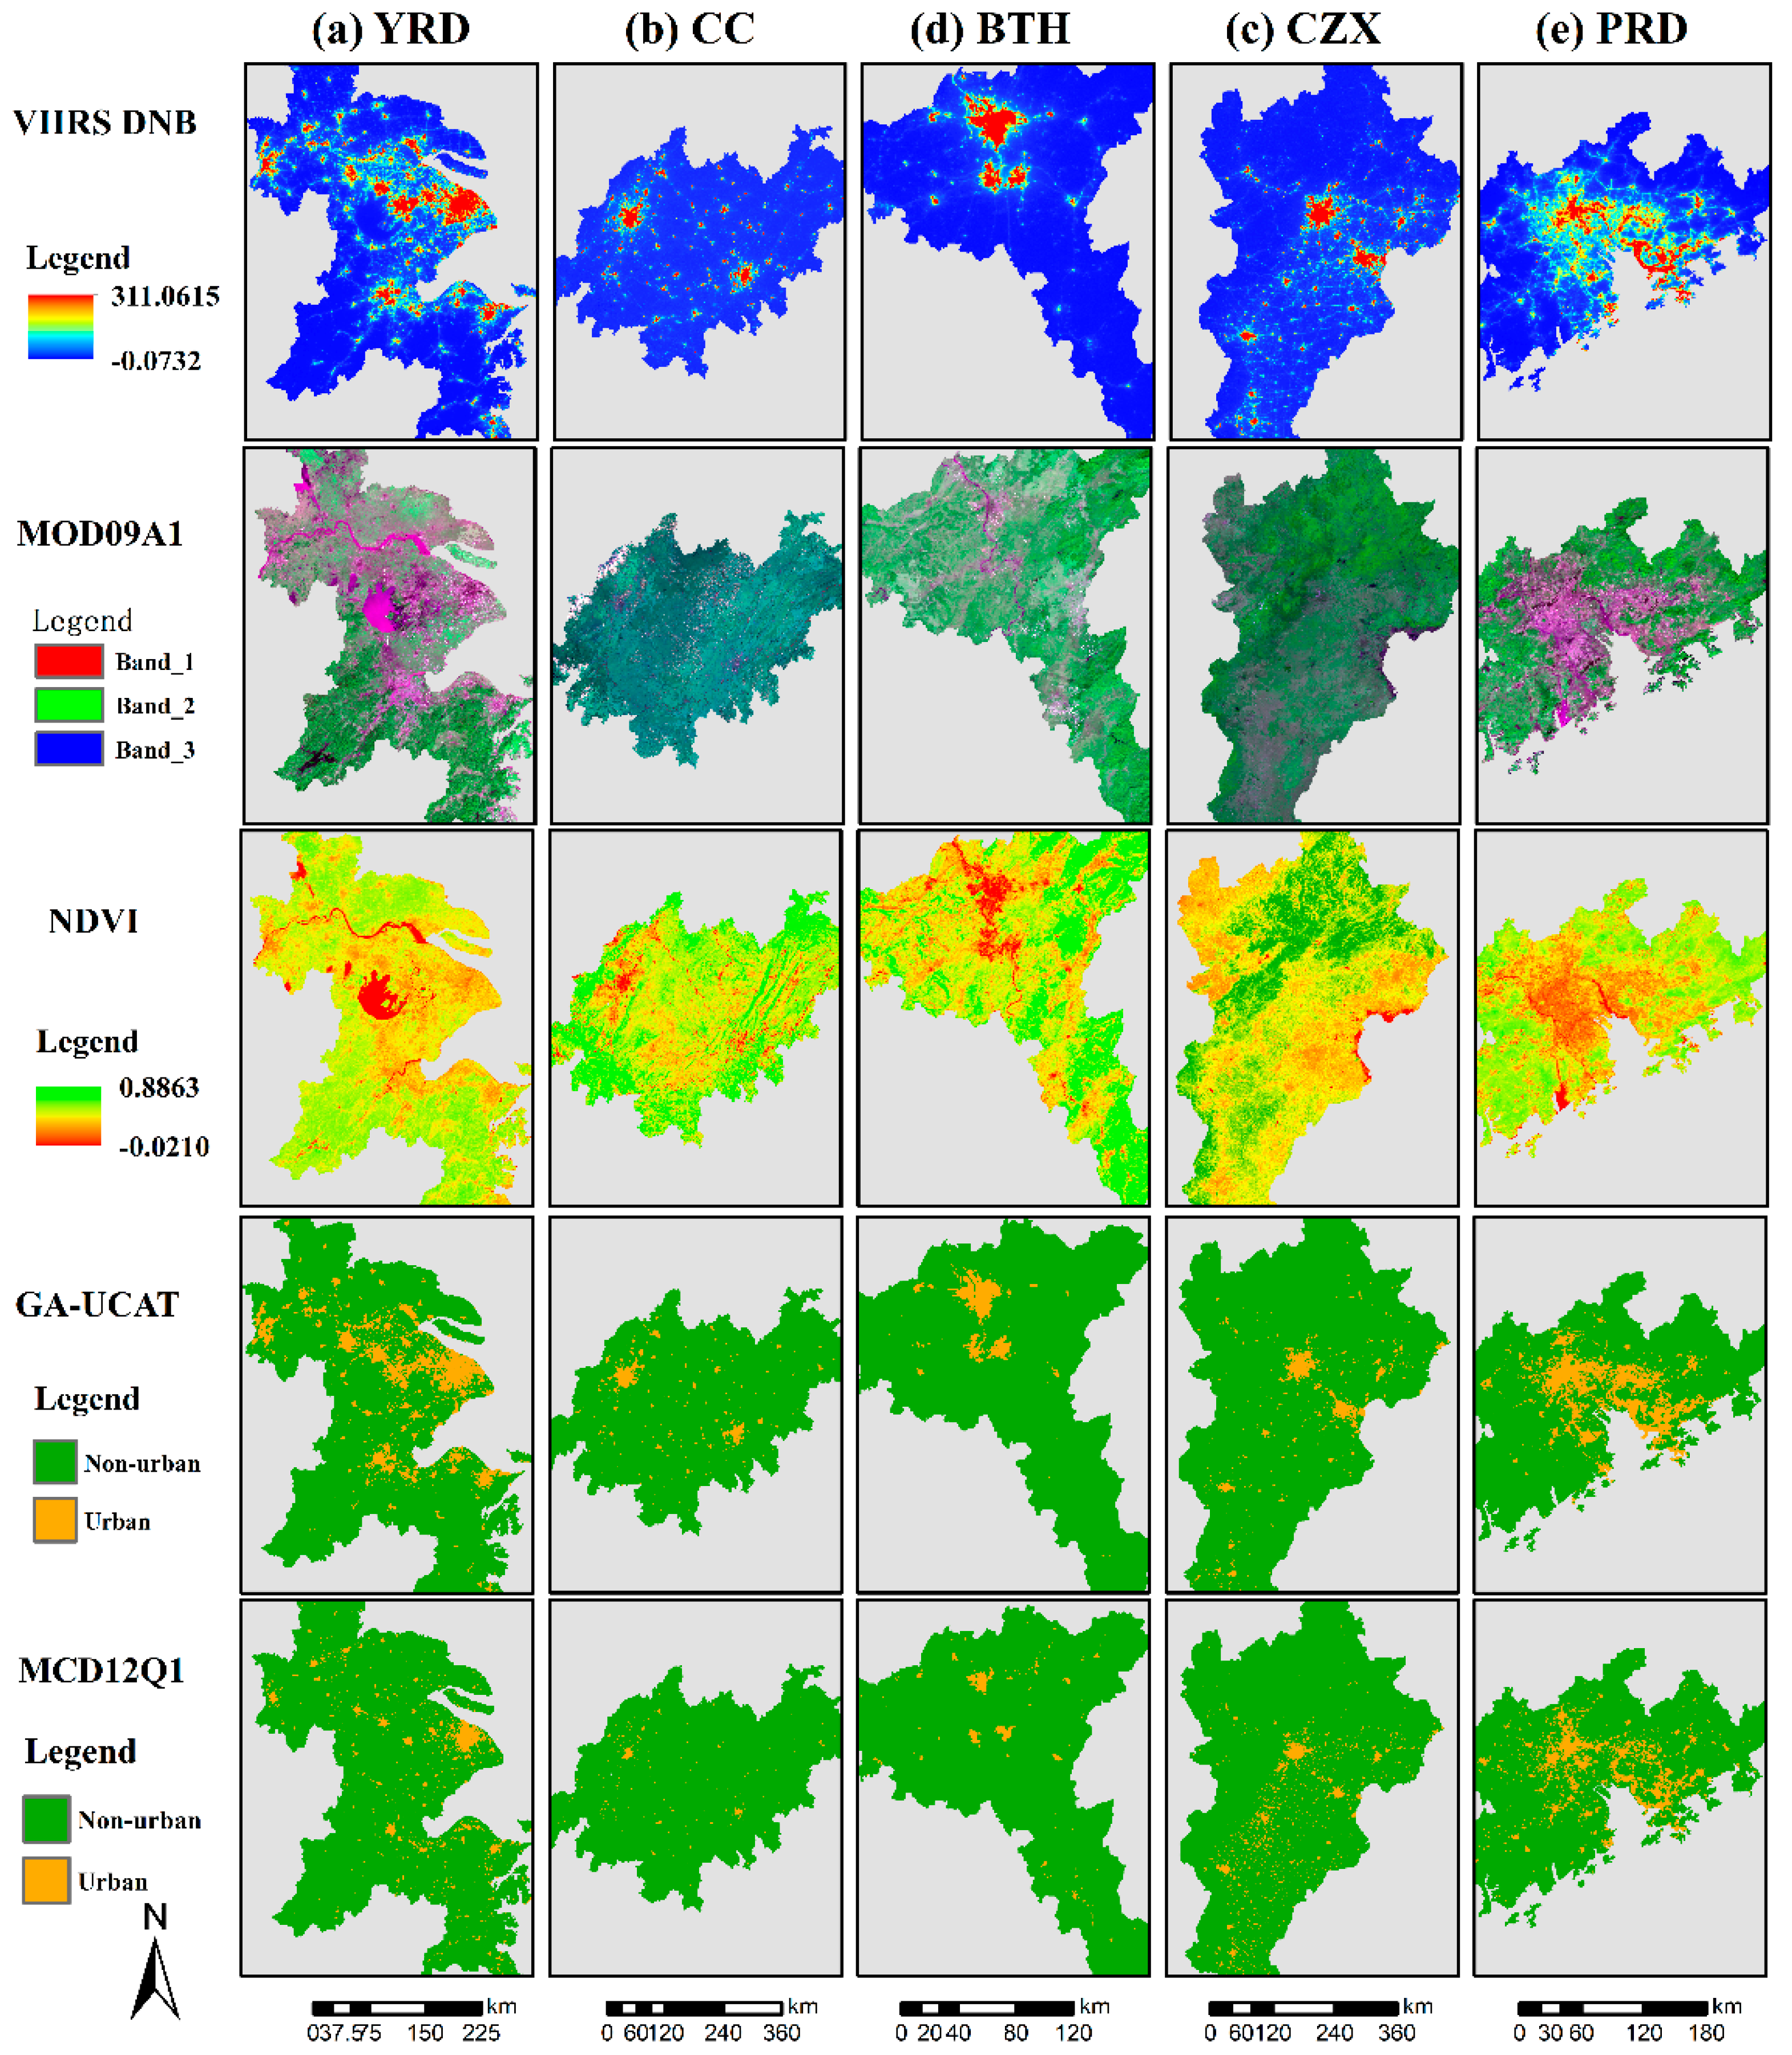
Figure 6 indicates that results of the GA-UCAT method show similar spatial distributions of urban extents with MCD12Q1 data. The year of 2012 is chosen, because MODIS land cover data were only updated to it. Hence, it is meaningful to propose effective ways with high accuracy to detect urban land-use changes. In addition, even though they share similar spatial distributions, by comparison with high-resolution ground truth from Google Earth, it is found that MCD12Q1 underestimates urban areas particularly in less developed city clusters with lower built-up intensity such as CC and CZX. The reason for this underestimate could be weakness of distinguishing suburban built-up areas from vegetation cover influenced by seasonal factors. Besides, compared with MODIS reflectance, NDVI data are a stronger indicator for telling the difference between built-up areas and vegetation land cover, as well as NDBI and VIIRS DNB. As such, NDVI and NDBI data rather than MOIDS reflectance bands are chosen in the GA-UCAT method. Generally, on the city cluster level, this new method can work for extracting urban land use and the accuracy evaluation of it is conducted in the next part.
4.2. Accuracy Assessments of GA-UCAT
In order to evaluate the performance of the GA-UCAT method in a comprehensive way, qualitative and quantitative aspects are both chosen as evaluation tools. Meanwhile, four relatively large cities representing the development level of the whole clusters, are selected from every city agglomeration, namely Shanghai from YRD, Changsha from CZX, Beijing from BTH, and Guangzhou from PRD. There are two main reasons why to just choose four representative cities as validation areas rather than the entire urban clusters directly. It is mainly due to the difficulty of collecting a lot of high quality validation images without severe contamination of cloud in the chosen months. Another reason is to mitigate the influence of different classification results of rural residential spots in terms of land use and land cover. In other words, this discrepancy results from the results that Landsat 8 images classify rural residential spots into urban built-up land cover while NTL data treat them as rural land use. This part is thoroughly discussed in Section 5.1. Because this difference has greater impact in outer suburban districts especially in small cities, we select major cities in the accuracy assessments to avoid it. Additionally, given the perennial cloud cover of Chengdu-Chongqing cluster, this paper did not succeed in collecting suitable validation data for Chengdu or Chongqing. Lack of one among five may not greatly influence the quality of the assessments. To sum up, cities selected in accuracy assessments are core parts of the whole clusters, which we believe are capable of representing the entire performance of GA-UCAT.
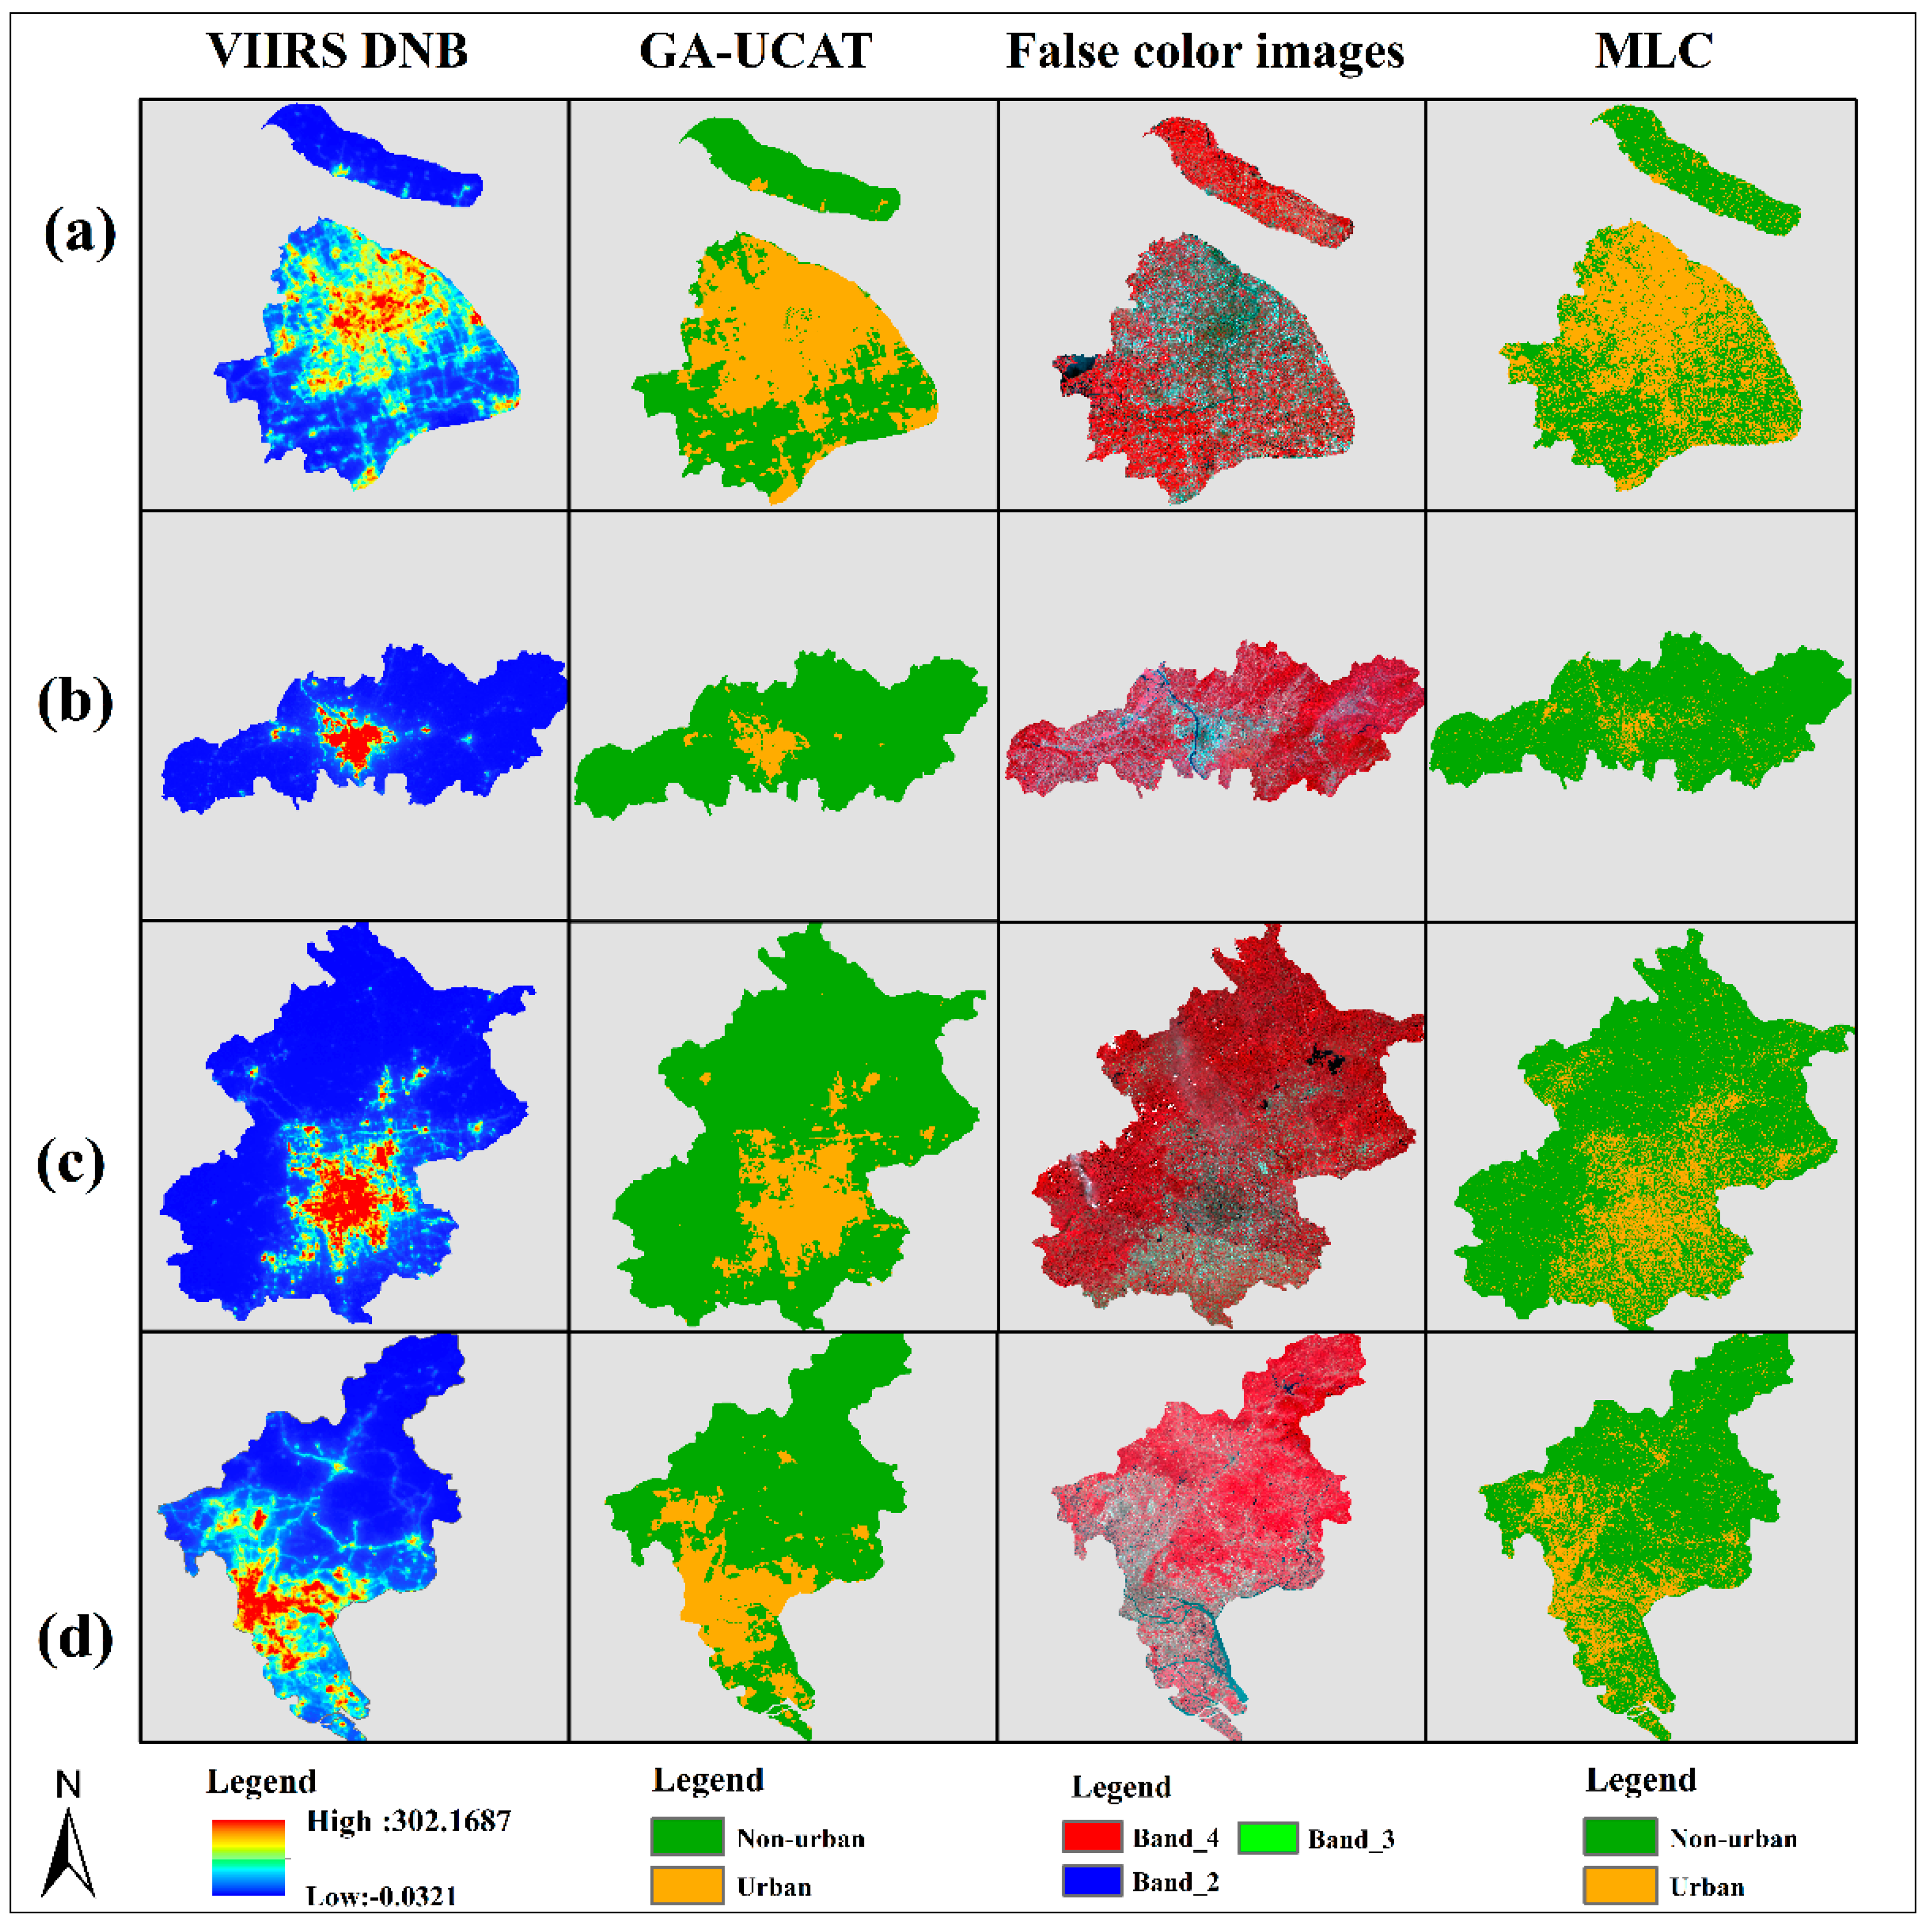
For qualitative assessments, to evaluate the performance of spatial distributions of GA-UCAT results, Figure 7 shows comparison of classification results between this method and Landsat 8 OLI images. Despite scale effect between those two data sources, it is evident that the results of the proposed method show similar spatial distributions with the validation data both in false color images and Maximum Likelihood Classification (MLC) results especially in Shanghai (Figure 7a) and Guangzhou (Figure 7d) which enjoy the fastest economic growth in the country. Furthermore, results of the proposed method describe well detailed spatial patterns of urban land use in Shanghai even in Chongming Island, the less developed part. However, in Figure 7b, GA-UACT results in Changsha are not shown to be as precise as other cities. This mainly results from less urbanized situations of Changsha with low built-up intensity showing a dispersed distribution of city extents compared with the others. Additionally, in terms of urban size in Beijing, M LC of Landsat data are a bit larger than GA-UCAT results, which probably results from the difference of data characteristics and scale factors between VIIRS NTL data and Landsat images (Figure 7c). In Figure 7d, the results from GA-UCAT are almost consistent with Landsat images and they all indicate that the south and central of Guangzhou are more urbanized than other parts there. To sum up, although Landsat classification images show slightly more fragmentation than GA- UCAT results, the latter almost describe the same boundary of urban areas as the former. These accuracy assessments of qualitative aspect demonstrate that the GA-UCAT method performs well in delineating spatial distributions of urban land use.
In respect of quantitative evaluation, given that Landsat data are accurate enough for the data employed in the proposed method, accuracy assessments are conducted by setting Landsat MLC results as ground truth data. Table 1 shows the validation results of the GA-UCAT method. It covers comparison of the amount of urban area and two important accuracy evaluation indicators.
By comparing the urban areas extracted from experiment results with the validation data, it was found that the GA-based method performs well in all four cities. Despite being overestimated a small number of urban areas derived from this new method are close to the Landsat classification in Shanghai and Guangzhou with high economic growth and advanced urban development level. Although the amount of urban area extents from the GA-UCAT method in Changsha and Beijing is less than the validation data, the difference between them is acceptable. This underestimate results from fragmentized spots in the classification of Landsat images, when compared to complete urban boundary of segmentation results from NTL data, especially in the less developed city of Changsha. Two assessment indicators, named overall accuracy (OA) and Kappa, are both calculated from the error matrix between the results of the proposed method and the MLC images. For the term of OA, Beijing gets the best accuracy (OA = 0.913) and other cities also perform well in evaluation of overall accuracy ranging from 0.854 to 0.913. Kappa is almost always around 0.7, indicating the high accuracy of the new method in delineating urban land use. Admittedly, the GA-based method does less well in the city of Changsha (OA = 0.854, Kappa = 0.699), while the result of the accuracy evaluation is relatively high enough for classification. In a word, on combining qualitative and quantitative assessments, the performance of the GA-UCAT method shows great ability to describe distributions and quantify characteristics of urban areas with high accuracy. Therefore, this proposed method can be recognized as a promising way for detecting urbanization in future applications.
5. Discussion
5.1. Rural Residential Spots
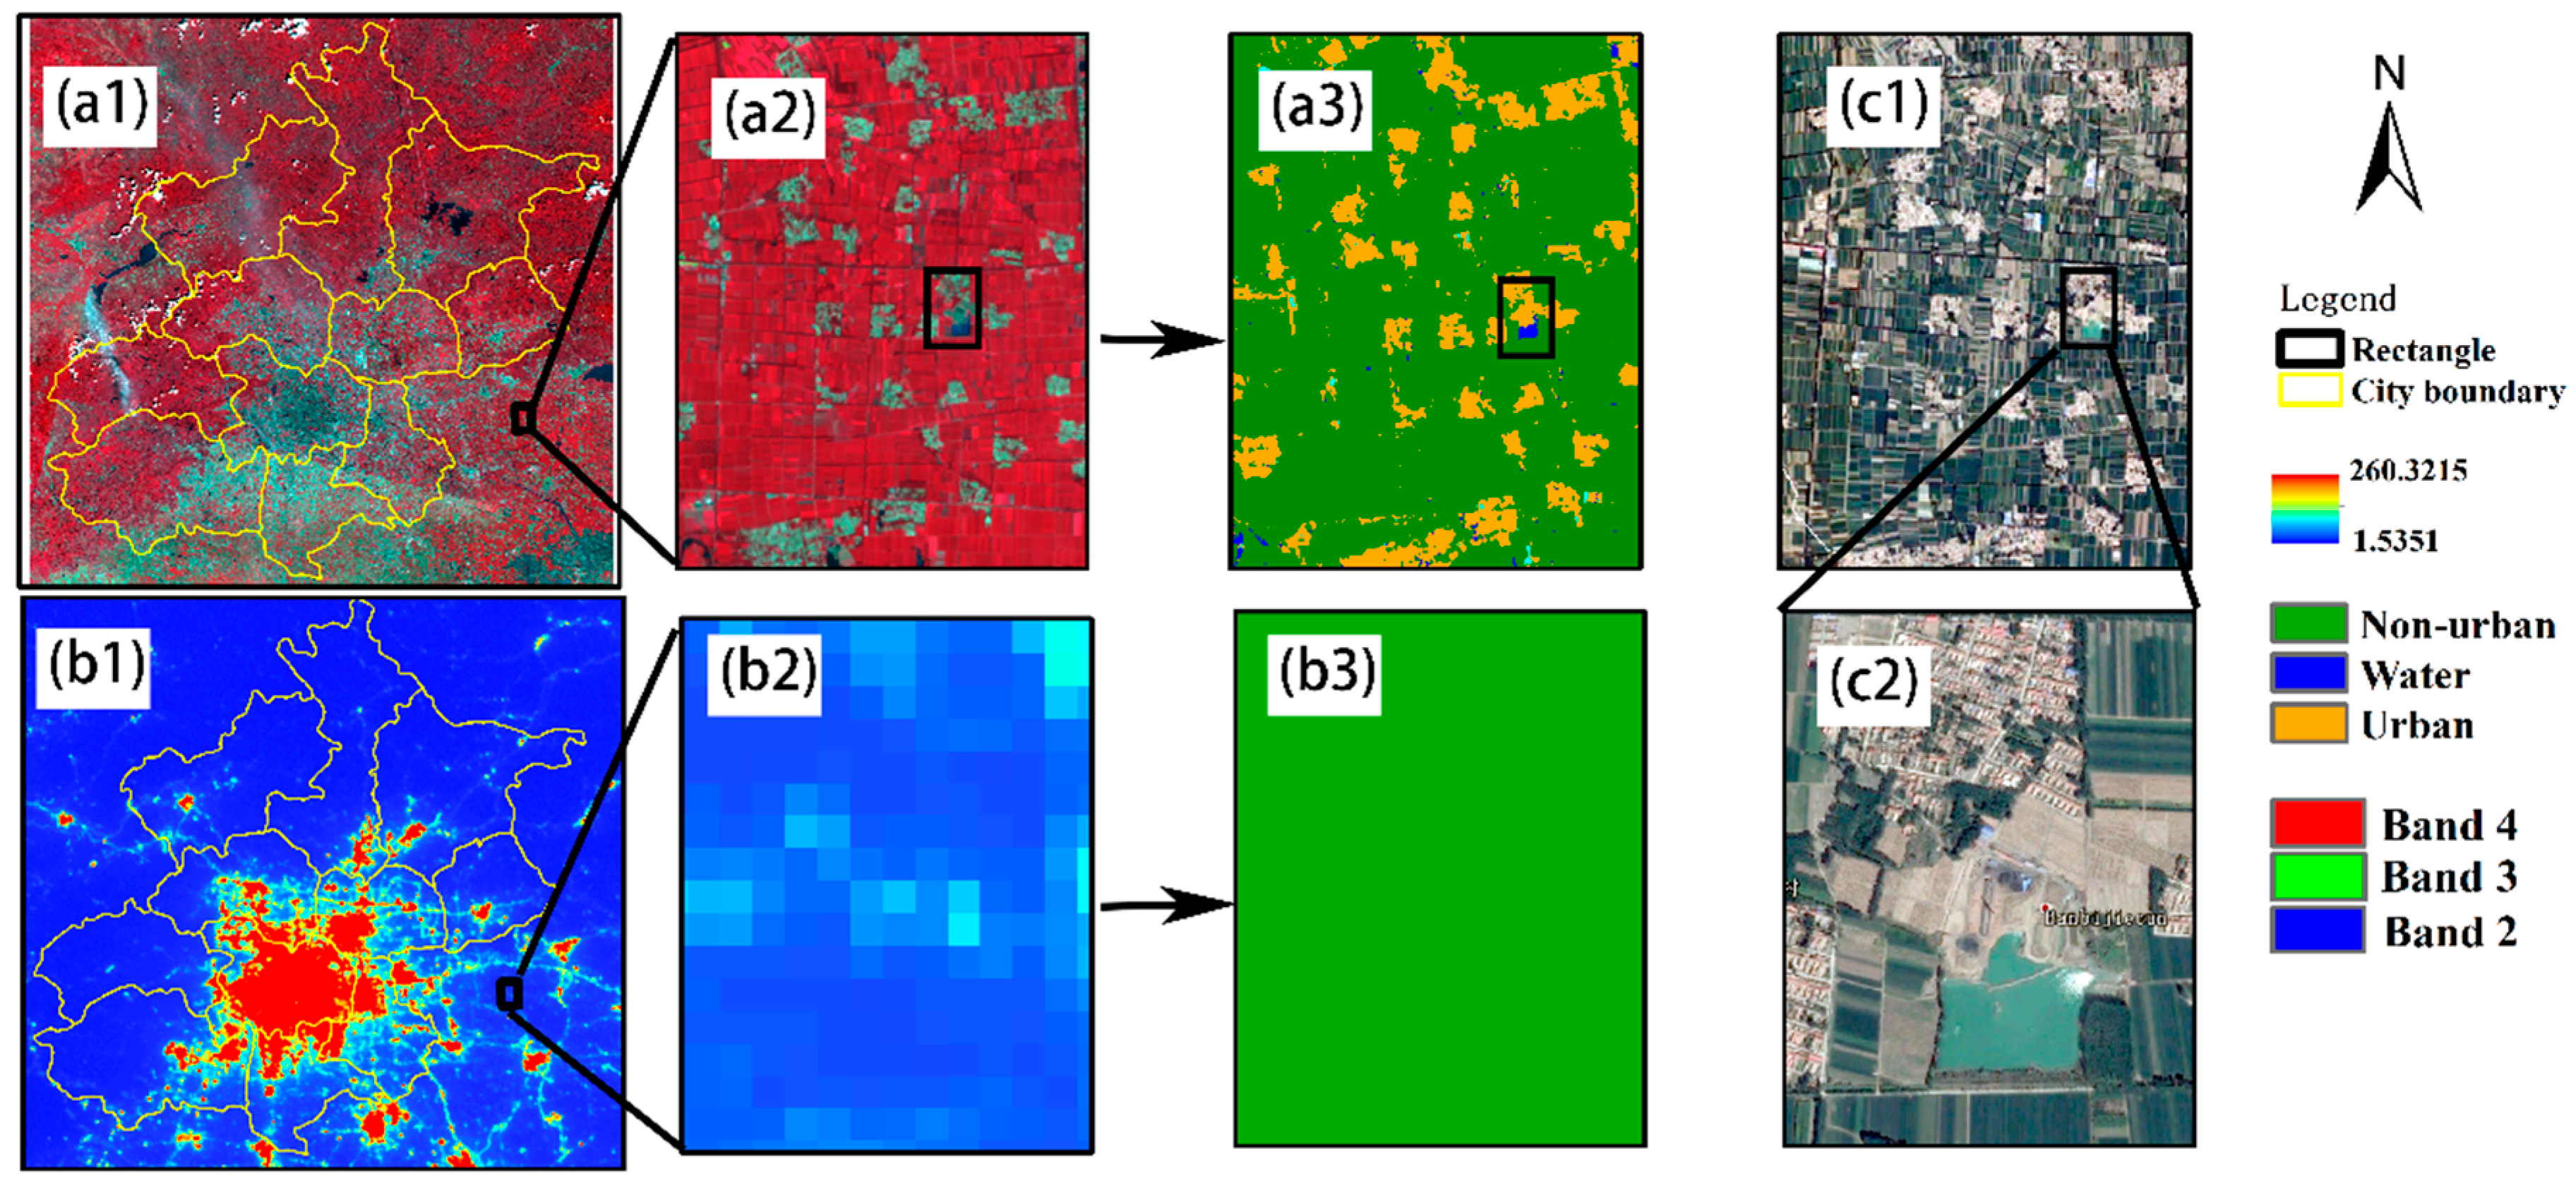
Information about spatial-temporal distributions of urbanization is essential for city studies and also helpful to address some environmental problems associated with rapid urbanization, such as air pollution and urban heat island (UHI). However, urban extents classified by Landsat and NTL images show slight divergence in the outskirts especially rural residential spots. There are two basic conditions of urban extents including area with intensive population density and built-up areas also named impervious area (ISA). These two terms represent different aspects from land use and land cover respectively. Land cover and land use are often employed as synonyms with slight difference. High intensity of anthropogenic activities detected by NTL data represents similar concerns with land use, which pays much attention to the function of urban areas. ISA indicates the real situations of land cover, which is usually detected by remote sensing particularly in the field of VINR images from spectrum characteristics. Rural residential spots are kinds of ISA without intensive population, so they are classified into urban land cover in the classification result of Landsat but rural land use of NTL images. The results of them are almost accordant within core urban areas but show discrepancy in outer suburban districts. Figure 8 and Figure 9 describe this difference from spectral characteristics and case study respectively. The reason why rural residential spots in exurban zone are classified into urban areas in VNIR bands is demonstrated in part A of Figure 8. The Landsat false color image of Beijing and its surround indicates that the urban core (Figure 8(a3)) of Beijing and ISA in rural areas (Figure 8(a4)) show similar spectral characteristics while the spectral polyline of rural residential spots is quite different from non-urban areas with dense vegetation cover (Figure 8(a2)). By contrast, VIIRS DNB in part B shows evident distinction between urban land use (Figure 8(b3)) and ISA in outskirts (Figure 8(b4)). In a word, from the spectral respect, Figure 8 explain why Landsat and NTL classify rural residential into different types. Furthermore, Figure 9 shows a typical case study in the outer suburb by comparing part A and part B with validation data (part C) from Google Earth. This case study is aimed to describe the difference mentioned above in a specific way. By zooming in Google Map tile (c2), it confirms that rural residential spots are made up by built-up ISA with low intensity. Figure 9(a2) is the result of supervised classification of Landsat images (Figure 9(a1)). Compared with Google Map tile (c1), ISA in Figure 9(a3) representing sparse rural residential spots with low built-up intensity is classified into urban land cover in Landsat images. Hence, the area amount of urban land cover from Landsat classification is larger than that of urban land use because of sparse rural settlements. On the contrary, VIIRS DNB data (Figure 9 Part B) in the same place show different information in detail. There is almost no rural residential spots with low intensity of human activity being classified into urban land use in nightlight data. From the aspect of spectral features and case study, it was found that Landsat images determine the pixel class according to the physical property without considering too much the function or application type of it but NTL data classify it in the opposite way.
The difference of classification results of rural residential settlements from Landsat and NTL images has an impact on their applications in urban studies. The urban boundary extracted from Landsat classification results shows fragmentized shape, because urban extents classified from them cover rural residential spots with dispersive distributions. By contrast, for the reason that NTL images focus on urban land use usually showing in concentrated form, their classification results can produce a relatively complete city boundary. Taking UHI as an example to explain how this boundary issue effects city studies, if the fragmentized boundary from Landsat images is applied, then the UHI intensity would be decreased by the low temperature of the rural settlement. Conversely, a relatively complete urban border is produced from results of GA-UCAT. For the reason that information of city extents is the basis for detecting temporal and spatial patterns of urban dynamics, a complete boundary is more useful in city studies. However, it is worth noting that despite this slight difference of Landsat and NTL data, given the resolution gap between them, Landsat images were accurate enough to validate the GA-based method in this paper. Additionally, because this difference, often appearing in small cities or remote suburbs, to mitigate its impact on accuracy assessments, key cities with booming economy have been chosen in that part. Generally, by pointing out the discrepancy between Landsat VNIR and NTL image, it explains why only large cities instead of the whole clusters are selected in accuracy assessments in this paper. Besides, this discussion proposes novel aspects that it is necessary to consider this differentia before application. For example, if the utility focused on land cover, then Landsat images would be the better choice. Conversely, NTL data are more suitable for some city studies paying close attention to land use. Also, it is necessary that the impact of these difference classifications on urban studies such as urbanization dynamics and UHI needs further quantitative description.
5.2. Temporal and Spatial Evolution of Five Typical Chinese Urban Clusters
One of the applications of the GA-UCAT method in urbanization dynamics is to study spatial–temporal evolutions of city clusters. Urbanization information of five typical Chinese urban agglomerations was extracted by the GA-UCAT method for the year of 2012, 2015, and 2017. In order to make assessments clear and evident, it is necessary to evaluate spatiotemporal evolution from the qualitative and quantitative respect.
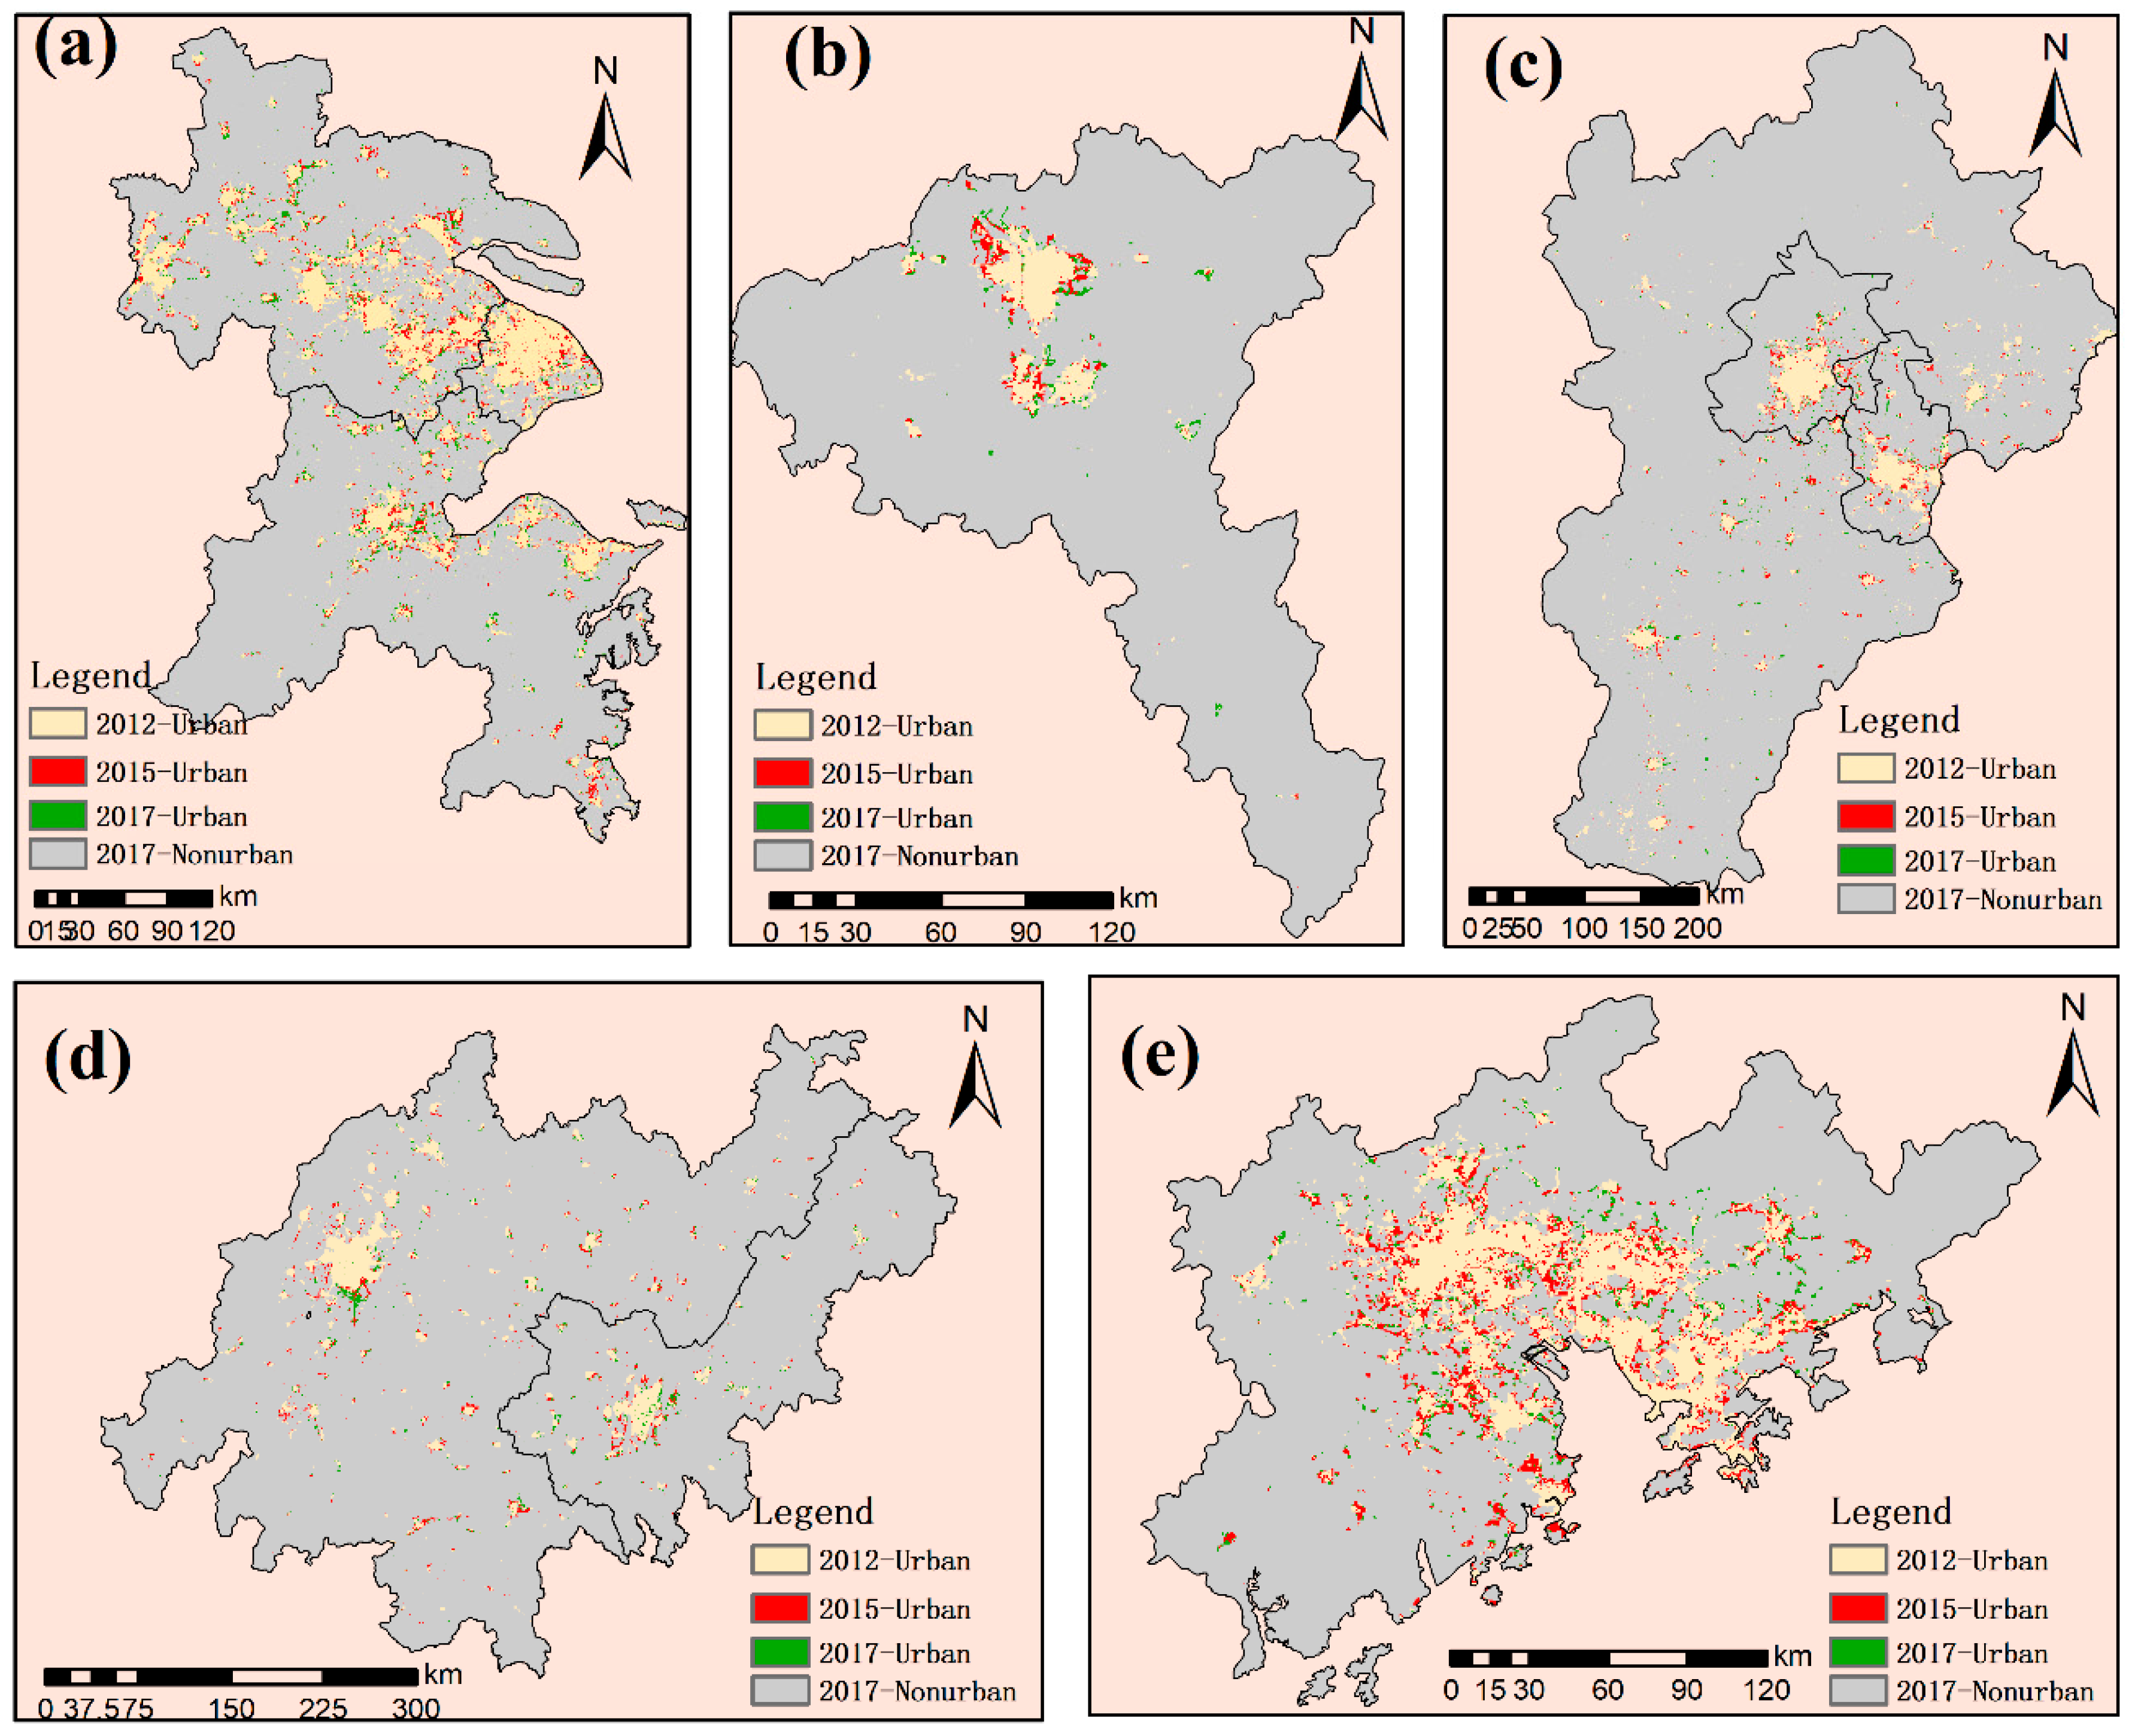
In term of the qualitative way, spatial distributions and growth patterns of all five urban agglomerations were explored in detail. In Figure 10, it is clear to see that CC (d), CZX (b) and BTH (c) are dual-nuclei city clusters, in which two major metropolises obviously cover most urban areas and almost all urbanized development happens around their boundary. Specifically, dual-nuclei cities like Beijing and Tianjin in the BTH Region make great contributions in carrying on economic and urbanization growth of the whole city clusters [51]. On comparison with this two-core growth pattern, the Yangtze River Delta (a) and the Pearl River Delta (e), the most developed regions with greatest GDP in the country, belong to the multi-core pattern namely several major cities with large urban land use there. This is mainly due to dense urbanization of both YRD and ZRD located in the estuary of the river which is a key factor for international trade. Although these two regions share a similar growth pattern, there are still some differences of urbanization dynamics between them. By learning from “Universal Gravitation”, urbanization studies employ gravity terms such as radiation capacity and extents, to represent the impact of central cities on their satellite towns. Figure 10a shows that the distributions of urban areas in the YRD are more disperse than in the PRD. These characteristics indicate that central cities in the YRD have larger radiation extents while major cities in PRD show stronger radiation capacity within limited areas. Generally, in Figure 10, there is a growth tendency from 2012 to 2017 particularly in the CZX and PRD. In the CZX and BTH, almost all urbanization arose around the major core cities at relatively low intensity. Arguments whether the urban growth pattern of BTH is positive or negative have sparked a heated discussion in the whole society particularly in the study of Chinese urbanization. Compared with the other three regions especially PRD, in which the urbanization process takes on larger areas with higher intensity, the BTH urbanized way is less vigorous in urban agglomerations development. Nevertheless, the major cities in PRD show stronger radiation capacity in the whole clusters, which allows the region to develop in a continuous way with great vigor. Besides, taking Beijing as an example, an inappropriate pattern of urban growth may bring pressure on citizens living there such as severe traffic congestion, crowded dwelling conditions, and even shortage of water resources. Generally, from spatial means, by investigating the distributions and growing patterns of five selected city clusters, it was found that the multi-core pattern shows faster and more continuous urban growth than the dual-core one and major cities with strong radiation capacity and large radiation extents can conduct promising development of the whole region.
From the quantitative respect, Figure 11 and Table 2 show specific and detailed information of urbanization in five selected city clusters. In Figure 11, it is clear that the number of urban areas in the Yangtze River Delta (urban area in 2012 is 12,354.75 km2) are much more than the others. However, the CZX is the least urbanized region due to its minimum city extents, which coincides with the social-economic development status of this whole clusters. The YRD not only shows the largest urban areas but also has the greatest urbanization from 2012 to 2017. Additionally, the number of urban areas in BTH, CC, and PRD are generally on a similar level while the first one is slightly more developed than the latter two. The progress of urbanization in the PRD shows a great increase from 2012 to 2015, sharing the similar tendency of economic growth in this region. However, by only comparing with the absolute amount of the built-up area it is not able to show the entire growth conditions because the size of five regions differ a lot from each other. Therefore, urban rate, a more evident index, is proposed to discover the temporal dynamics of urbanization. Different from the result of absolute amount, the urban rate of the PRD (14.38% in 2012) is highest. Following PRD, YRD comes second top in five selected city clusters and urban proportion of these two regions is almost as twice as others. This finding is relatively consistent with great economic prosperity development there in recent years. The other rate of urban area ranges from large to small as: the BTH, CZT, and CC, while they are almost on a similar level. When it comes to the changes from 2012 to 2017, the YRD shows high growth rate over the whole period while PRD represents a slightly different growth tendency. By integration of absolute number and proportion data, PRD and YRD are classified as the most urbanized urban clusters of these five selected cases. The urban rates in another three regions grew steadily from 2012 to 2017. Further study needs to pay attention to this slow development with more quantification indexes, in order to explore why their urbanization development lags behind PRD and figure out how to help them break through the barrier of growth. To sum up, discussion here confirms applications of results from the GA-UCAT method in exploring spatial-temporal evolution.
6. Conclusions
To address the problem of determining optimal thresholds in the studies of urbanization dynamics, a Genetic Algorithm-based urban cluster automatic threshold (GA-UCAT) approach is proposed in this paper. By combining VIIRS DNB, NDVI, and NDBI data, the GA-UCAT method takes advantages of complementary characteristics of these three data sources in terms of displaying well the difference between urban and non-urban land use. The Genetic Algorithms are employed in GA-UCAT to automatically determine the best solutions named thresholds. This GA-based method estimates the optimal threshold by modified fitness function incorporating between-class variance and inter-class variance. Note that the relatively complex methodology of GA-UCAT was introduced in detail, this is to explain why and how this method can work to produce optimal thresholds. However, the application of this method is much easier, because of the existing Genetic Algorithms Toolbox of MATLAB. The simplicity and efficiency allows great potential for the GA-UCAT method to be widely applied in further urban studies.
Results cover details of GA-UCAT and accuracy assessments of this new method. The case study in PRD proves that integration of the three data sources mentioned above is the better choice. The reasons for this combination are explained from the aspects of spectral features and results of modified fitness function. Additionally, compared with MCD12Q1, which was only updated to 2012, this new method tackles issues of non-temporally current data which are common in global land cover products. In terms of comparing with Landsat 8 OLI images, the accuracy assessments for the GA-UCAT method conducted from both qualitative and quantitative respects, confirm that the GA-based method with combination of NTL and VNIR data can automatically determine optimal thresholds with simplicity, efficiency, and high accuracy. This proposed method is validated to perform better in developed regions, where it is more necessary and urgent to obtain timely and detailed urban information for guiding continuous and rapid development. Because even the lower accuracy in less urbanized cities such as Changsha (OA = 0.854 and Kappa = 0.699) is recognized as an acceptable result, this new method has proved to be accurate enough for mapping urban dynamics. To conclude, the high efficiency and accuracy of the GA-UCAT method confirm its promising application for monitoring urbanization at mega-cluster scales.
Additionally, discussion in this paper includes two parts namely the difference of classification results between Landsat VNIR and VIIRS DNB images and an example of the application of GA-UCAT in spatial-temporal urban changes. This discrepancy mainly results from the fact that Landsat images classify rural settlement spots into urban built-up land cover but NTL data classify them as rural land use. Without the influence of fragmented rural settlements, the results of the GA-UCAT method can describe urban distributions with a relatively complete boundary, which is important to the city studies especially in urbanization dynamics and UHI. Because this difference is often found in less developed regions, to mitigate its influence on accuracy assessments, the most developed cities are selected from every cluster. Besides, to evaluate the spatial-temporal urbanized patterns, urbanization information in five typical Chinese urban agglomerations including the YRD, CC, CZX, BTH, and PRD was extracted by the GA-UCAT method in the years of 2012, 2015, and 2017. There are two major ways of spatial distributions and growth named dual-core and multi-core patterns and the latter one shows a faster development rate in the case study. From both the absolute amount and the proportion of built-up area, the YRD and PRD are the most urbanized regions in the country with the greatest area amount of urban land use and fastest city growth from 2012 to 2017. Compared with them, CC, CZX, and BTH show relatively low urban rate and growth especially CZX, the least developed city cluster among them. This coincides with situations of economic growth, cluster size, population and GDP.
In summary, the GA-UCAT method is promising in urban studies and it could be employed in other regions with more comparisons and quantitative descriptions utilized to discover details of city development in the future. Moreover, this method can be further modified for the last generation NTL data (DMSP-OLS) available from 1992 to 2013. After making DMSP-OLS and VIIRS DNB comparable, using the proposed method can produce long temporal series urbanized information which is crucial to address environmental issues resulting from rapid urbanization.
Acknowledgments
This work was funded by the National Science Foundation of China (grant no.41471348 and 41771448); the Science and Technology Plans of the Ministry of Housing and Urban-Rural Development of the People’s Republic of China, and Opening Projects of Beijing Advanced Innovation Center for Future Urban Design, Beijing University of Civil Engineering and Architecture (grant no. UDC201650100); the National Natural Science Foundation of China and the Project of State Key Laboratory of Earth Surface Processes and Resource Ecology (grant no. 2017-ZY-03).
Author Contributions
Kangning Li and Yunhao Chen conceived and designed the experiments; Kangning Li performed the experiments and wrote the paper; Yunhao Chen gave advice for writing this paper and provided constructive comments.
Conflicts of Interest
The authors declare no conflict of interest.
References
- United Nations. World Urbanization Prospects: The 2014 Revision, Highlights; Department of Economic and Social Affairs: New York, NY, USA, 2014. [Google Scholar]
- Yuan, F.; Bauer, M.E. Comparison of impervious surface area and normalized difference vegetation index as indicators of surface urban heat island effects in Landsat imagery. Remote Sens. Environ. 2007, 106, 375–386. [Google Scholar] [CrossRef]
- Shahbaz, M.; Lean, H.H. Does financial development increase energy consumption? The role of industrialization and urbanization in Tunisia. Energy Policy 2012, 40, 473–479. [Google Scholar] [CrossRef] [Green Version]
- Superczynski, S.D.; Christopher, S.A. Exploring land use and land cover effects on air quality in Central Alabama using GIS and remote sensing. Remote Sens. 2011, 3, 2552. [Google Scholar] [CrossRef]
- Walsh, C.J. Urban impacts on the ecology of receiving waters: A framework for assessment, conservation and restoration. Hydrobiologia 2000, 431, 107–114. [Google Scholar] [CrossRef]
- Kalnay, E.; Cai, M. Impact of urbanization and land-use change on climate. Nature 2003, 423, 528. [Google Scholar] [CrossRef] [PubMed]
- Welch, R. Spatial resolution requirements for urban studies. Int. J. Remote. Sens. 2007, 3, 139–146. [Google Scholar] [CrossRef]
- Jensen, J.R.; Cowen, D.C. Remote sensing of urban/suburban infrastructure and socio-economic attributes. Photogramm. Eng. Remote Sens. 1999, 65, 611–622. [Google Scholar] [CrossRef]
- Liu, J.; Zhang, Z.; Xu, X.; Kuang, W.; Zhou, W.; Zhang, S.; Li, R.; Yan, C.; Yu, D.; Wu, S.; et al. Spatial patterns and driving forces of land use change in China during the early 21st century. J. Geogr. Sci. 2010, 20, 483–494. [Google Scholar] [CrossRef]
- Sexton, J.O.; Song, X.-P.; Huang, C.; Channan, S.; Baker, M.E.; Townshend, J.R. Urban growth of the Washington, DC–Baltimore, MD metropolitan region from 1984 to 2010 by annual, Landsat-based estimates of impervious cover. Remote Sens. Environ. 2013, 129, 42–53. [Google Scholar] [CrossRef]
- Shalaby, A.; Tateishi, R. Remote sensing and GIS for mapping and monitoring land cover and land-use changes in the northwestern coastal zone of Egypt. Appl. Geogr. 2007, 27, 28–41. [Google Scholar] [CrossRef]
- Song, X.-P.; Sexton, J.O.; Huang, C.; Channan, S.; Townshend, J.R. Characterizing the magnitude, timing and duration of urban growth from time series of Landsat-based estimates of impervious cover. Remote Sens. Environ. 2016, 175, 1–13. [Google Scholar] [CrossRef]
- Yuan, F.; Sawaya, K.E.; Loeffelholz, B.C.; Bauer, M.E. Land cover classification and change analysis of the Twin Cities (Minnesota) metropolitan area by multi-temporal Landsat remote sensing. Remote Sens. Environ. 2005, 98, 317–328. [Google Scholar] [CrossRef]
- Potere, D.; Schneider, A.; Angel, S.; Civco, D.L. Mapping urban areas on a global scale: Which of the eight maps now available is more accurate? Int. J. Remote. Sens. 2009, 30, 6531–6558. [Google Scholar] [CrossRef]
- Schneider, A.; Friedl, M.A.; McIver, D.K.; Woodcock, C.E. Mapping urban areas by fusing multiple sources of coarse resolution remotely sensed data. Photogramm. Eng. Remote Sens. 2003, 69, 1377–1386. [Google Scholar] [CrossRef]
- Schneider, A.; Friedl, M.A.; Potere, D. A new map of global urban extent from MODIS satellite data. Environ. Res. Lett. 2009, 4, 044003. [Google Scholar] [CrossRef]
- Yang, Y.; Ma, M.; Tan, C.; Li, W. Spatial Recognition of the urban-rural fringe of Beijing using DMSP/OLS nighttime light data. Remote Sens. 2017, 9, 1141. [Google Scholar] [CrossRef]
- Elvidge, C.D.; Baugh, K.E.; Zhizhin, M.; Hsu, F.-C. Why VIIRS data are superior to DMSP for mapping nighttime lights. Proc. Asia-Pac. Adv. Netw. 2013, 35, 62–69. [Google Scholar] [CrossRef]
- Zou, Y.; Peng, H.; Liu, G.; Yang, K.; Xie, Y.; Weng, Q. Monitoring urban clusters expansion in the middle reaches of the Yangtze River, China, using time-series nighttime light images. Remote Sens. 2017, 9, 1007. [Google Scholar] [CrossRef]
- Hu, Y.N.; Peng, J.; Liu, Y.; Du, Y.; Li, H.; Wu, J. Mapping development pattern in Beijing-Tianjin-Hebei urban agglomeration using DMSP/OLS nighttime light data. Remote Sens. 2017, 9, 760. [Google Scholar] [CrossRef]
- Li, Q.; Lu, L.; Weng, Q.; Xie, Y.; Guo, H. Monitoring urban dynamics in the southeast U.S.A. using time-series DMSP/OLS nightlight imagery. Remote Sens. 2016, 8, 578. [Google Scholar] [CrossRef]
- Small, C.; Pozzi, F.; Elvidge, C.D. Spatial analysis of global urban extent from DMSP/OLS night lights. Remote Sens. Environ. 2005, 96, 277–291. [Google Scholar] [CrossRef]
- Elvidge, C.D.; Cinzano, P.; Pettit, D.; Arvesen, J.; Sutton, P.; Small, C.; Nemani, R.; Longcore, T.; Rich, C.; Safran, J. The Nightsat mission concept. Int. J. Remote. Sens. 2007, 28, 2645–2670. [Google Scholar] [CrossRef]
- Elvidge, C.D.; Baugh, K.E.; Dietz, J.B.; Bland, T.; Sutton, P.C.; Kroehl, H.W. Radiance calibration of DMSP/OLS low-light imaging data of human settlements. Remote Sens. Environ. 1999, 68, 77–88. [Google Scholar] [CrossRef]
- Elvidge, C.D.; Baugh, K.E.; Kihn, E.A.; Kroehl, H.W.; Davis, E.R. Mapping city lights with nighttime data from the DMSP Operational Linescan System. Photogramm. Eng. Remote Sens. 1997, 63, 727–734. [Google Scholar]
- Gao, B.; Huang, Q.; He, C.; Ma, Q. Dynamics of urbanization levels in China from 1992 to 2012: Perspective from DMSP/OLS nighttime light data. Remote Sens. 2015, 7, 1721. [Google Scholar] [CrossRef]
- Yu, B.; Shu, S.; Liu, H.; Song, W.; Wu, J.; Wang, L.; Chen, Z. Object-based spatial cluster analysis of urban landscape pattern using nighttime light satellite images: A case study of China. Int. J. Geogr. Inf. Sci. 2014, 28, 2328–2355. [Google Scholar] [CrossRef]
- Imhoff, M.L.; Lawrence, W.T.; Stutzer, D.C.; Elvidge, C.D. A technique for using composite DMSP/OLS “city lights” satellite data to map urban area. Remote Sens. Environ. 1997, 61, 361–370. [Google Scholar] [CrossRef]
- Elvidge, C.D.; Keith, D.M.; Tuttle, B.T.; Baugh, K.E. Spectral identification of lighting type and character. Sensors 2010, 10, 3961–3988. [Google Scholar] [CrossRef] [PubMed]
- Shi, K.; Yu, B.; Huang, Y.; Hu, Y.; Yin, B.; Chen, Z.; Chen, L.; Wu, J. Evaluating the ability of NPP-VIIRS nighttime light data to estimate the gross domestic product and the electric power consumption of China at multiple scales: A comparison with DMSP/OLS data. Remote Sens. 2014, 6, 1705. [Google Scholar] [CrossRef]
- Cao, X.; Chen, J.; Imura, H.; Higashi, O. A SVM-based method to extract urban areas from DMSP/OLS and SPOT-VGT data. Remote Sens. Environ. 2009, 113, 2205–2209. [Google Scholar] [CrossRef]
- Pandey, B.; Joshi, P.; Seto, K.C. Monitoring urbanization dynamics in India using DMSP/OLS night time lights and SPOT-VGT data. Int. J. Appl. Earth Obs. Geoinf. 2013, 23, 49–61. [Google Scholar] [CrossRef]
- Zhang, Q.; Schaaf, C.; Seto, K.C. The vegetation adjusted NTL urban index: A new approach to reduce saturation and increase variation in nighttime luminosity. Remote Sens. Environ. 2013, 129, 32–41. [Google Scholar] [CrossRef]
- Sharma, R.C.; Tateishi, R.; Hara, K.; Gharechelou, S.; Iizuka, K. Global mapping of urban built-up areas of year 2014 by combining MODIS multispectral data with VIIRS nighttime light data. Int. J. Digit. Earth 2016, 9, 1004–1020. [Google Scholar] [CrossRef]
- Henderson, M.; Yeh, E.T.; Gong, P.; Elvidge, C.; Baugh, K. Validation of urban boundaries derived from global night-time satellite imagery. Int. J. Remote. Sens. 2003, 24, 595–609. [Google Scholar] [CrossRef]
- Liu, Z.; He, C.; Zhang, Q.; Huang, Q.; Yang, Y. Extracting the dynamics of urban expansion in China using DMSP/OLS nighttime light data from 1992 to 2008. Landsc. Urban Plan. 2012, 106, 62–72. [Google Scholar] [CrossRef]
- Sutton, P.C. A scale-adjusted measure of “urban sprawl” using nighttime satellite imagery. Remote Sens. Environ. 2003, 86, 353–369. [Google Scholar] [CrossRef]
- Xie, Y.; Weng, Q. Updating urban extents with nighttime light imagery by using an object-based thresholding method. Remote Sens. Environ. 2016, 187, 1–13. [Google Scholar] [CrossRef]
- Whitley, D. A genetic algorithm tutorial. Stat. Comput. 1994, 4, 65–85. [Google Scholar] [CrossRef]
- Chan, R. Urban Agglomerations in China. In Proceedings of the American Association of Geographers Annual Meeting, San Francisco, CA, USA, 17–21 April 2007; American Association of Geographers: Washington, DC, USA, 2007. [Google Scholar]
- Li, X.; Yeh, A.G.O. Principal Component analysis of stacked multi-temporal images for the monitoring of rapid urban expansion in the Pearl River Delta. Int. J. Remote. Sens. 1998, 19, 1501–1518. [Google Scholar] [CrossRef]
- Tian, G.; Jiang, J.; Yang, Z.; Zhang, Y. The urban growth, size distribution and spatio-temporal dynamic pattern of the Yangtze River Delta megalopolitan region, China. Ecol. Model. 2011, 222, 865–878. [Google Scholar] [CrossRef]
- Tan, M.; Li, X.; Xie, H.; Lu, C. Urban land expansion and arable land loss in China-a case study of Beijing–Tianjin–Hebei region. Land Use Policy 2005, 22, 187–196. [Google Scholar] [CrossRef]
- Salomonson, V.V.; Barnes, W.; Maymon, P.W.; Montgomery, H.E.; Ostrow, H. Modis: Advanced facility instrument for studies of the earth as a system. IEEE Trans. Geosci. Remote Sens. 1989, 27, 145–153. [Google Scholar] [CrossRef]
- Zha, Y.; Gao, J.; Ni, S. Use of normalized difference built-up index in automatically mapping urban areas from TM imagery. Int. J. Remote Sens. 2003, 24, 583–594. [Google Scholar] [CrossRef]
- Xu, H. Modification of normalized difference water index (NDWI) to enhance open water features in remotely sensed imagery. Int. J. Remote Sens. 2006, 27, 3025–3033. [Google Scholar] [CrossRef]
- Hu, Y.; Liu, L.; Liu, L.; Peng, D.; Jiao, Q.; Zhang, H. A Landsat-5 atmospheric correction based on MOSDIS atmosphere products and 6s model. IEEE J. Sel. Top. Appl. Earth Obs. Remote Sens. 2014, 7, 1609–1615. [Google Scholar] [CrossRef]
- Holland, J.H. Genetic algorithms. Sci. Am. 1992, 267, 66–72. [Google Scholar] [CrossRef]
- Otsu, N. A threshold selection method from gray-level histograms. IEEE Trans. Syst. Man Cybern. 1979, 9, 62–66. [Google Scholar] [CrossRef]
- Chipperfield, A.; Fleming, P. The matlab genetic algorithm toolbox. In Proceedings of the IEE Colloquium on Applied Control Techniques Using MATLAB, Londoon, UK, 26 January 1995. [Google Scholar]
- Wang, S.; Ma, H.; Zhao, Y. Exploring the relationship between urbanization and the eco-environment-a case study of Beijing-Tianjin-Hebei region. Ecol. Indic. 2014, 45, 171–183. [Google Scholar] [CrossRef]
Figure 1.
Study area and data: (a) VIIRS DNB (b) MODIS NDVI and (c) MODIS NDBI in YRD, CC, CZT, BTH, and PRD in 2015. Yangtze River Delta (YRD), Chengdu-Chongqing (CC), Changsha-Zhuzhou-Xiangtan (CZX), Beijing-Tianjin-Hebei Region (BTH) and Pearl River Delta (PRD).
Figure 1.
Study area and data: (a) VIIRS DNB (b) MODIS NDVI and (c) MODIS NDBI in YRD, CC, CZT, BTH, and PRD in 2015. Yangtze River Delta (YRD), Chengdu-Chongqing (CC), Changsha-Zhuzhou-Xiangtan (CZX), Beijing-Tianjin-Hebei Region (BTH) and Pearl River Delta (PRD).

Figure 2.
Flowchart of Genetic Algorithm-based urban cluster automatic threshold (GA-UCAT), (c) is the whole process of GA-UCAT, (b) is the process of modified GA and (a) represents the calculating process of fitness function, which means that (a) is important part of (b) while (b) is part of (c). Terms and their labels shown in this graph are explained later in the text.

Figure 3.
The results of using VIIRS DNB (a), NDVI (b), NDBI (c) separately and combination of all three data sources in GA-UCAT (d) are compared with the validation data—the Landsat 8 OLI false color image (e) and classification result (f) in Pearl River Delta in 2015.
Figure 3.
The results of using VIIRS DNB (a), NDVI (b), NDBI (c) separately and combination of all three data sources in GA-UCAT (d) are compared with the validation data—the Landsat 8 OLI false color image (e) and classification result (f) in Pearl River Delta in 2015.

Figure 4.
Horizontal transects of 2015 MODIS false color image from the city of Beijing. The purple represents urban areas and green represents vegetation areas (a) and pixel value of VIIRS DNB (b), NDVI (c) and NDBI (d) according to the transect. Note that data in this figure are all normalized into the same range for visualizing and the horizontal axis represent the image value of the image.

Figure 5.
The between-class variance (F), inter-class variance (T) and segmentation function (S) of VIIRS DNB, NDVI, and NDBI in the situations of using them separately (part a) or together (part b). All these terms have been explained in methodology. The labels of the x-axis represent normalized DN of data and labels of the y-axis represent the normalized function value. Note that data in this figure are all normalized into the same range for visualizing and the horizontal axis represents values of F, T, and S.

Figure 6.
The comparison between GA-UCAT results and MCD12Q1 product. Their original data sources are also shown in this graph. VIIRS DNB, MOD09A1, MODIS NDVI, results of GA-UCAT and MCD12Q1 images in the chosen city clusters in the year of 2012. MOD09A1 represents a false color of MODIS reflectance data. The label “GA-UCAT” represents the results of the proposed method and MCD12Q1 represents IGBP classification results from MODIS data. Yangtze River Delta (YRD), Chengdu-Chongqing (CC), Changsha-Zhuzhou-Xiangtan (CZX), Beijing-Tianjin-Hebei Region (BTH) and Pearl River Delta (PRD).

Figure 7.
Accuracy assessments of GA-UCAT by comparing with validation data from the visualization aspect. VIIRS DNB, results of the GA-UCAT method, Landsat false color images, and Landsat 8 OLI supervised Maximum Likelihood Classification (MLC) results in (a) Shanghai, (b) Changsha, (c) Beijing and (d) Guangzhou in 2015. Note that just one city in every cluster was selected in the accuracy assessments of this proposed method.

Figure 8.
Part A shows Landsat 8 OLI false color image in Beijing and its surroundings (a1) and their horizontal spectrum in non-urban areas (a2), urban core area (a3), and rural residential areas (a4) respectively. Part B shows VIIRS DNB images (b1) on the same location as Part A and their difference of DN value in non-urban areas (b2), urban core area (b3) and rural residential areas (b4) respectively.

Figure 9.
Part A is Landsat 8 OLI in Beijing and its surround (a1), (a2) is local zoom-in of the rectangle in (a1) and (a3) is the result of classification. The (b1) is VIIRS DNB, (b2) is local zoom-in of the rectangle, and (b3) is the result of the GA-UCAT method. The (c1) is images from Google Earth and (c2) is zoom-in of the rectangle in (c1).

Figure 10.
The urban growth in five urban clusters including YRD (a), CZX (b), BTH (c), CC (d), and PRD (e) in the year of 2012, 2015, and 2017. Yangtze River Delta (YRD), Chengdu-Chongqing (CC), Changsha-Zhuzhou-Xiangtan (CZX), Beijing-Tianjin-Hebei Region (BTH) and Pearl River Delta (PRD).
Figure 10.
The urban growth in five urban clusters including YRD (a), CZX (b), BTH (c), CC (d), and PRD (e) in the year of 2012, 2015, and 2017. Yangtze River Delta (YRD), Chengdu-Chongqing (CC), Changsha-Zhuzhou-Xiangtan (CZX), Beijing-Tianjin-Hebei Region (BTH) and Pearl River Delta (PRD).

Figure 11.
Urban areas change from 2012 to 2017 in five typical Chinese urban clusters. The histogram in this figure represents the area of urban extents. The line chart shows urban rate changes from 2012 to 2017. The left axis represents the quantity of urbanization while the right axis represents the urban rate. Yangtze River Delta (YRD), Chengdu-Chongqing (CC), Changsha-Zhuzhou-Xiangtan (CZX), Beijing-Tianjin-Hebei Region (BTH) and Pearl River Delta (PRD).


Table 1.
The quantitative evaluation of the GA-UCAT method in selected cities. GA-UCAT represents the results of this proposed method and L8 MLC represents that the validation data are the results of Maximum Likelihood Classification of Landsat 8 OLI.
Table 1.
The quantitative evaluation of the GA-UCAT method in selected cities. GA-UCAT represents the results of this proposed method and L8 MLC represents that the validation data are the results of Maximum Likelihood Classification of Landsat 8 OLI.
| City | GA-UCAT (km2) | L8 MLC (km2) | OA | Kappa | ||
|---|---|---|---|---|---|---|
| Urban Area | Non-Urban Area | Urban Area | Non-Urban Area | |||
| Shanghai | 3040.29 | 3299.71 | 2921.40 | 3418.60 | 0.861 | 0.722 |
| Changsha | 744.50 | 11,074.50 | 783.90 | 11,035.10 | 0.854 | 0.699 |
| Beijing | 2998.23 | 13,411.77 | 3314.74 | 13,095.26 | 0.913 | 0.701 |
| Guangzhou | 1534.75 | 1628.68 | 1443.13 | 1523.73 | 0.906 | 0.708 |
Data missing in Chengdu due to contamination of clouds.
Table 2.
The urbanization growth from 2012 to 2017 in five urban clusters.
| Cities | Urban Area (km2) | Urban Rate (%) | ||||
|---|---|---|---|---|---|---|
| 2012 | 2015 | 2017 | 2012 | 2015 | 2017 | |
| YRD | 12,354.75 | 13,476.50 | 14,206.25 | 11.90 | 12.98 | 13.72 |
| CC | 6067.75 | 6421.00 | 6551.75 | 3.25 | 3.44 | 3.51 |
| CZX | 997.25 | 1072.00 | 1189.50 | 3.55 | 3.82 | 4.23 |
| BTH | 8086.00 | 8145.75 | 443.50 | 3.77 | 3.80 | 3.94 |
| PRD | 5994.00 | 7344.25 | 7551.25 | 14.38 | 17.61 | 18.11 |
Yangtze River Delta (YRD), Chengdu-Chongqing (CC), Changsha-Zhuzhou-Xiangtan (CZX), Beijing-Tianjin-Hebei Region (BTH) and Pearl River Delta (PRD).
© 2018 by the authors. Licensee MDPI, Basel, Switzerland. This article is an open access article distributed under the terms and conditions of the Creative Commons Attribution (CC BY) license (http://creativecommons.org/licenses/by/4.0/).
Share and Cite
MDPI and ACS Style
Li, K.; Chen, Y. A Genetic Algorithm-Based Urban Cluster Automatic Threshold Method by Combining VIIRS DNB, NDVI, and NDBI to Monitor Urbanization. Remote Sens. 2018, 10, 277. https://doi.org/10.3390/rs10020277
AMA Style
Li K, Chen Y. A Genetic Algorithm-Based Urban Cluster Automatic Threshold Method by Combining VIIRS DNB, NDVI, and NDBI to Monitor Urbanization. Remote Sensing. 2018; 10(2):277. https://doi.org/10.3390/rs10020277
Chicago/Turabian StyleLi, Kangning, and Yunhao Chen. 2018. "A Genetic Algorithm-Based Urban Cluster Automatic Threshold Method by Combining VIIRS DNB, NDVI, and NDBI to Monitor Urbanization" Remote Sensing 10, no. 2: 277. https://doi.org/10.3390/rs10020277
Note that from the first issue of 2016, this journal uses article numbers instead of page numbers. See further details here.