A Novel Method of Evaluating Highway Traffic Prosperity Based on Nighttime Light Remote Sensing

1
Aerospace Information Research Institute, Chinese Academy of Sciences, Beijing 100049, China
2
Aerospace Information Research Institute, University of Chinese Academy of Sciences, Beijing 100049, China
*
Author to whom correspondence should be addressed.
Remote Sens. 2020, 12(1), 102; https://doi.org/10.3390/rs12010102
Submission received: 24 October 2019
/
Revised: 15 December 2019
/
Accepted: 23 December 2019
/
Published: 27 December 2019
(This article belongs to the Section Urban Remote Sensing)
Abstract
:As the backbone and arteries of a comprehensive transportation network, highways play an important role in improving people’s living standards and promoting economic growth. However, globally, there is limited quantifiable data evaluating the highway traffic state, characteristics, and performance. From the 1960s to the present, remote sensing has been regarded as the most effective technology for long-term and large-scale monitoring of surface information. However, how to reflect the dynamic “flow” information of traffic with a static remote sensing image has always been a difficult problem that is hard to solve in the field. This study aims to construct a method of evaluating highway traffic prosperity using nighttime remote sensing. First, based on nighttime light data that indicate social and economic activities, a highway-oriented method was proposed to extract highway nighttime light data from 2015 annual nighttime light data of the Suomi National Polar-Orbiting Partnership Visible Infrared Imaging Radiometer Suite sensor (SNPP-VIIRS). Subsequently, Pearson correlation analysis was used to fit the relationship between freeway traffic flow volume and freeway nighttime light at the provincial level. The results showed that Pearson Correlation Coefficient of freeway nighttime light and freeway traffic flow volume for coach and truck are 0.905 and 0.731, respectively, which are higher than between freeway traffic flow volume for coach and truck and total nighttime light (0.593 and 0.516, respectively). A new index—Highway Nighttime Traffic Prosperity Index (HNTPI)—was proposed to evaluate highway traffic across China. The results showed that HNTPI has a strong correspondence with socio-economic parameters. The Pearson Correlation Coefficient of HNTPI and gross domestic product (GDP) per capita, consumption per capita, and population are 0.772, 0.895, and 0.968, respectively. There is a huge spatial heterogeneity in China nighttime traffic, the prosperity degree of highway traffic in developed coastal areas is obviously higher than that inland. The national general highway is the most prosperous highway at night and the national general highway nighttime prosperity of Shanghai reached 22.34%. This research provides basic data for the long-term monitoring and evaluation of regional traffic operation at night and research on the correlation between regional highway construction and the economy.

1. Introduction
Traffic and transportation have always been central parts of economic development, with long-term impacts on manufacturing, tourism, logistics, and other industries [1,2]. As an important carrier of traffic and transportation, a highway is the bridge of communication between cities and the main medium of material and population flow among regions [3]. With the approach of the globalization era, a highway transportation and service system is required to meet user demand for better quality and higher efficiency [4,5]. Under such circumstances, the investigation of national highway traffic conditions is crucial to policymakers and macroeconomy researchers.
At present, the main pathway to obtain highway traffic condition data is statistical surveys. However, in the domain of traffic and transportation, there is no international statistical standard, such as the Standard Industrial Classification and the System of National Accounts, formally agreed on at the United Nations Statistical Commission (UNSC), and each country adopts its own standard to meet the local needs of societal and economic development.
For example, in the USA, each state’s Department of Transportation collects the annual average daily traffic (Annual ADT). Traffic counting is generally performed by electronic counting instruments and the resulting counts are adjusted to an estimate of average daily traffic by compensating for seasonal influence, weekly variation, and other variables. Annual ADT is necessary for presenting a statewide picture of traffic flow, evaluating traffic trends, computing accident rates, planning, and designing highways and other purposes. However, the traffic counts are only for the state highway system and it is a difficult task to search all the websites to gather necessary statistics across sectors from different departments [6].
In Japan, various kinds of governmental traffic and transportation-related statistics provided a basis for numerous analyses and research, such as a survey on the volume of freight and passenger transport. As these statistical surveys have been conducted only in metropolitan areas or certain business sectors, most of the statistical data cannot be applied to highways. In addition, respondents were asked to track their movements in the survey, which reduced the response rate and increased the frequency of non-sampling errors [4].
In the mainland of China, transportation statistical survey data mainly include the volumes of passenger and freight traffic, which are collected by the National Bureau of Statistics of China through ordinary questionnaires and sampling. Due to the limitations of traditional statistical survey methods, acquiring the traffic and transportation parameters is often characterized by large errors and a lack of spatial information. Additionally, limited electronic monitoring devices make it difficult to estimate the overall condition of highway traffic and transportation.
Various sensors, such as GPS and remote sensing, used as an effective tool, can solve such problems by tracking the movements of people or vehicle [7]. With the advantages of a low acquisition cost, wide monitoring range, and strong data continuity, remote sensing has a wide range of applications in many different fields [8,9]. As opposed to daytime remote sensing, which is normally limited to physical characteristics of land cover, nocturnal remote sensing detects the anthropogenic lighting present at the earth’s surface and provides a unique and direct perspective on human social activities [10]. Thus, it has been widely used for spatial data mining in socio-economic domains. Through decades of development of nighttime light remote sensing technology, nighttime light remote sensing applications have extended to numerous scientific study domains such as econometrics, poverty estimation, light pollution, fisheries and armed conflicts [11,12,13,14]. Recently, new studies have attempted using finer spatial resolution nighttime imagery, visible infrared imaging radiometer suite day/night band (VIIRS-DNB), to monitor spatial land surface information and estimate socio-economic factors [15,16]. It has been proven that VIIRS-DNB is much better than DMSP-Operational Line Scanner (OLS) [17,18,19], providing a probability for studies in the field of highway traffic. In fact, the nighttime light data sources have some favorable characteristics, such as free access and global daily coverage in each 24 h period. All these features solved the problems and deficiencies in traditional methods of traffic condition surveys and provide a good chance for studying highway traffic and transportation at the country level. However, there is no published research about highway traffic using nighttime light remote sensing.
The aim of this study was to estimate highway nighttime traffic prosperity by remote sensing. We developed a highway-oriented method to extract highway nighttime traffic flow brightness, extracted the highway light radiance in different highway grades from 2015 NPP-VIIRS night light images based on the highway-oriented method and then generated a dataset of highway nighttime light images for traffic prosperity analysis. The Highway Nighttime Traffic Prosperity Index (HNTPI) was put forward to characterize the condition of the major highways at night, solving geographical limitations existing in the traditional statistical methods to accurately reflect the characteristics of the highway network operation at the national scale.
2. Study Area and Data
2.1. Study Area
This paper takes Mainland China as the case study (Hong Kong, Macao, and Taiwan are excluded due to lack of data). After 40 years of reform and opening-up, China’s highways have nationwide coverage with a total distance of 4.8595 million km by the end of 2018. Among highways, freeways/expressways have been growing rapidly. From 1979 to 2018, the length of freeway/expressway increased from 0 to 142,400 km. In 2018, the length of all highways grew at an annual rate of 4.49%, and the lengths of freeway/turnpike grew at a staggering annual rate of 27.38% (Data available from http://www.data.stats.gov.cn). China’s economy depends on transportation for freight, employee movement, attracting and retaining business and tourism [20]. In 2017, the Chinese government invested a record-high 2.12 trillion yuan in highway construction. Research indicated that the growth of highway mileage has promoted the development of transportation, tourism, and other related industries, while socio-economic growth has also promoted the development of highways [21].
2.2. Data
2.2.1. Highway Data
Highway refers to a main road built in accordance with state technical standards, connecting cities and towns and supervised by the departments in charge of highways. ‘The Chinese highway engineering technical standards’ (JTGb01-2014) and ‘Mark rules of highway route and number of national trunk highway’ stipulate that highways can be divided into six grades by administrative level: national highway, provincial highway, county highway, township highway, village highway, and special highway. National highway includes national freeways/expressways and general highways. According to functional classification criteria, including physical road attributes and speed limits, highways are divided into five levels: freeway, first-level highway, second-level highway, third-level highway, and fourth-level highway.
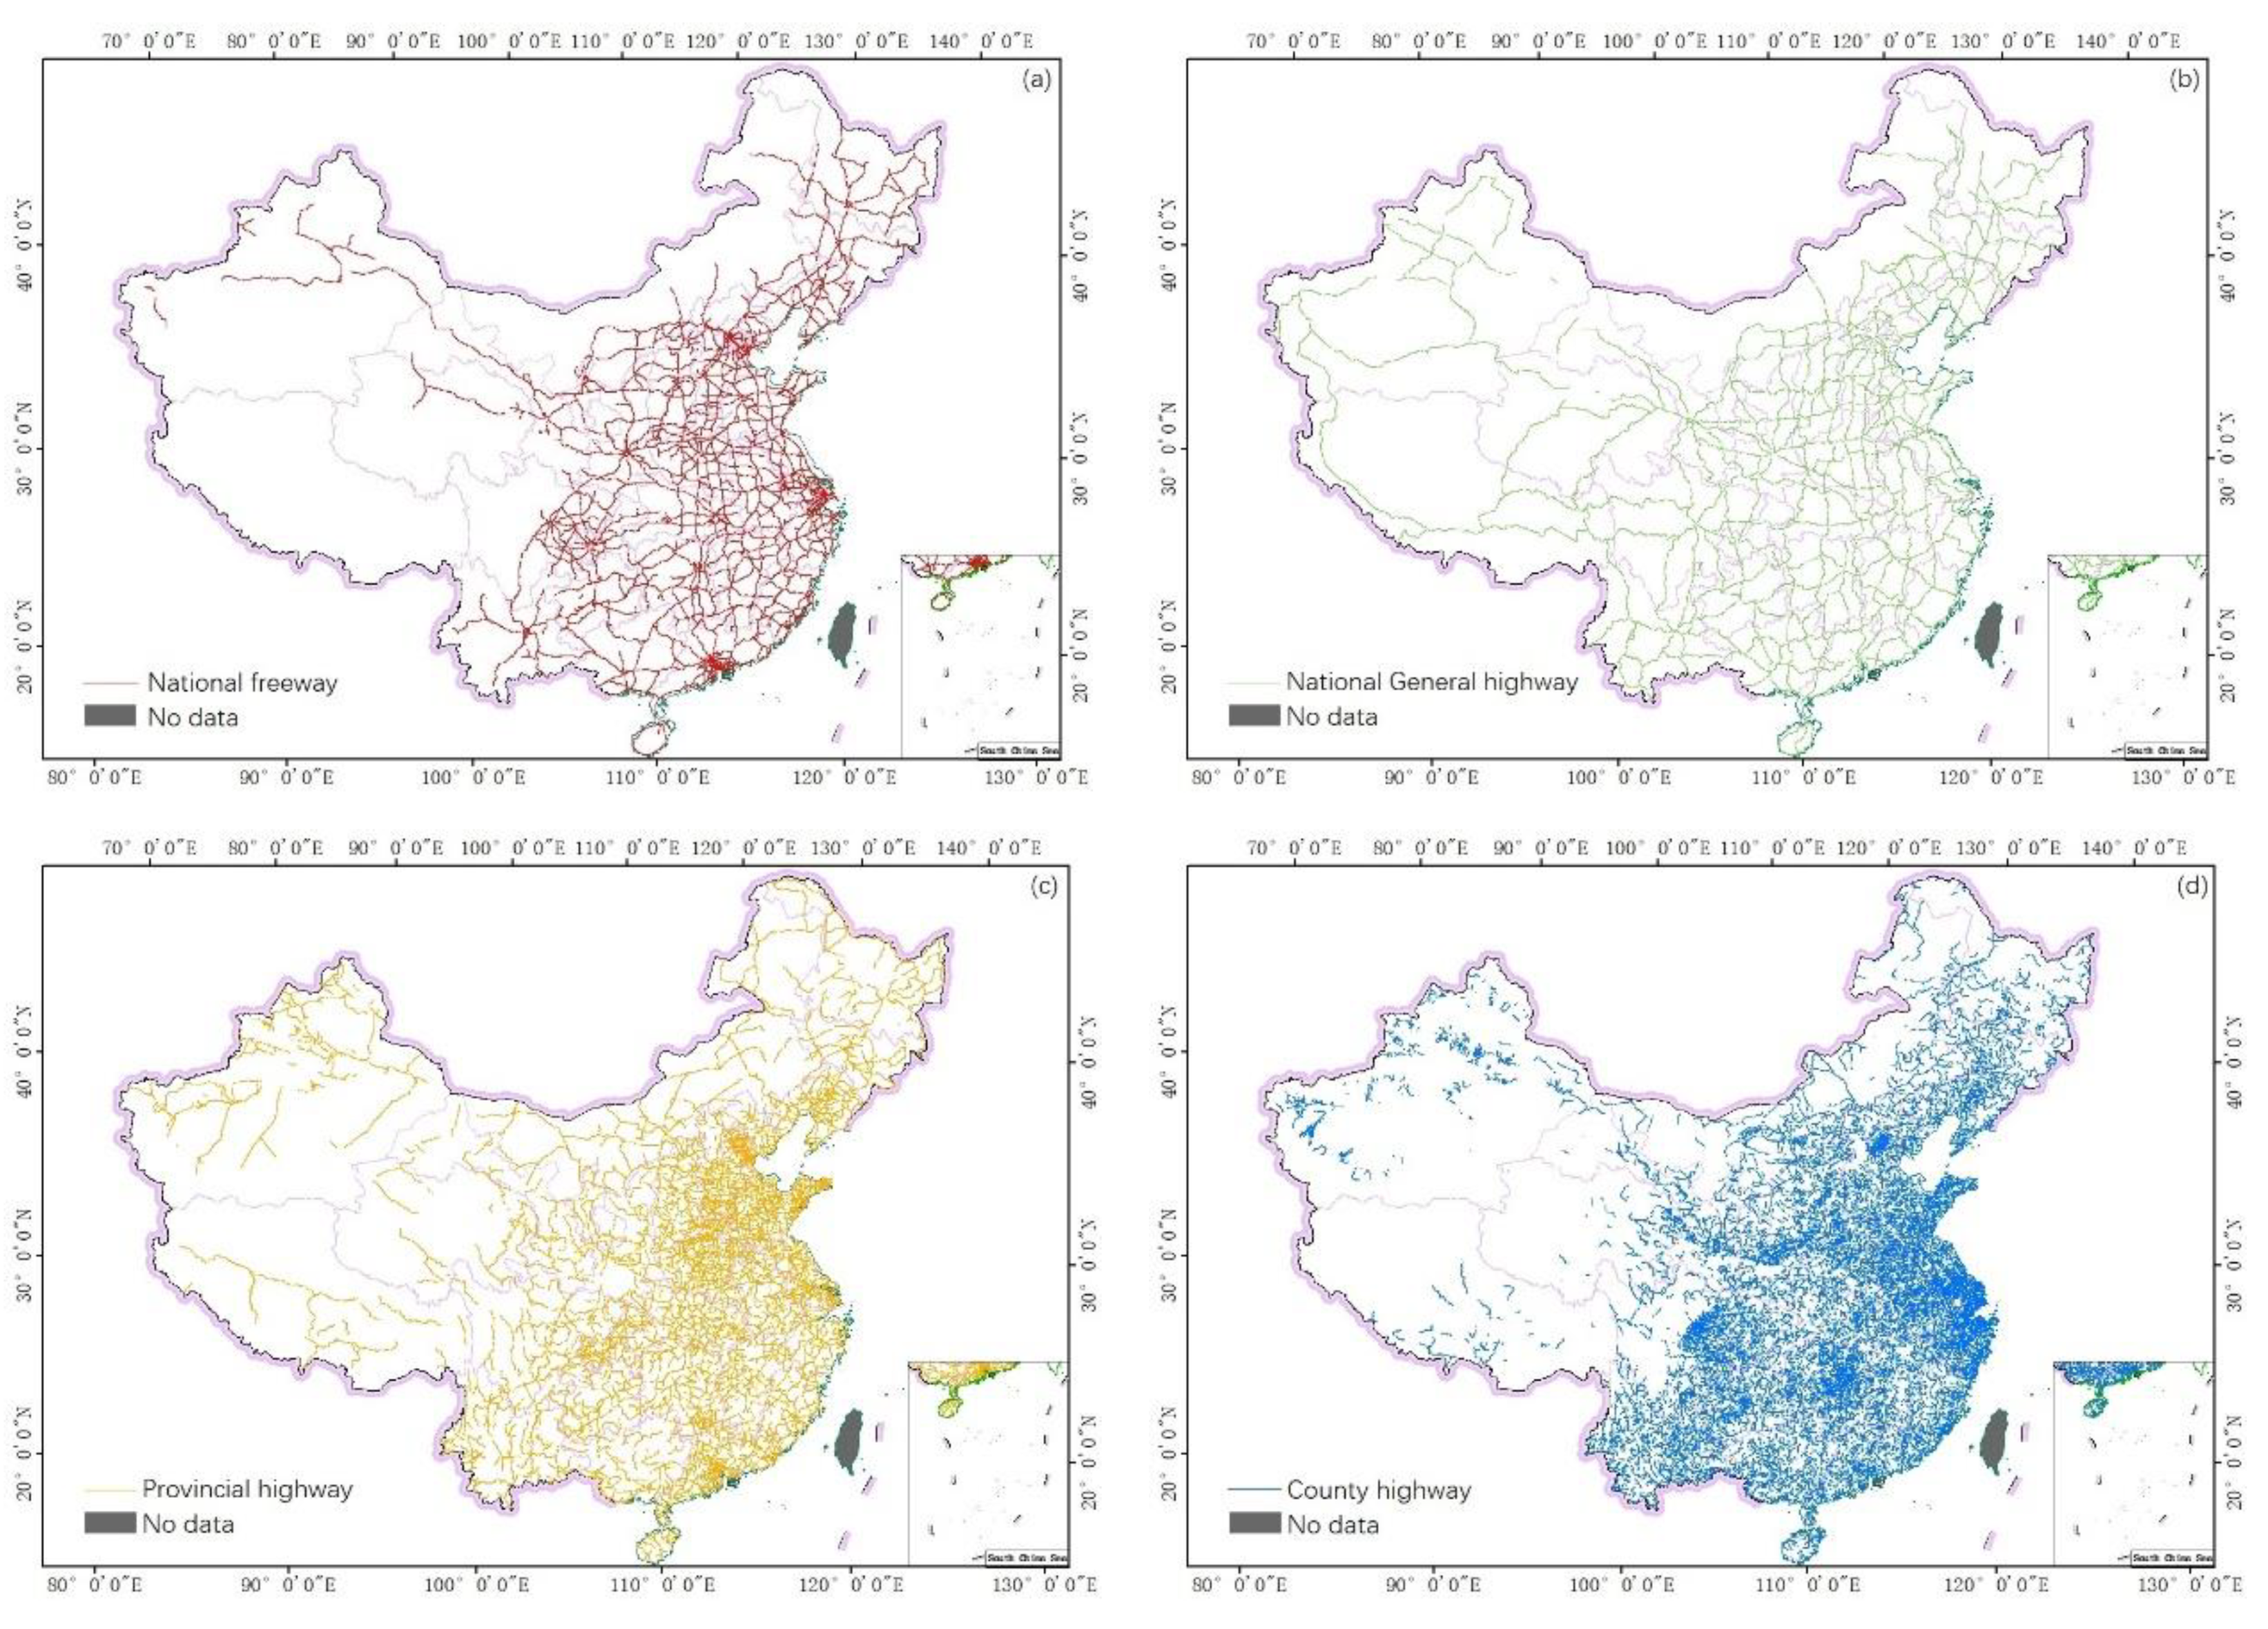
In this study, we selected the national freeway/expressway (NF), national general highway (NG), provincial highway (PH) and county highway (CH) grades, which are the main infrastructure for national transportation (Figure 1), as the main research objects. National highway refers to the main trunk highways of national political and economic significance, including important international highways; national defense highways; highways connecting the capital with the capitals of provinces, autonomous regions and municipalities directly under the central government; and highways connecting major economic centers, ports and stations, commodity production bases, and strategic points. Provincial highway refers to a trunk highway with political and economic significance to the whole province and autonomous region. County highway refers to the branch line connecting and going through counties. The data used in this paper are the 2015 and 2018 China highway electronic vector map.
2.2.2. Nighttime Light Data
The Suomi NPP satellite launched on 28 October 2011 carrying the VIIRS sensor. The low-low imaging day/night band (DNB) draw its heritage from the OLS visible band sensors, which have been flown on the Defense Meteorological Satellite Program (DMSP) platforms since the 1970s. Both the DNB and OLS visible bands have a comparable broad spectral range of 0.5–0.9 μm centered at 0.7 μm and have ability to collect low-light imagery at night.
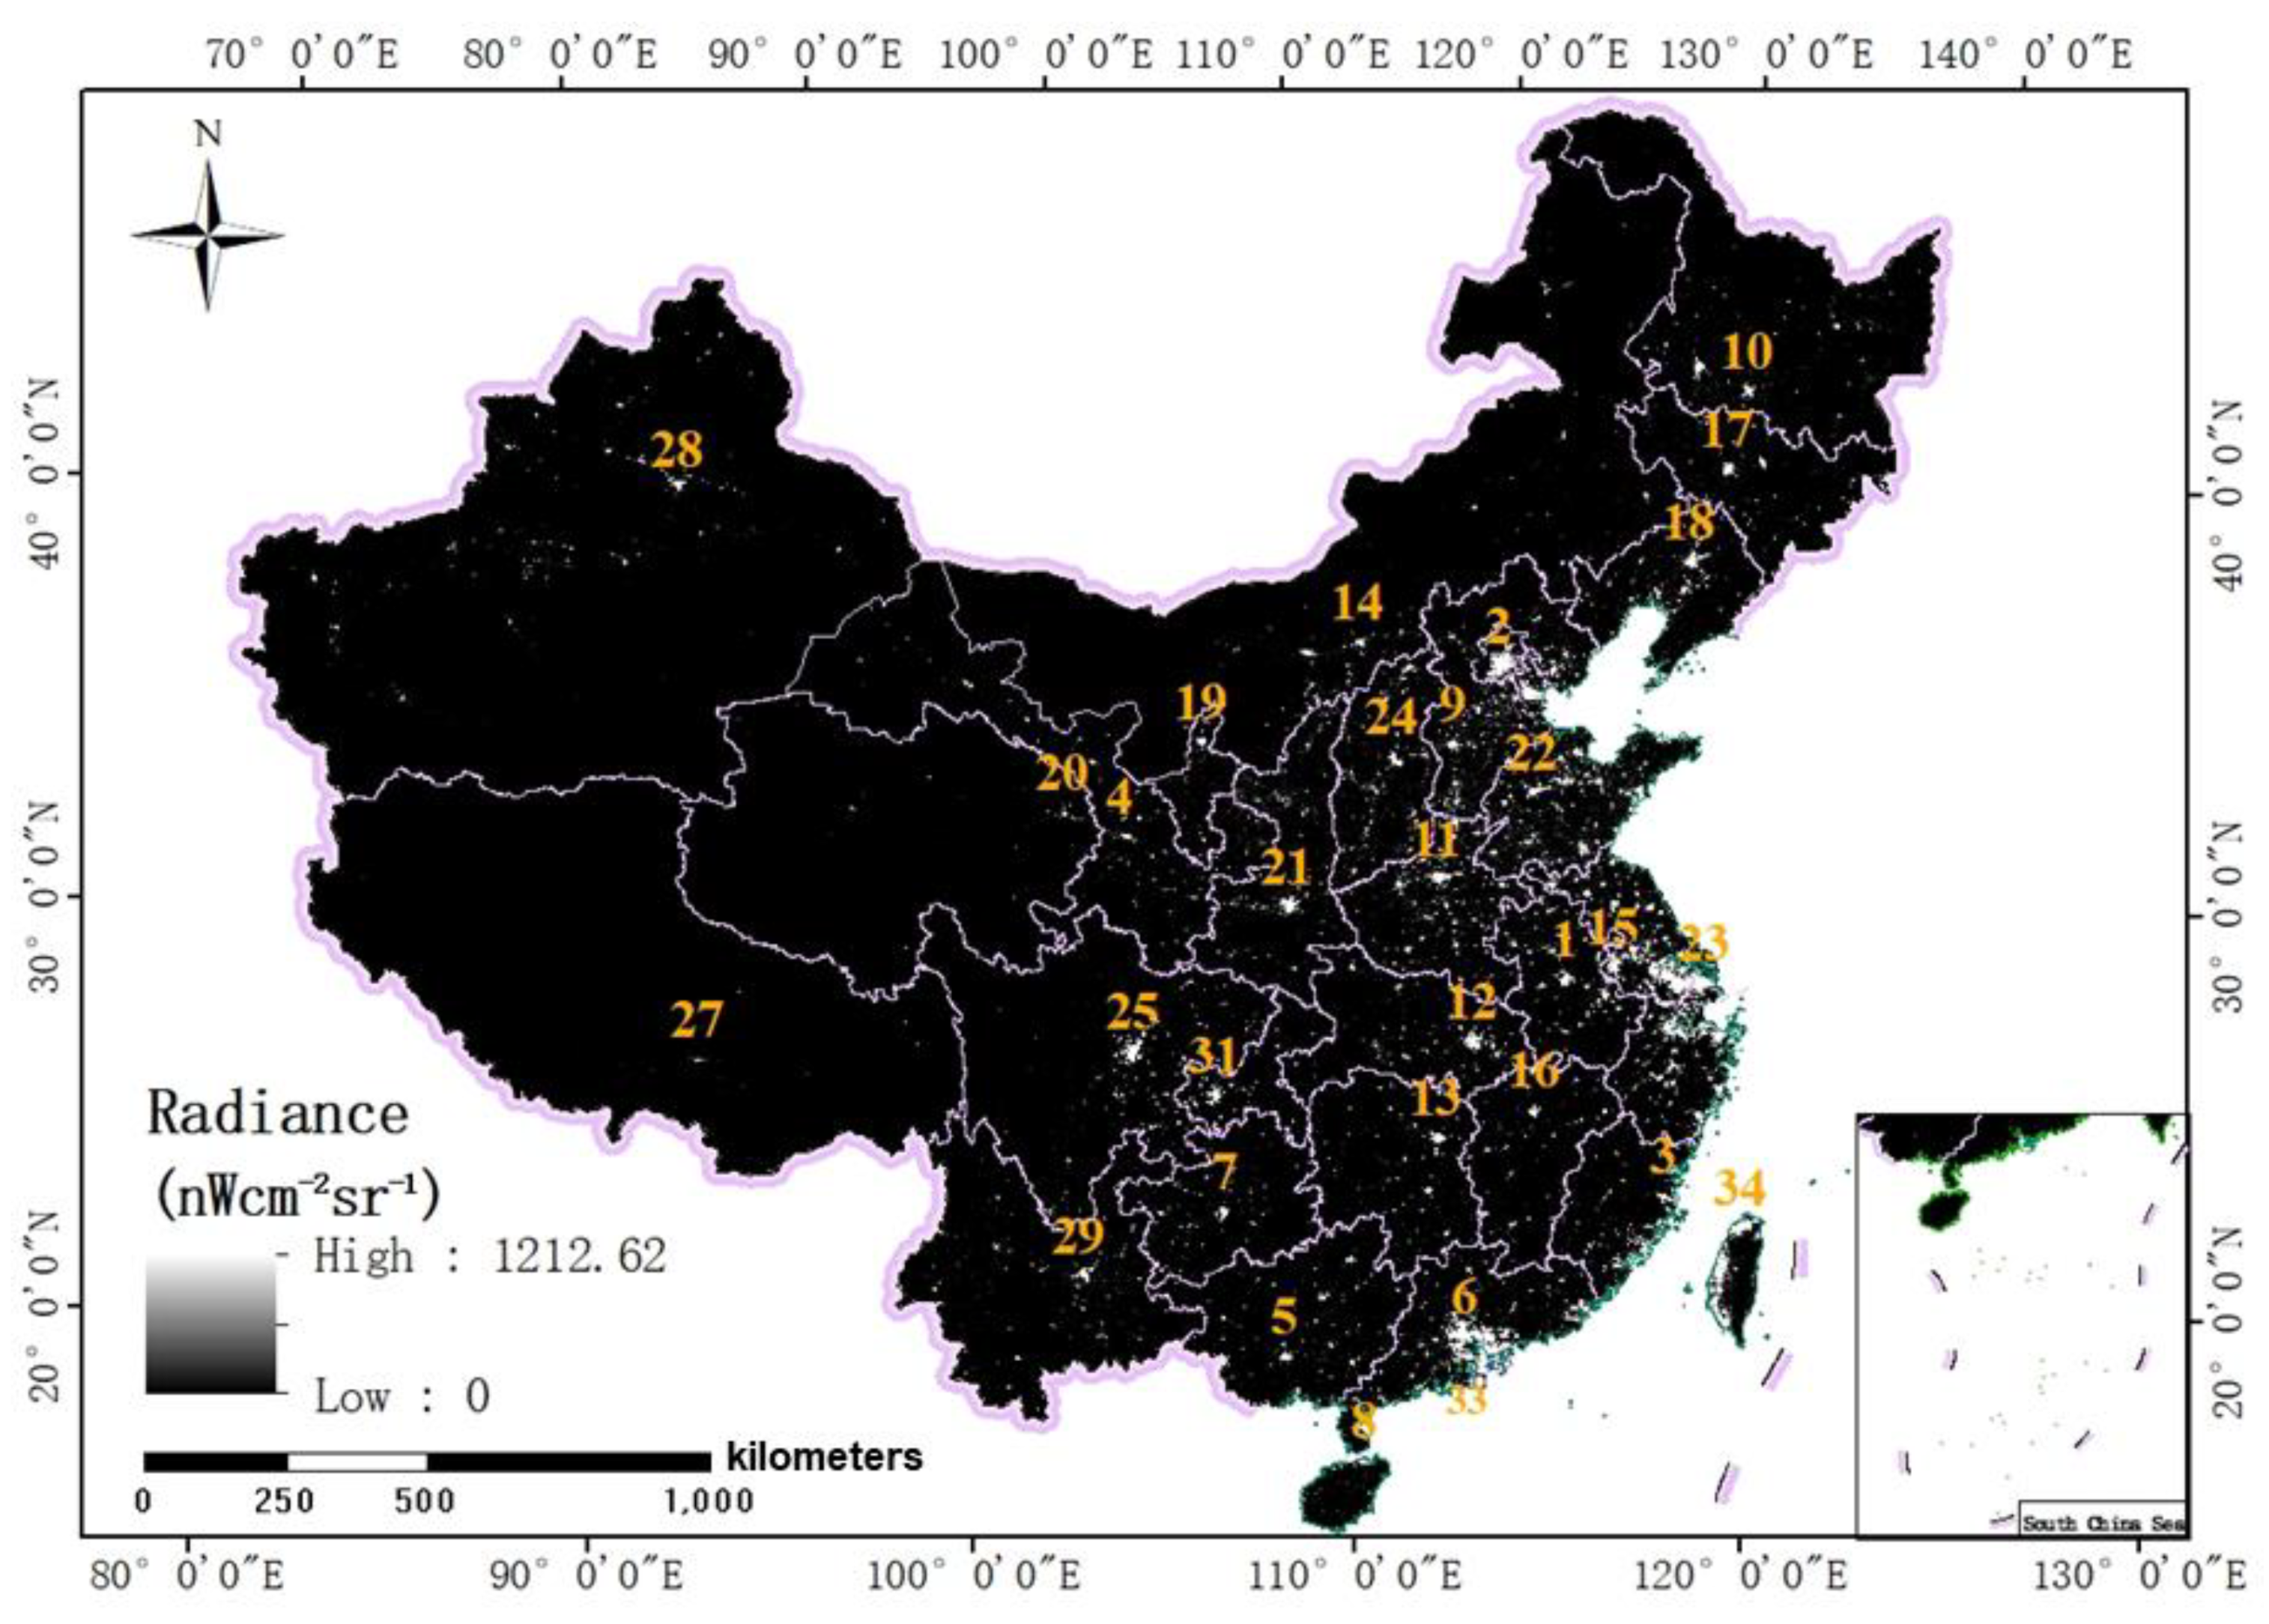
Three varieties of annual VIIRS-DNB cloud-free composites were provided by NOAA’s NCEI (National Centers for Environmental Information). VIIRS-DNB-derived annual nighttime light composite images combined only high-quality components over 2015 and 2016 and produced in geographic grids of 15 arc-seconds (about 500 m at the equator) in the WGS84 reference system. The third composite of 2015, VIIRS Cloud Mask-nighttime lights (VNL) (Figure 2), used in this study is floating-point values, the units are average radiances in nWcm−2sr−1, and background noises and all extraneous features were filtered out except for gas flaring. The VNL product indicates the locations and brightness, from human settlements, down to many bright linear roads [22]. To verify the feasibility of the highway-oriented method, we choose the 2019 NPP-VIIRS image from Jan 2019 to Jul 2019 to match the freeway traffic flow data.
A previous study showed that the construction of infrastructure has a delayed effect on the economy [23], so the December 2015 and December 2018 monthly average NPP-VIIRS nighttime light data were obtained from NOAA/NCEL website for temporal analysis.
2.2.3. Road Density
Road density was introduced to verify the feasibility of the highway-oriented method. According to the World Bank WGI (World Governance Indicators), road density refers to the ratio of the length of the country’s total road network to the country’s land area. The indicator measures the kilometers of road per 100 square kilometers of land. To ascertain the optimal resample size for the nighttime light image, the 2015 road density data at both national and provincial level were obtained from the National Bureau of Statistics of China.
2.2.4. Traffic Flow Data
The Ministry of Transport of China released the provincial monthly freeway traffic flow data for coach and truck from 2019. The passenger traffic flow is 674.39 million and freight traffic flow is 201.90 million in total. Herein, we take advantage of the coach traffic flow and truck traffic flow data from Jan 2019 to Jul 2019 to show the relationship between the highway nighttime light and traffic flow from a quantitative aspect.
2.2.5. Socio-Economic Data
The 2015 total resident population at the provincial level used in this study was obtained from public data of the national population censuses conducted in 2010. The gross domestic product (GDP) per capita and consumption per capita statistical data of 2015 at the provincial level were derived from the website of the National Bureau of statistics.
2.2.6. Auxiliary Data
To investigate the highway nighttime transportation within different administrative regions, the national, provincial and prefecture boundaries of China and county-level administrative boundary maps were acquired from the website of National Fundamental Geography Information System (NFGIS) (http://nfgis.nsdi.gov.cn/).
In addition, high-resolution images from Google Earth were selected to identify the highway nighttime light response. Table 1 lists detailed information on the datasets used in this paper.
3. Methods
3.1. Highway-Oriented Extraction Method
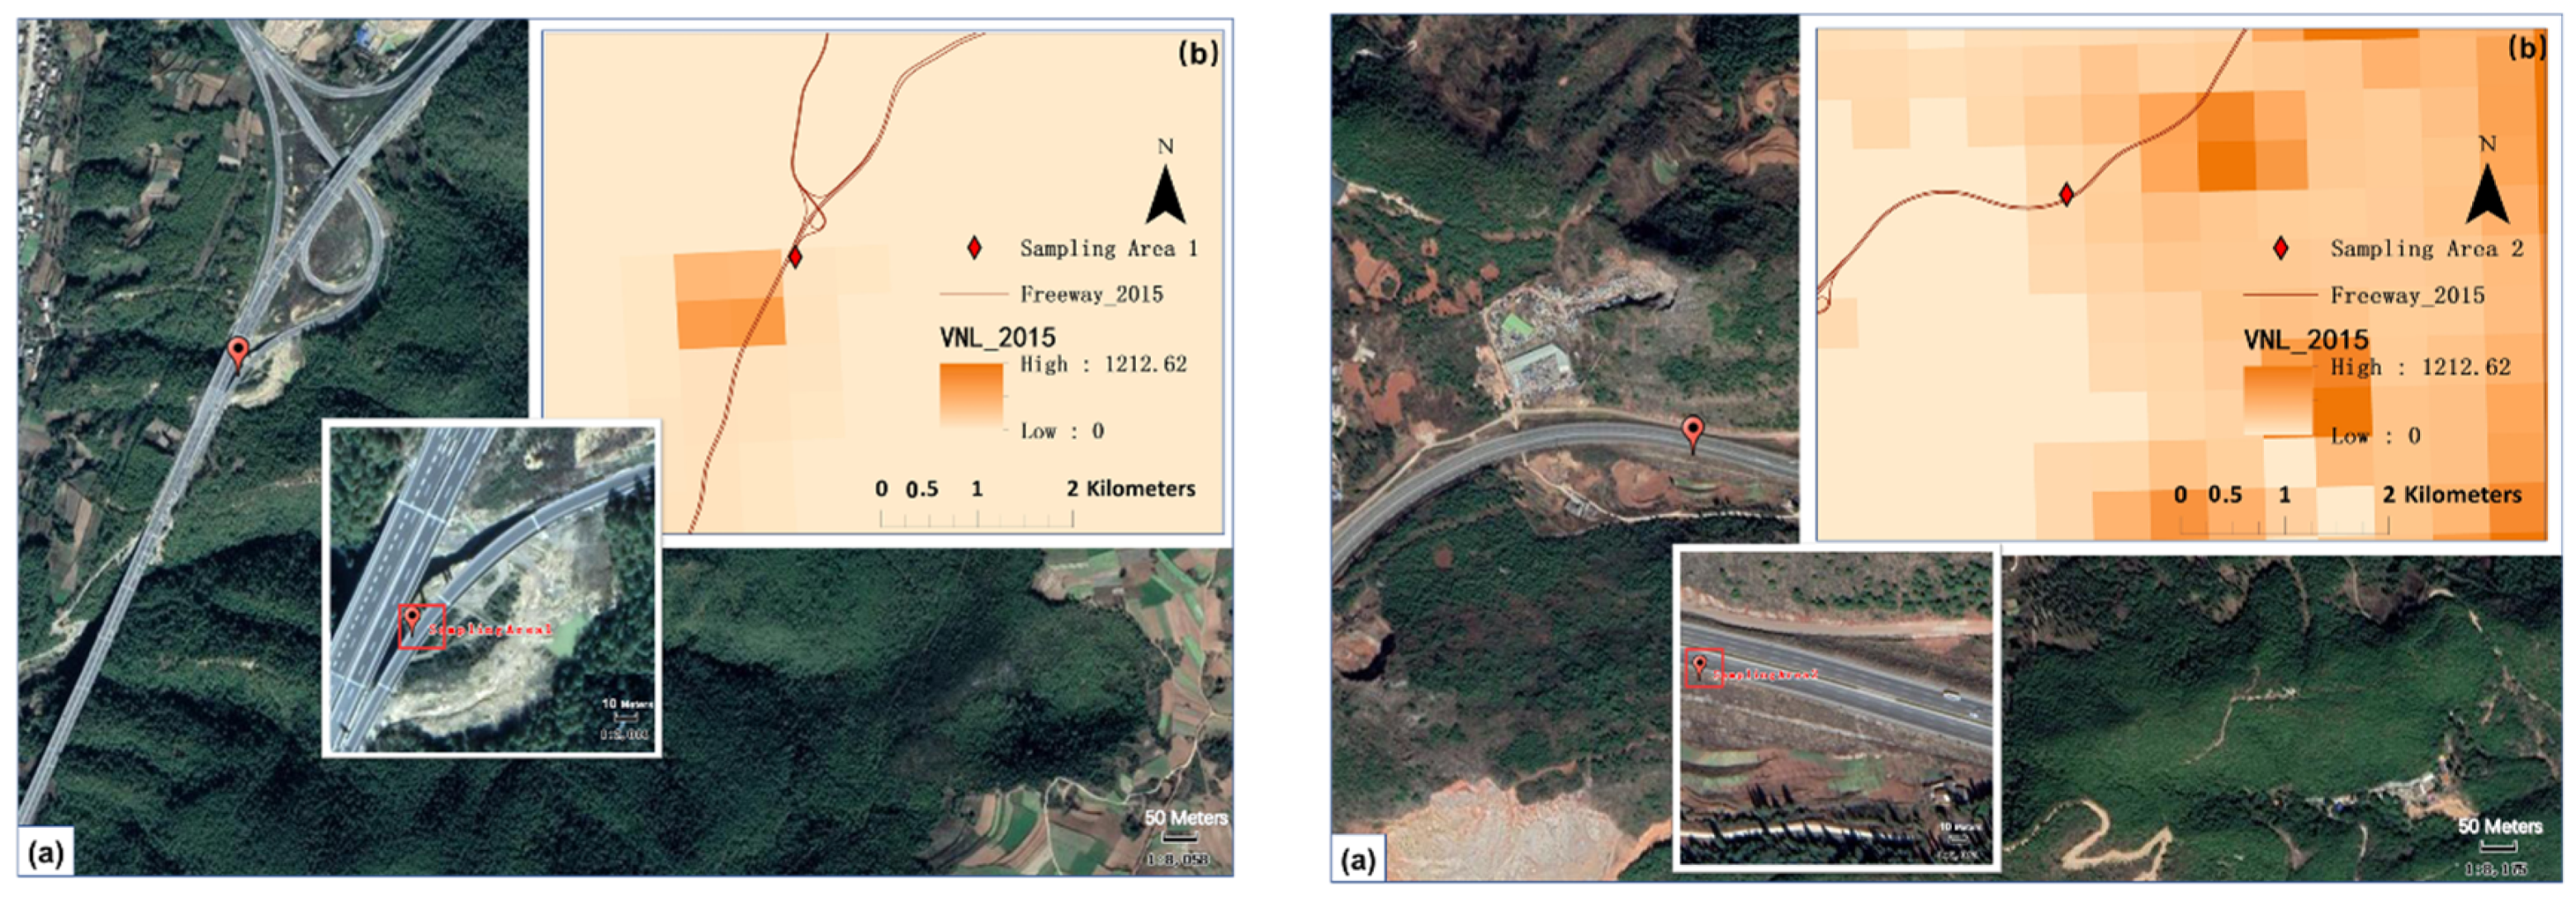
It has been known since the 1970s that low-light imaging sensors flown on satellites are capable of detecting heavily lit fishing boats at night [24]. The detection of highway traffic lights at night is similar to the detection of lit fishing boats on the dark sea. As we know, according to the traffic safety regulations, it is prohibited to install streetlights on the highways. Thus, light on the highways is entirely due to vehicle lighting. However the low resolution and low-light imaging detection limit of DMSP makes it difficult to extract highway lights accurately [25]. With the development of new technologies, VNL nighttime light images provided by NOAA’s NCEI are a huge leap forward in capability from the DMSP-OLS, with global data at 500 m spatial resolution [14,26,27]. The VIIRS-DNB detection limit is 2 × 10⁻¹⁰ Wcm−2sr−1, which is substantially lower than the DMSP-OLS. Studies have proven that the lower detection limits of VIIRS-DNB enable the detection from human settlements down to dimmer lighting, such as bright linear roads [28,29]. Although the 500 m resolution of VIIRS-DNB is still low for highway research and mixed pixels remain, highway construction sites are generally located in grasslands or terrestrial barren land far from residential fields. Furthermore, the overpass time of the NPP satellite is about 1:30 a.m. when the daily routines are basically ended. Figure 3 demonstrates the response of VNL-15 arc-seconds resolution product to the lights emitted by vehicles travelling on highways at night. Two sampling areas, bounded by red rectangles, were randomly picked from the Google map (Figure 3a). The area of the red rectangles is 500 m2, close to the size of the corresponding pixel in a VNL image (Figure 3b). From the Google image, we can find that highways are far from human habitation and the land cover are forest, bare land, and other lands without fixed light sources. Therefore, the pixel value of the VNL image must be the brightness emitted by highway vehicle lighting. It was fully proven that a VNL image has a good response to highway vehicle lights.
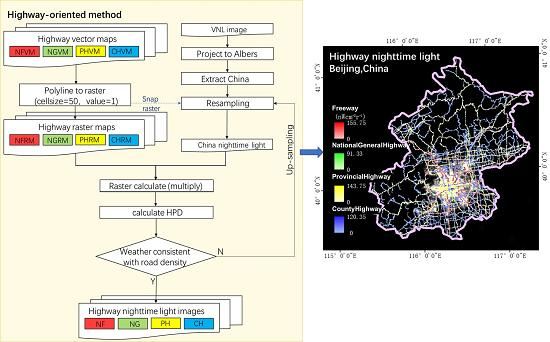
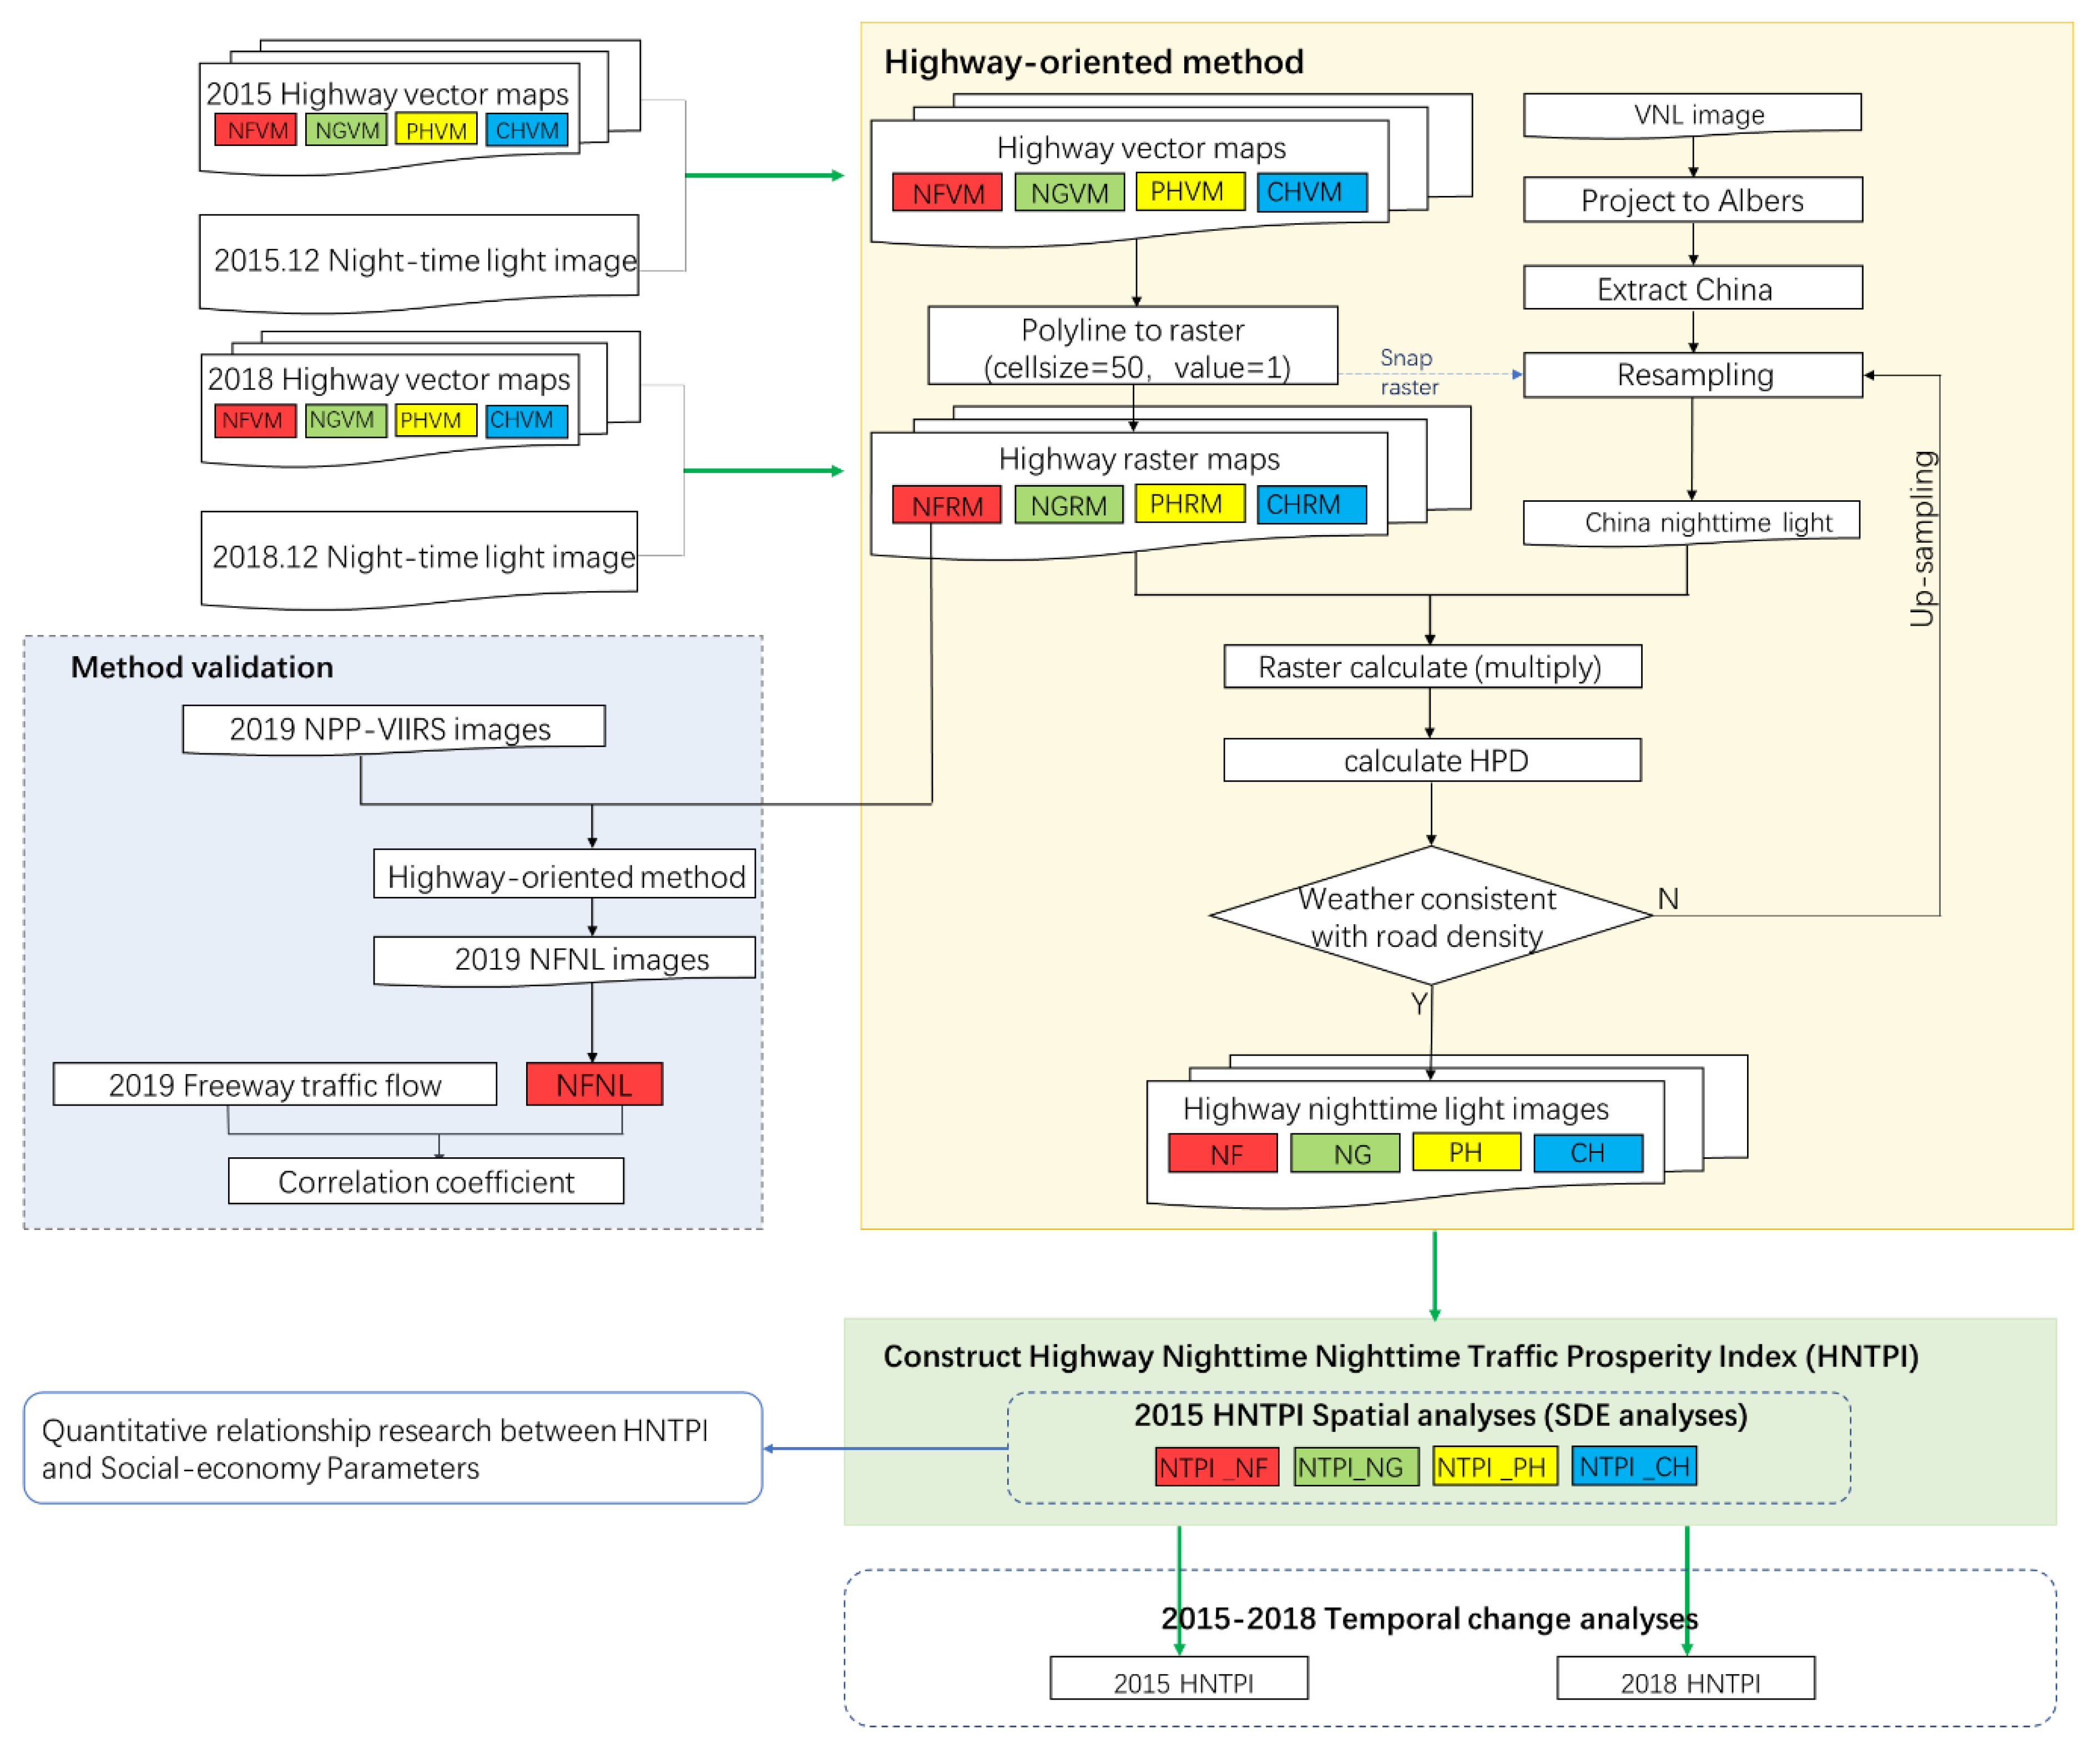
The method used in this paper is divided into three parts, the overall frame diagram of this research is shown in Figure 4.
3.1.1. Highway Nighttime Light Extraction
The highway lit pixel values from NPP-VIIRS images were considered to be the radiance from automotive lighting on the highway. Four processing steps and one verification were applied to the NPP-VIIRS data herein to extract the radiation value of the highway with the four grades electronic maps.
- Rasterized the electronic vector mapTaking the highway width into consideration, the national electronic vector maps of highways were converted into raster images with a 50 m resolution and the grid values were set to 1. Then the national electronic raster maps of highways were produced, which are national freeway raster map (NFRM), national general highway raster map (NGRM), provincial highway raster map (PHRM) and county highway raster map (CHRM).
- Nighttime light imagery processingTo avoid the impact of image mesh deformation and facilitate calculating the pixel area of study regions accurately, the VNL nighttime light image and administrative boundaries were converted into an Albers equal-area projection, with the central longitude set to 105°E, standard parallel to 47°N and 25°N. Then VNL images were clipped by the China boundary and resampled.
- Extract the highways nighttime lightThe national electronic raster maps obtained from step one were applied to intersect with the VNL at different spatial resolutions. The pixels with the highway grids will remain as the original value and the rest pixels will be removed. Consequently, the highway nighttime light grid images of China were generated.
- Sample size identificationTo ascertain the desired resampling resolution of nighttime light images, we proposed highway pixel densities (HPD) at different spatial resolutions to fit the road density in this study. HPD refers to the ratio of the number of the pixels from the highway nighttime light image at different spatial resolutions to the total pixel number of the corresponding region. The formula is:where denotes the number of pixels from the highway nighttime light image at a certain resolution and denotes the total number of the corresponding nighttime light image.
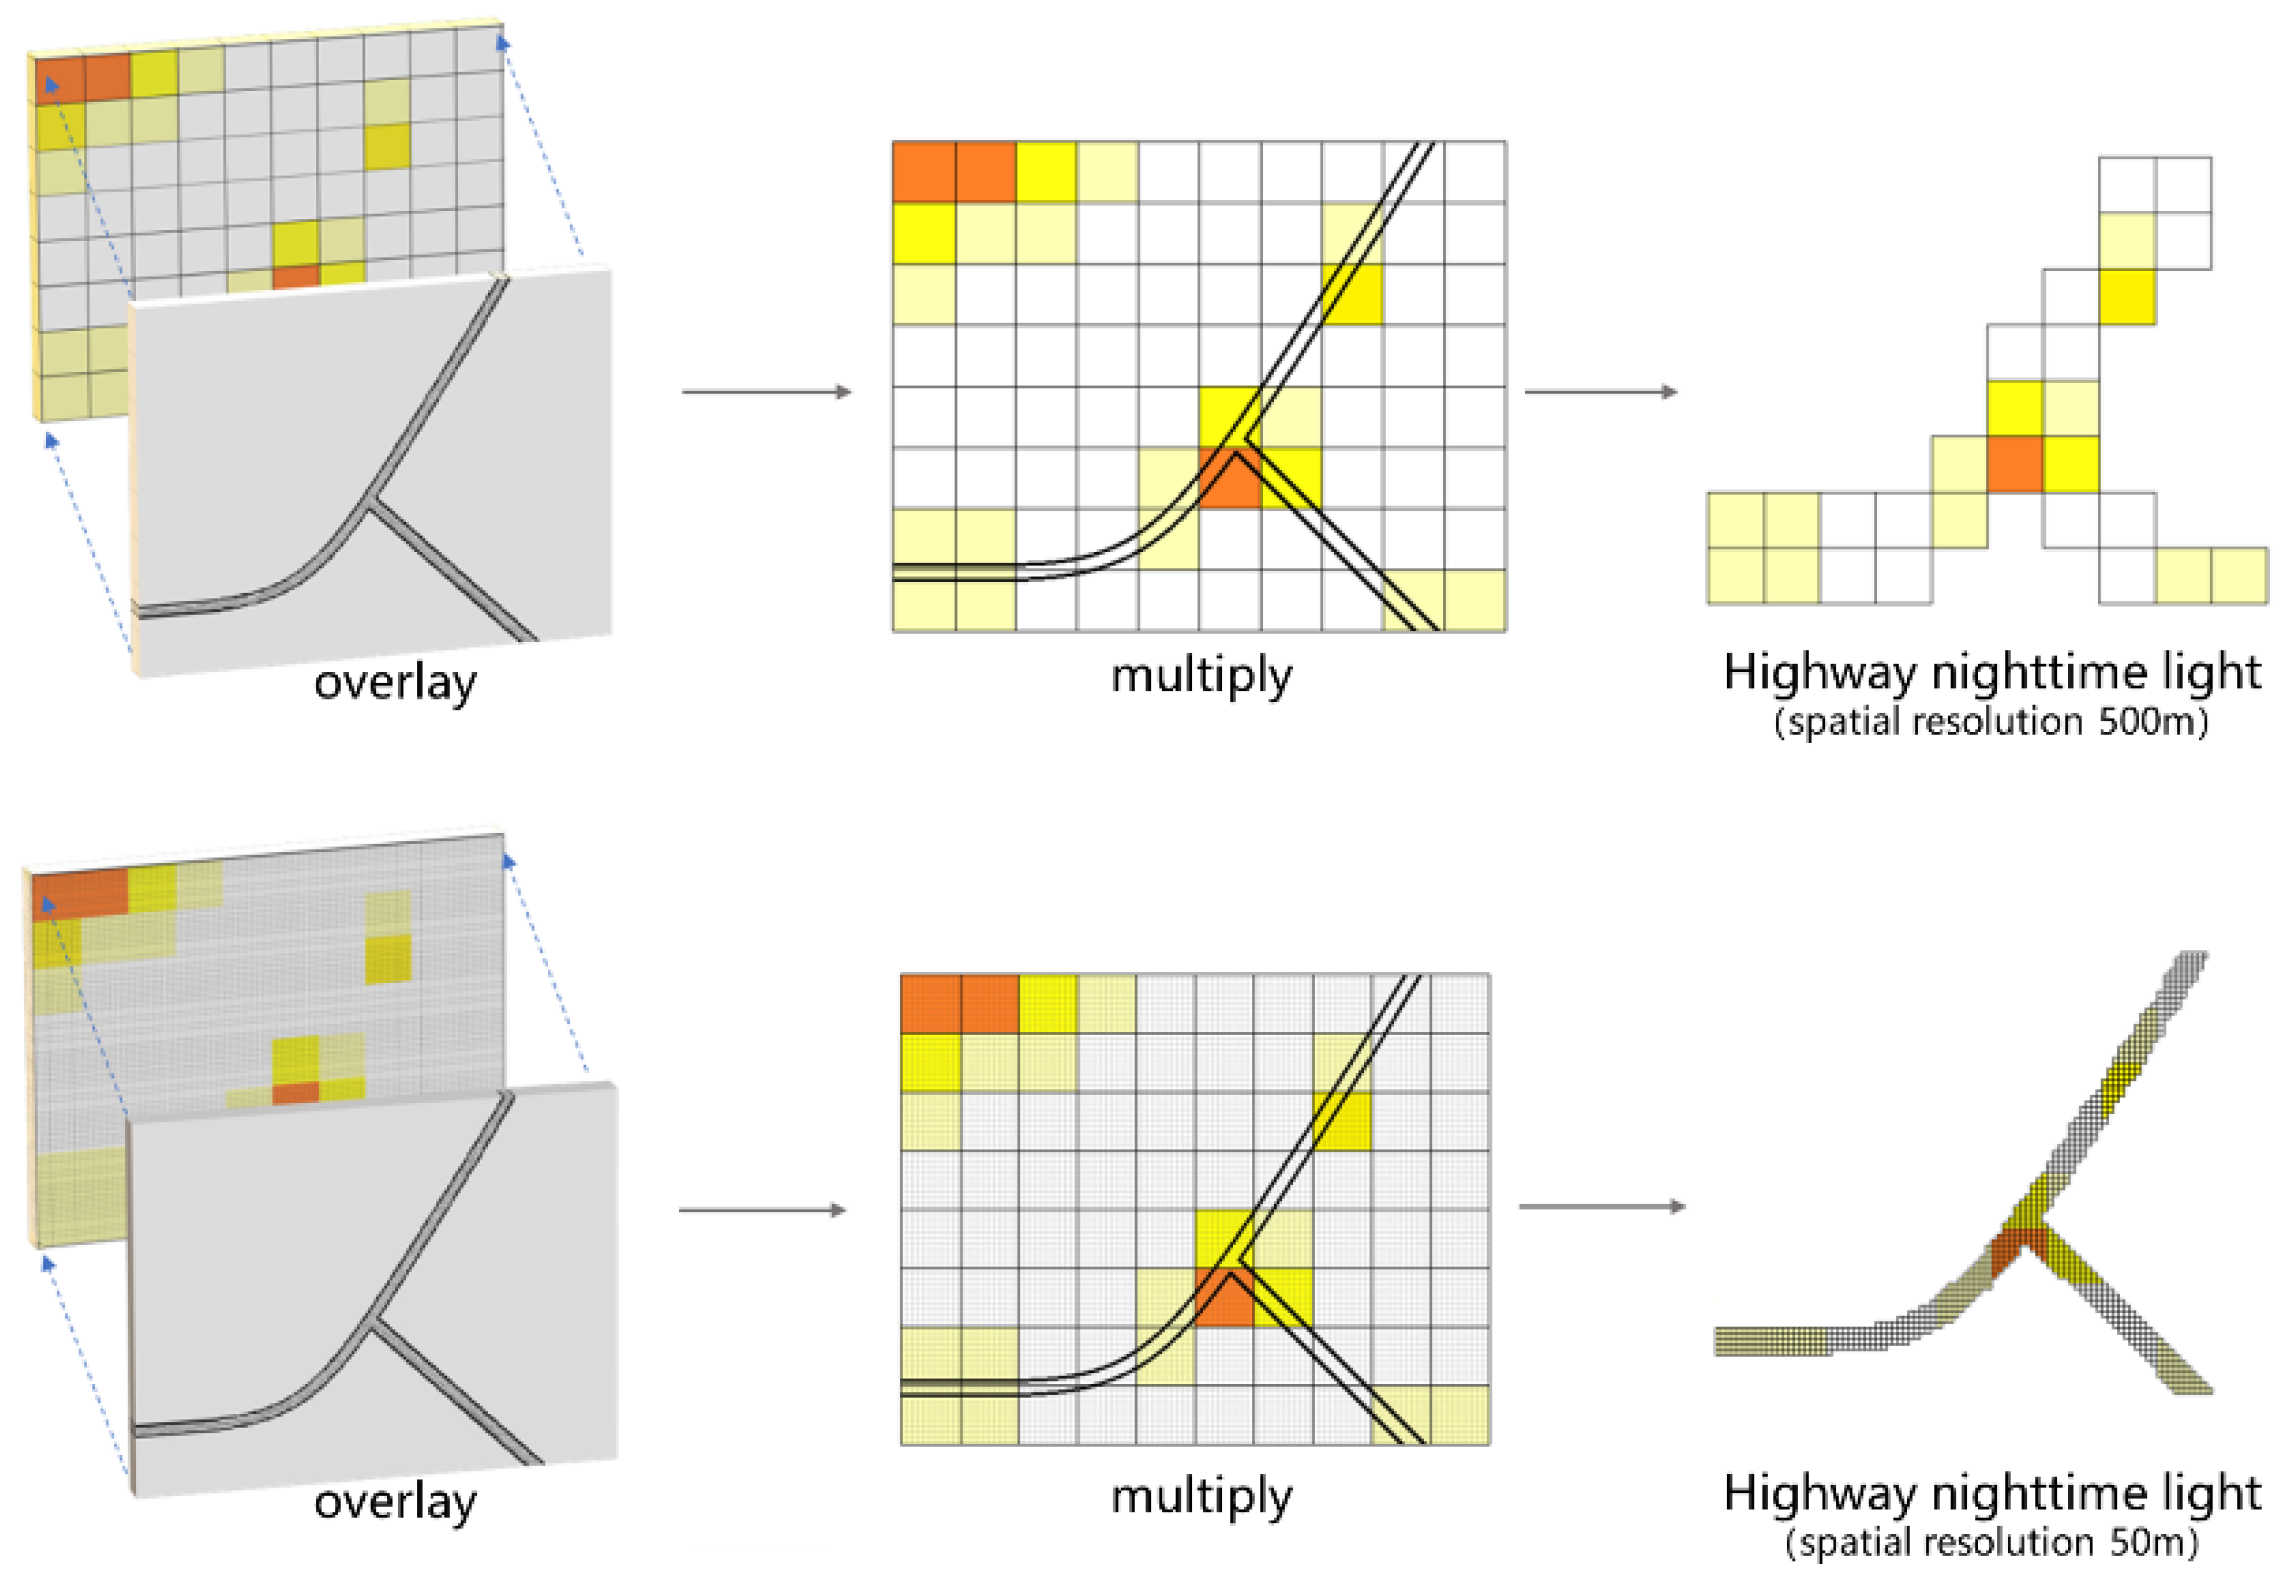
The highway pixel density at the suitable spatial resolution will correspond with the road density. The process continues by up-sampling the VNL image and extracting the highway nighttime light through the method above until the HPD corresponds to the road density. Figure 5 depicts the process of calculating highway pixel density.
3.1.2. Optimal Resampling Size
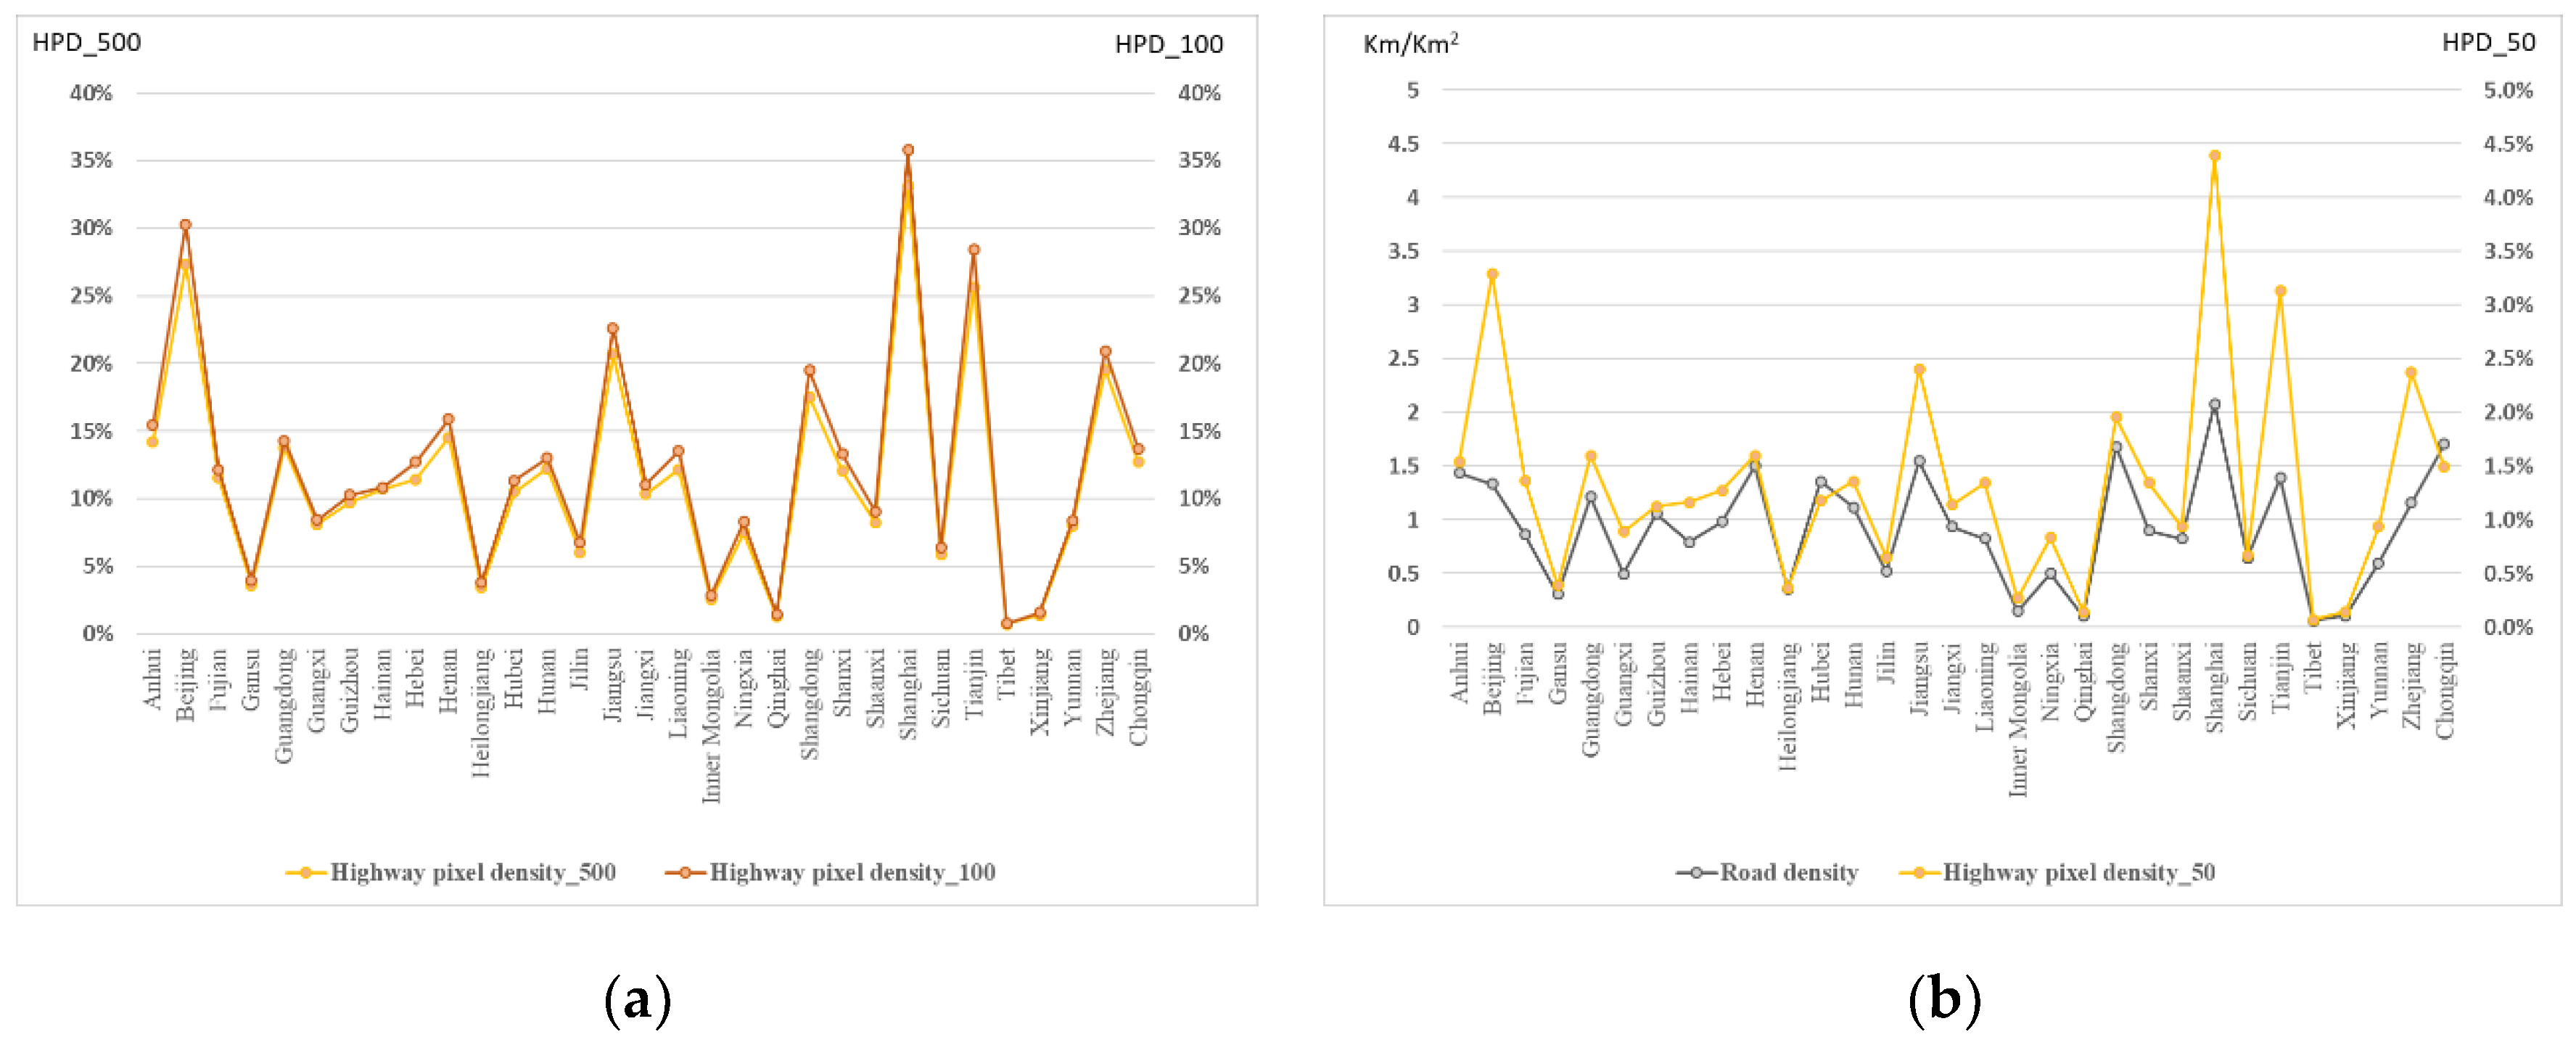
The road density was introduced to verify the optimal resampling size. The road density of China in 2015 was 0.4758 km/km2. The highway pixel density at the original spatial resolution is 5.52%. After resampling the VNL image to 100 m (HPD_100 was 6.09%) and 50 m (HPD_50 was 0.525%), HPD_50 approximated China’s road density. Figure 6 shows the HPD result at the provincial level; HPD of the original-size and HPD_100 were overflowed because the rough spatial resolution caused repetitive calculations for and the pixel number of different highway grades exceeded the real pixel number of the highway. An HPD of 50 m corresponded with the road density at province level in China, which means the 50 m spatial resolution is suitable for highway research.
Table 2 illustrates the statistics of China’s nighttime light images and highway nighttime light images at different resample sizes.
3.2. Highway Nighttime Traffic Indices
3.2.1. Highway Nighttime Lights
Total nighttime lights (TNL) represents the cumulative DN value of nighttime light pixels within an administrative region. Previous studies confirmed that there is a strong correlation between TNL and GDP, population, electric power consumption and other socio-economic parameters [30,31,32]. In this study, we extracted highway nighttime lights (HNL) from the TNL, which can reflect the traffic flow at night directly. The formula is:
where , is the th DN value of the -grade highway, denotes a national freeway and the formula represents total brightness of national freeway nighttime light (NFNL), denotes a national general highway and the formula represents the total brightness of national general highway nighttime light (NGNL), denotes a provincial highway and the formula represents the total brightness of provincial highway nighttime light (PHNL), denotes a county highway and the formula represents total brightness of county highway nighttime light (CHNL).
3.2.2. Highway Nighttime Traffic Prosperity Index
Although considerable research has been done using mean nighttime light (MNL), the lit area of NPP-VIIRS data, most analyses have been focused on human settlements and socio-economic activity [17,33], and there has not been an index that can be used to evaluate the spatial pattern of highway traffic at night. Therefore, a normalized index—the Nighttime Traffic Prosperity Index (NTPI)—was proposed in this paper to quantitatively describe the highway traffic activity. The formula is:
where , is the th DN value of the -level highway, denotes a national freeway (NTPI_NF), denotes a national general highway (NTPI_NG), denotes a provincial highway (NTPI_PH) and denotes a county highway (NTPI_CH). HNTPI represents the nighttime traffic prosperity of the four highway grades.
3.3. Spatial-Temporal Analysis Method
Standard deviation elliptic (SDE) was used as the spatial analyses method to describe the spatial pattern of the HNTPI distribution. The SDE space statistical method has served as a GIS tool for delineating the geographic distribution of features and reveal the overall spatial distribution characteristics of the geographical elements accurately [34,35]. From the perspective of global space, the SDE method based on the spatial location and spatial structure of the highway nighttime light, quantitatively explains the spatial distribution characteristics of geographical elements, such as centrality, distribution, directionality, and spatial morphology. This method is widely used in studies of topographic equilibrium distribution, economic spatial pattern analysis, urban problem and other fields [36].
Two fixed points in time, Dec 2015 and Dec 2018 NPP-VIIRS images were selected for detecting the temporal change of HNTPI.
4. Results
4.1. Highway Nighttime Light Extraction Results
4.1.1. Highway Nighttime Lightmaps
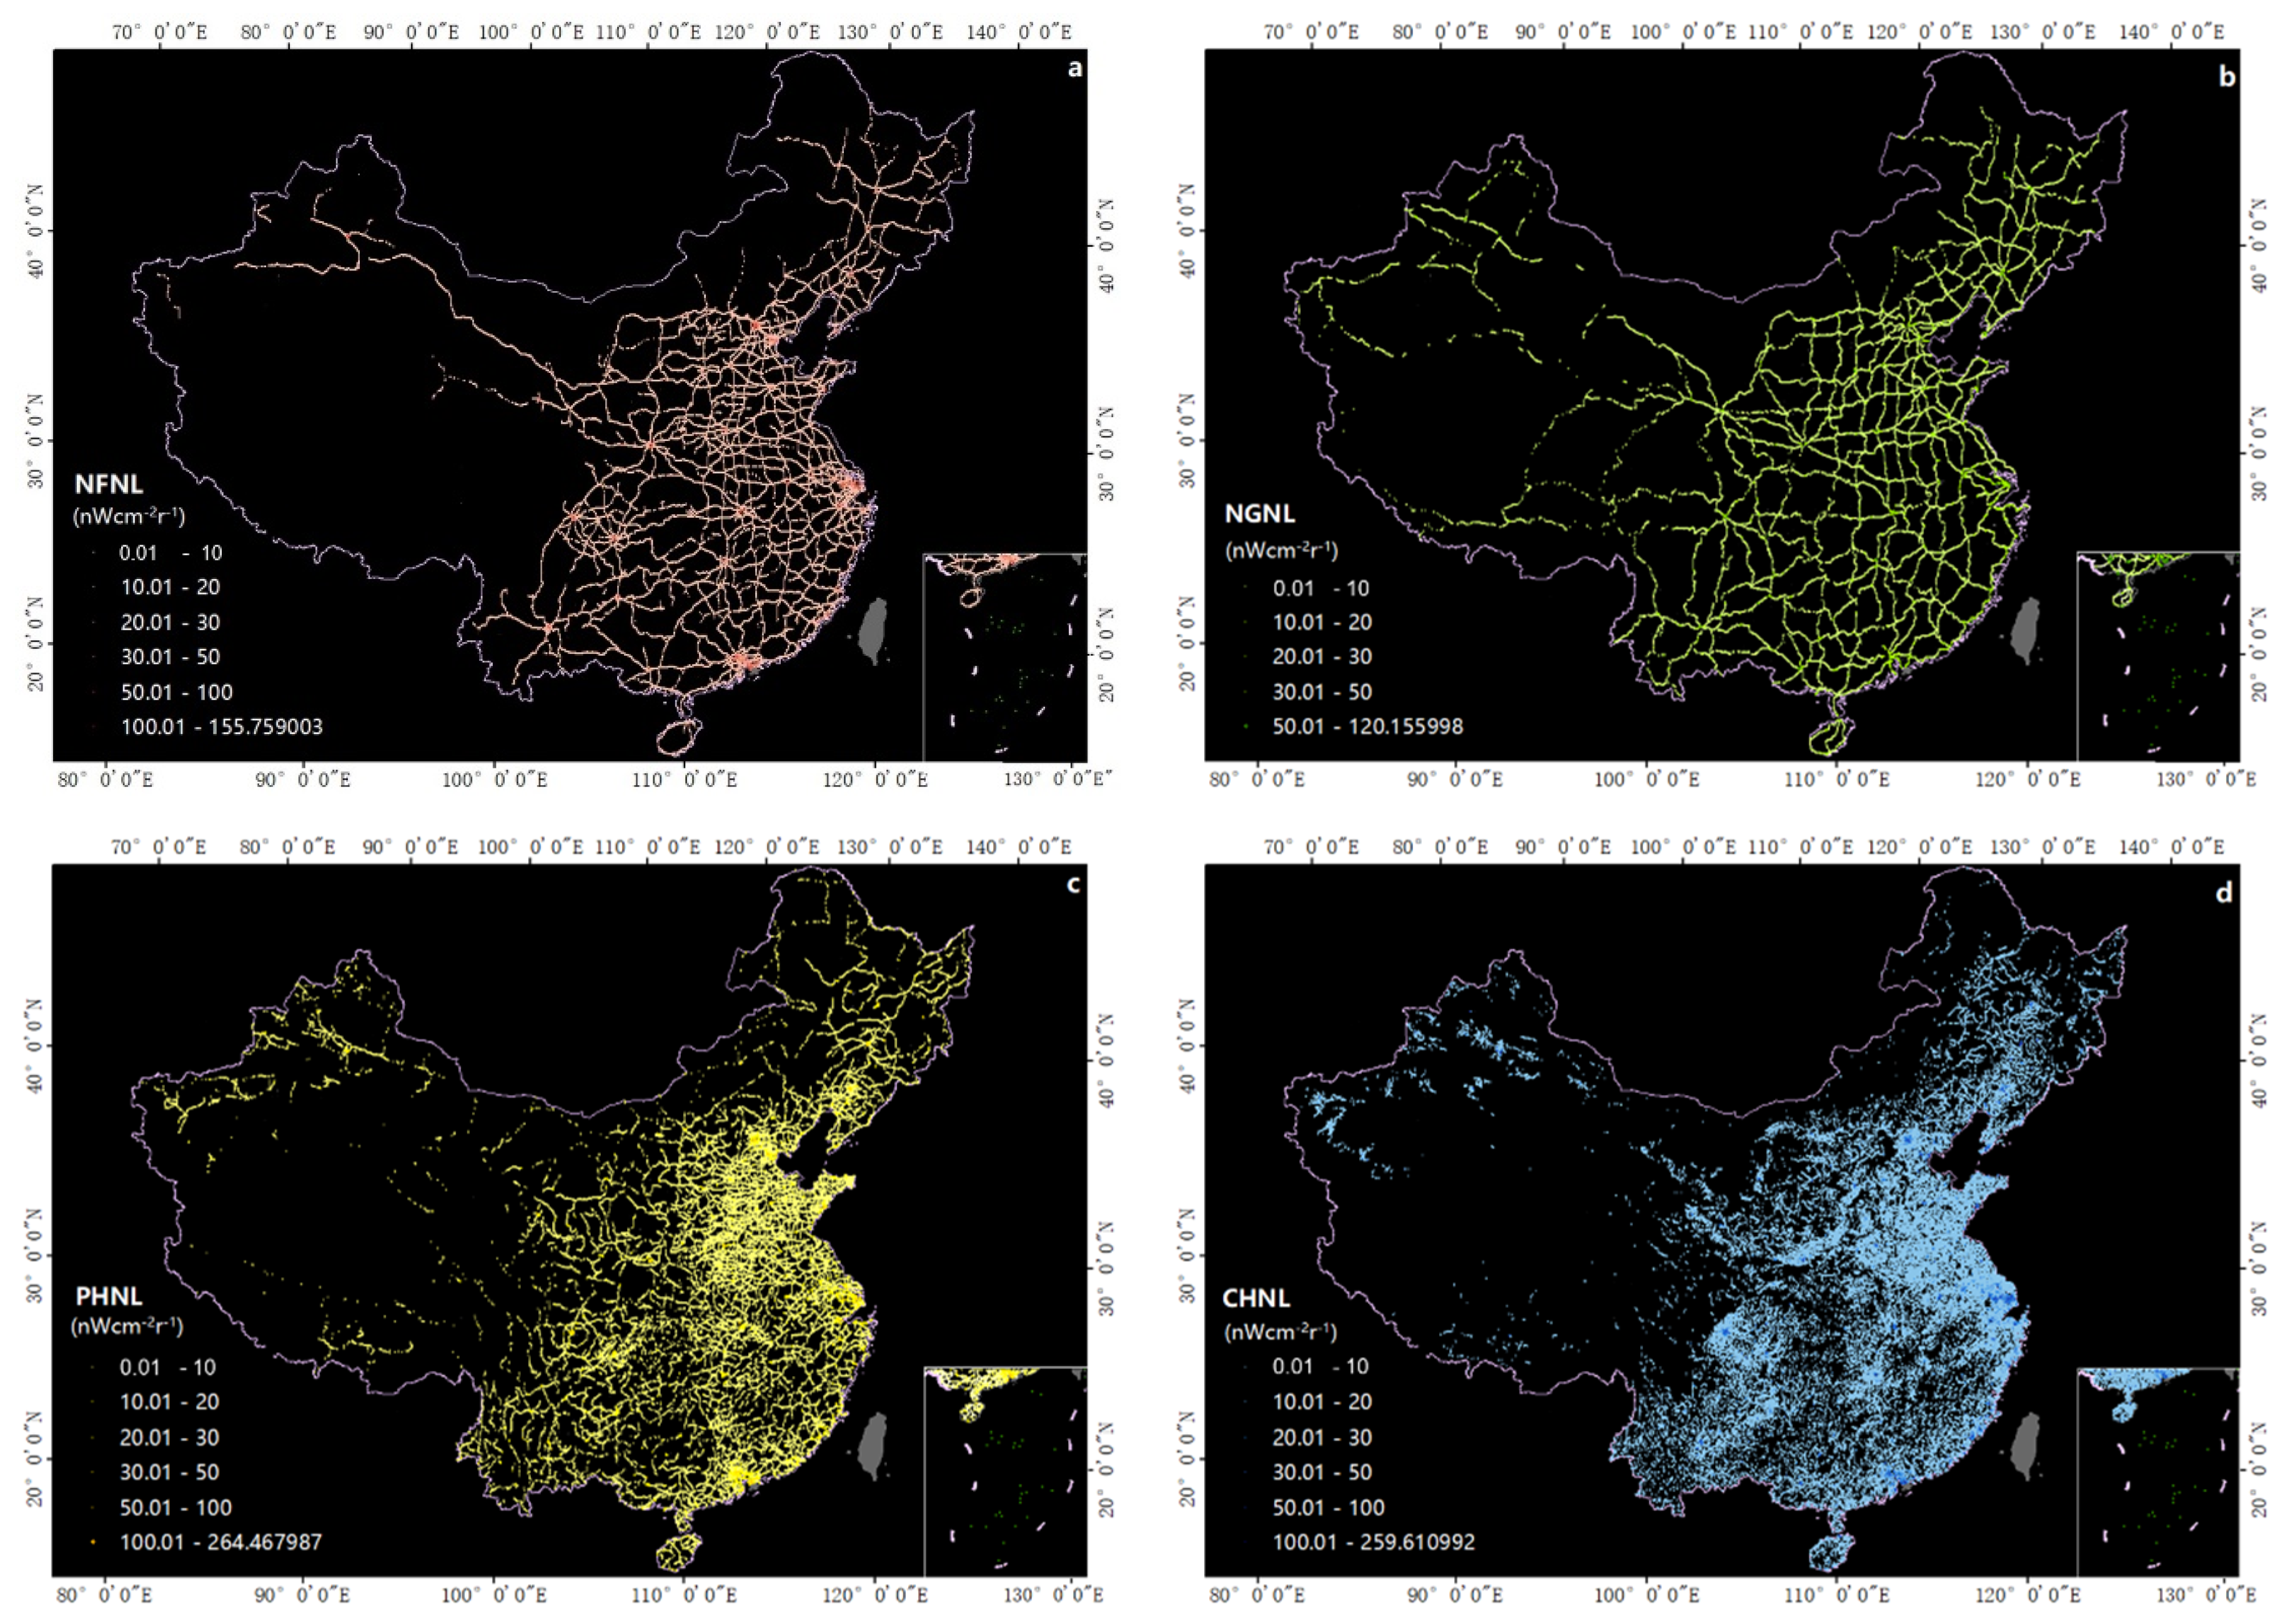
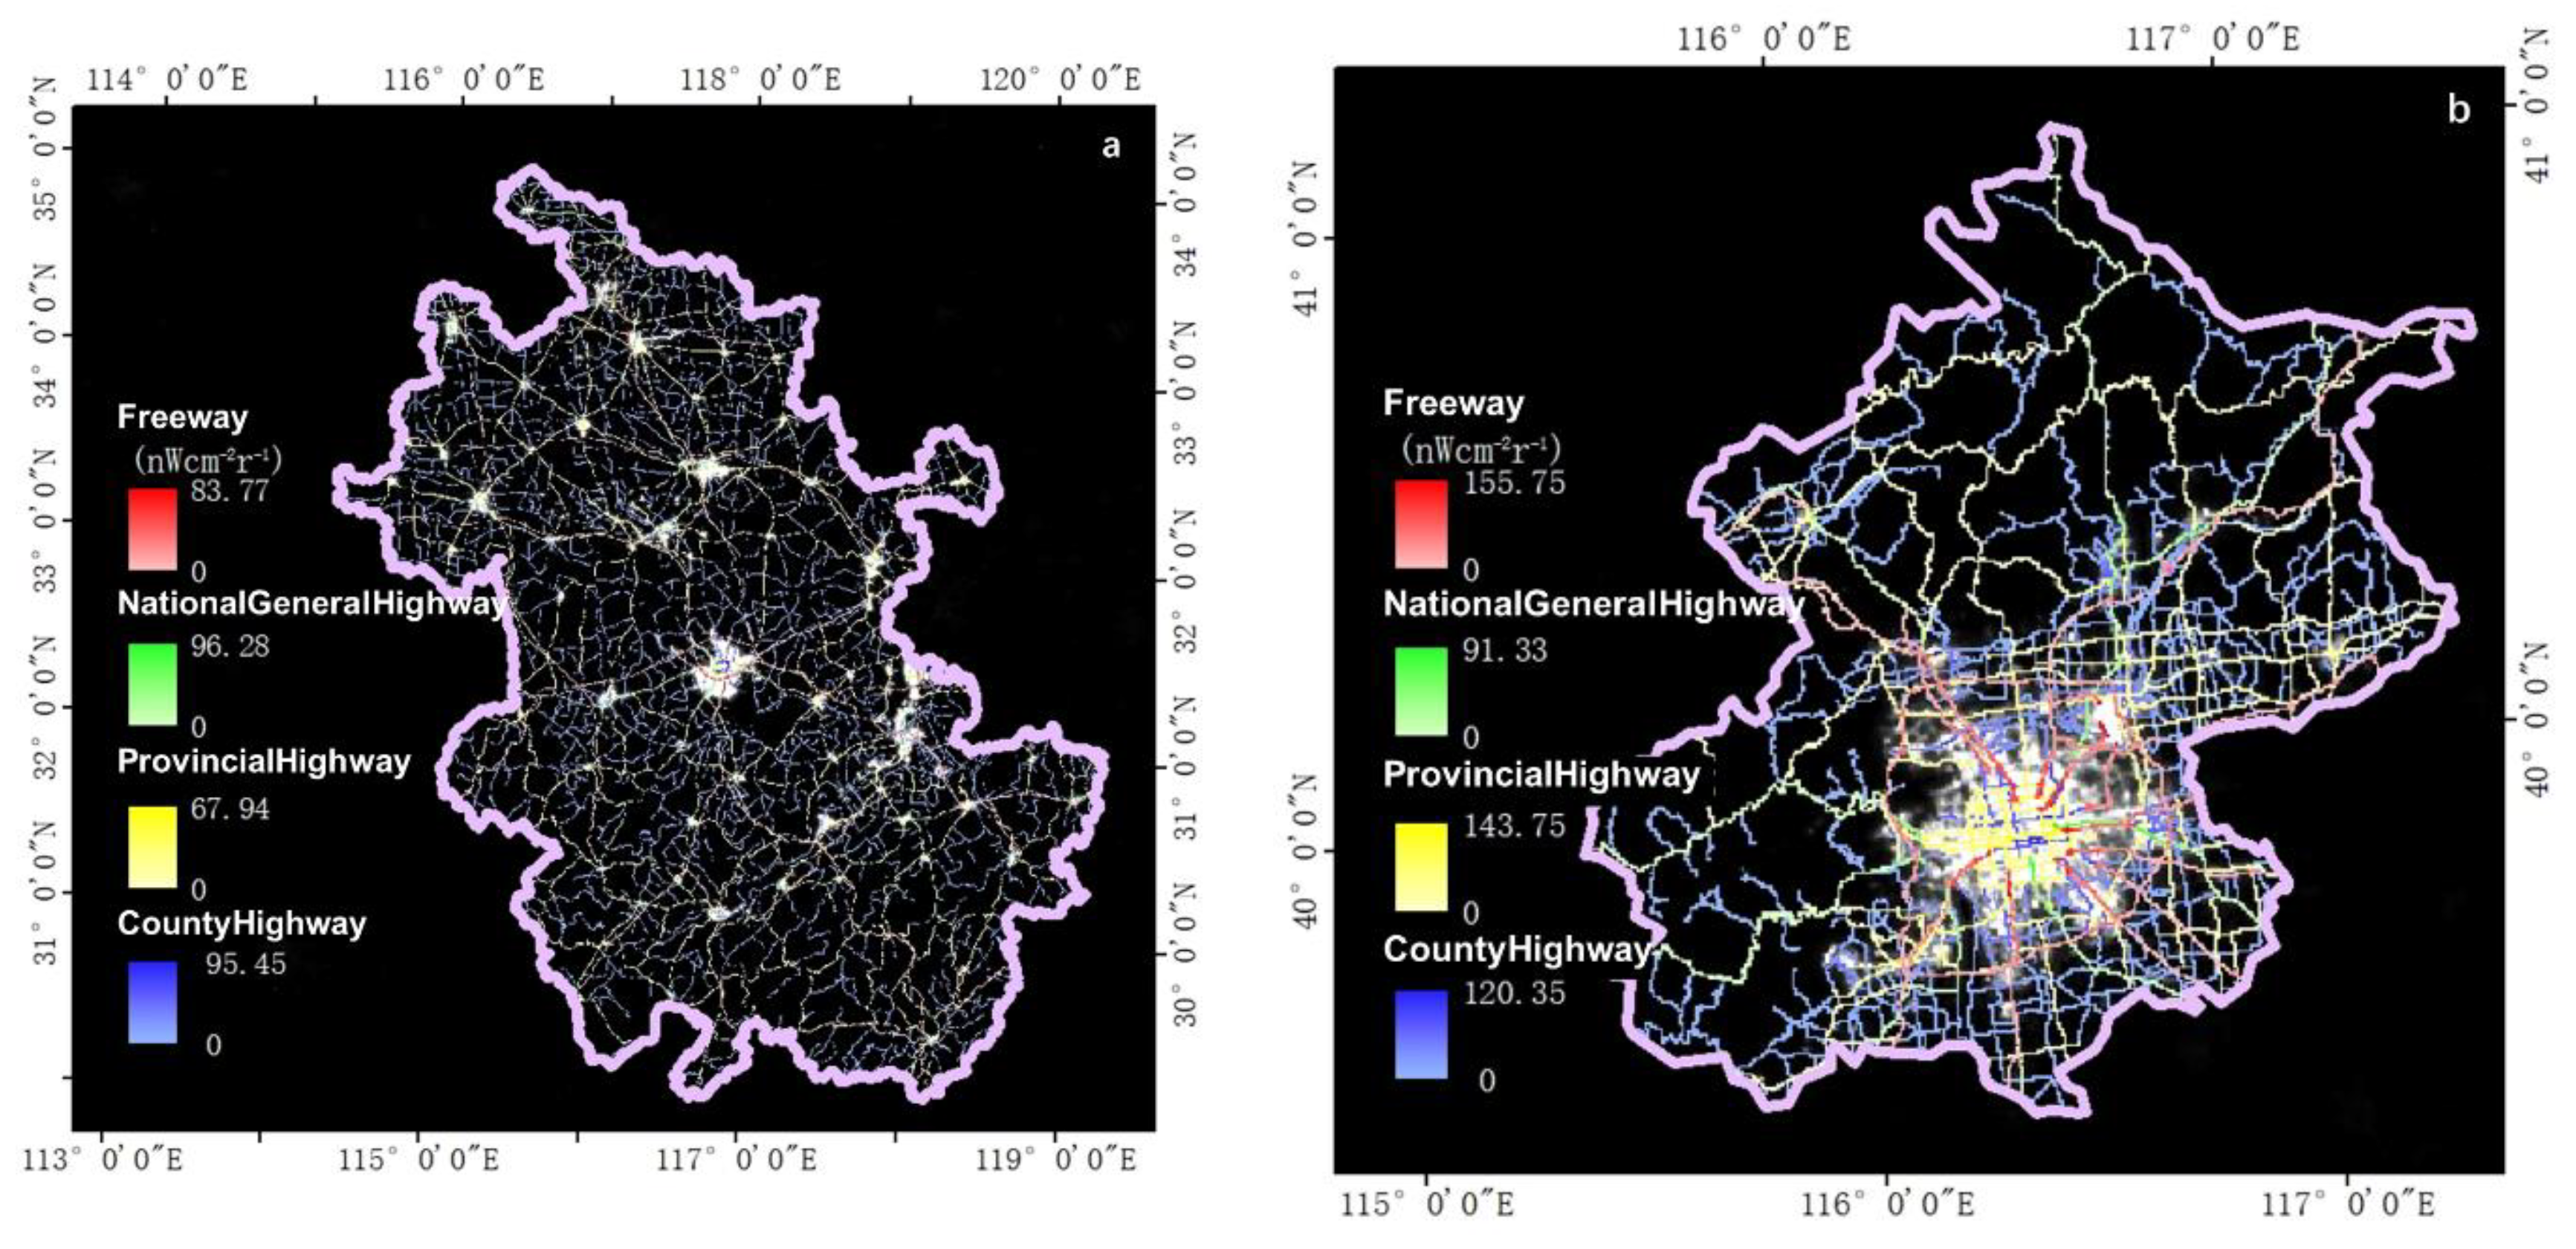
According to the methods described above, the night lights of four highways grades were extracted at the provincial level. Figure 7 illustrates the extraction result of the 2015 annual average lighting brightness of highway traffic flow light. Beijing and Shenzhen were selected as instances that can reflect the traffic flow clearly (Figure 8). As can be seen from Figure 8, the intensity of highway lights varies greatly for different grades.
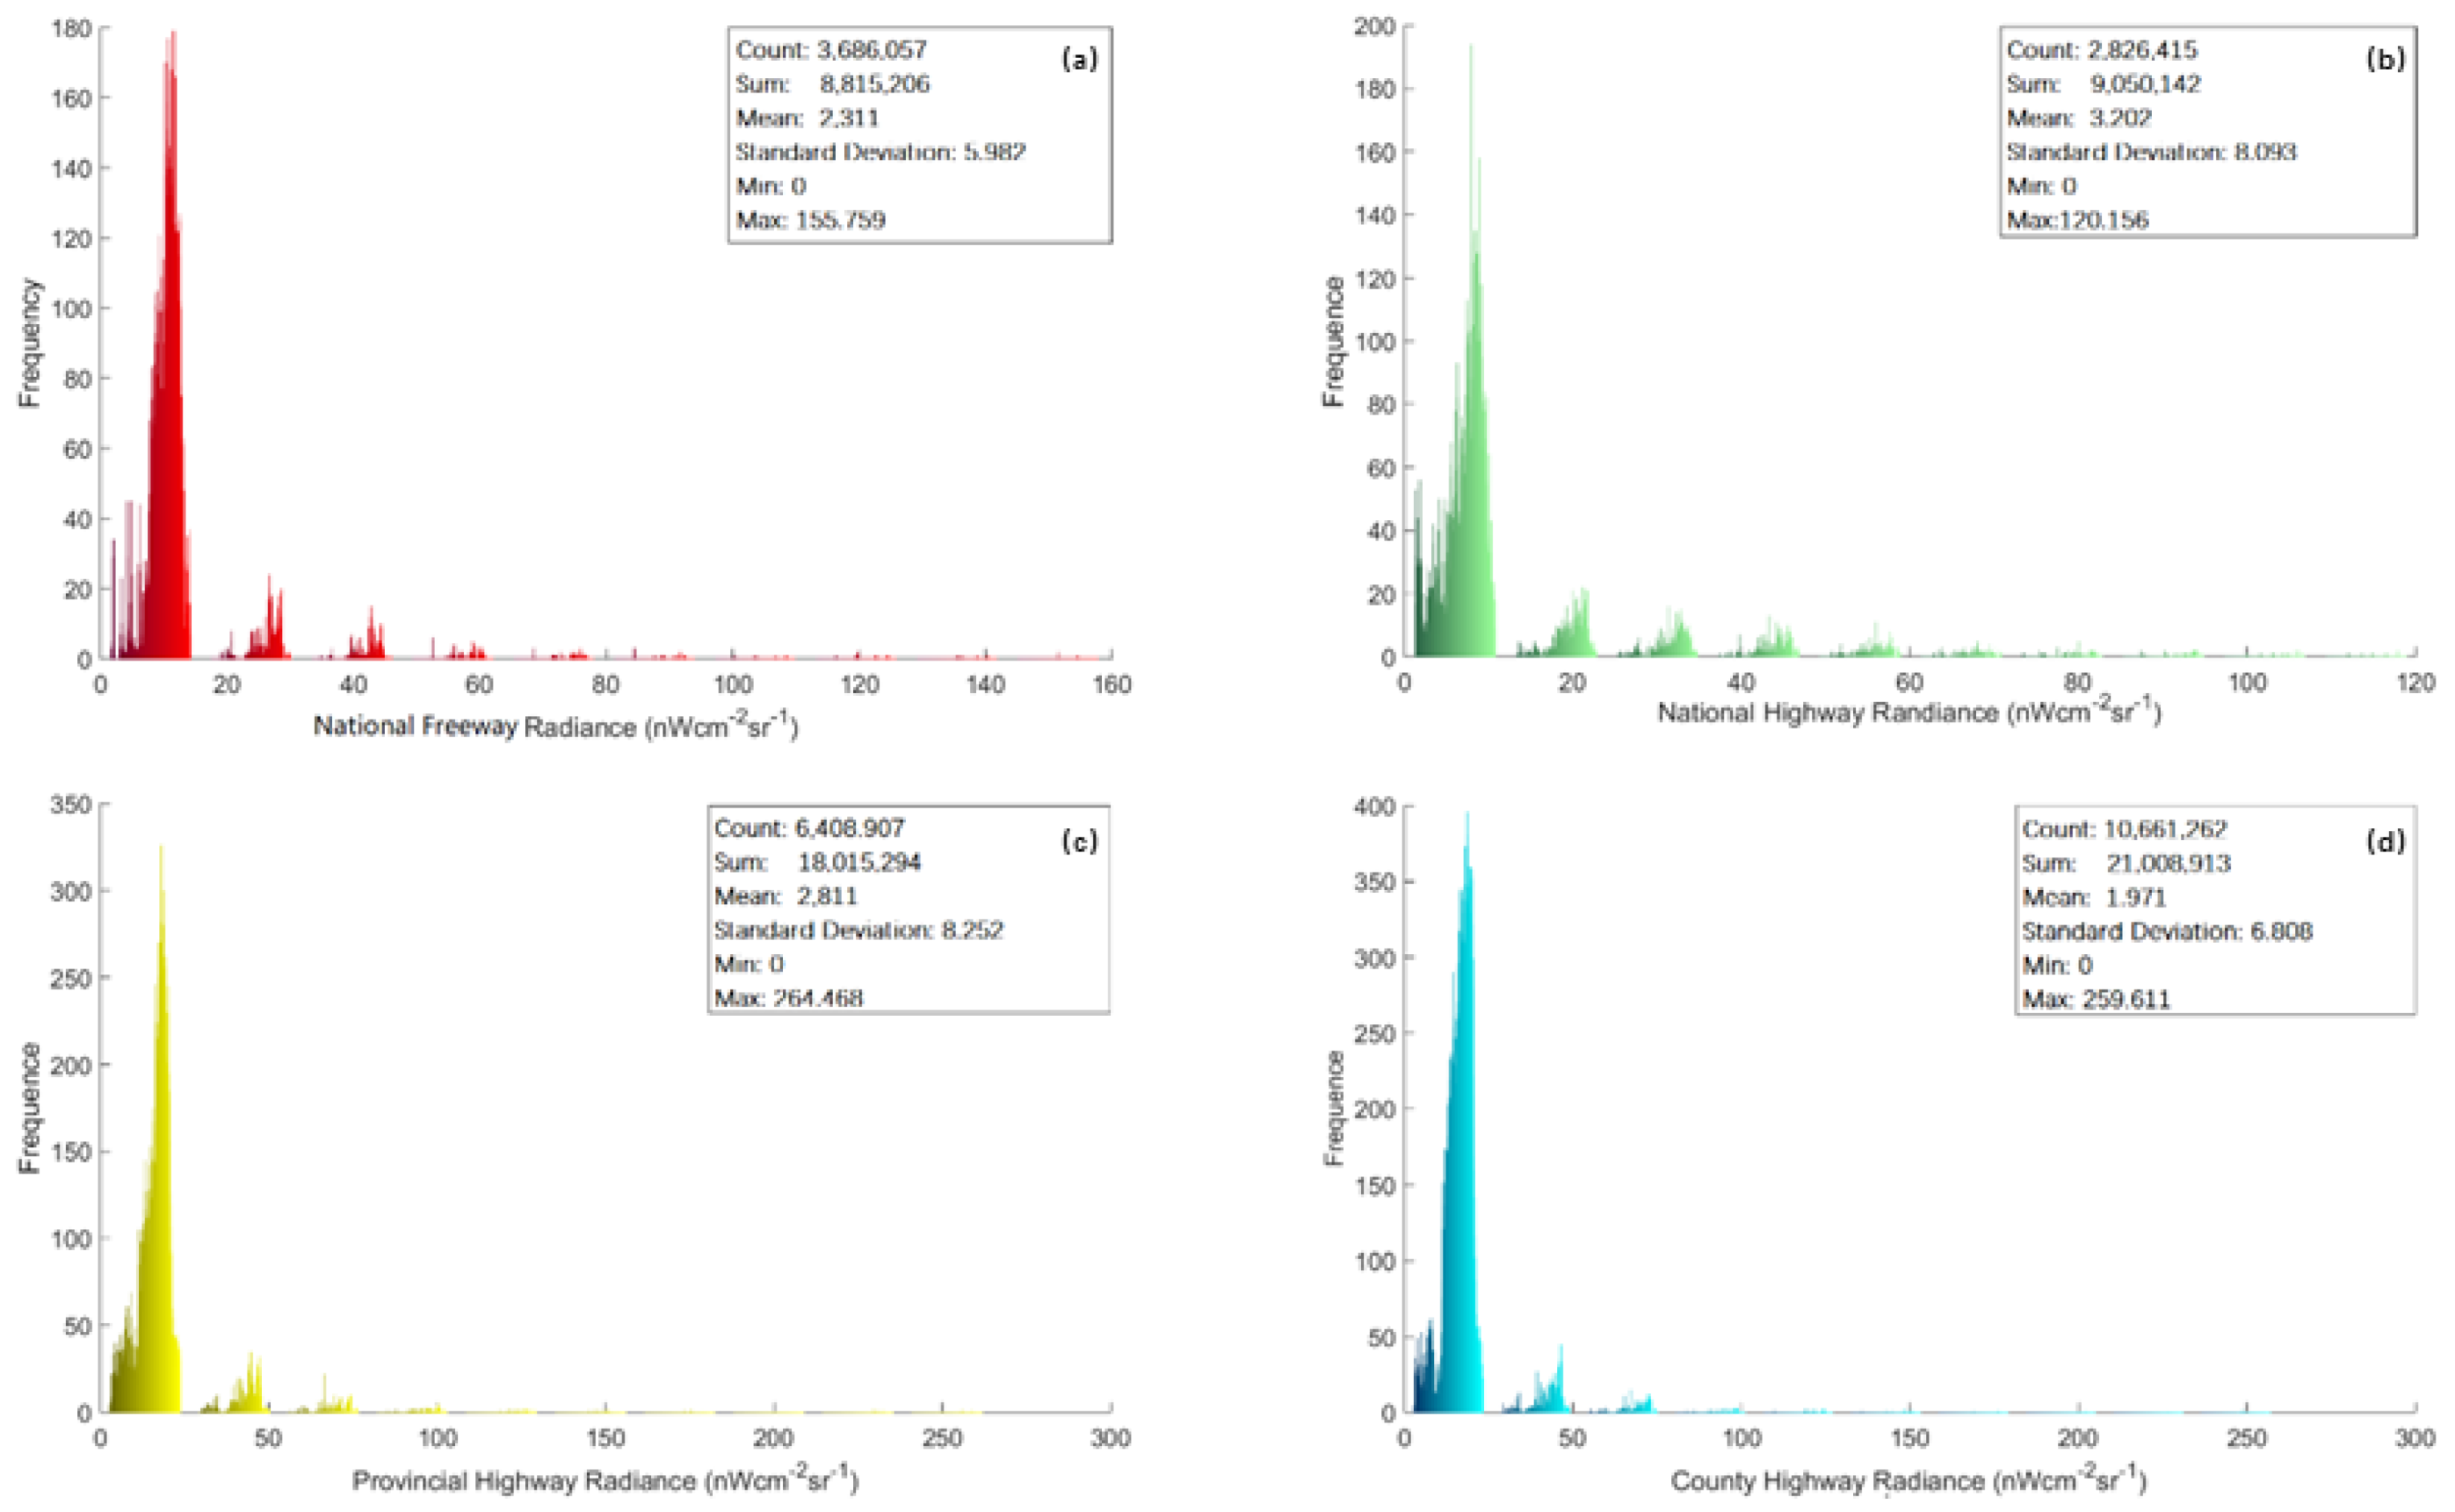
Figure 9 shows histograms of the radiance distribution of HNL. Because the image matrixes are huge, we take advantage of MATLAB to display the frequency of the pixel occurrence by column.
The results showed that the mean brightnesses of four highway grades are all higher than the mean brightness of China (0.301). The mean value of national general highway is the highest, followed by provincial highway, national freeway, and county highway. The results indicated that at the country level, the national general highway carries a lot of nighttime traffic flow while county highway carries the lowest by contrast.
Standard deviation was calculated for the HNL at the country level. The results show that among all the variations of the set of highway nighttime brightness values, the national freeway variation was the most stable (SD = 5.605), and then county highway (SD = 6.244) and national highway (SD = 7.395), while the provincial highway had the highest standard deviation (SD = 7.557). The results mainly reflected the functions of different highway grades, among which the night traffic activities undertaken by freeways in China are clustered closely around the mean and the variation of traffic activities only change a little at the pixel level. By contrast, the nighttime radiance of provincial highways spread far from the mean, indicating that the variation of provincial highway traffic fluctuated hugely at the pixel level.
Through the analysis of the extraction results, it was found that the highest value of NF appears on the expressway in Beijing international airport, the highest value of NG is at Hankou railway station, the highest value of PH is at the provincial road of Guangzhou international airport, and the highest value of CH was located on county highway X020, all of which are major traffic hubs in developed cities. The information of extreme value points of different grades highway is shown in Table 3.
4.1.2. Validation
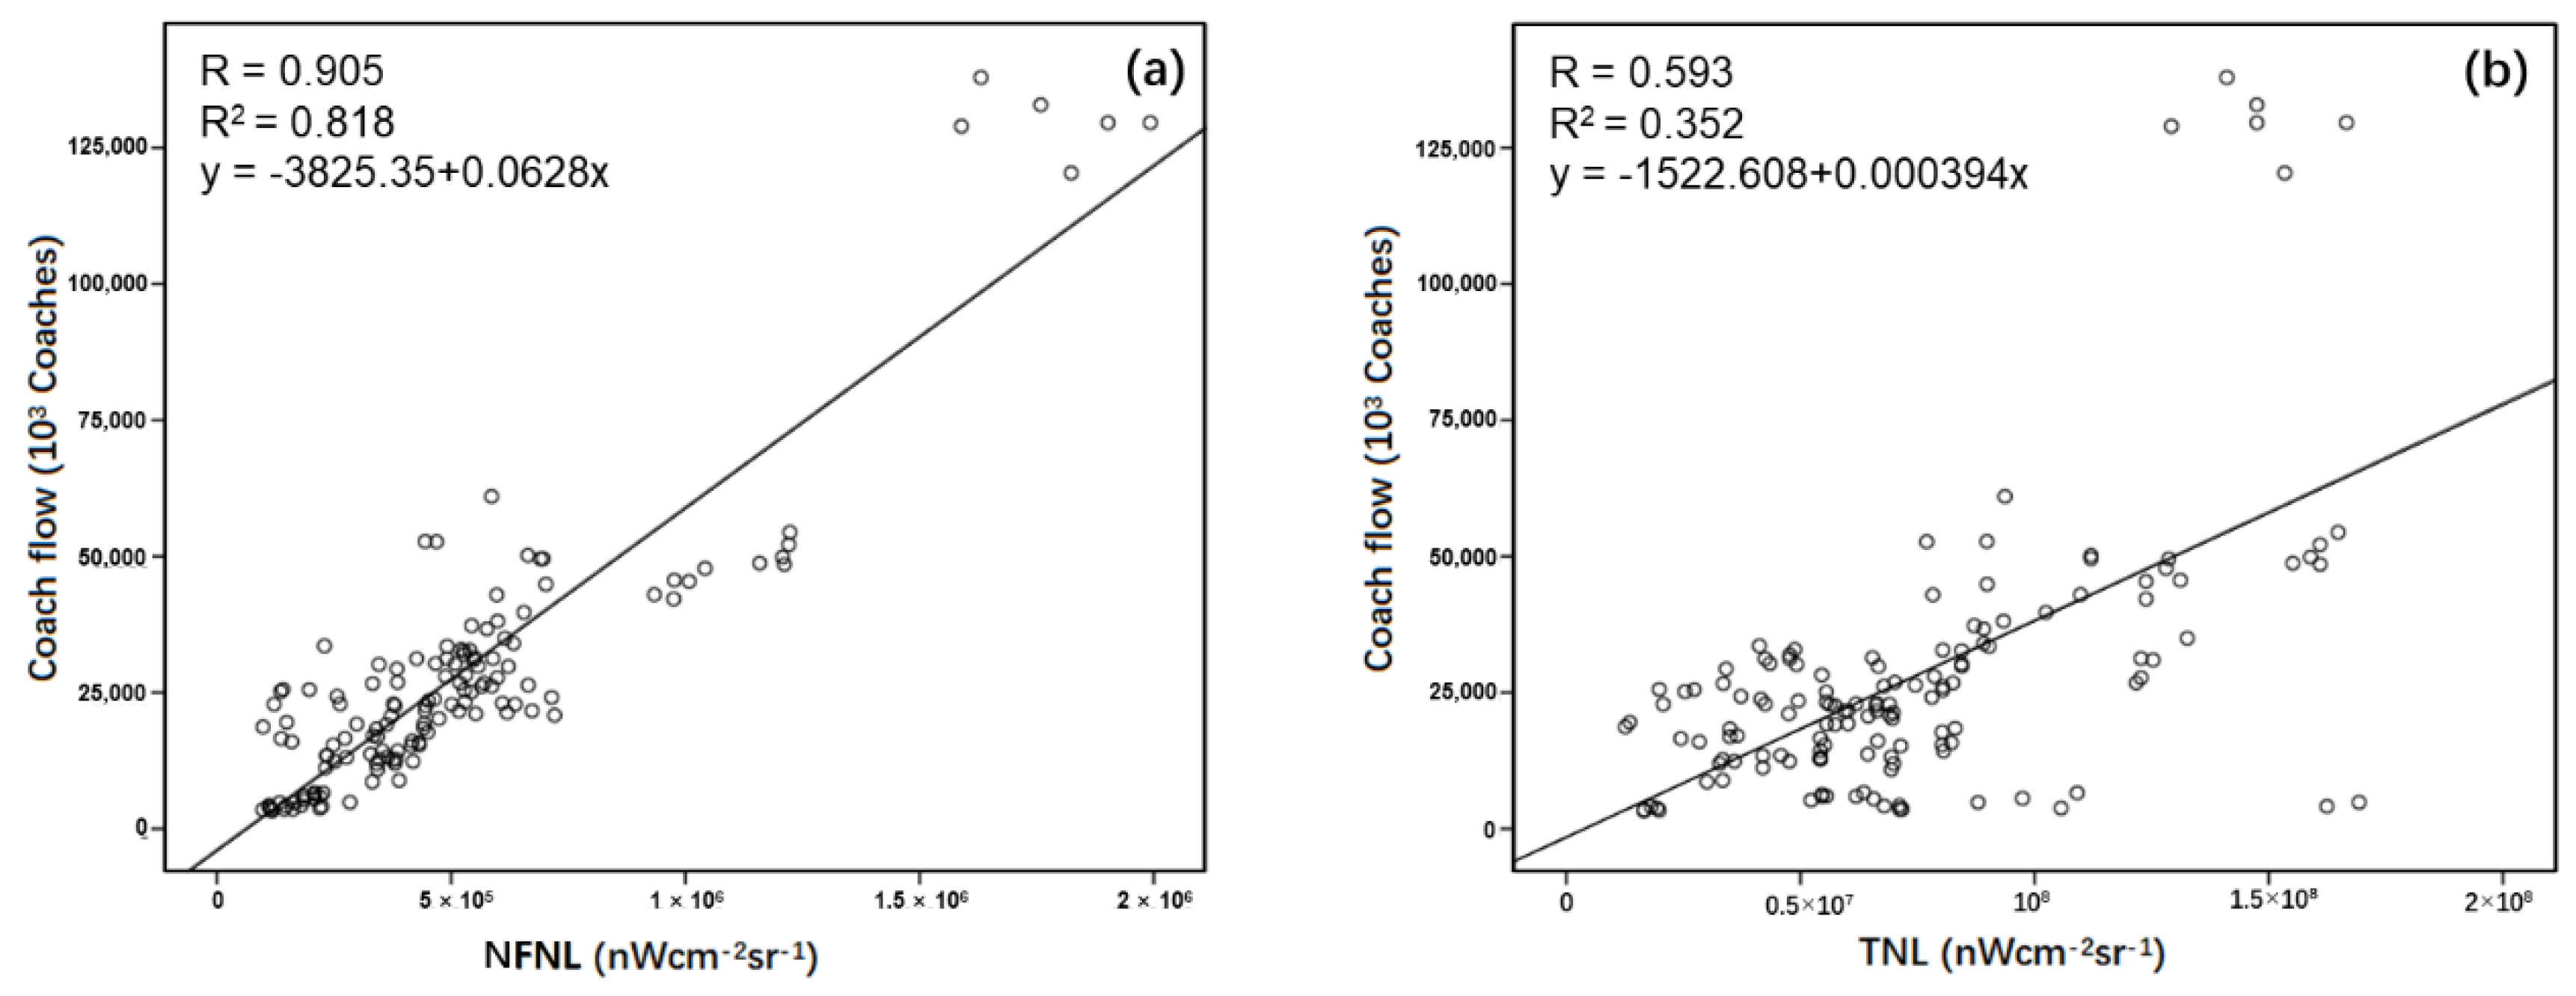
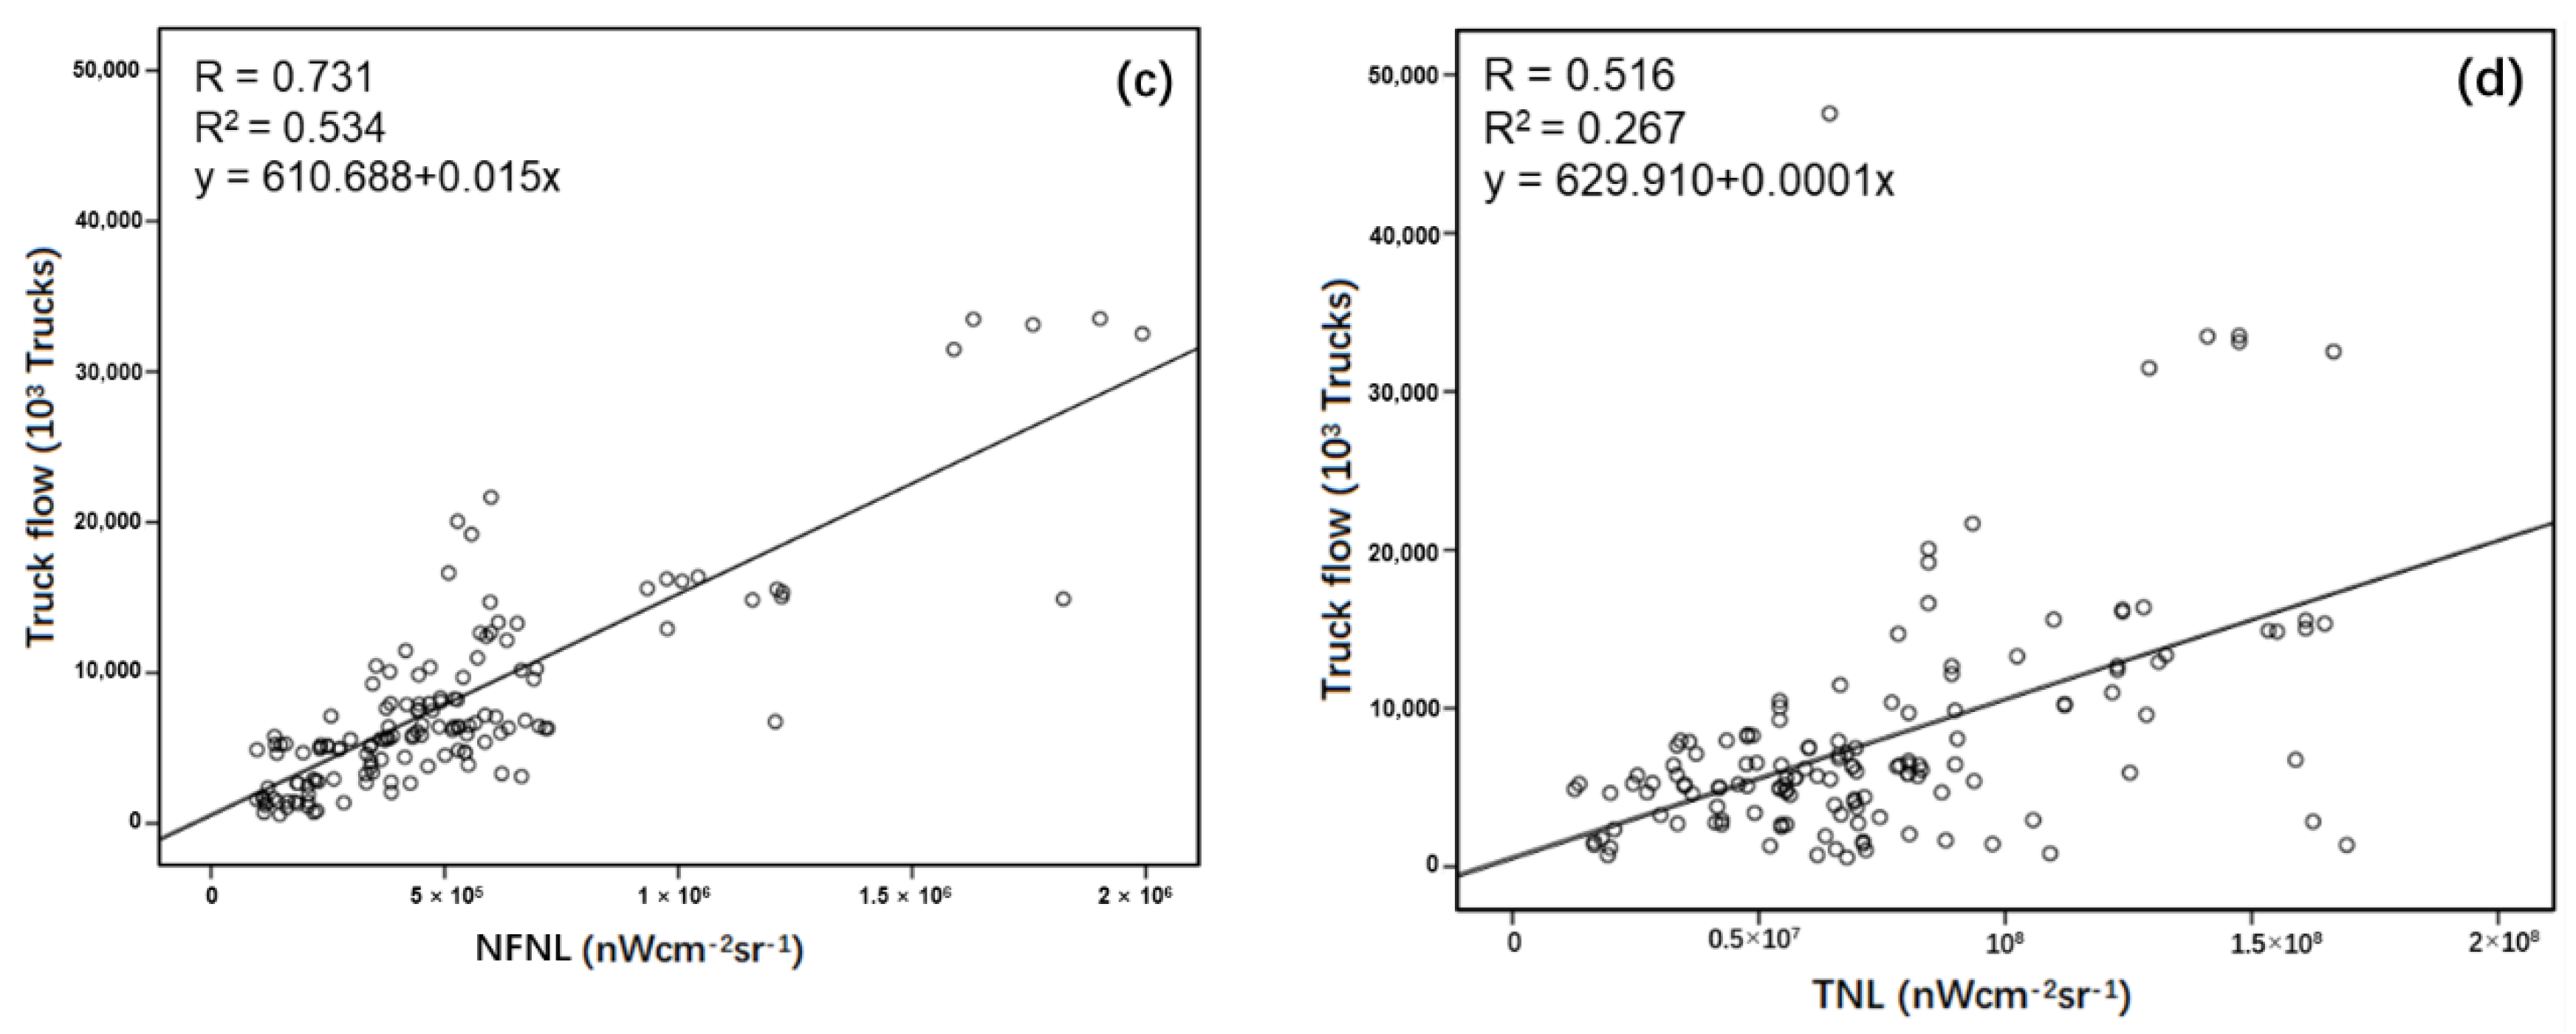
Nighttime light reflects the socio-economic information but lacked effective validation from a quantitative point of view of physics for a long time [10]. This study was based on the hypothesis that the nighttime light on a highway is due to the presence of cars and trucks. Although we judged the response of nighttime light image to vehicle lighting to be common sense, we still need to testify that the highway nighttime light can reflect the traffic flow from a quantitative aspect. As the freeway traffic flow data released by the Ministry of Transport of China only starts from 2019, we used the monthly freeway traffic flow data from Jan 2019 to Jul 2019 for validation and applied the highway-oriented method to the monthly nighttime light images and extracted the freeway nighttime radiance. The correlation between the freeway monthly average radiance and traffic flow are shown in Figure 10. The result showed that the highway nighttime light can describe the traffic flow perfectly.
4.2. Highway Nighttime Traffic Prosperity Index
Spatial Pattern of HNTPI
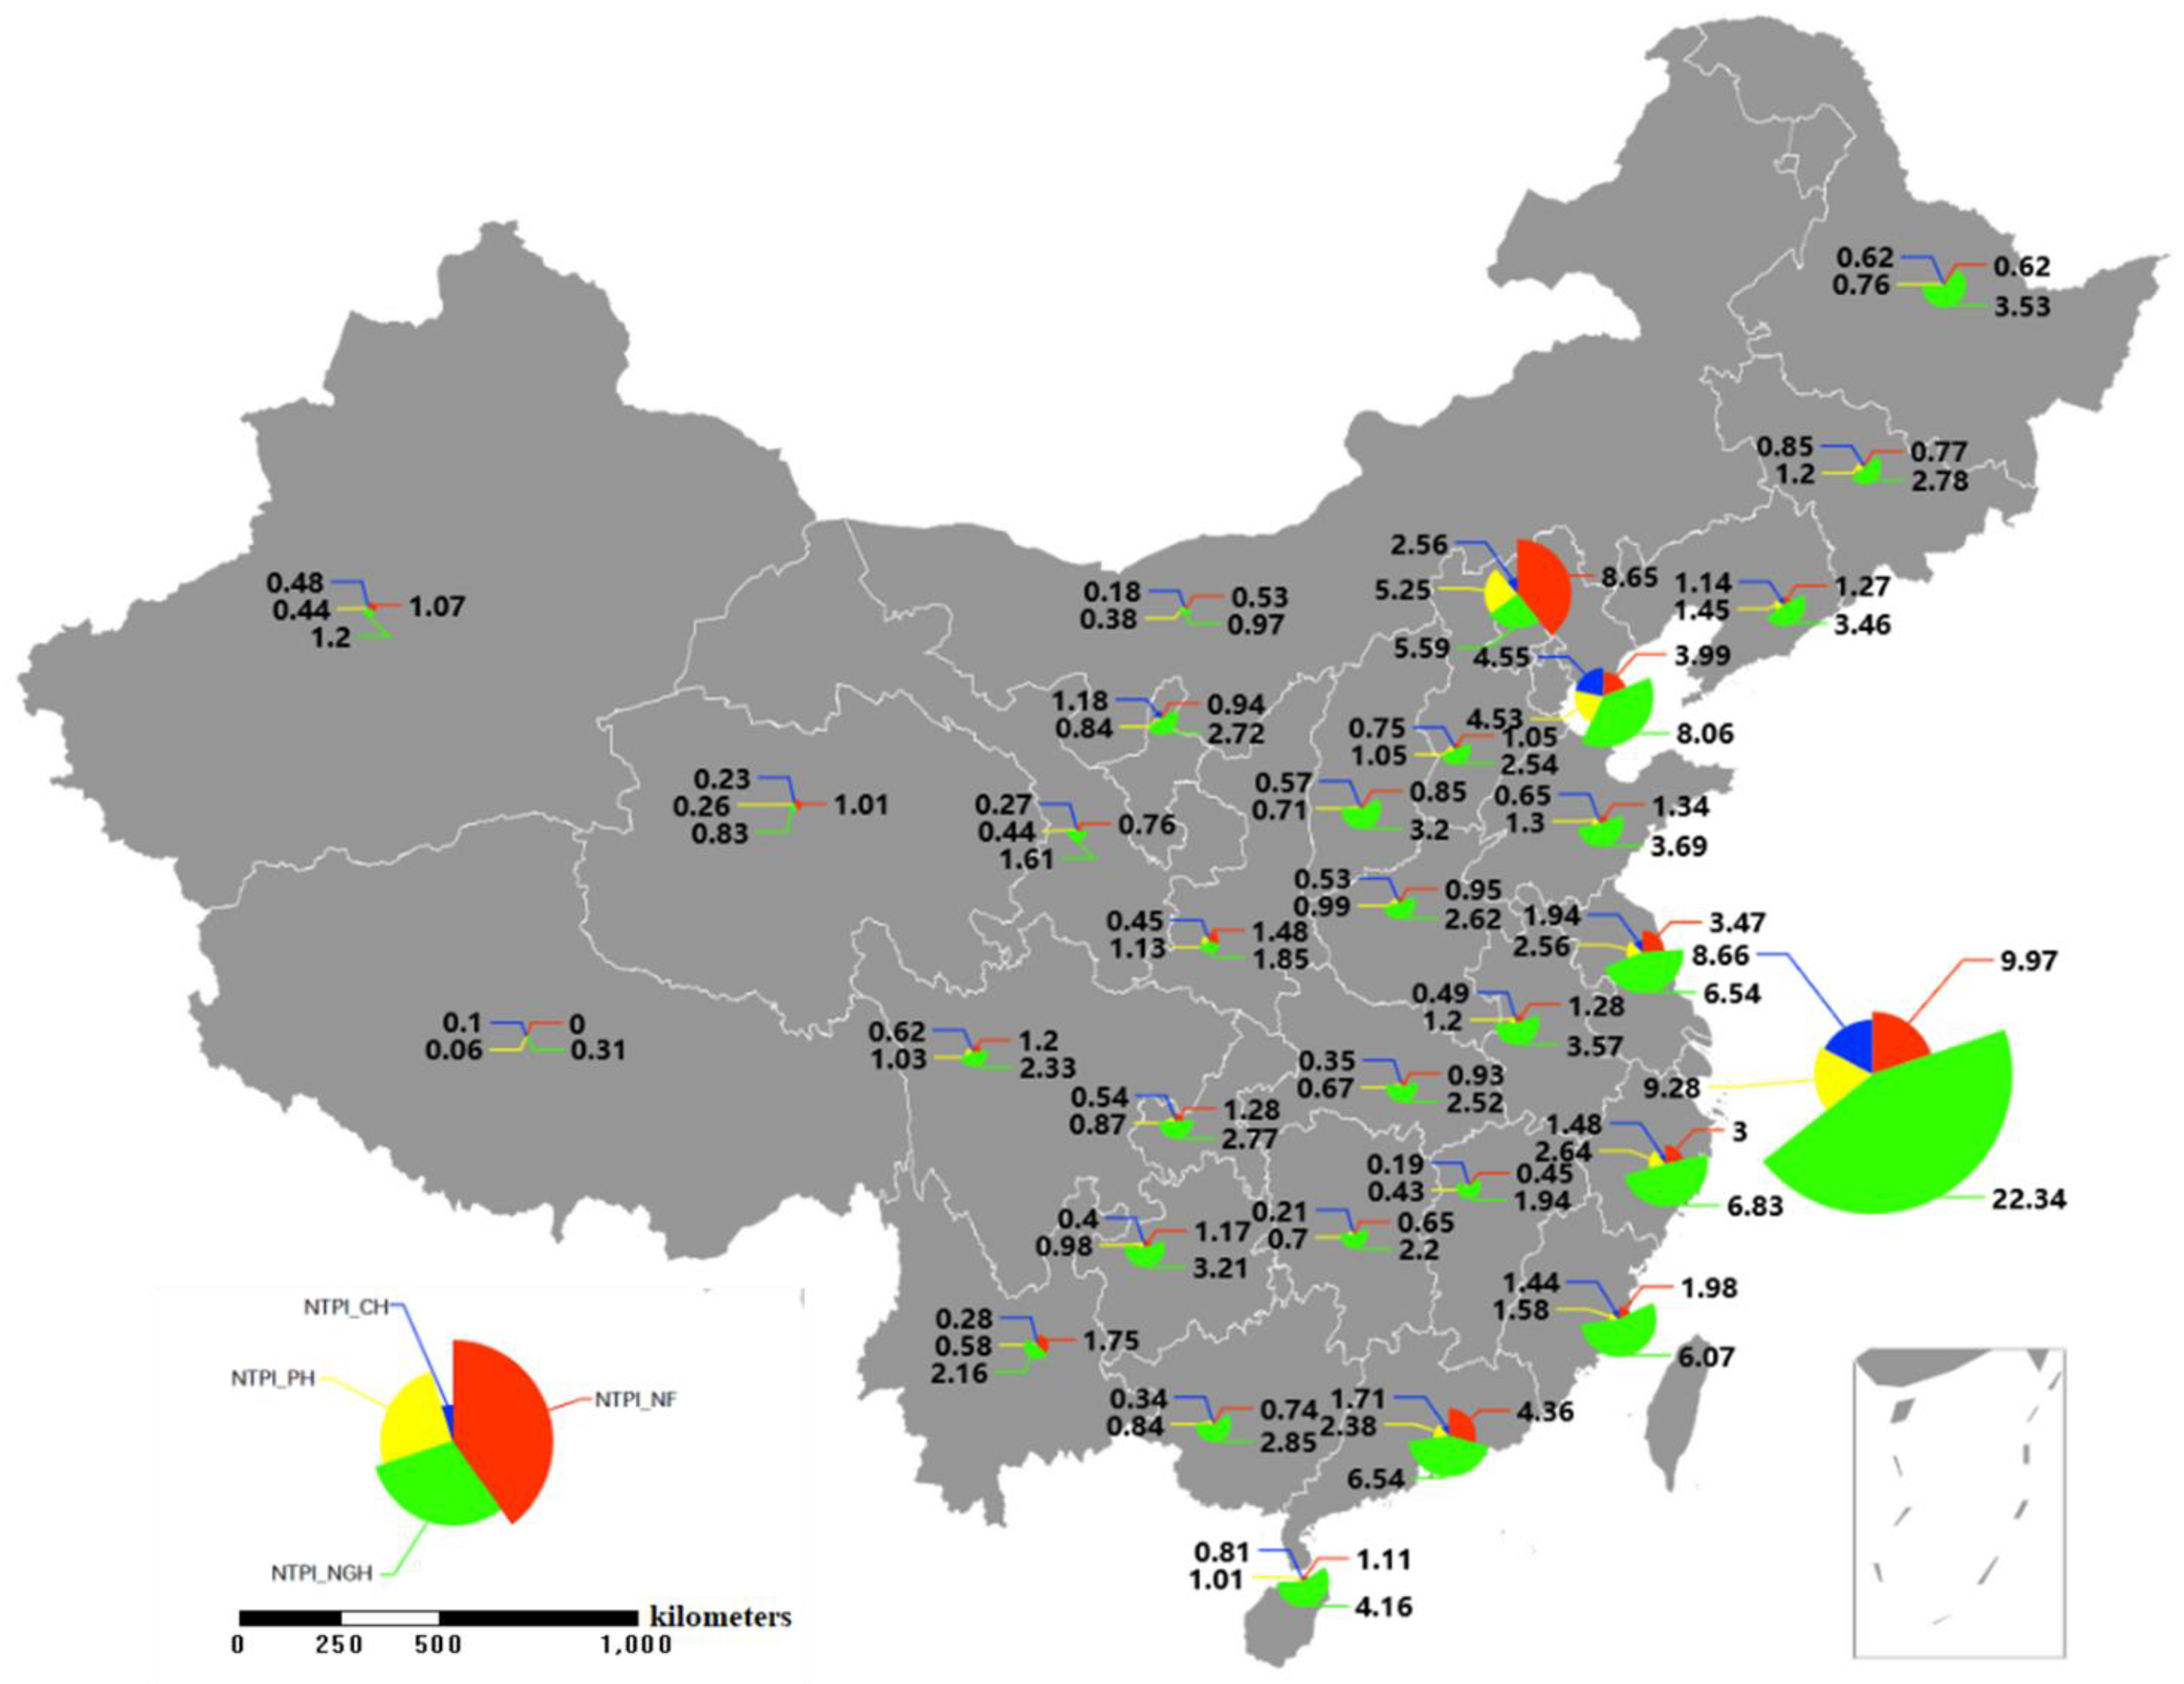
Using the methods described in Section 3.1 and Section 3.2, we calculated NTPI for four highway grades in 31 provinces and 341 prefectural-level units of Mainland China. Figure 11 shows the spatial pattern of four highway grades NTPI in 2015 at the provincial level. The 2015 NTPI of China showed a pattern of strength in the eastern regions and weakness in the western regions. It is extremely consistent with the development level of regional economies across Mainland China. The more developed the area, the more prosperous the traffic at night. Traffic prosperity varies significantly between the four highway grades. As the main channel of inter-provincial traffic and transportation between major economic centers, ports, and stations across China, National highway nighttime traffic prosperity is the highest. Shanghai was the municipality with the most highway nighttime traffic prosperity, whose NTPI_NG reached 22.34%, while the NTPI_PH of Tibet was only 0.058%.
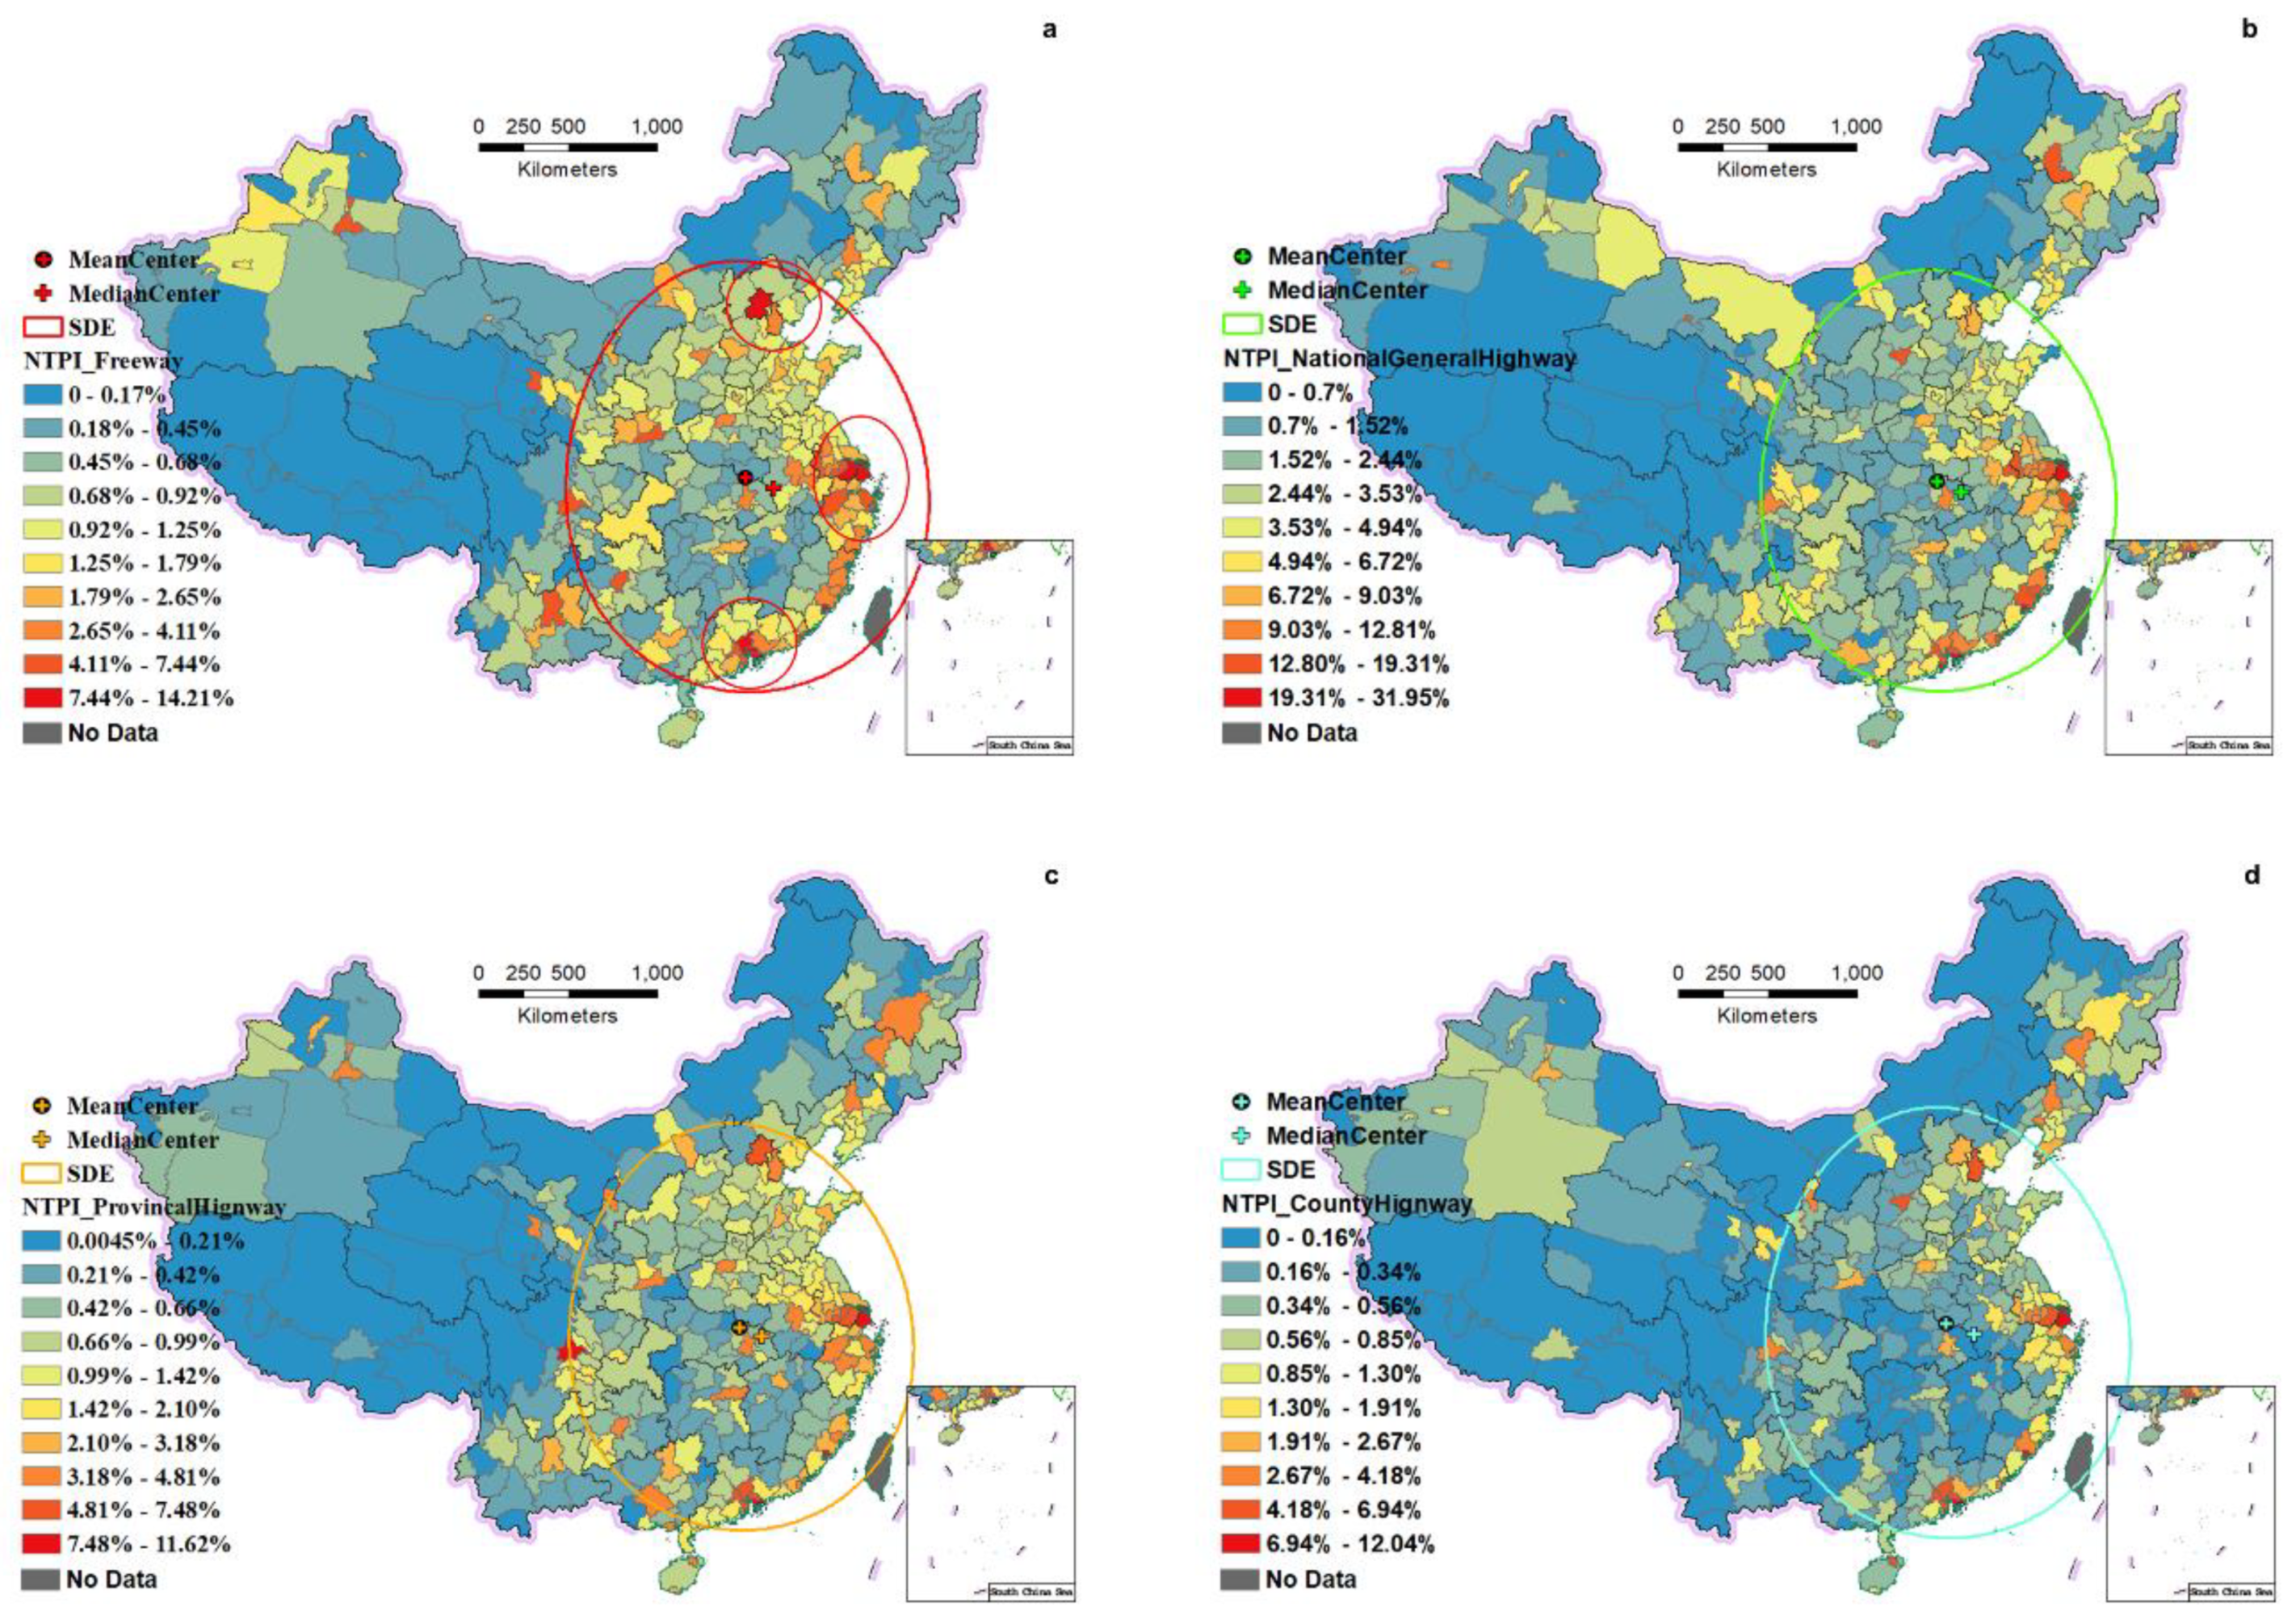
To measure the geographic distribution characteristics of China’s traffic prosperity degree of different highway grades at the city level, we analyzed the spatial concentration and direction change trend of NTPIs through SDE. Table 4 illustrates the descriptive statistics of SDE for the 2015 urban traffic prosperity at night across Mainland China. The results showed that the geographic distribution of NTPI of four highway grades are slightly different, and the position of the median centers are close. The median center of NTPI_CH towards to the southeast and the radius of the ellipse is the longest compared to other highway grades.
Figure 12 is the municipal level nighttime traffic prosperity maps with the SDE. The prosperity of urban highway traffic for four grades shows strong spatial heterogeneity. Through the freeway/expressway nighttime traffic prosperity map, the most important economic zones along an expressway (EZAE) appeared explicitly: Beijing–Tianjin–Hebei, Pearl River Delta, and Greater Bay Area, three developed economic zones along freeways taking Beijing, Shanghai, and Shenzhen as the centers, respectively (Figure 10a, red circle). The free flow of logistics, people, technology and information within the economic belt make the economic development level of each point in the region be significantly higher than that of neighboring areas and the overall economic structure has reached a dynamic balance. The extension of a mature freeway economy belt promoting the surrounding areas’ economic development and also enhances the prosperity of urban traffic along the freeway economic belt at the same time [37]. In contrast to national highways, which are strategic highways within China, the prosperity degree of night traffic on county highways can better reflect residents’ nocturnal activities in the city, which are greatly influenced by geographical environments, climate, and humanity factors.
5. Discussion
5.1. Relationship with Socio-Economy Parameters
5.1.1. Relationship between HNL and GDP
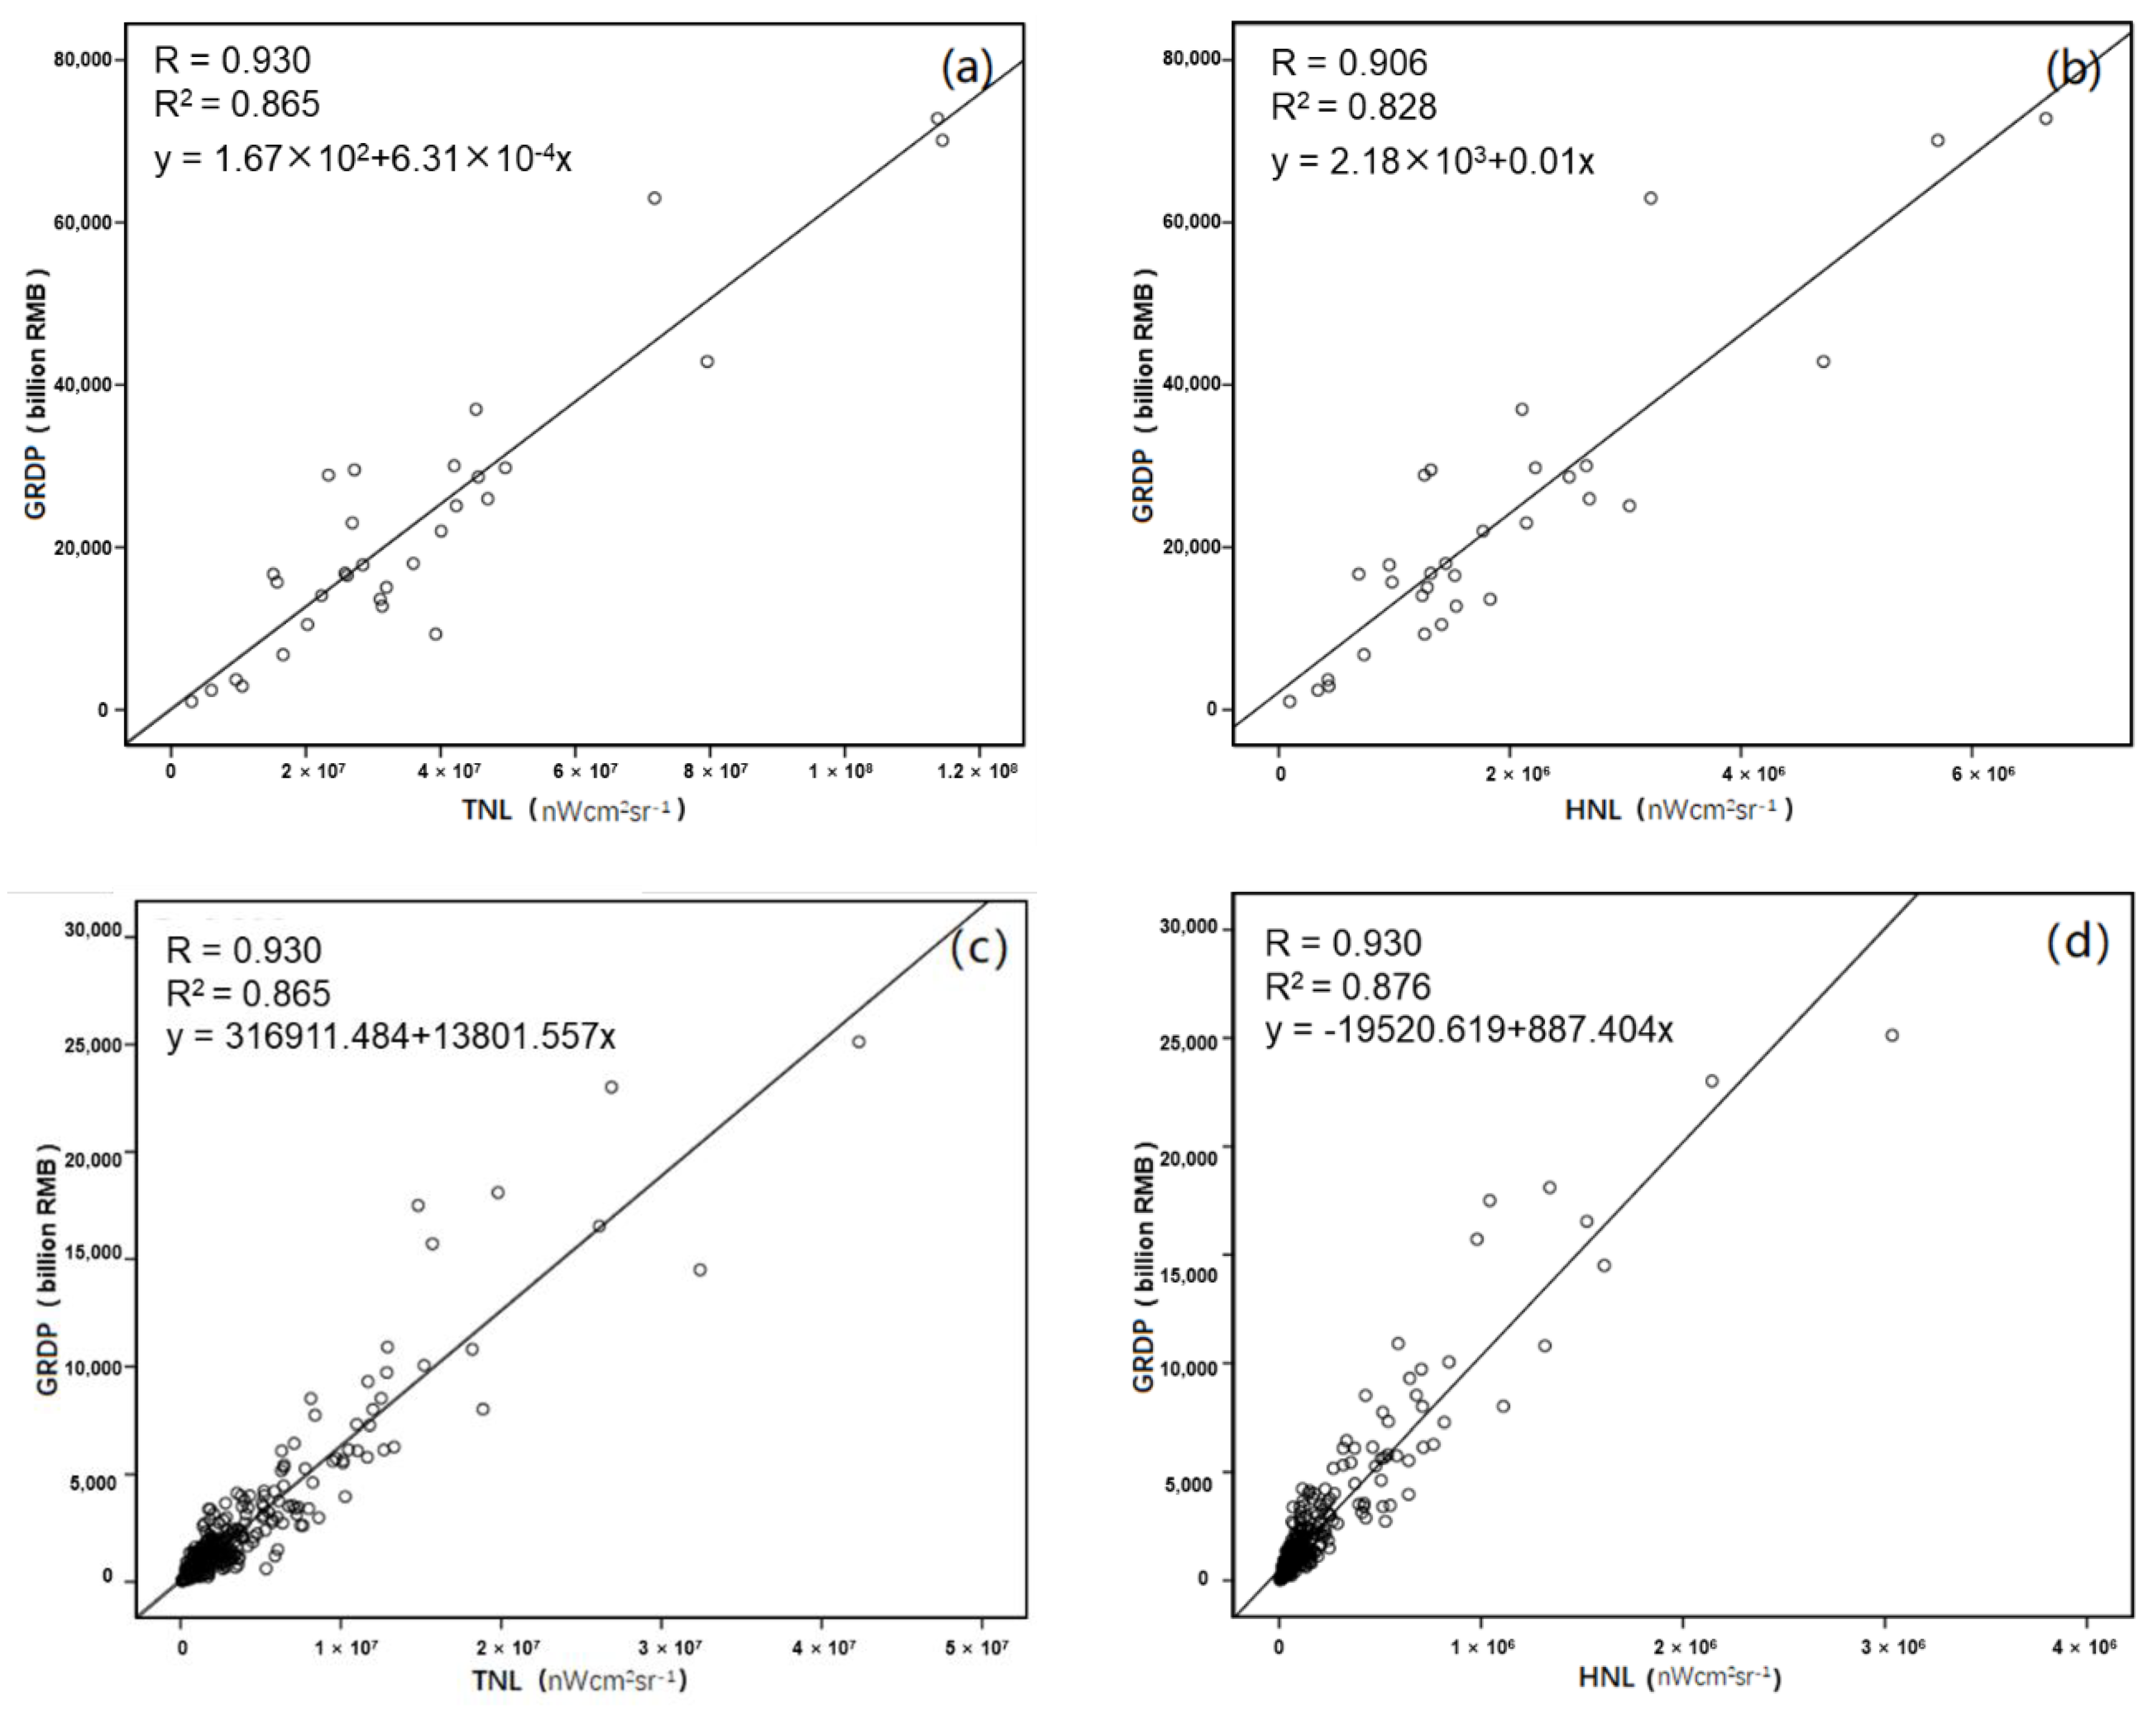
Nighttime light data provide substantial potential for modelling the spatiotemporal dynamics of GDP and other socio-economic parameters over large areas. The nighttime light indices derived from the extended temporal coverage data have a high degree of continuity at both country and provincial levels, which can be a useful indicator for measuring economic development, as indicated by previous studies [18]. The TNL and HNL of 31 provinces and autonomous regions in China (excluding Hong Kong, Macao and Taiwan) in 2015 were calculated based on the highway nighttime light image dataset. The results showed that HNL has an extreme correlation with the gross regional domestic product (GRDP). Through the linear regression model, the relationships between TNL, HNL, and GRDP are shown in Figure 13. The Pearson correlation of the TNL and GRDP was 0.930 and the R2 between TNL and GRDP was 0.865. The Pearson correlation of the HNL and GRDP was 0.906 and the R2 of the HNL and GRDP was 0.828. The correlation coefficient of TNL and HNL was 0.966.
At the city level, we calculated the TNL and HNL of 338 prefectural-level units of Mainland China and then modelled the GRDP using a linear regression model. The Pearson correlation of the TNL and GRDP was 0.930 and the R2 between the TNL and GRDP was 0.865. The Pearson correlation of the HNL and GRDP was 0.936 and the R2 of the HNL and GRDP was 0.876 (Figure 13c,d).
The results indicate that the highway nighttime traffic flow has a good correlation with GRDP. Furthermore, HNL can better reflect the GRDP than total nighttime light at the city level in China.
5.1.2. Relationship between HNTPI and Socio-Economic Parameters
A correlation analysis was applied on the HNTPI, MNL and three social-economic parameters: GDP per capita, consumption per capita, and the population at the provincial level. The results of the two indices are listed in Table 5. The HNTPI showed a stronger correlation with GDP per capita, consumption per capita, and population with Pearson Correlation Coefficients of 0.772, 0.895 and 0.968, respectively. In terms of GDP and consumption per capita, HNTPI has stronger correlation than MNL, mainly because traffic activities can further embody the economy of a region. Furthermore, the brightness of the whole region contains gas flares and other irrelevant brightness under the threshold, which cannot be removed. However, extracting the highway brightness rules out most gas flares immediately. The MNL contains the whole region’s brightness and can better reflect the total population (R = 0.979) than the brightness from highways (R = 0.968). NTPI did not contain the brightness of urban streets, so it may underestimate the regional night traffic flow, resulting in a poor correlation.
5.2. Time Transformation of NTPI
In recent years, China has experienced accelerated development in the socio-economic field, which led to growth in traffic and transportation. Transport infrastructure investments have usually been viewed to have long-term impacts on the regional economy. The light emission changes over time have always been used to monitor urban development at the national and provincial levels [38,39] and the HNTPI can reflect the highway traffic and transportation condition. Thus, the highway-oriented method described in Section 3.1 and Section 3.2 was applied on the December 2015 and December 2018 NPP_VIIRS monthly nighttime light image to investigate the NTPI change at the provincial level.
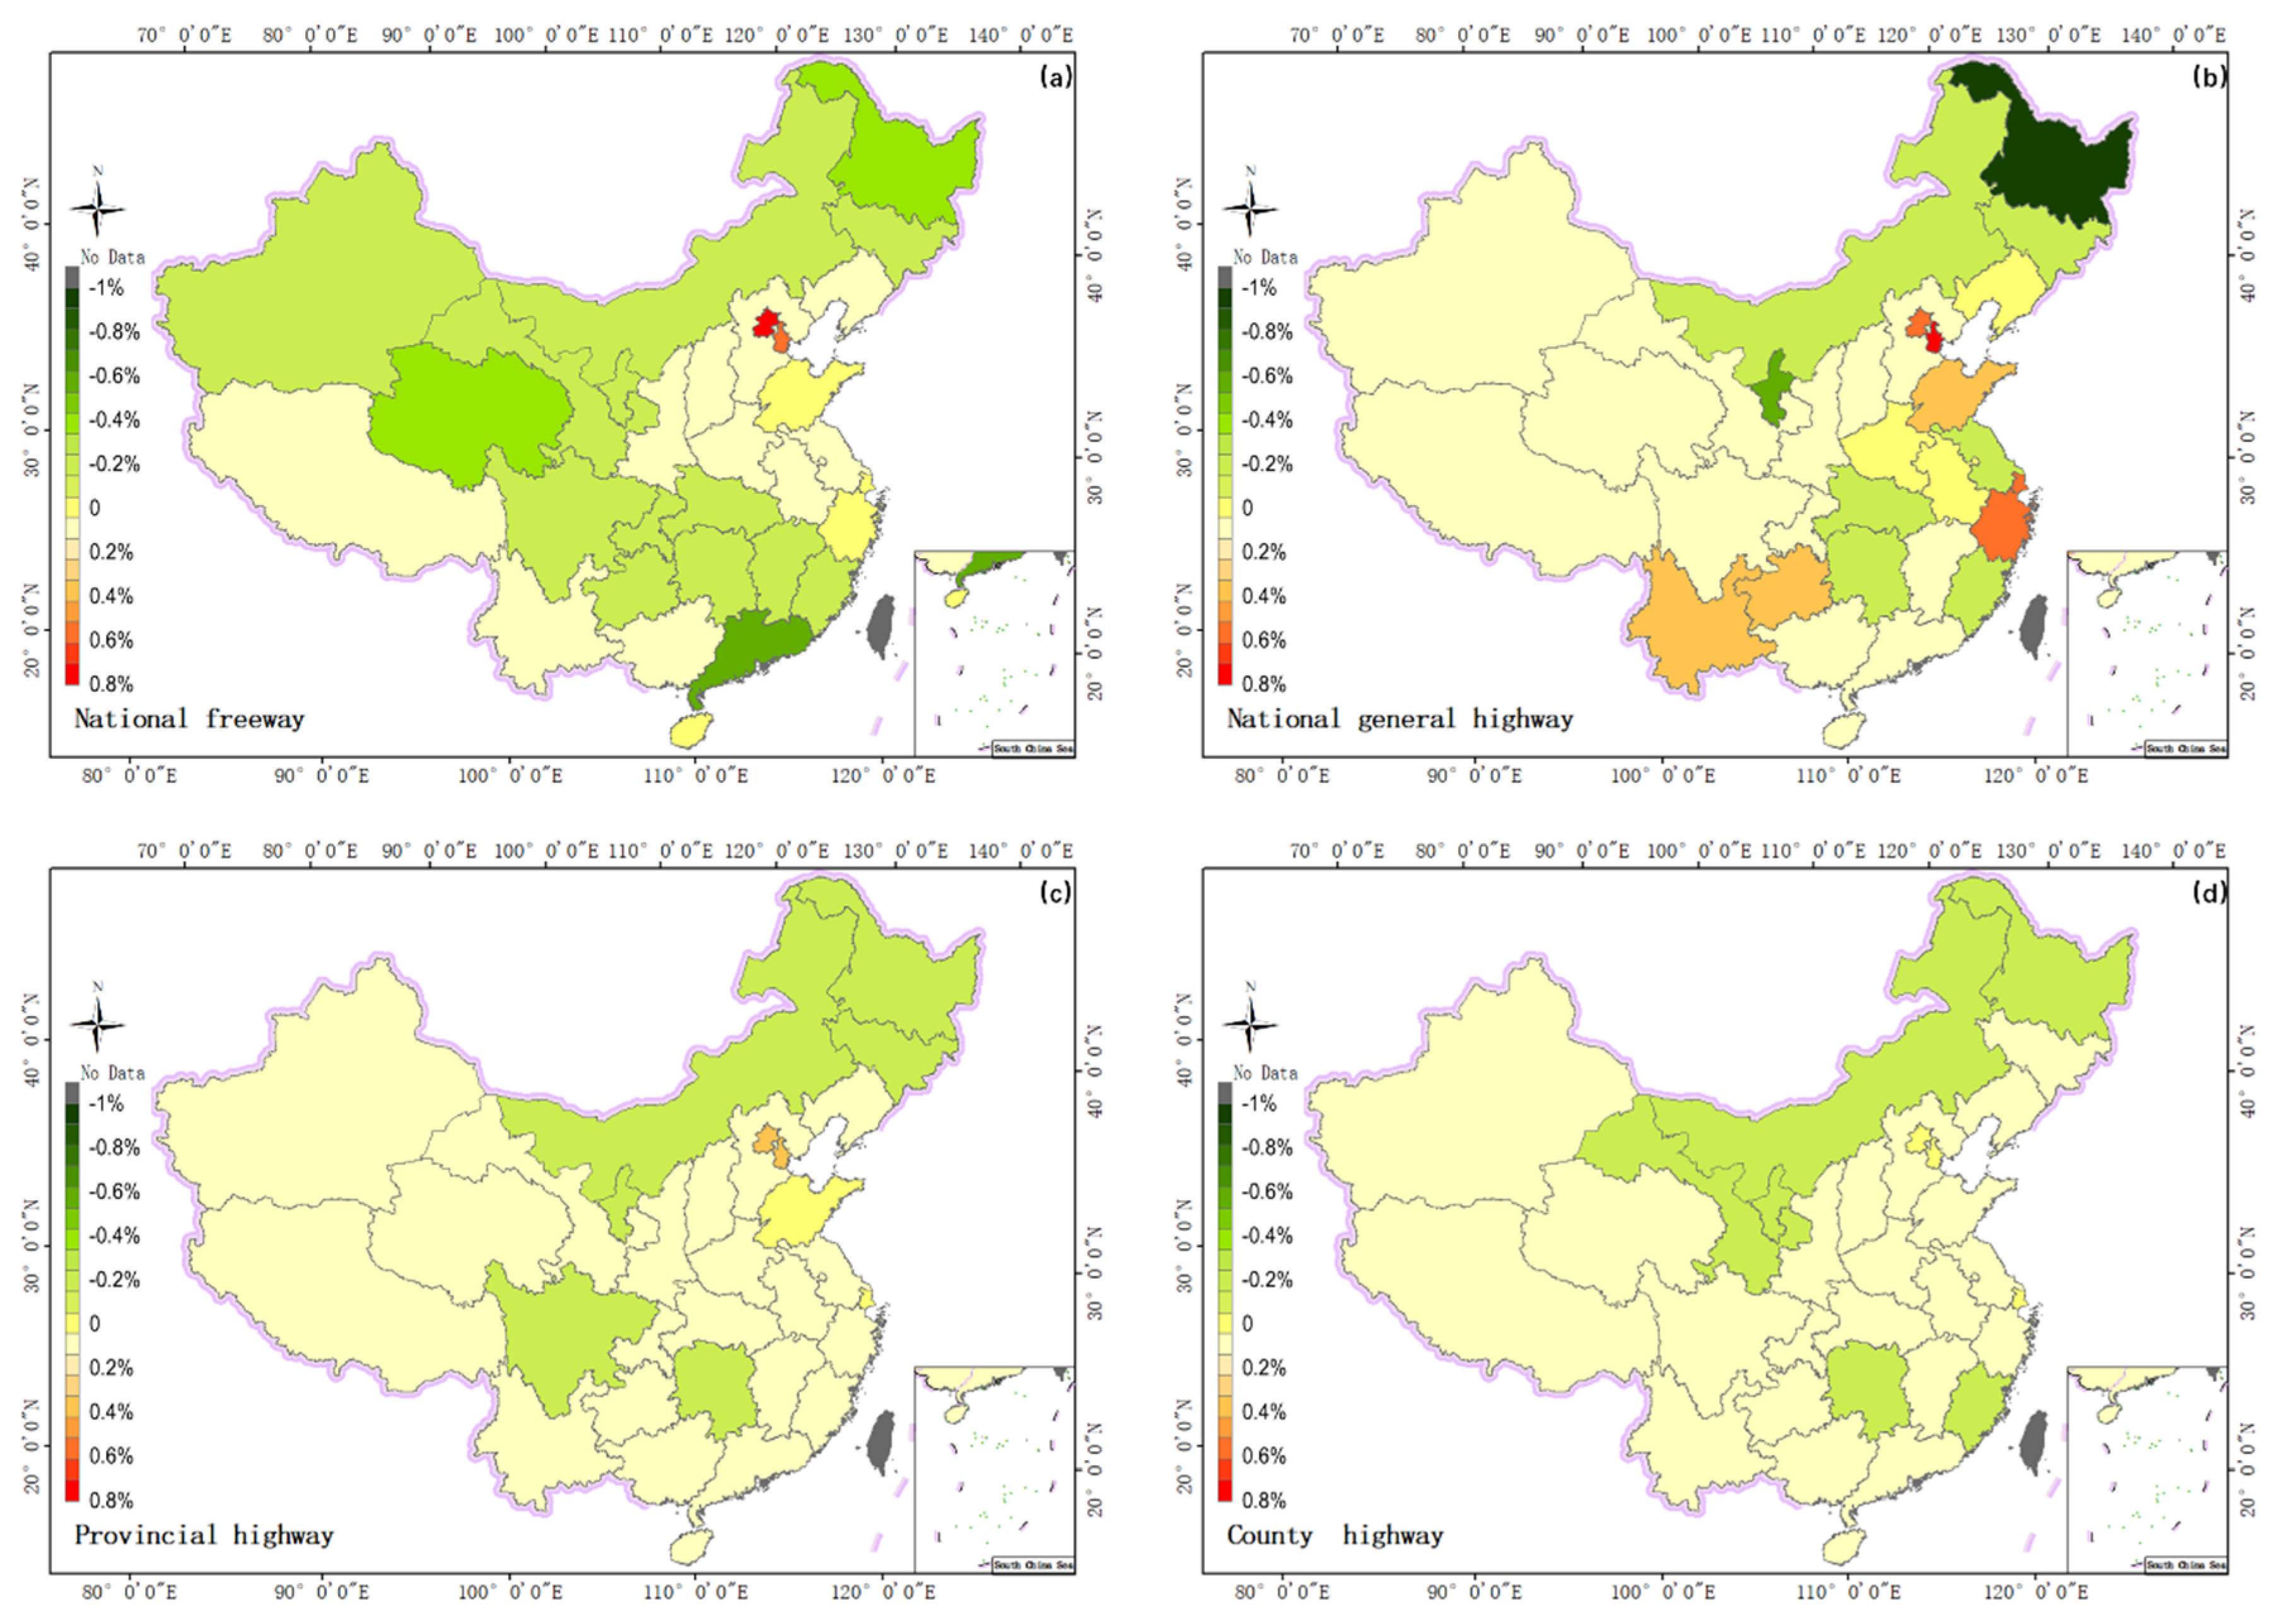
The results showed that there have been substantial changes in nighttime traffic prosperity of the four highways grades from 2015 to 2018 (Figure 14). Furthermore, the NTPIs of some provinces showed negative growth. The prosperity of traffic in underdeveloped provinces, such as Heilongjiang, Inner Mongolia, and Ningxia showed a decline to different degrees. Among them, the NTPI_NG of Heilongjiang suffer the most decline, with a 0.929% drop. NTPI of Tianjin (0.633%), Beijing (0.589%) and Jiangsu (0.320%) have a relatively significant growth from 2015 to 2018, and the NTPI_NF of Beijing increased by 0.895%.
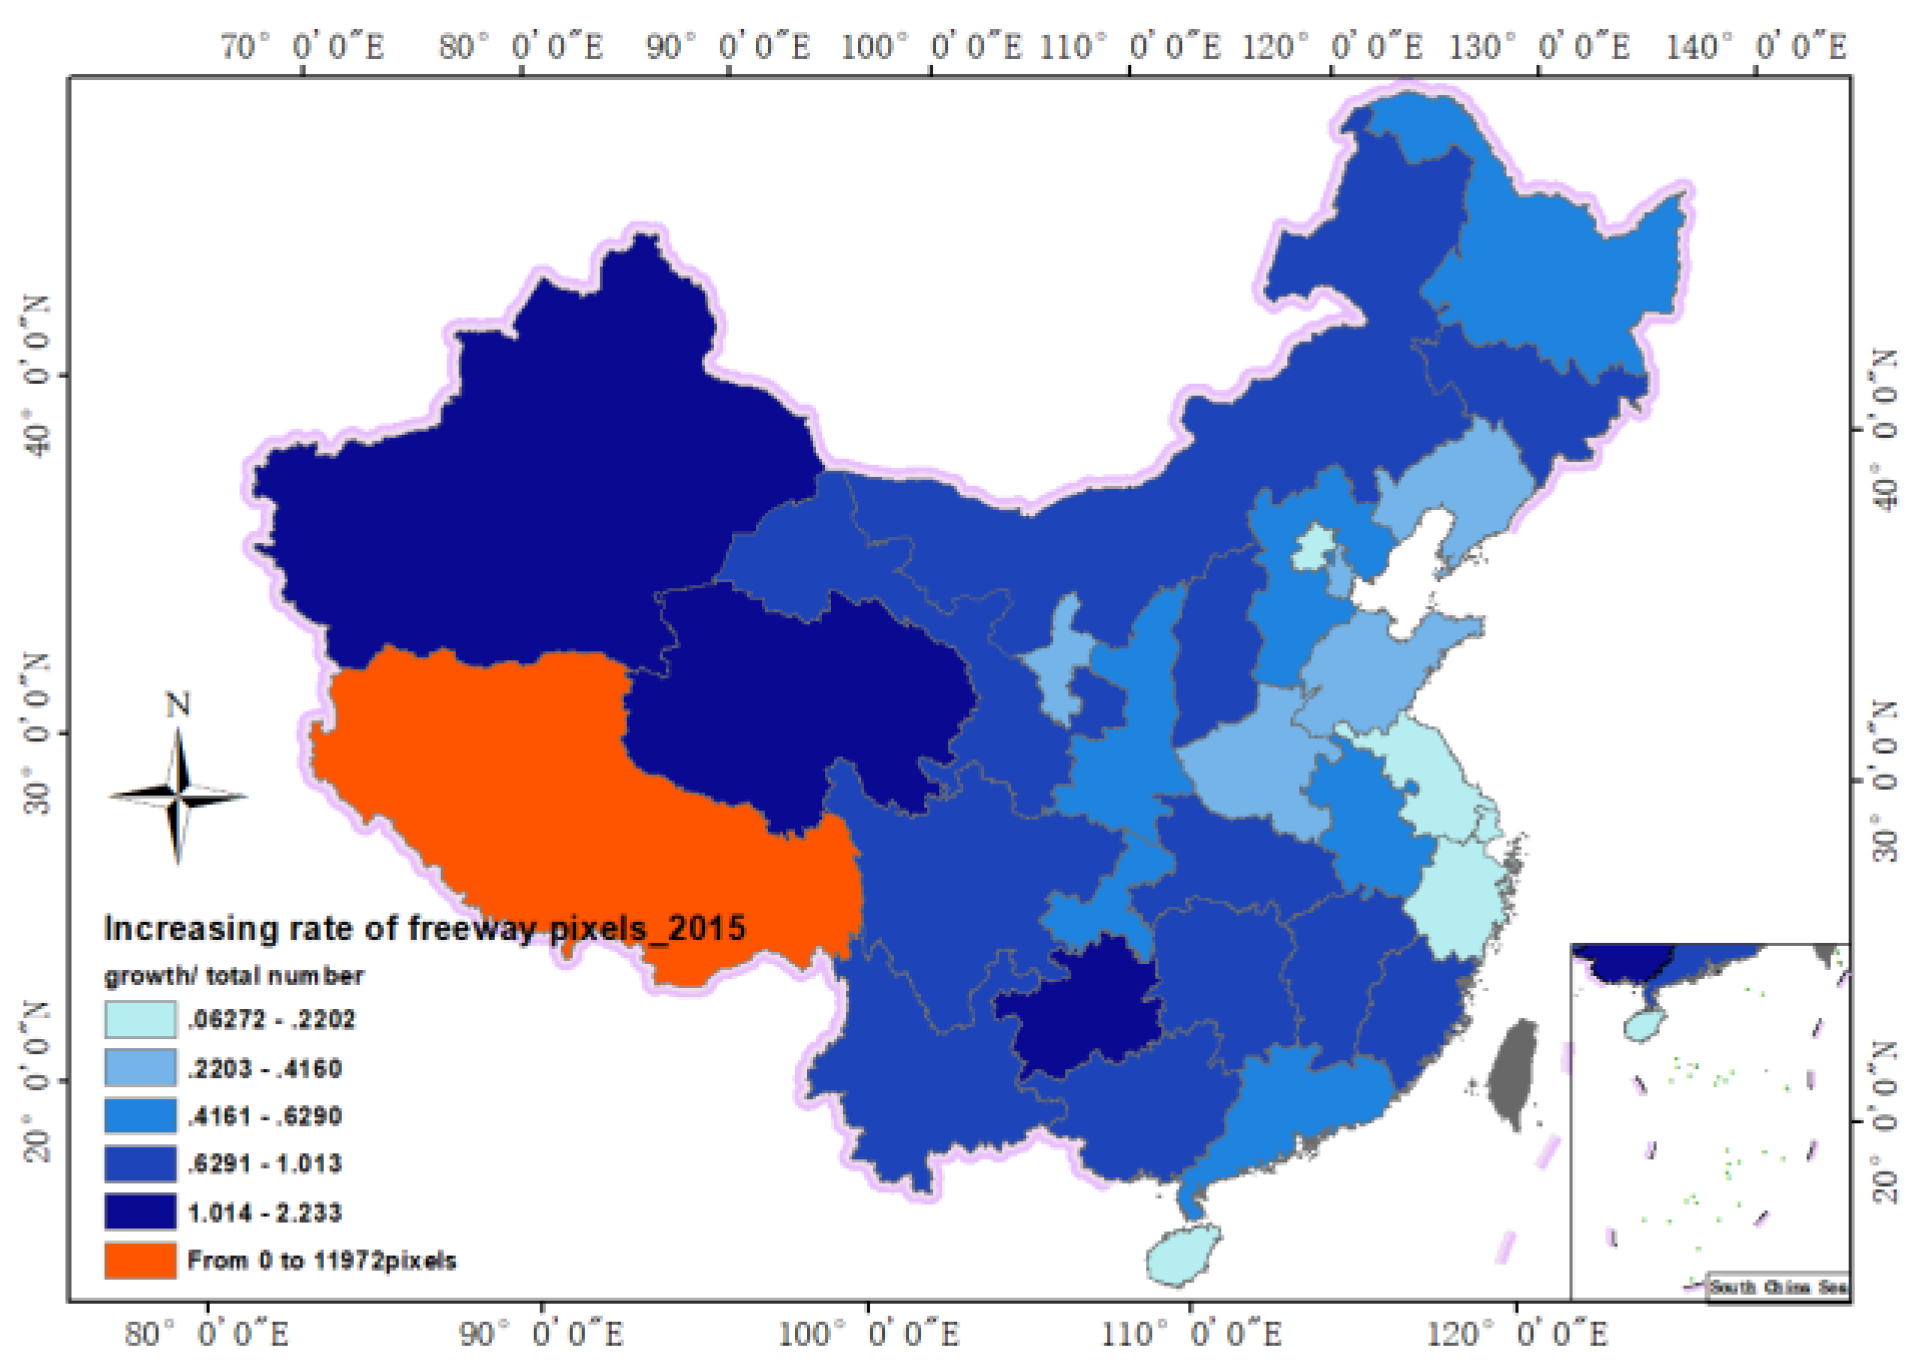
The construction of transportation facilities can promote the development of the regional economy while improving the regional economic development level requires the construction of transportation and other infrastructure, objectively. As a result of the interaction between transportation and regional economies, the regional economic structure has changed. Figure 15 showed the changes in the number of freeway/expressway pixels in the raster map from 2015 to 2018. Freeway mileages in all provinces increased to varying degrees, and freeway mileages in Tibet started from nothing.
According to the rule of causation in geography, a change in one factor in any geographic system causes a change in the whole system. On the one hand, a highway, with its strong capacity, high speed, flexible operating mode and other transport characteristics, greatly improved and enriched the transport capacity and content; on the other hand, the influence of freeways/expressways on regional economic development and layout is remarkable and profound. As explicitly pointed out by previous research, public infrastructure in vestment can change the equilibrium state of the region’s economy. It could lead to enhancing a region’s attractiveness, thereby affecting the decisions of firms and households in several ways. Much literature has sought to examine the commonly held belief that providing transportation infrastructure will spur economic development [40]. However, Figure 16 showed that not all the increases in freeway mileage caused positive stimulation in economic development. From 2015 to 2018, the length of expressways in underdeveloped regions, such as Inner Mongolia, Heilongjiang and Ningxia province, increased by 101.0%, 62.8%, 84.2% and 41.5%, respectively.
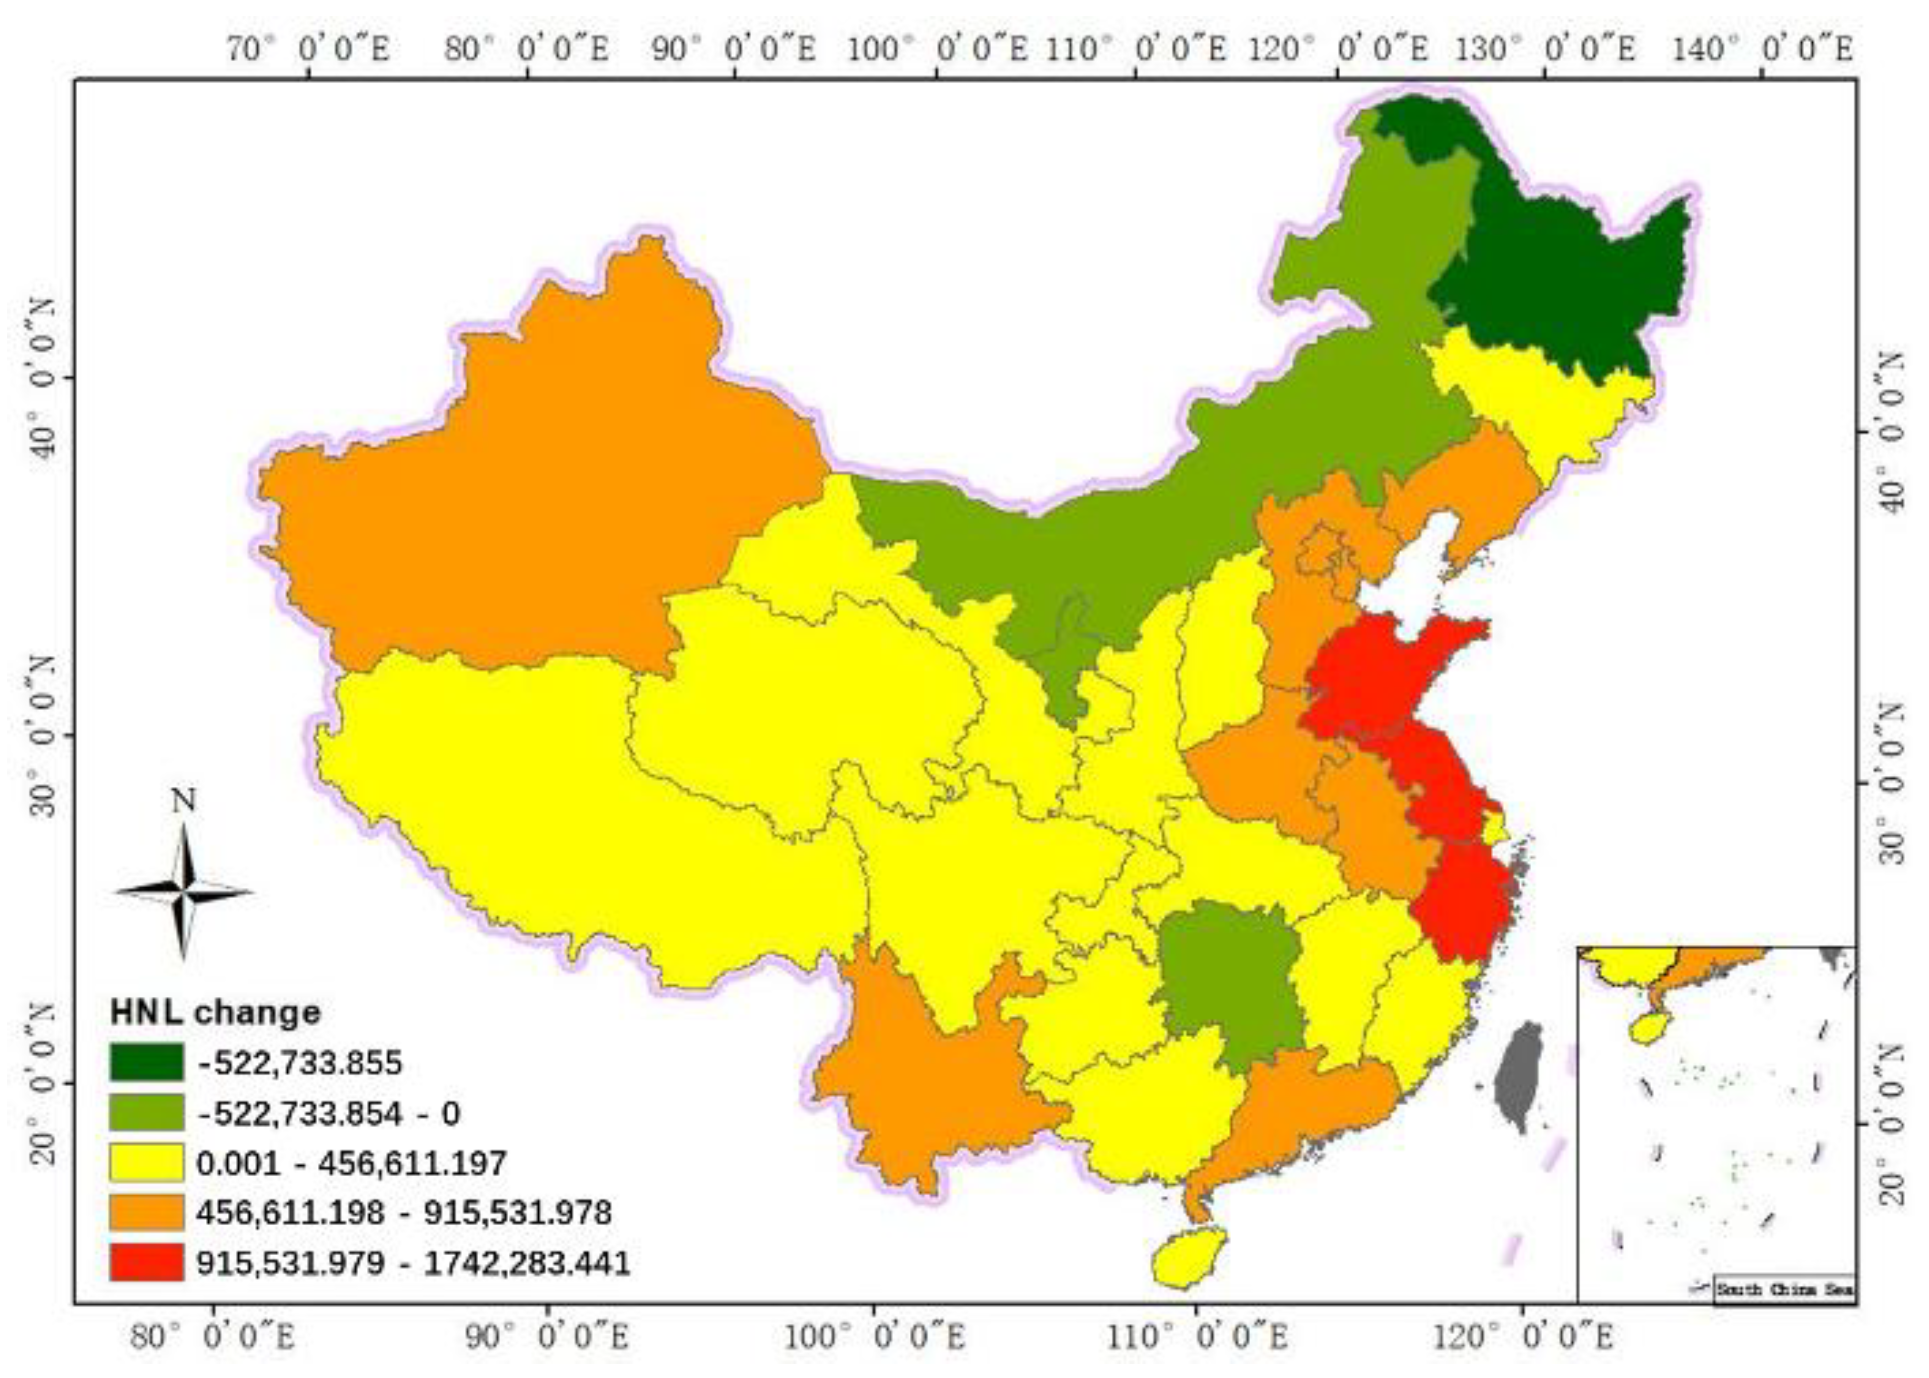
It did not increase the prosperity of road traffic at night. The case of China has proven the reverse effect of highways to economic development adequately. Some studies have shown that in underdeveloped areas, the growth of highway mileage will lead to the decline of some industries, such as the service industry [41]. This reverse effect resulted in a decrease in the total value of road lights at night, which led to a decrease in NTPI_NF in the area (Figure 14a). In Chongqing, Sichuan, and Guizhou, the total value of road lights rose while the prosperity of expressways declined, caused by the increase of roads. In Equation (3), the growth of n is faster than the increase of DN value. This type of province can be classified as a potential expressway economic belt in the field of highway research. Research shows that China’s highway growth has a two- or three-year delay in stimulating the economy [23]. In the mature highway economic belt, the growth of the highway mileage directly increases the prosperity of road traffic at night. Therefore, the increasing freeway mileage has increased the highway nighttime light directly.
6. Conclusions
Highways play an extremely important role in the development of national social economy and the formulation of strategic policy. However, for a long time, highway traffic state monitoring lacked effective data and measuring indicators. Based on nocturnal remote sensing technology, this study is the first to propose a highway-oriented method and provide reliable datasets for long-term monitoring of highway traffic of different grades. Resampling the nighttime light image to 50 m corresponds with the highway density and can be used in highway research. Based on a highway nighttime lighting dataset, two indices—HNL and NTPI—were proposed to evaluate the highway traffic condition across China from different views. The experimental results demonstrate that nighttime light data have a response to the vehicle lighting and the correlation coefficient of HNL and traffic flow volume of trucks and coach are 0.887 and 0.909, respectively. Through a case study of Mainland China, this research investigated the ability of HNL and TNL data to estimate GRDP at the provincial and prefectural levels. The linear regression analysis results reveal that HNL has better performance in estimating GRDP at the prefectural level. NTPI is a normalization index that reflects the traffic prosperity at the provincial and prefectural levels. This index is of significant value, especially for transportation planning. The spatial pattern of NTPI in China is stronger on the east side and sparse on the west side, corresponding with the development pattern. NTPI showed a stronger correlation in GDP per capita, consumption per capita, and population with R of 0.772, 0.895 and 0.968. In addition, there have been substantial changes in highway nighttime traffic prosperity from 2015 to 2018.
Despite the great progress in recent years, nighttime light remote sensing is still in an early stage of development. A Physical model is still needed to build a quantitative linkage between nighttime light imagery and real light generation. Moreover, the availability of high-quality data remains limited. With the development of noctilucent remote sensing technology, remote sensing is expected to give a great contribution to the research of traffic and transportation.
Author Contributions
Conceptualization, S.W. and Y.C.; methodology, S.W., Y.C. and Y.Z.; validation, Y.C.; formal analysis, Y.C.; investigation, Y.C.; resources, F.W. and L.W; data curation, Y.C.; writing—original draft preparation, Y.C.; writing—review and editing, L.W. and Y.C; visualization, Y.C.; supervision, S.W. and Y.Z. All author read and approved the final manuscript. All authors have read and agreed to the published version of the manuscript.
Funding
This research was funded by National Key Research and Development Program of China (2017YFB0504000 and 2017YFB0503805).
Acknowledgments
We sincerely thank Shang Ming, Yang Baolin and Yao Yao, Aerospace information research Institute, Chinese Academy of Science, for technical support. Moreover, this paper has benefit from valuable comments and suggestions by anonymous reviewers, and our editor, who efforts are gratefully acknowledge.
Conflicts of Interest
The authors declare no conflict of interest.
References
- Forkenbrock, D.J.; Foster, N.S.J. Economic benefits of a corridor highway investment. Transp. Res. Part A Gen. 1990, 24, 303–312. [Google Scholar] [CrossRef]
- Arbués, P.; Baños, J.F.; Mayor, M. The spatial productivity of transportation infrastructure. Transp. Res. Part A Policy Pract. 2015, 75, 166–177. [Google Scholar] [CrossRef]
- Jiwattanakulpaisarn, P.; Noland, R.B.; Graham, D.J. Causal linkages between highways and sector-level employment. Transp. Res. Part A Policy Pract. 2010, 44, 265–280. [Google Scholar] [CrossRef]
- Kawasaki, S. The challenges of transportation/traffic statistics in Japan and directions for the future. IATSS Res. 2015, 39, 1–8. [Google Scholar] [CrossRef] [Green Version]
- Vickerman, R. Location, accessibility and regional development: The appraisal of trans-European networks. Transp. Policy 1995, 2, 225–234. [Google Scholar] [CrossRef] [Green Version]
- Huarong, Q. Comparative Study of Freeway Transportation in China and United States. Transp. Enterp. Manag. 2009, 24, 69–70. [Google Scholar]
- Hoogendoorn, S.P.; Van Zuylen, H.J.; Schreuder, M.; Gorte, B.; Vosselman, G. Microscopic Traffic Data Collection by Remote Sensing. Transp. Res. Rec. 2003, 1855, 121–128. [Google Scholar] [CrossRef]
- Atzberger, C. Advances in Remote Sensing of Agriculture: Context Description, Existing Operational Monitoring Systems and Major Information Needs. Remote Sens. 2013, 5, 949–981. [Google Scholar] [CrossRef] [Green Version]
- Rogan, J.; Chen, D. Remote sensing technology for mapping and monitoring land-cover and land-use change. Prog. Plan. 2004, 61, 301–325. [Google Scholar] [CrossRef]
- Li, X.; Elvidge, C.; Zhou, Y.; Cao, C.; Warner, T. Remote sensing of night-time light. Int. J. Remote Sens. 2017, 38, 5855–5859. [Google Scholar] [CrossRef] [Green Version]
- Amaral, S.; Câmara, G.; Monteiro, A.M.V.; Quintanilha, J.A.; Elvidge, C.D. Estimating population and energy consumption in Brazilian Amazonia using DMSP night-time satellite data. Comput. Environ. Urban Syst. 2005, 29, 179–195. [Google Scholar] [CrossRef]
- Bennie, J.; Davies, T.W.; Duffy, J.P.; Inger, R.; Gaston, K.J. Contrasting trends in light pollution across Europe based on satellite observed night time lights. Sci. Rep. 2014, 4, 3789. [Google Scholar] [CrossRef] [PubMed] [Green Version]
- Sutton, P.; Roberts, D.; Elvidge, C.; Baugh, K. Census from Heaven: An estimate of the global human population using night-time satellite imagery. Int. J. Remote Sens. 2010, 22, 3061–3076. [Google Scholar] [CrossRef]
- Zhizhin, M.N.; Poyda, А.А.; Tyutlyaeva, E.O.; Konoplev, V.V.; Elvidge, C.D. Monitoring of night fishing boat lights with VIIRS. Curr. Probl. Remote Sens. Earth Space 2018, 15, 101–119. [Google Scholar] [CrossRef]
- Keola, S.; Andersson, M.; Hall, O. Monitoring Economic Development from Space: Using Nighttime Light and Land Cover Data to Measure Economic Growth. World Dev. 2015, 66, 322–334. [Google Scholar] [CrossRef]
- Li, X.; Xu, H.; Chen, X.; Li, C. Potential of NPP-VIIRS Nighttime Light Imagery for Modeling the Regional Economy of China. Remote Sens. 2013, 5, 3057–3081. [Google Scholar] [CrossRef] [Green Version]
- Levin, N.; Zhang, Q. A global analysis of factors controlling VIIRS nighttime light levels from densely populated areas. Remote Sens. Environ. 2017, 190, 366–382. [Google Scholar] [CrossRef] [Green Version]
- Zhu, X.; Ma, M.; Yang, H.; Ge, W. Modeling the Spatiotemporal Dynamics of Gross Domestic Product in China Using Extended Temporal Coverage Nighttime Light Data. Remote Sens. 2017, 9. [Google Scholar] [CrossRef] [Green Version]
- Ma, T. An Estimate of the Pixel-Level Connection between Visible Infrared Imaging Radiometer Suite Day/Night Band (VIIRS DNB) Nighttime Lights and Land Features across China. Remote Sens. 2018, 10. [Google Scholar] [CrossRef] [Green Version]
- Zhang, B.; Wang, J. Highway traffic performance and the development of service industry: Empolyment effects of the national trunk highways in western China. Financ. Trade Econ. 2016, 37, 131–145. [Google Scholar]
- McDonald, J.F.; d’Ouville, E.L.; Liu, L.N. Economics of Urban Highway Congestion and Pricing; Springer: Boston, MA, USA, 1999; pp. 67–83. [Google Scholar]
- Elvidge, C.D.; Baugh, K.; Zhizhin, M.; Hsu, F.C.; Ghosh, T. VIIRS night-time lights. Int. J. Remote Sens. 2017, 38, 5860–5879. [Google Scholar] [CrossRef]
- Xu, H.; Li, J.; Yang, Y. Relationship between highway transportation and economic development in China. J. Chang’an Univ. 2007, 9, 8–13. [Google Scholar]
- Croft, T.A. The Brightness of Lights on Earth at Night, Digitally Recorded by DMSP Satellite; US Geological Survey: Reston, VA, USA, 1979; pp. 80–167.
- Baugh, K.; Hsu, F.-C.; Elvidge, C.D.; Zhizhin, M. Nighttime Lights Compositing Using the VIIRS Day-Night Band: Preliminary Results. Proc. Asia Pac. Adv. Netw. 2013, 35, 70–86. [Google Scholar] [CrossRef] [Green Version]
- Elvidge, C.; Zhizhin, M.; Baugh, K.; Hsu, F.-C. Automatic Boat Identification System for VIIRS Low Light Imaging Data. Remote Sens. 2015, 7, 3020–3036. [Google Scholar] [CrossRef] [Green Version]
- Elvidge, C.D.; Ghosh, T.; Baugh, K.; Zhizhin, M.; Hsu, F.-C.; Katada, N.S.; Penalosa, W.; Hung, B.Q. Rating the Effectiveness of Fishery Closures With Visible Infrared Imaging Radiometer Suite Boat Detection Data. Front. Mar. Sci. 2018, 5, 132. [Google Scholar] [CrossRef]
- Elvidge, C.D.; Baugh, K.E.; Zhizhin, M.; Hsu, F.-C. Why VIIRS data are superior to DMSP for mapping nighttime lights. Proc. Asia Pac. Adv. Netw. 2013, 35, 62. [Google Scholar] [CrossRef] [Green Version]
- Miller, S.D.; Mills, S.P.; Elvidge, C.D.; Lindsey, D.T.; Lee, T.F.; Hawkins, J.D. Suomi satellite brings to light a unique frontier of nighttime environmental sensing capabilities. Proc. Natl. Acad. Sci. USA 2012, 109, 15706–15711. [Google Scholar] [CrossRef] [Green Version]
- Jiang, W.; He, G.; Long, T.; Liu, H. Ongoing Conflict Makes Yemen Dark: From the Perspective of Nighttime Light. Remote Sens. 2017, 9, 798. [Google Scholar] [CrossRef] [Green Version]
- Huang, Q.; Yang, X.; Gao, B.; Yang, Y.; Zhao, Y. Application of DMSP/OLS Nighttime Light Images: A Meta-Analysis and a Systematic Literature Review. Remote Sens. 2014, 6, 6844–6866. [Google Scholar] [CrossRef] [Green Version]
- Chen, Z.; Yu, B.; Ta, N.; Shi, K.; Yang, C.; Wang, C.; Zhao, X.; Deng, S.; Wu, J. Delineating Seasonal Relationships Between Suomi NPP-VIIRS Nighttime Light and Human Activity Across Shanghai, China. IEEE J. Sel. Top. Appl. Earth Obs. Remote Sens. 2019, 1–9. [Google Scholar] [CrossRef]
- Briggs, D.J.; Gulliver, J.; Fecht, D.; Vienneau, D.M. Dasymetric modelling of small-area population distribution using land cover and light emissions data. Remote Sens. Environ. 2007, 108, 451–466. [Google Scholar] [CrossRef]
- Gong, J. Clarifying the Standard Deviational Ellipse. Geogr. Anal. 2002, 34, 155–167. [Google Scholar] [CrossRef]
- Wang, B.; Shi, W.; Miao, Z. Confidence Analysis of Standard Deviational Ellipse and Its Extension into Higher Dimensional Euclidean Space. PLoS ONE 2015, 10, e0118537. [Google Scholar] [CrossRef] [PubMed]
- Li, D.; Yu, H.; Li, X. The Sparial Temporal Pattern Analysis of City Development in Countries along the Belt and Road Initiative Based on Nighttime Light Data. Geomat. Inf. Sci. Wuhan Univ. 2017, 42, 711–720. [Google Scholar] [CrossRef]
- Zenglin, H.; Fei, Y.; Xiaojun, Z. Formation and evolution mechanism of economic zones along expressways and their allocation and planning. Geogr. Res. 2001, 20, 471–478. [Google Scholar]
- Cinzano, P. The growth of light pollution in North-Eastern Italy from 1960 to 1995. Mem. Della Soc. Astron. Ital. 2000, 71, 159. [Google Scholar]
- Lawrence, W.T.; Imhoff, M.L.; Kerle, N.; Stutzer, D. Quantifying urban land use and impact on soils in Egypt using diurnal satellite imagery of the Earth surface. Int. J. Remote Sens. 2002, 23, 3921–3937. [Google Scholar] [CrossRef]
- Button, K. Infrastructure investment, endogenous growth and economic convergence. Ann. Reg. Sci. 1998, 32, 145–162. [Google Scholar] [CrossRef]
- Cohen, J.P.; Paul, C.J.M. Public Infrastructure Investment, Interstate Spatial Spillovers, and Manufacturing Costs. Rev. Econ. Stat. 2004, 86, 551–560. [Google Scholar] [CrossRef]
Figure 1.
The 2015 highway electronic vector map: (a,b) are the national highway vector maps; (c) is the provincial highway vector map; (d) is the county highway vector map.
Figure 1.
The 2015 highway electronic vector map: (a,b) are the national highway vector maps; (c) is the provincial highway vector map; (d) is the county highway vector map.

Figure 2.
The 2015 VIIRS Cloud Mask-nighttime light (VNL) in China (1. Anhui, 2. Beijing, 3. Fujian, 4. Gansu, 5. Guangxi, 6. Guangzhou, 7. Guizhou, 8. Hainan, 9. Hebei, 10. Heilongjiang, 11. Henan, 12. Hubei, 13. Hunan, 14. Inner Mongolia, 15. Jiangsu, 16. Jiangxi, 17. Jilin, 18. Liaoning, 19. Ningxia, 20. Qinghai, 21. Shaanxi, 22. Shandong, 23. Shanghai, 24. Shanxi, 25. Sichuan, 26. Tianjin, 27. Tibet, 28. Xinjiang, 29. Yunnan, 30. Zhejiang, 31. Chongqing, 32. Hongkong, 33. Macao, 34. Taiwan).

Figure 3.
Zoom-in map of the sample area: (a) sample area on Google Map; (b) corresponding pixel in VNL image.
Figure 3.
Zoom-in map of the sample area: (a) sample area on Google Map; (b) corresponding pixel in VNL image.

Figure 4.
The frame structure of the paper.

Figure 5.
Schematic diagram of highway pixel density.

Figure 6.
Highway pixel density: (a) The original-size HPD and HPD_100; (b) The road density and HPD_50.
Figure 6.
Highway pixel density: (a) The original-size HPD and HPD_100; (b) The road density and HPD_50.

Figure 7.
Highway nighttime lightmaps: (a) is the 2015 freeway nighttime light maps of China, (b) is the 2015 national general highway nighttime light map of China, (c) is the 2015 freeway nighttime light maps of China, (d) is the 2015 freeway nighttime light maps of China.
Figure 7.
Highway nighttime lightmaps: (a) is the 2015 freeway nighttime light maps of China, (b) is the 2015 national general highway nighttime light map of China, (c) is the 2015 freeway nighttime light maps of China, (d) is the 2015 freeway nighttime light maps of China.

Figure 8.
2015 highway nighttime light maps: (a) Anhui and (b) Beijing.

Figure 9.
Histogram of the highway nighttime lights: (a) National freeway; (b) National general highway; (c) Provincial highway; (d) County highway.
Figure 9.
Histogram of the highway nighttime lights: (a) National freeway; (b) National general highway; (c) Provincial highway; (d) County highway.

Figure 10.
The scatter diagrams for linear regression analysis in provincial units: (a) The traffic flow of coach and NFNL, (b) The traffic flow of coach and TNL, (c) The traffic flow of trunk and NFNL, (d) The traffic flow of trunk and TNL.
Figure 10.
The scatter diagrams for linear regression analysis in provincial units: (a) The traffic flow of coach and NFNL, (b) The traffic flow of coach and TNL, (c) The traffic flow of trunk and NFNL, (d) The traffic flow of trunk and TNL.


Figure 11.
The spatial distribution of NTPI for four highway grades.

Figure 12.
The standard deviation ellipse distribution of NTPI for four highway grades: (a) is the SDE of NTPI for national freeway; (b) is the SDE of NTPI for national general highway; (c) is the SDE of NTPI for provincial highway; (d) is the SDE of NTPI for county highway.
Figure 12.
The standard deviation ellipse distribution of NTPI for four highway grades: (a) is the SDE of NTPI for national freeway; (b) is the SDE of NTPI for national general highway; (c) is the SDE of NTPI for provincial highway; (d) is the SDE of NTPI for county highway.

Figure 13.
The scatter diagram of linear regression analysis: (a) The GRDP and TNL in provincial units, (b) The GRDP and HNL in provincial units, (c) The GRDP and TNL in prefectural units, (d) The GRDP and HNL. In prefectural units.
Figure 13.
The scatter diagram of linear regression analysis: (a) The GRDP and TNL in provincial units, (b) The GRDP and HNL in provincial units, (c) The GRDP and TNL in prefectural units, (d) The GRDP and HNL. In prefectural units.

Figure 14.
The highway traffic prosperity temporal changes from 2015 to 2018: (a) is the traffic prosperity temporal changes of national freeway; (b) is the traffic prosperity temporal changes of national general highway; (c) is the traffic prosperity temporal changes of provincial highway; (d) is the traffic prosperity temporal changes of county highway.

Figure 15.
Changes in number freeway pixels.

Figure 16.
Changes in the highway nighttime light.


Table 1.
List of dataset and source in the study.
| Datasets | Resolution | Time | Source |
|---|---|---|---|
| National Freeway/expressway Electronic vector map (NFVM) | Country level | 2015 2018 | Ministry of transport of China |
| National General Highway Electronic vector map (NGVM) | Country level | 2015 2018 | Ministry of transport of China |
| Provincial Highway Electronic vector map (PHVM) | Country level | 2015 2018 | Ministry of transport of China |
| County Highway Electronic vector map (CHVM) | Country level | 2015 2018 | Ministry of transport of China |
| Administrative boundary maps | County level | 2015 | NFGIS, CHN |
| VIIRS Cloud Mask—nighttime lights (VNL) | about 500 m | 2015 | NOAA/NCEL |
| Monthly average NPP-VIIRS nighttime light data | about 500 m | 2015–2019 | NOAA/NCEL |
| Census data(GRDP; GRDP per capita; Consumption per capita; Population) | Provincial and prefectural level | 2015 | National Bureau of Statistics of China |
| Density of road | National and provincial level | 2015 | Ministry of transport of China |
| Traffic flow | Provincial level | 2019 | Ministry of transport of China |
| Points of interest (POIs) | - | Google Map | |
Table 2.
The statistics information of resample results at different spatial resolution.
| Resample Size | Count | Sum | Mean | Std. Dev. | |
|---|---|---|---|---|---|
| VNL | China | 38,194,708 | 8,236,237 | 0.216 | 2.669 |
| (Original image) | NFNL | 274,800 | 560,970 | 2.041 | 5.605 |
| - | NGNL | 260,047 | 738,061 | 2.838 | 7.557 |
| - | PHNL | 590,673 | 1,406,010 | 2.380 | 7.395 |
| - | CHNL | 984,862 | 1,559,816 | 1.584 | 6.244 |
| VNL_100 | China | 921,701,358 | 201,031,936 | 0.218 | 2.472 |
| (Resample to 100 m) | NFNL | 7,302,145 | 14,290,057 | 1.957 | 5.611 |
| - | NGNL | 6,905,859 | 19,351,407 | 2.802 | 7.512 |
| - | PHNL | 15,706,409 | 36,126,596 | 2.300 | 7.328 |
| - | CHNL | 26,250,119 | 41,864,136 | 1.595 | 6.126 |
| VNL_50 | China | 3,783,460,666 | 1,137,817,395 | 0.301 | 2.668 |
| (Resample to 50 m) | NFNL | 3,686,057 | 8,815,206 | 2.311 | 5.982 |
| - | NGNL | 2,826,415 | 9,050,142 | 3.202 | 8.093 |
| - | PHNL | 6,408,907 | 18,015,294 | 2.811 | 8.252 |
| - | CHNL | 10,661,262 | 21,008,913 | 1.971 | 6.808 |
Table 3.
List of the maximum points of the four highway grades nighttime light.
| - | National Freeway | General Highway | Provincial Highway | County Highway |
|---|---|---|---|---|
| The Maximum Coordinate LocationImage | 155.759 (116.580309, 40.076508) Beijing Airporta1 | 120.156 (114.25123, 30.616909) Hankou Stationb1 | 264.468 (113.301991, 23.388259) Guangzhou Airportc1 | 259.611 (108.085206, 35.879778) X020 highwayd1 |
| - |  |  |  |  |
Table 4.
Descriptive statistics of standard deviation ellipse (SDE).
| - | Median Center | Mean Center | |||
|---|---|---|---|---|---|
| Grade | X Coordinate | Y Coordinate | Center X | Center Y | Std. Dist. |
| National freeway | 115.280 | 30.887 | 113.629 | 31.485 | 10.338 |
| National general highway | 115.315 | 30.816 | 113.483 | 31.483 | 10.612 |
| Provincial highway | 115.262 | 30.955 | 114.008 | 31.474 | 10.260 |
| County highway | 116.007 | 30.984 | 114.422 | 31.646 | 10.867 |
Table 5.
Correlation between MNL, HNTPI, and social-economic parameters.
| Index | - | GDP per Capita | Consumption per Capita | Population |
|---|---|---|---|---|
| MNL | Pearson correlation | 0.736 ** | 0.849 ** | 0.979 ** |
| - | significance | < 0.0001 | < 0.0001 | < 0.0001 |
| HNTPI | Pearson correlation | 0.772 ** | 0.895 ** | 0.968 ** |
| - | significance | < 0.0001 | < 0.0001 | < 0.0001 |
** The correlation was significant at the 0.01 level (double-tailed).
© 2019 by the authors. Licensee MDPI, Basel, Switzerland. This article is an open access article distributed under the terms and conditions of the Creative Commons Attribution (CC BY) license (http://creativecommons.org/licenses/by/4.0/).
Share and Cite
MDPI and ACS Style
Chang, Y.; Wang, S.; Zhou, Y.; Wang, L.; Wang, F. A Novel Method of Evaluating Highway Traffic Prosperity Based on Nighttime Light Remote Sensing. Remote Sens. 2020, 12, 102. https://doi.org/10.3390/rs12010102
AMA Style
Chang Y, Wang S, Zhou Y, Wang L, Wang F. A Novel Method of Evaluating Highway Traffic Prosperity Based on Nighttime Light Remote Sensing. Remote Sensing. 2020; 12(1):102. https://doi.org/10.3390/rs12010102
Chicago/Turabian StyleChang, Ying, Shixin Wang, Yi Zhou, Litao Wang, and Futao Wang. 2020. "A Novel Method of Evaluating Highway Traffic Prosperity Based on Nighttime Light Remote Sensing" Remote Sensing 12, no. 1: 102. https://doi.org/10.3390/rs12010102
Note that from the first issue of 2016, this journal uses article numbers instead of page numbers. See further details here.