An Object Similarity-Based Thresholding Method for Urban Area Mapping from Visible Infrared Imaging Radiometer Suite Day/Night Band (VIIRS DNB) Data


Institute of Remote Sensing and GIS, School of Earth and Space Sciences, Peking University, Beijing 100871, China
*
Author to whom correspondence should be addressed.
Remote Sens. 2018, 10(2), 263; https://doi.org/10.3390/rs10020263
Submission received: 18 November 2017
/
Revised: 27 January 2018
/
Accepted: 6 February 2018
/
Published: 8 February 2018
(This article belongs to the Special Issue Remote Sensing of Night Lights – Beyond DMSP)
Abstract
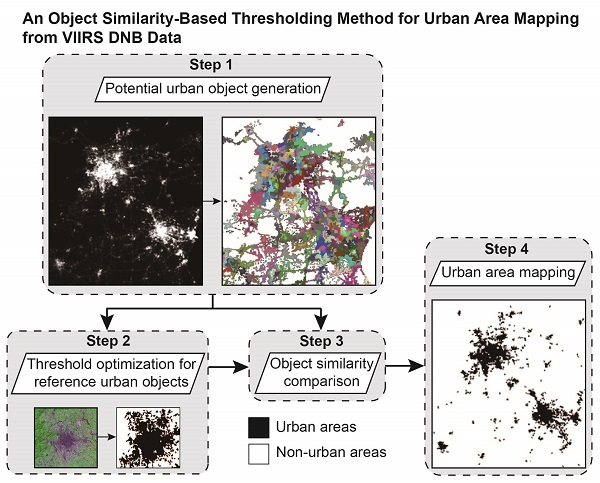
:Nighttime light data from the Visible Infrared Imaging Radiometer Suite (VIIRS) Day/Night Band (DNB) provides a unique data source for mapping and monitoring urban areas at regional and global scales. This study proposes an object similarity-based thresholding method using VIIRS DNB data to map urban areas. The threshold for a target potential urban object was determined by comparing its similarity with all reference urban objects with known optimal thresholds derived from Landsat data. The proposed method includes four major steps: potential urban object generation, threshold optimization for reference urban objects, object similarity comparison, and urban area mapping. The proposed method was evaluated using VIIRS DNB data of China and compared with existing mapping methods in terms of threshold estimation and urban area mapping. The results indicated that the proposed method estimated thresholds and mapped urban areas accurately and generally performed better than the cluster-based logistic regression method. The correlation coefficients between the estimated thresholds and the reference thresholds were 0.9201–0.9409 (using Euclidean distance as similarity measure) and 0.9461–0.9523 (using Mahalanobis distance as similarity measure) for the proposed method and 0.9435–0.9503 for the logistic regression method. The average Kappa Coefficients of the urban area maps were 0.58 (Euclidean distance) and 0.57 (Mahalanobis distance) for the proposed method and 0.51 for the logistic regression method. The proposed method shows potential to map urban areas at a regional scale effectively in an economic and convenient way.

1. Introduction
Although only occupying less than 3% of Earth’s terrestrial surface, urban areas have accommodated more than half of the global population by 2015 [1] and have exerted enormous influence on their surroundings [2,3]. Urbanization in the past four decades has created great opportunities for anthropogenic social development and also has driven dramatic changes in land use and land cover, biodiversity, hydrosystems, atmosphere, and ecosystems, as well as climate, locally to regionally [4,5]. Thus, accurate and timely updated information on the spatial extent and dynamics of urban areas at regional and global scales is vital for analyzing the impact of urban areas and understanding urbanization dynamics.
Remote sensing provides a powerful data source for mapping urban areas and monitoring urbanization dynamics at different scales. High- to medium-resolution images with relatively high cost, limited scene extent, and long revisit period, such as QuickBird, IKONOS, and Landsat series images, are widely utilized in urban area mapping for local regions [6,7,8]. Moderate- and coarse-resolution images are more effective for the extraction of urban areas at regional and global scales [9,10,11,12] because of wide coverage and high temporal resolution. In recent years, nighttime light data of coarse resolution, capturing information on human activities, have been widely available and providing unique and valuable data sources for mapping urban areas and monitoring urbanization dynamics. The Defense Meteorological Satellite Program/Operational Linescan System (DMSP/OLS) has been collecting nighttime light emission from the earth surface since 1992, and its recorded nighttime light (NTL) data have been widely used in urban area mapping and monitoring [13,14,15,16,17,18]. The Day/Night Band (DNB) from Visible Infrared Imaging Radiometer Suite (VIIRS) sensor, onboard the Suomi National Polar-Orbiting Partnership (NPP), which was launched in October 2011, presents an unprecedented night observation capability [19]. Compared with its predecessor (DMSP/OLS), VIIRS DNB performs better at ground footprint, quantization, and calibration [20,21,22]. In particular, VIIRS DNB has a broader radiometric measurement range and outperforms at low-light detection, which significantly reduces the saturation and over-glow problem inherent to DMSP/OLS data [20,21].
Because of the improved performance, VIIRS DNB data have been used in various applications, such as extracting urban areas [23,24,25,26,27], reflecting demographic and socioeconomic conditions [25,28,29,30,31,32,33], monitoring nocturnal surface air quality [34,35,36], and so on [26,37,38,39,40,41].
The methods for extracting urban areas with VIIRS DNB data developed so far are generally categorized into two types, i.e., classification method and thresholding method. Zhang et al. [42] explored a one-class classifier named support vector data description (SVDD) to map urban extent, using VIIRS DNB and normalized difference vegetation index (NDVI) data, but the global and uniform parameters set for SVDD were not met in regions of different economic development levels. Thresholding methods are more commonly used because of their simplicity and reasonable accuracy [16,23,25,27,43]. With thresholding methods, pixels with light magnitudes larger than a predefined threshold value are labeled as urban area, and otherwise as nonurban area. However, it is widely recognized that applying a single threshold at a regional or national scale is possibly problematic [44,45], as thresholds for separating urban and nonurban areas vary with physical environments and socioeconomic development levels. Therefore, in recent studies, local thresholds were used, e.g., a threshold for a city or a tile region [27]. For example, Shi et al. [23] utilized census data as reference and set the threshold for a city as the DNB value that produced the minimum difference of urban area between the extracted results and the census data. Similarly for a city, Xie et al. [25] chose the light magnitude value under which the number of delineated contiguous urban areas reached the peak as the threshold. Sharma et al. [27] proposed an index combining the MODIS multispectral data and VIIRS DNB data and applied thresholds that were derived on the basis of the index histogram of different land cover classes to tile regions (10° latitude × 10° longitude divided out of the globe surface). In the studies mentioned above, the threshold for each local region was determined using reference data, which means that large quantities of reference data are required for extracting urban areas in a large region. Therefore, these methods are not suitable for regional and global scales because of the heavy demands for reference data. The extraction of urban areas at regional and global scales in a convenient and low-cost way remains a conundrum.
In a related study, Zhou et al. [16] developed a cluster-based method to map urban extent from DMSP/OLS data, where optimal thresholds were fitted by a logistic regression model for potential urban clusters (objects) generated from image segmentation. The method provided a new way of determining thresholds for local regions (i.e., image segments rather than fixed city or tile regions) and produced promising results. Moreover, reference data of merely a portion of the study area, instead of the whole area were required. However, this method was built on a logistic functional relationship of optimal thresholds and cluster features observed from DMSP/OLS NTL data. It is unknown whether this method, developed for DMSP/OLS data, is applicable to VIIRS DNB data as well.
With regard to these problems, it is necessary to exploit a cost-effective and regionally applicable method for urban area extraction using VIIRS DNB data. In this paper, we propose a new local thresholding method based on object similarity to map urban areas at a regional scale from VIIRS DNB data. The method aims at estimating thresholds of potential urban objects with the use of as little reference data as possible. In addition, the logistic regression method [16] was also applied using VIIRS DNB data and assessed to find out whether it also performs well with DNB data.
2. Study Area and Data
2.1. Study Area
In this study, China was selected as the study area. As the most populous country, China has been experiencing an unprecedented urbanization with rapid economic growth since the initiation of economic reforms in 1978 [46,47]. However, urbanization in China presents significant regional inequality, reflected mainly on aspects of the population and economy [48,49,50]. The diverse physical environments and socioeconomic development levels make China suitable to evaluate the effectiveness of different urban area mapping methods using nighttime light data.
2.2. Data and Preprocessing
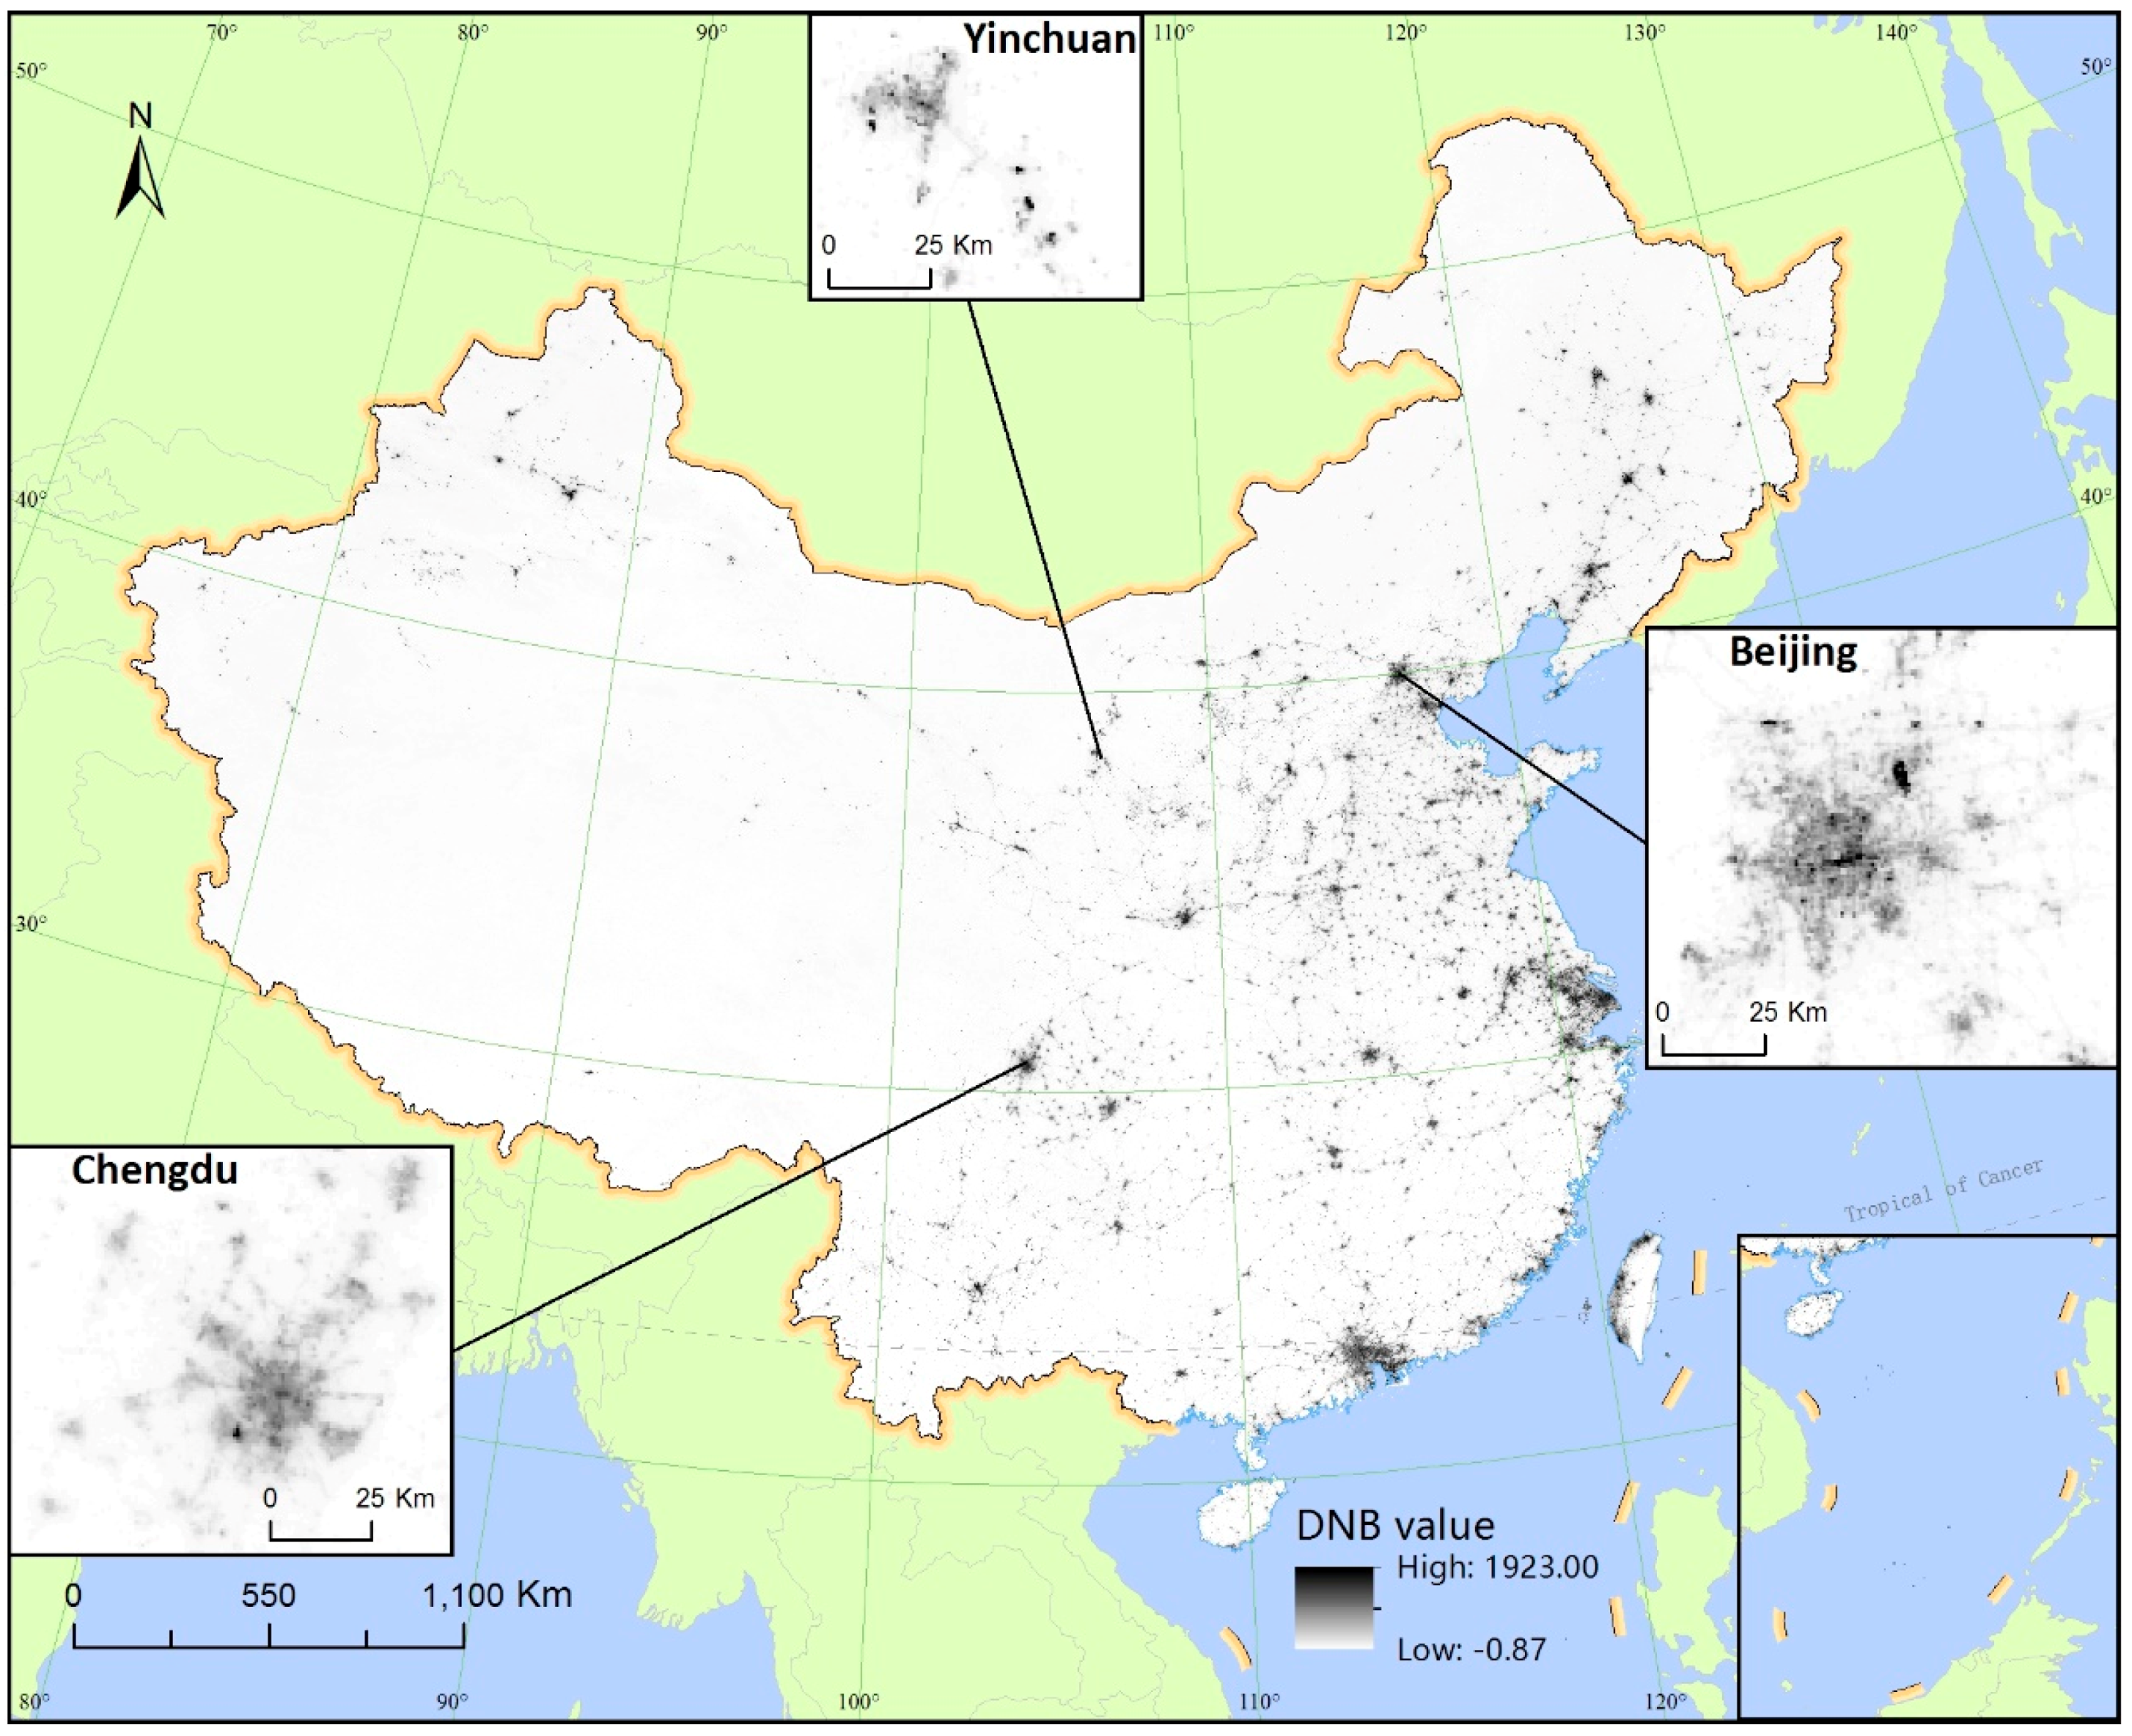
VIIRS DNB Cloud-Free Composites (version 1) and Landsat 8 OLI (Operational Land Imager) data were used in this study. VIIRS DNB Cloud-Free Composites are a suite of monthly/annual mean radiance composite images, where the impacts of stray light, lightning, lunar illumination, and cloud-cover have been excluded. The products span the globe from 75N to 65S of latitude in 15 arc-second geographic grids. Though the monthly images collected from April 2012 to now and the annual image of 2015 have been released by the National Oceanic and Atmospheric Administration (NOAA) (http://ngdc.noaa.gov/eog/viirs/download_monthly.html), only images of April and October 2012 and January 2013 were available at the start of this study. Considering the absence of Landsat data of 2012 in the study area, the DNB image of January 2013 was chosen. The image was reprojected into Albers Conical Equal Area projection with the resampling pixel size of 750 m by 750 m and was clipped according to Chinese administrative boundaries (Figure 1). It is seen clearly from the magnified views of several cities in Figure 1 that VIIRS DNB data captured fine internal urban structures, lighted road networks, and small towns surrounding central big cities.
It should be noted that the nighttime-lights monthly composites still contained lights from aurora, fires, boats, and other temporal lights, and had not been separated from background (non-light) values. Thus, these confounding factors were eliminated or reduced. First, the background noise was removed using a thresholding method [28,29,37]. Specifically, pixels with DNB values lower than 0.5 were assigned a value of zero. Second, the pixels with very high DNB values which may not be resulted from human activities were removed. It is usually assumed that the maximum pixel value of an image is located in the most developed region [23,25]. However, it was found that, in the denoised DNB image, the maximum pixel value of the study area (as high as 1923.002) was much higher than the maximum value (259.065) of the most developed cities in China, i.e., Beijing and Shanghai. Therefore, these abnormal strong lights (higher than 259.065) that might be caused by other factors, e.g., gas flares [25,31], were assigned the pixel value of zero.
To collect reference data for developing and validating the proposed method, 45 cities scattered all over China (Figure 2), involving all provincial administrative regions, were utilized as reference cities. These cities were selected from all classes of urban size [51] with different levels of urbanization and economic development. For the sake of comparison, the selected reference cities were divided into four groups by simplifying the urban classification scheme in [51]. Group 1, super large cities, contains cities with urban population of more than 5 million. Group 2, large cities, contains cities with urban population of 3–5 million. Group 3, medium cities, contains cities with urban population of 1–3 million. Group 4, small cities, contains cities with urban population of less than 1 million.
Landsat 8 OLI images were used to generate urban area maps acting as reference data. A total of 59 cloud-free Landsat 8 OLI images, acquired mostly from June to September 2013, covering the 45 reference cities, were downloaded from the United States Geological Survey (USGS) (http://earthexplorer.usgs.gov/) and reprojected into Albers Conical Equal Area projection, the same as the projection of DNB data. The Support Vector Machine (SVM) classifier, a recently developed and widely used classifier, was used to classify the Landsat OLI images into four land-cover types present in the study area, i.e., urban area, vegetation (including forest, grassland, and farmland), water, and bare soil. After classification, the vegetation, water, and bare soil classes were merged into a nonurban class, and urban land classification results (urban class and nonurban class) were thus produced.
The 30 m resolution urban land classification results obtained from Landsat OLI data were then upscaled to urban area maps of 750 m resolution, the same as the pixel size of DNB data. Specifically, 750 m urban fraction maps were first produced by calculating the proportion of 30 m urban class pixels in each 750 m pixel. Then, 750 m binary urban area maps were produced by thresholding the obtained urban fraction maps. An appropriate threshold of urban fraction should be determined. In the National Land Cover Database (NLCD) [52], the land use category of developed area was defined as pixels with impervious surfaces accounting for more than 20%. However, in [53], for global cities from different geographical settings and levels of economic development, a pixel with urban and built-up land dominating more than 50% was labelled urban. In this study, urban fraction values from 20% to 50% were tested to select an appropriate threshold for urban area extraction. The test results showed that the use of 35% as threshold produced the most similar urban areas to those from Landsat data, thus the threshold of 35% was considered optimal. Therefore, pixels with an urban fraction of more than 35% were defined as urban area and otherwise as nonurban area.
3. Methods
In this study, we proposed an object similarity-based thresholding method to estimate optimal local thresholds and to map urban areas from VIIRS DNB data. Instead of using a single threshold for a predefined region, e.g., a city, a threshold separating urban and nonurban pixels for each potential urban object, mainly generated by image segmentation, was determined. The pixels with DNB values larger than the determined threshold were labeled as urban area and otherwise as nonurban area. The method was built on the assumption that similar potential urban objects have similar DNB threshold values for extracting urban areas. Given a set of reference urban objects with known thresholds estimated from Landsat data beforehand, a target potential urban object was assigned the same threshold value as that of the reference urban object which was the most similar to the target object. The proposed method consisted of four major steps: potential urban object generation, threshold optimization for reference urban objects, object similarity comparison, and urban area mapping. First, potential urban objects were produced. Second, threshold values of reference urban objects (used for the development and validation of the method) were optimized using Landsat-based urban area maps, and reference urban objects for training were then selected. Third, object features were defined in terms of the object size and luminance, and the threshold for a target potential urban object was estimated by quantitatively comparing with training objects in terms of the defined features. Finally, the urban area was mapped with the estimated threshold for each object. The flowchart of the proposed method is illustrated in Figure 3.
3.1. Potential Urban Object Generation
Image segmentation was first conducted on VIIRS DNB images to generate initial urban objects, which served as the basic processing units for local threshold optimization and urban area mapping. Image segmentation, which is widely used in very high-resolution image processing [55,56,57], aims at partitioning an image into homogeneous and meaningful objects [58]. The multiresolution segmentation approach implemented in the eCognition software (Trimble: Westminster, CA, USA) was adopted in this study, since it is considered a high-quality solution applicable and adaptable to diverse problems and data types [59]. The multiresolution segmentation adopts a region-merging technique [59]. It starts with each pixel forming one image object or region. At each step, a pair of image objects is merged into one larger object. The merging decision is based on local homogeneity criteria describing the similarity of adjacent image objects. A ‘merging cost’, which represents the degree of fitting, is also assigned to each possible merge. For a possible merge, the degree of fitting is evaluated, and the merge is fulfilled if it is smaller than a given ‘least degree of fitting’, termed the scale parameter. The procedure stops when there are no more possible merges. A smaller-scale parameter permits fewer merges and smaller segments. It should be noted that other segmentation algorithms could also be used for object production.
In fact, in the obtained initial segmentation results, there were a large number of pixels with zero or very low DNB values, which were obviously not urban areas and irrelevant to urban area mapping. To reduce the computation of the subsequent procedures, these urban-irrelevant pixels were removed. Specifically, for the objects where the proportion of zero-value pixels was more than 90%, the entire objects were excluded. For the objects where the proportion was less than 90%, only the zero-value pixels were eliminated. The remaining nonzero-value pixels made up the final segmentation results that were considered as potential urban objects. It should be noted that not all pixels in a potential urban object were urban, and the proportion of urban pixels varied with the objects. Cases existed where the entire object was composed of nonurban pixels.
3.2. Threshold Optimization for Reference Urban Objects
In this step, we created reference urban objects and determined optimal thresholds for these objects. Reference urban objects are the potential urban objects overlapped with reference urban areas. By overlapping the potential urban objects and the 750 m urban area maps of the reference cities derived from Landsat data, the completely overlapped potential urban objects were considered reference urban objects.
Following the method used in [16], optimal DNB thresholds for reference urban objects were determined using the Landsat-based urban area maps in an iterative process. For a reference urban object, different threshold values between the minimum and maximum DNB light magnitude in the image with a step increment of 0.01 were applied to extract the urban area, and the threshold that produced from the DNB image the urban area that was the closest to that from the reference urban area map was considered optimal. For cases where more than one threshold led to the same urban area that was the closest to the reference, the best matching one with regard to spatial extent was selected.
The obtained reference urban objects with optimized thresholds were then divided into two portions, one for estimating the optimal thresholds for target potential urban objects (training objects) and the other for validation (validation objects). Considering that the reference urban area data are provided at city level in practical applications, the training objects were also generated at city level. A portion of the reference cities were selected by stratified random sampling from the four city groups, and the reference urban objects located in these cities were considered as training objects, whereas the reference urban objects in the remaining reference cities were considered as validation objects.
3.3. Object Similarity Comparison
A key step of the proposed method was to compare each target potential urban object with all training objects with known threshold values to find the most similar training object for the target object. The target object was then assigned the same threshold value as that of the most similar training object.
For quantitatively comparing a target potential urban object and a training object, appropriate object features were defined to measure the object similarity. In [16], the NTL mean and the pixel number of a potential urban cluster (object) were used to fit the functional relationship with optimal thresholds. In this study, in addition to these two features, other features, such as the standard deviation and the sum and maximum light, depicting the luminance and size of a potential urban object, were also tested by estimating the thresholds for the validation objects. It was found that the combination of mean and standard deviation of the light magnitude, and the pixel number of the object resulted in the thresholds closest to the optimal thresholds, and thus these three features were selected to quantify the similarity between objects.
Two distance measures, i.e., the Euclidean distance (ED) and the Mahalanobis distance (MD) [60], were used for measuring the similarity between a target potential urban object and a training object. Both distances are commonly used similarity measures [61,62,63,64]. The ED assumes that each feature is equally important and independent from others, while the MD accounts for correlations between features and the variability of features, weighting each feature differently by the range of variability [63]. Specifically, in MD, features with high variability receive less weight than features with low variability.
In this study, with the features defined, the ED is expressed as Equation (1):
where stands for the ED between a target potential urban object and a training object , is the number of the training objects, and , , denote the mean of the light magnitude, the standard deviation of the light magnitude, the pixel number of the object, respectively. It should be noted that, as the ED captures a scale variant discrepancy, the three feature variables were transformed through a natural log for the purpose of accommodating their different ranges of magnitude value [16,19].
The MD is expressed as Equation (2):
where stands for the MD between a target potential urban object and a training object , are object feature vectors of the vector space consisting of three dimensions, i.e., mean of the light magnitude , standard deviation of the light magnitude , pixel number of the object; denotes the covariance matrix of the feature matrix. The sample set was made up of all target potential urban objects and training objects. As MD is scale-invariant, so the features were not transformed through a natural log in the calculation.
Smaller distance means higher similarity. For the target potential urban object , the distances for all training objects () were calculated, and the optimal threshold was the threshold for the training object with the smallest distance, i.e.,
3.4. Urban Area Mapping
After the thresholds for potential urban objects were obtained, the pixels in a potential urban object with DNB values larger than the estimated threshold were labeled as urban area, and otherwise as nonurban area. The urban area mapping result was produced. To further improve the initial mapping result, a post-processing procedure was applied to remove the urban objects of very small size. Specifically, the urban patches with a size of less than four pixels were eliminated.
3.5. Validation
The proposed method was evaluated in two aspects. First, the estimated object thresholds were quantitatively compared to the optimal thresholds derived from classified Landsat images (i.e., reference thresholds) in terms of the correlation coefficient (r) and Root Mean Squared Error (RMSE). Second, the urban area mapping results were quantitatively compared with reference urban area maps from Landsat images. Two commonly used accuracy measures, the overall accuracy (OA) and the Kappa Coefficient, were adopted.
For a full validation of the proposed method, two existing local thresholding methods were conducted for comparison.
The first comparative method is a local-optimized thresholding method [65] (called the city-optimized method hereafter), which determines a single threshold for one city by matching the urban area mapped from VIIRS DNB data to that from Landsat images as closely as possible.
The second comparative method is the cluster-based thresholding method [16] (called the logistic regression method hereafter), initially proposed for mapping urban areas from DMSP/OLS data. Using this method, the optimal thresholds for potential urban clusters (i.e., objects) were estimated by fitting a logistic model of the relationship between an index integrated of cluster size and mean of light magnitude, and the threshold. The logistic model was expressed as follows:
where is the optimal threshold for the urban cluster, and denote the mean of the light magnitude and the pixel number of the object, and are the maximum and minimum DNB radiance values in the study area, , , and are coefficients of the logistic model. Equation (4) was converted to a linear form through a natural log (Equation (5)), and the coefficients were calculated using the ordinary least squares regression.
The training samples used for developing the logistic model were identical to the training objects for the proposed method.
To evaluate the robustness of the proposed method, five tests were conducted using different training objects and validation objects, generated by stratified random sampling of the reference urban objects, as described in Section 3.2. In each test, the three methods were evaluated using the identical validation objects.
4. Results
4.1. Potential Urban Objects
In the preprocessed DNB image of the study area, the light radiance value range was 0.5–259.065. It was found that 97% of pixels were of values lower than 30, and only few pixels located in urban core areas of big cities were of larger values. This means that the values of most pixels in small cities and fringe areas of big cities were densely distributed within a narrow range, and the local homogeneity of pixel values was very high, which could result in overlarge segments in these areas. Therefore, to reduce the local homogeneity of pixel values and produce objects with appropriate sizes, the pixel values were first enlarged by 10 times prior to segmentation.
Image segmentation results from the multiresolution segmentation method with the scale parameter of 25 were used in this study. A total of 30,313 image objects were initially produced from image segmentation. After removing urban-irrelevant pixels, 18,848 potential urban objects were left for urban area mapping (Figure 4). It is seen from the magnified images of Beijing, Chengdu, and Yinchuan in Figure 4 that the sizes of the obtained urban objects in urban core areas were apparently smaller than those in fringe areas. This indicates that the DNB light radiance of urban core areas has a higher variation.
As mentioned in Section 3.5, five tests were conducted for validation of the proposed method. In each test, 20 cities were selected for providing training objects by stratified random sampling and the remaining 25 cities were used for providing validation objects. The numbers of training objects and validation objects from different city groups used in different tests were listed in Table 1.
4.2. Estimation of Thresholds for Potential Urban Objects
The 30 m urban land classification results from Landsat OLI images of the 45 reference cities were validated using reference samples. For each city, 200–300 samples were generated using the stratified random sampling method, where the numbers of samples were proportional to the pixel numbers of the urban and nonurban classes. The class attribute of each sample was determined with the support of higher-resolution images from Google Earth. The overall accuracies were in the range of 88.31–98.05%, with the average of 94.03%, and the Kappa Coefficients were in the range of 0.69-0.93, with the average of 0.83. The accuracies of urban land classification results from Landsat OLI images were acceptable for being used as reference data, considering that the spatial resolution of Landsat OLI images is much higher than that of the VIIRS DNB images.
Figure 5 shows the scatter plots of the thresholds estimated from different methods against the reference optimal thresholds for the validation objects.
As seen from Figure 5a, the correlation coefficients (r) between the thresholds from the logistic regression method and the reference thresholds were 0.9435–0.9503, which are very high. The RMSEs of the method were 8.1856–10.4821. It was found that the thresholds of small values (smaller than circa 50) were estimated accurately by the logistic regression method, while the thresholds of large values (larger than circa 50) were underestimated. The sample points of the logistic regression method were compact and very close to the 1:1 line for small threshold values. However, the slope of the sample points significantly changed as the threshold increased, from larger than 1 to smaller than 1, resulting in the sample points deviating far from the 1:1 line for large threshold values.
From Figure 5b, it can be seen that the correlation coefficients (r) between the thresholds from the proposed method using ED as similarity measure and the reference thresholds were 0.9201–0.9409, slightly lower than those of the logistic regression method, and the RMSEs were 8.4139–9.5720, slightly lower than those of the logistic regression method. From Figure 5c, it can be seen that the correlation coefficients (r) between the thresholds from the proposed method using MD and the reference thresholds were 0.9461–0.9523, very similar to those of the logistic regression method, and the RMSEs were 7.4340–7.9845, much smaller than those of the other two results. It is clearly shown that the sample points of the proposed method, using either ED or MD, were distributed close to the 1:1line, with a constant slope of circa 1 for the entire body of the points. However, compared to those of the logistic regression method, the sample points of the proposed method using both ED and MD were more scattered, and this was even worse for the proposed method using ED.
Overall, in threshold estimation, the proposed method using MD achieved the smallest RMSEs. The proposed method using MD and the logistic regression method achieved higher correlation coefficients than the proposed method using ED.
4.3. Urban Area Mapping Results
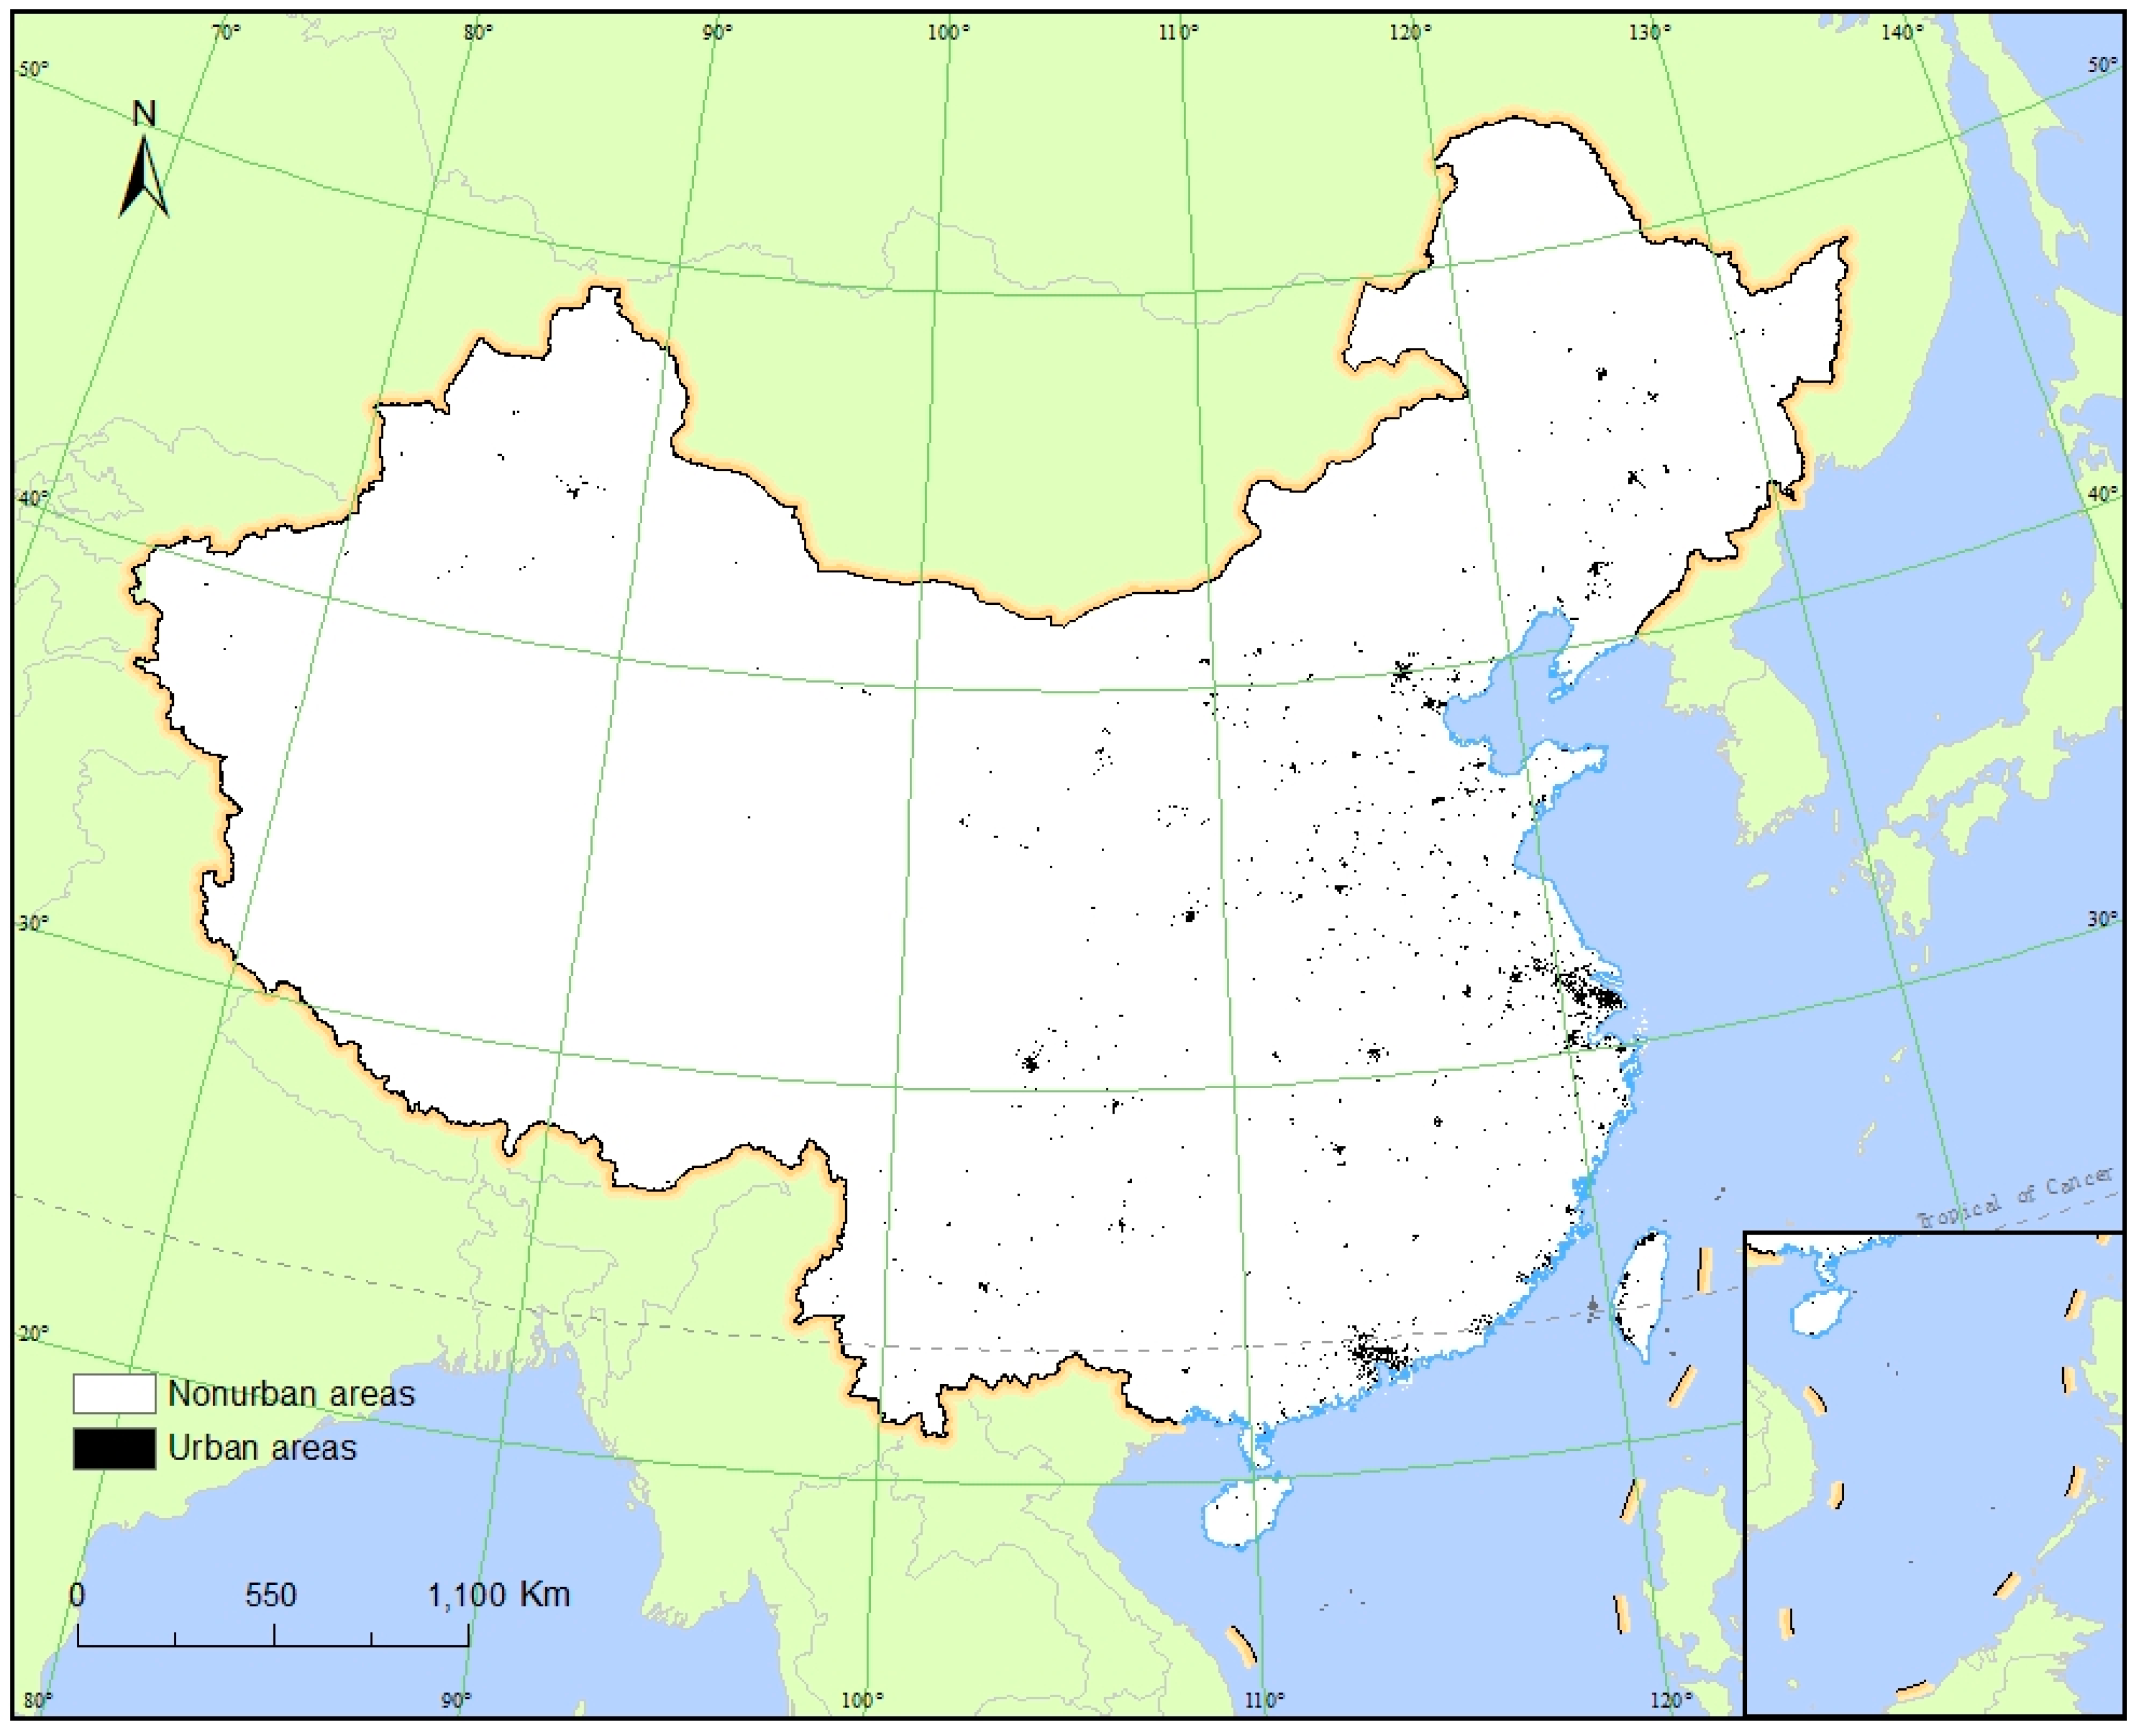
The urban area mapping result from VIIRS DNB using the proposed method is displayed in Figure 6. As the results from the proposed method using ED and MD are very similar, only the result using ED is shown. From the figure, there is a notable spatial discrepancy in the distribution of urban areas in China. The great majority of urban areas were distributed in east China region, particularly in the eastern coastal region. Large urban agglomerations, including the Beijing–Tianjin–Tangshan Metropolitan Region, the Yangtze River Delta, and the Pearl River Delta were clearly identified. In contrast, only a small portion of urban areas were scattered in west China region.
The urban area mapping results of eight selected reference cities of different sizes (two cities from each city group) using different methods are illustrated in Figure 7. To present clearly the differences between the results from the different methods and the reference images derived from Landsat, the common parts, overestimation parts, and underestimation parts compared to the reference are shown in different colors for each city. The complete urban area mapping result of a city from a method is composed of the common parts (grey pixels) and the overestimation parts (red pixels). Generally, all the three thresholding methods produced relatively accurate mapping results. However, these three methods showed different characteristics.
The urban area mapping results from the city-optimized method (Figure 7c) had the maximum common parts and the minimum overestimation and underestimation parts for every selected city among the results from all methods. This indicates that the results from the city-optimized method are the most similar to the reference data and are the most accurate. Besides, the area of the overestimation parts was always as large as that of the underestimation parts, indicating that the extracted urban area was as large as that of the reference data.
In the urban area mapping results from the logistic regression method (Figure 7d), there were apparently more overestimation parts than underestimation parts for almost all selected cities, except for Beijing. Moreover, it was also found that this problem was more noticeable in smaller cities. In Beijing, the underestimation parts were more than the overestimation parts. However, in smaller cities, the underestimation parts were less. For example, in Hefei and Lhasa, there are barely no underestimation parts.
The urban area mapping results from the proposed method using ED as similarity measure (Figure 7d) and using MD as similarity measure (Figure 7e) were almost the same, except that the overestimation parts in Xi’an and the underestimation parts in Lanzhou were more when using MD than when using ED. Compared to the logistic regression method, the results from the proposed method had more underestimation parts but obviously less overestimation parts for all selected cities.
4.4. Accuracy Assessments
The quantitative evaluations of the urban area mapping results from different methods are listed in Table 2. For the city-optimized method, there was only one mapping result and one accuracy result for each city. For the logistic regression method and the proposed method, five tests were carried out, with each using 25 reference cities for validation. Thus, every reference city was selected for validation twice or more. To integrate different accuracies (OA and Kappa Coefficient) of more than one mapping result for a city from one method, the average and standard deviation of the accuracies were calculated and used for the assessment.
In Table 2, the OAs and Kappa Coefficients of the city-optimized method are in the range of 75.69–94.29% and 0.49–0.79, with an average of 88.14% and 0.68, respectively. For every reference city, the accuracies of the city-optimized method were the highest among the three methods. This is consistent with the evaluation of the urban area mapping results of the selected reference cities in Section 4.3.
The proposed method performed the second best. The OAs and Kappa Coefficients of the method using ED as similarity measure were in the range of 70.85–92.16% and 0.35–0.71, with an average of 84.53% and 0.58, respectively, while the OAs and Kappa Coefficients of the method using MD were in the range of 67.44–92.52% and 0.29–0.83, with an average of 84.20% and 0.57, respectively. For almost all reference cities (except for Nanchang), the accuracies of the proposed method, using ED or MD, were the second highest. The ED and MD performed very similarly in this study. The Kappa Coefficients of the mapping results from the proposed method using ED were higher (or equal but with less standard deviation) for 25 reference cities.
The OAs and Kappa Coefficients of the logistic regression method were in the range of 80.92–90.66% and 0.30–0.67, with an average of 80.92% and 0.51, respectively. In terms of Kappa Coefficient, the logistic regression method had lower accuracies than the proposed method using ED in all except for two reference cities, i.e., Nanchang and Xining, and it had lower accuracies than the proposed method using MD in all except for four reference cities, i.e., Chengdu, Nanchang, Linfen, and Xingtai.
In addition, it was also found that the accuracy of the urban area mapping results was not completely dependent on the method, but it was related to the city size as well. For all the three methods, the mapping accuracies for the cities in Group 2 and Group 3 were obviously higher than those for the cities in Group 1 and Group 4. For example, for the city-optimized method, the average Kappa Coefficient of Group 3 was 0.05 higher than that of Group 2, 0.06 higher than that of Group 1, and 0.08 higher than that of Group 4. For the logistic regression method, the average Kappa Coefficient of Group 3 was 0.01 higher than that of Group 2, 0.06 higher than that of Group 1, and 0.08 higher than that of Group 4. For the proposed method using ED, the average Kappa Coefficient of Group 3 was 0.03 higher than that of Group 2, 0.07 higher than that of Group 1, and 0.11 higher than that of Group 4. For the proposed method using MD, the average Kappa Coefficient of Group 3 was 0.04 higher than that of Group 2, 0.11 higher than that of Group 1, and 0.13 higher than that of Group 4.
Figure 8 is the boxplot of the Kappa Coefficients of the mapping results from the different methods, which graphically depicts their numerical ranges and distributions in different city groups. From the figure, it is clearly shown that, for each city group, the city-optimized method achieved the highest accuracy and the proposed methods achieved the second highest accuracy, with the use of ED and MD producing similar accuracies, higher than that of the logistic regression method. It can also be seen that Group 2 and Group 3 generally had higher accuracies than Group 1 and Group 4.
5. Discussion
In this paper, we proposed a new local thresholding method of mapping urban areas at a regional scale from VIIRS DNB data. In the proposed method, the threshold for a potential urban object was estimated by comparing its similarity to reference urban objects. Two similarity measures, i.e., ED and MD, were used in the proposed method and compared. Two state-of-the-art local thresholding methods, i.e., the city-optimized method and the logistic regression method, were conducted for comparison. The methods were evaluated in terms of object threshold estimation and urban area mapping, and the experimental results demonstrated the effectiveness of the proposed method.
From the experimental results, the city-optimized method produced the most similar urban areas to the Landsat-derived reference urban areas and had the highest accuracies of urban area mapping results among the three methods. However, the favorable assessment result does not simply imply that the city-optimized method is practically applicable for urban area mapping in a large region. Actually, the city-optimized method was implemented under the ideal circumstance where reference data for all the urban areas to be mapped were necessarily available. For a large study area, the amount of reference data required, e.g., statistical data of land use investigation or pre-existing urban area maps, is expected to be large and difficult to collect. Therefore, the city-optimized method is not appropriate for urban area mapping at a regional scale. The method was carried out here merely to provide an ideal reference for the other two methods.
The logistic regression method produced comparatively accurate and acceptable results. However, it was found from Figure 5a that the thresholds of large values were underestimated, and that there may be a nonlinear relationship between the estimated threshold and the reference optimal threshold. This means that the relationship between the optimal threshold and the two object features, i.e., the mean of the light magnitude and the pixel number, was not well fitted by the logistic model. The logistic regression method was initially developed for DMSP/OLS data on the basis of the finding that there was a slightly S-shaped relationship between the optimal threshold and an index combining the mean of the light magnitude and the object size [16]. However, it has not been investigated if this relationship exists in VIIRS DNB data. Figure 9 shows the relationship between the reference optimal threshold and the combined object features of the mean of the light magnitude and the pixel number of the validation objects in Test 3. The coefficients , , were optimized by ordinary least squares regression using the training objects in Test 3. From the figure, the relationship of the optimal threshold with the combined features is J-shaped, rather than S-shaped, which does not follow a logistic model. Therefore, it may not be appropriate to fit the optimal threshold using the mean of the light magnitude and the pixel number with the logistic model for VIIRS DNB data. Other nonlinear function models or object features could work better. Although the robustness and reliability of the logistic regression method has been evaluated in a global map of urban extent from DMSP/OLS data [17], the results obtained in this study show that the logistic regression method may not be well applicable to VIIRS DNB data.
Different from the logistic regression method which fits a quantitative relationship between the optimal threshold and the object features, the proposed method estimates thresholds on the basis of the similarity between a target potential urban object and training objects in terms of object features, with no dependence on a certain function model. Thus, the proposed method is not limited to some particular nighttime light data with specific characteristics and may be applicable to different nighttime light data. Another prominent advantage of the proposed method is the easily satisfied demand for reference data. Over a large study area, only a small portion of the existing reference urban area maps are needed. For example, in this study, the number of training objects that needs reference urban area maps for threshold optimization accounted for only less than 4% of all potential urban objects, i.e., the reference urban area maps of only 20 cities were used for providing the training objects for urban area mapping in the whole China region. Therefore, it is convenient to acquire urban area information of a large region using the proposed method.
With regard to the similarity measure of the proposed method, the ED and MD performed very similarly in this study. Although the method using MD estimated thresholds better than the method using ED (Figure 5b,c), the final urban area mapping results from both measures had no obvious differences. Compared to ED, MD weighs features differently according to correlations between features and variability of features. However, it was not analyzed in this paper whether other distance-based similarity measures which account for the importance of features in different ways could lead to better results. This could be explored in the future study.
It should be noted that the selection of training objects in the proposed method is important. The training objects are required to be sufficiently representative of various target potential urban objects. For a target object, the assigned threshold from the most similar training object was actually an approximately optimal threshold, which could bring about approximately the same urban area as that brought about by a reference-derived optimal threshold. Only if the training object was similar enough, the target object could get an appropriate threshold and accurate urban area. In this study, to maximize feature diversity, reference cities of different sizes, urbanization levels, and economic development levels were chosen to provide training objects. However, in Figure 5b,c, the sample points of large thresholds were distributed slightly further away from the 1:1 line than those of small thresholds, which means that the estimation errors of the large thresholds were bigger. It could also be noted that the majority of the DNB threshold values were in a relatively small range. Of all reference urban objects, the ones with optimal thresholds larger than 50 accounted for only 13%. The sparseness of large-threshold training objects may result in the insufficient variability of training object features, making it difficult for a large-threshold target object to find a similar enough training object and then get an effective threshold.
In the future study, three problems will be further explored. First, it is to be addressed whether the similarity measures which have an optimal combination of weights for different features could be found for improving urban area mapping. Second, new and effective training object selection methods will be figured out to provide as few as possible representative training objects. Third, further evaluation of the proposed method in other geographical regions or at a global scale is to be performed.
6. Conclusions
In this paper, an object similarity-based thresholding method was proposed to map urban areas at a regional scale from VIIRS DNB data. Using a small quantity of reference urban objects with known threshold values derived from Landsat data, the threshold separating urban and nonurban areas for a potential urban object was estimated by comparing its similarity to training objects with known optimal thresholds. The results showed that the proposed method generally outperformed the logistic regression method in terms of both threshold estimation and urban area mapping. The proposed method provides an efficient and effective method for large-scale urban area mapping and dynamics monitoring with a flexible thresholding technique.
Acknowledgments
This work was funded by the National Science Foundation of China (Grant Number 41371329).
Author Contributions
Peijun Li and Wenting Ma conceived and designed the paper. Wenting Ma performed the experiments, analyzed the data, and wrote the paper. Peijun Li analyzed the data and revised the paper.
Conflicts of Interest
The authors declare no conflict of interest.
References
- United Nations. World Urbanization Prospects: The 2014 Revision, Highlights; Department of Economic and Social Affairs, UN: New York, NY, USA, 2014. [Google Scholar]
- Goudie, A. The Human Impact on the Natural Environment, 3rd ed.; MIT Press: Cambridge, MA, USA, 1990. [Google Scholar]
- Small, C. Global analysis of urban population distributions and the physical environment. In Proceedings of the Open Meeting of the Human Dimension of Global Environmental Change Research Community, Rio de Janeiro, Brazil, 6–8 October 2001. [Google Scholar]
- Foley, J.A.; DeFries, R.; Asner, G.P.; Barford, C.; Bonan, G.; Carpenter, S.R.; Chapin, F.S.; Coe, M.T.; Daily, G.C.; Gibbs, H.K.; et al. Global consequences of land use. Science 2005, 309, 570–574. [Google Scholar] [CrossRef] [PubMed]
- Grimm, N.B.; Faeth, S.H.; Golubiewski, N.E.; Redman, C.L.; Wu, J.; Bai, X.; Briggs, J.M. Global change and the ecology of cities. Science 2008, 319, 756–760. [Google Scholar] [CrossRef] [PubMed]
- Myint, S.W.; Gober, P.; Brazel, A.; Grossman-Clarke, S.; Weng, Q. Per-pixel vs. Object-based classification of urban land cover extraction using high spatial resolution imagery. Remote Sens. Environ. 2015, 115, 1145–1161. [Google Scholar] [CrossRef]
- Pu, R.; Landry, S.; Yu, Q. Object-based urban detailed land cover classification with high spatial resolution IKONOS imagery. Int. J. Remote Sens. 2011, 32, 3285–3308. [Google Scholar] [CrossRef]
- Lu, D.; Weng, Q. Urban classification using full spectral information of Landsat ETM+ imagery in Marion County, Indiana. Photogramm. Eng. Remote Sens. 2005, 71, 1275–1284. [Google Scholar] [CrossRef]
- Schneider, A.; Friedl, M.A.; McIver, D.K.; Woodcock, C.E. Mapping urban areas by fusing multiple sources of coarse resolution remotely sensed data. Photogramm. Eng. Remote Sens. 2003, 69, 1377–1386. [Google Scholar] [CrossRef]
- Friedl, M.A.; Sulla-Menashe, D.; Tan, B.; Schneider, A.; Ramankutty, N.; Sibley, A.; Huang, X. MODIS Collection 5 global land cover: Algorithm refinements and characterization of new datasets. Remote Sens. Environ. 2010, 114, 168–182. [Google Scholar] [CrossRef]
- Bontemps, S.; Defourny, P.; Bogaert, E.V.; Arino, O.; Kalogirou, V.; Perez, J.R. GlobCover 2009-Products Description and Validation Report; Université Catholique de Louvain (UCL): Louvain-la-Neuve, Belgium; European Space Agency (ESA): Paris, France, 2011. [Google Scholar]
- Tateishi, R.; Hoan, N.T.; Kobayashi, T.; Alsaaideh, B.; Tana, G.; Phong, D.X. Production of global land cover data-GLCNMO2008. J. Geogr. Geol. 2014, 6, 99–122. [Google Scholar] [CrossRef]
- Elvidge, C.; Baugh, K.; Hobson, V.; Kihn, E.; Kroehl, H.; Davis, E.; Cocero, D. Satellite inventory of human settlements using nocturnal radiation emissions: A contribution for the global toolchest. Glob. Chang. Biol. 1997, 3, 387–395. [Google Scholar] [CrossRef]
- Elvidge, C.D.; Tuttle, B.T.; Sutton, P.S.; Baugh, K.E.; Howard, A.T.; Milesi, C.; Bhaduri, B.L.; Nemani, R. Global distribution and density of constructed impervious surfaces. Sensors 2007, 7, 1962–1979. [Google Scholar] [CrossRef] [PubMed]
- Huang, Q.; Yang, X.; Gao, B.; Yang, Y.; Zhao, Y. Application of DMSP/OLS nighttime light images: A meta-analysis and a systematic literature review. Remote Sens. 2014, 6, 6844–6866. [Google Scholar] [CrossRef]
- Zhou, Y.; Smith, S.J.; Elvidge, C.D.; Zhao, K.; Thomson, A.; Imhoff, M. A cluster-based method to map urban area from DMSP/OLS nightlights. Remote Sens. Environ. 2014, 147, 173–185. [Google Scholar] [CrossRef]
- Zhou, Y.; Smith, S.J.; Zhao, K.; Imhoff, M.; Thomson, A.; Bondlamberty, B.; Asrar, G.R.; Zhang, X.; He, C.; Elvidge, C.D. A global map of urban extent from nightlights. Environ. Res. Lett. 2015, 10, 054011. [Google Scholar] [CrossRef]
- Li, X.; Zhou, Y. Urban mapping using dmsp/ols stable night-time light: A review. Int. J. Remote Sens. 2017, 38, 1–17. [Google Scholar] [CrossRef]
- Small, C.; Elvidge, C.D.; Baugh, K. Mapping urban structure and spatial connectivity with VIIRS and OLS night light imagery. In Proceedings of the IEEE 2013 Joint Urban Remote Sensing Event (JURSE), Sao Paulo, Brazil, 21–23 April 2013; pp. 230–233. [Google Scholar]
- Elvidge, C.D.; Baugh, K.E.; Zhizhin, M.; Hsu, F.-C. Why VIIRS data are superior to DMSP for mapping nighttime lights. In Proceedings of the 35th Asia-Pacific Advanced Network, Honolulu, HI, USA, 13–18 January 2013; pp. 62–69. [Google Scholar]
- Miller, S.D.; Straka, W.; Mills, S.P.; Elvidge, C.D.; Lee, T.F.; Solbrig, J.; Walther, A.; Heidinger, A.K.; Weiss, S.C. Illuminating the capabilities of the Suomi National Polar-orbiting Partnership (NPP) Visible Infrared Imaging Radiometer Suite (VIIRS) Day/Night Band. Remote Sens. 2013, 5, 6717–6766. [Google Scholar] [CrossRef]
- Cao, C.; Bai, Y. Quantitative analysis of VIIRS DNB nightlight point source for light power estimation and stability monitoring. Remote Sens. 2014, 6, 11915–11935. [Google Scholar] [CrossRef]
- Shi, K.; Huang, C.; Yu, B.; Yin, B.; Huang, Y.; Wu, J. Evaluation of NPP-VIIRS night-time light composite data for extracting built-up urban areas. Remote Sens. Lett. 2014, 5, 358–366. [Google Scholar] [CrossRef]
- Jaturapitpornchai, R.; Kasetkasem, T.; Kumazawa, I.; Rakwatin, P.; Chanwimaluang, T. A level-based method for urban mapping using NPP-VIIRS nighttime light data. In Proceedings of the IEEE 2015 6th International Conference of Information and Communication Technology for Embedded Systems (IC-ICTES), Hua-Hin, Thailand, 22–24 March 2015. [Google Scholar]
- Xie, Y.; Weng, Q.; Weng, A. A comparative study of NPP-VIIRS and DMSP-OLS nighttime light imagery for derivation of urban demographic metrics. In Proceedings of the IEEE 2014 Third International Workshop on Earth Observation and Remote Sensing Applications (EORSA), Changsha, China, 11–14 June 2014; pp. 335–339. [Google Scholar]
- Huang, X. Mapping Regional Land Cover and Land Use Change Using MODIS Time Series; Boston University: Boston, MA, USA, 2014. [Google Scholar]
- Sharma, R.C.; Tateishi, R.; Hara, K.; Gharechelou, S.; Iizuka, K. Global mapping of urban built-up areas of year 2014 by combining MODIS multispectral data with VIIRS nighttime light data. Int. J. Digit. Earth 2016, 9, 1004–1020. [Google Scholar] [CrossRef]
- Ma, T.; Zhou, Y.; Wang, Y.; Zhou, C.; Haynie, S.; Xu, T. Diverse relationships between Suomi-NPP VIIRS night-time light and multi-scale socioeconomic activity. Remote Sens. Lett. 2014, 5, 652–661. [Google Scholar] [CrossRef]
- Jing, X.; Shao, X.; Cao, C.; Fu, X.; Yan, L. Comparison between the Suomi-NPP Day-Night Band and DMSP-OLS for correlating socio-economic variables at the provincial level in China. Remote Sens. 2016, 8, 17. [Google Scholar] [CrossRef]
- Li, X.; Xu, H.; Chen, X.; Li, C. Potential of NPP-VIIRS nighttime light imagery for modeling the regional economy of China. Remote Sens. 2013, 5, 3057–3081. [Google Scholar] [CrossRef]
- Shi, K.; Yu, B.; Huang, Y.; Hu, Y.; Yin, B.; Chen, Z.; Chen, L.; Wu, J. Evaluating the ability of NPP-VIIRS nighttime light data to estimate the gross domestic product and the electric power consumption of China at multiple scales: A comparison with DMSP-OLS data. Remote Sens. 2014, 6, 1705–1724. [Google Scholar] [CrossRef]
- Uchida, S.; Takeuchi, W.; Hatoyama, K.; Mazurov, Y. Socio-economic impact of Trans-Siberian railway after the collapse of Soviet Union by integrated spatial data analysis. In Proceedings of the 8th IGRSM International Conference and Exhibition on Remote Sensing & GIS (IGRSM 2016), Kuala Lumpur, Malaysia, 13–14 April 2016; IOP Publishing: Bristol, UK, 2016. [Google Scholar]
- Mann, M.L.; Melaas, E.K.; Malik, A. Using VIIRS Day/Night Band to measure electricity supply reliability: Preliminary results from Maharashtra, India. Remote Sens. 2016, 8, 711. [Google Scholar] [CrossRef]
- Wang, J.; Aegerter, C.; Xu, X.; Szykman, J.J. Potential application of VIIRS Day/Night Band for monitoring nighttime surface PM2.5 air quality from space. Atmos. Environ. 2016, 124, 55–63. [Google Scholar] [CrossRef]
- Misra, P.; Takeuchi, W. Analysis of air quality and nighttime light for Indian urban regions. In Proceedings of the 8th IGRSM International Conference and Exhibition on Remote Sensing & GIS (IGRSM 2016), Kuala Lumpur, Malaysia, 13–14 April 2016; IOP Publishing: Bristol, UK, 2016. [Google Scholar]
- Zhao, X.; Shi, H.; Yu, H.; Yang, P. Inversion of nighttime PM2.5 mass concentration in Beijing based on the VIIRS Day-Night Band. Atmosphere 2016, 7, 136. [Google Scholar] [CrossRef]
- Guo, W.; Lu, D.; Wu, Y.; Zhang, J. Mapping impervious surface distribution with integration of SNNP VIIRS-DNB and MODIS NDVI data. Remote Sens. 2015, 7, 12459–12477. [Google Scholar] [CrossRef]
- Johnson, R.S.; Zhang, J.; Hyer, E.J.; Miller, S.D.; Reid, J.S. Preliminary investigations toward nighttime aerosol optical depth retrievals from the VIIRS Day/Night Band. Atmos. Meas. Tech. 2013, 6, 1245–1255. [Google Scholar] [CrossRef]
- Ou, J.; Liu, X.; Li, X.; Li, M.; Li, W. Evaluation of NPP-VIIRS nighttime night data for mapping global fossil fuel combustion CO2 emissions: A comparison with DMSP-OLS nighttime light data. PLoS ONE 2015, 10, e0138310. [Google Scholar] [CrossRef] [PubMed]
- Chen, Z.; Yu, B.; Hu, Y.; Huang, C.; Shi, K.; Wu, J. Estimating house vacancy rate in metropolitan areas using NPP-VIIRS nighttime light composite data. IEEE J. Sel. Top. Appl. Earth Obs. Remote Sens. 2015, 8, 2188–2197. [Google Scholar] [CrossRef]
- Elvidge, C.D.; Zhizhin, M.; Baugh, K.; Hsu, F.-C. Automatic boat identification system for VIIRS low light imaging data. Remote Sens. 2015, 7, 3020–3036. [Google Scholar] [CrossRef]
- Zhang, J.; Zhou, Z.; Shuai, G.; Liu, H. Support vector data description model to map urban extent from National Polar-Orbiting Partnership Satellite–Visible Infrared Imaging Radiometer Suite nightlights and normalized difference vegetation index. J. App. Remote Sens. 2016, 10, 026012. [Google Scholar] [CrossRef]
- Xie, Y.; Weng, Q. Updating urban extents with nighttime light imagery by using an object-based thresholding method. Remote Sens. Environ. 2016, 187, 1–13. [Google Scholar] [CrossRef]
- Henderson, M.; Yeh, E.T.; Gong, P.; Elvidge, C.; Baugh, K. Validation of urban boundaries derived from global night-time satellite imagery. Int. J. Remote Sens. 2003, 24, 595–609. [Google Scholar] [CrossRef]
- Lu, D.; Tian, H.; Zhou, G.; Ge, H. Regional mapping of human settlements in southeastern China with multisensor remotely sensed data. Remote Sens. Environ. 2008, 112, 3668–3679. [Google Scholar] [CrossRef]
- Zhang, K.H.; Song, S. Rural–urban migration and urbanization in China: Evidence from time-series and cross-section analyses. China Econ. Rev. 2003, 14, 386–400. [Google Scholar] [CrossRef]
- Deng, X.; Huang, J.; Rozelle, S.; Uchida, E. Growth, population and industrialization, and urban land expansion of China. J. Urban Econ. 2008, 63, 96–115. [Google Scholar] [CrossRef]
- Zhang, S. Analysis on the difference of the developing level of the regional urbanization in China. Popul. J. 2002, 37–42. [Google Scholar]
- Wang, Y.; Fang, C.; Wang, Z. The study on comprehensive evaluation and urbanization division at county level in China. Geog. Res. 2012, 31, 1305–1316. [Google Scholar]
- Liu, Y.; Lu, S.; Chen, Y. Spatio-temporal change of urban–rural equalized development patterns in China and its driving factors. J. Rural Stud. 2013, 32, 320–330. [Google Scholar] [CrossRef]
- The State Council of China. Notice on Adjusting the Classification Standards of Urban Sizes. Available online: http://www.gov.cn/zhengce/content/2014-11/20/content_9225.htm (accessed on 7 February 2018).
- Homer, C.; Dewitz, J.; Yang, L.; Jin, S.; Danielson, P.; Xian, G.; Coulston, J.; Herold, N.; Wickham, J.; Megown, K. Completion of the 2011 National Land Cover Database for the conterminous United States–Representing a decade of land cover change information. Photogramm. Eng. Remote Sens. 2015, 81, 345–354. [Google Scholar]
- Schneider, A.; Woodcock, C.E. Compact, dispersed, fragmented, extensive? A comparison of urban growth in twenty-five global cities using remotely sensed data, pattern metrics and census information. Urban Stud. 2008, 45, 659–692. [Google Scholar] [CrossRef]
- National Bureau of Statistics of China. China Statistical Yearbook 2014; China Statistics Press: Beijing, China, 2014.
- Neubert, M.; Herold, H.; Meinel, G. Assessing image segmentation quality–concepts, methods and application. In Object-Based Image Analysis; Blaschke, T., Lang, S., Hay, G.J., Eds.; Springer: Berlin/Heidelberg, Germany, 2008; pp. 769–784. [Google Scholar]
- Blaschke, T. Object based image analysis for remote sensing. ISPRS J. Photogramm. Remote Sens. 2010, 65, 2–16. [Google Scholar] [CrossRef]
- Liu, J.; Li, P.; Wang, X. A new segmentation method for very high resolution imagery using spectral and morphological information. ISPRS J. Photogram. Remote Sens. 2015, 101, 145–162. [Google Scholar] [CrossRef]
- Zhang, Y.J. A survey on evaluation methods for image segmentation. Pattern Recognit. 1996, 29, 1335–1346. [Google Scholar] [CrossRef]
- Baatz, M.; Schäpe, A. Multiresolution segmentation: An optimization approach for high quality multi-scale image segmentation. In Angewandte Geographische Informationsverarbeitung XII, 1st ed.; Strobl, J., Blaschke, T., Griesebner, G., Eds.; Herbert Wichmann Verlag: Heidelberg, Germany, 2000; pp. 12–23. [Google Scholar]
- Mahalanobis, P.C. On the generalised distance in statistics. Proc. Nat. Inst. Sci. 1936, 2, 49–55. [Google Scholar]
- Elmore, K.L.; Richman, M.B. Euclidean distance as a similarity metric for principal component analysis. Mon. Weather Rev. 2001, 129, 540–549. [Google Scholar] [CrossRef]
- Song, W.W.; Lin, C.; Forsman, A.; Avdic, A.; Åkerblom, L. An Euclidean similarity measure approach for hotel rating data analysis. In Proceedings of the IEEE International Conference on Cloud Computing and Big Data Analysis, Chengdu, China, 28–30 April 2017; pp. 293–298. [Google Scholar]
- Xiang, S.; Nie, F.; Zhang, C. Learning a mahalanobis distance metric for data clustering and classification. Pattern Recognit. 2008, 41, 3600–3612. [Google Scholar] [CrossRef]
- Roth, P.M.; Hirzer, M.; Köstinger, M.; Beleznai, C.; Bischof, H. Mahalanobis distance learning for person re-identification. In Person Re-Identification; Springer: London, UK, 2014; pp. 247–267. [Google Scholar]
- Cao, X.; Chen, J.; Imura, H.; Higashi, O. A SVM-based method to extract urban areas from DMSP-OLS and SPOT VGT data. Remote Sens. Environ. 2009, 113, 2205–2209. [Google Scholar] [CrossRef]
Figure 1.
Visible Infrared Imaging Radiometer Suite Day/Night Band (VIIRS DNB) imagery of China in 2013 (unit of the pixel value: n·W·cm−2·sr−1). Insets show the zoomed-in images of Beijing, Chengdu, and Yinchuan.
Figure 1.
Visible Infrared Imaging Radiometer Suite Day/Night Band (VIIRS DNB) imagery of China in 2013 (unit of the pixel value: n·W·cm−2·sr−1). Insets show the zoomed-in images of Beijing, Chengdu, and Yinchuan.

Figure 2.
The 45 reference cities selected for developing and validating the proposed method with their urban population in 2013 [54].
Figure 2.
The 45 reference cities selected for developing and validating the proposed method with their urban population in 2013 [54].

Figure 3.
Framework of the object similarity-based thresholding method.

Figure 4.
Potential urban objects in a VIIRS DNB image of the study area. The insets show the zoom-in for Beijing, Chengdu, and Yinchuan. Different potential urban objects are identified by different non-white colors. The white background corresponds to non-urban area.
Figure 4.
Potential urban objects in a VIIRS DNB image of the study area. The insets show the zoom-in for Beijing, Chengdu, and Yinchuan. Different potential urban objects are identified by different non-white colors. The white background corresponds to non-urban area.

Figure 5.
Scatter plots of the estimated thresholds (n·W·cm−2·sr−1) against the reference optimal thresholds (n·W·cm−2·sr−1) for the validation objects in Tests 1–5 for the logistic regression method (a); the proposed method using Euclidean distance (ED) as similarity measure (b); the proposed method using Mahalanobis distance (MD) as similarity measure (c).

Figure 6.
Urban area mapping result of China with VIIRS DNB data from the proposed method (using ED as similarity measure) in Test 3.
Figure 6.
Urban area mapping result of China with VIIRS DNB data from the proposed method (using ED as similarity measure) in Test 3.

Figure 7.
VIIRS DNB images of eight selected reference cities in Test 3 (a); 750 m reference urban area maps from Landsat classification (b); corresponding urban area mapping results from different methods: results from the city-optimized method (c); results from the logistic regression method (d); results from the proposed method using ED (e) and using MD (f). The combined pixels in gray color and in red color are the urban areas generated from different mapping methods.

Figure 8.
Boxplot of the Kappa Coefficients for each city group for each method, based on the minimum, first quartile, median (the bold line), third quartile, and maximum. Note: 1. The Kappa Coefficient for a city of the object similarity-based method and the logistic regression method refers to the average result of different tests; 2. the widths of the boxes are proportional to the square roots of the number of observations in the groups.

Figure 9.
Relationship of the reference optimal threshold (n·W·cm−2·sr−1) with the mean of the light magnitude and the pixel number of the validation objects in Test 3, with = −0.12, = 0.83, and = −4.70.
Figure 9.
Relationship of the reference optimal threshold (n·W·cm−2·sr−1) with the mean of the light magnitude and the pixel number of the validation objects in Test 3, with = −0.12, = 0.83, and = −4.70.


Table 1.
The numbers of reference urban objects for training and validation from different city groups in five tests.
Table 1.
The numbers of reference urban objects for training and validation from different city groups in five tests.
| Test | Reference Urban Objects | Group 1 | Group 2 | Group 3 | Group 4 |
|---|---|---|---|---|---|
| 1 | Training | 256 | 152 | 214 | 29 |
| Validation | 462 | 209 | 260 | 39 | |
| 2 | Training | 368 | 117 | 202 | 32 |
| Validation | 350 | 244 | 272 | 36 | |
| 3 | Training | 285 | 84 | 226 | 35 |
| Validation | 433 | 277 | 248 | 33 | |
| 4 | Training | 357 | 146 | 262 | 32 |
| Validation | 361 | 215 | 212 | 36 | |
| 5 | Training | 239 | 223 | 220 | 17 |
| Validation | 479 | 138 | 254 | 51 |
Table 2.
Overall accuracies and Kappa Coefficients of the urban area mapping results for reference cities from different methods in five tests.
Table 2.
Overall accuracies and Kappa Coefficients of the urban area mapping results for reference cities from different methods in five tests.
| City Group | City | City-Optimized Method | Logistic Regression Method | Object Similarity-Based Method | |||||||
|---|---|---|---|---|---|---|---|---|---|---|---|
| ED | MD | ||||||||||
| OA (%) | Kappa | OA (%) | Kappa | OA (%) | Kappa | OA (%) | Kappa | ||||
| 1 | Beijing | 81.26 | 0.62 | 73.97 ± 1.244 | 0.47 ± 0.027 | 76.46 ± 0.731 | 0.52 ± 0.015 | 76.33 ± 0.403 | 0.52 ± 0.007 | ||
| Hong Kong | 91.41 | 0.69 | 73.41 ± 2.542 | 0.40 ± 0.030 | 80.17 ± 0.330 | 0.50 ± 0.006 | 77.22 ± 2.685 | 0.43 ± 0.036 | |||
| Nanjing | 89.82 | 0.72 | 83.64 ± 0.415 | 0.56 ± 0.011 | 87.17 ± 0.882 | 0.64 ± 0.022 | 86.81 ± 1.449 | 0.64 ± 0.034 | |||
| Shenyang | 83.57 | 0.66 | 76.52 ± 0.523 | 0.51 ± 0.003 | 78.34 ± 0.658 | 0.54 ± 0.011 | 78.75 ± 1.416 | 0.55 ± 0.033 | |||
| Wuhan | 89.77 | 0.70 | 79.90 ± 2.129 | 0.50 ± 0.021 | 83.14 ± 1.943 | 0.56 ± 0.036 | 80.48 ± 2.221 | 0.51 ± 0.039 | |||
| Xi’an | 85.96 | 0.70 | 80.13 ± 0.706 | 0.58 ± 0.012 | 83.44 ± 0.161 | 0.64 ± 0.003 | 82.44 ± 1.969 | 0.63 ± 0.04 | |||
| Chengdu | 88.65 | 0.73 | 75.08 ± 2.763 | 0.49 ± 0.036 | 81.16 ± 1.861 | 0.58 ± 0.028 | 74.87 ± 5.019 | 0.48 ± 0.082 | |||
| Chongqing | 84.38 | 0.63 | 74.00 ± 1.847 | 0.44 ± 0.028 | 79.95 ± 1.481 | 0.53 ± 0.030 | 78.06 ± 3.205 | 0.52 ± 0.045 | |||
| Tianjin | 88.30 | 0.63 | 81.79 ± 1.360 | 0.50 ± 0.020 | 86.01 ± 1.161 | 0.58 ± 0.018 | 86.18 ± 0.947 | 0.58 ± 0.015 | |||
| Guangzhou & Foshan | 75.69 | 0.49 | 67.44 ± 2.002 | 0.36 ± 0.020 | 70.85 ± 2.908 | 0.42 ± 0.044 | 67.44 ± 5.231 | 0.37 ± 0.079 | |||
| 2 | Changchun | 84.29 | 0.67 | 75.11 ± 2.120 | 0.50 ± 0.035 | 76.14 ± 3.347 | 0.53 ± 0.052 | 77.55 ± 5.629 | 0.55 ± 0.100 | ||
| Hangzhou | 83.69 | 0.63 | 77.73 ± 0.829 | 0.52 ± 0.006 | 79.64 ± 0.910 | 0.54 ± 0.006 | 78.48 ± 2.108 | 0.53 ± 0.016 | |||
| Harbin | 91.59 | 0.70 | 86.72 ± 1.182 | 0.58 ± 0.022 | 90.71 ± 0.218 | 0.67 ± 0.008 | 91.15 ± 0.282 | 0.70 ± 0.010 | |||
| Jinan | 91.09 | 0.74 | 85.14 ± 0.274 | 0.56 ± 0.031 | 87.98 ± 1.775 | 0.64 ± 0.043 | 87.36 ± 0.539 | 0.60 ± 0.013 | |||
| Suzhou | 83.39 | 0.67 | 78.87 ± 0.469 | 0.58 ± 0.009 | 80.77 ± 0.456 | 0.62 ± 0.009 | 80.38 ± 0.563 | 0.61 ± 0.011 | |||
| Xuzhou | 87.53 | 0.66 | 81.09 ± 0.832 | 0.49 ± 0.024 | 85.66 ± 0.639 | 0.57 ± 0.012 | 85.48 ± 0.317 | 0.55 ± 0.016 | |||
| Zhengzhou | 86.43 | 0.65 | 78.88 ± 1.137 | 0.50 ± 0.012 | 82.58 ± 1.197 | 0.57 ± 0.023 | 82.05 ± 2.852 | 0.56 ± 0.059 | |||
| 3 | Changde | 94.29 | 0.78 | 83.83 ± 0.437 | 0.38 ± 0.052 | 90.40 ± 2.756 | 0.64 ± 0.049 | 92.22 ± 1.551 | 0.69 ± 0.059 | ||
| Fuzhou | 89.08 | 0.74 | 83.58 ± 0.370 | 0.60 ± 0.019 | 87.02 ± 1.908 | 0.68 ± 0.054 | 86.34 ± 0.909 | 0.66 ± 0.025 | |||
| Guiyang | 92.38 | 0.69 | 90.10 ± 0.365 | 0.58 ± 0.029 | 91.99 ± 0.424 | 0.63 ± 0.030 | 91.51 ± 0.177 | 0.60 ± 0.011 | |||
| Haikou | 90.16 | 0.65 | 82.98 ± 1.864 | 0.46 ± 0.027 | 87.63 ± 1.107 | 0.57 ± 0.017 | 87.72 ± 0.847 | 0.57 ± 0.027 | |||
| Hefei | 90.83 | 0.73 | 86.68 ± 0.156 | 0.65 ± 0.004 | 89.71 ± 0.871 | 0.71 ± 0.020 | 89.57 ± 0.555 | 0.71 ± 0.015 | |||
| Hohhot | 86.22 | 0.70 | 75.52 ± 2.595 | 0.49 ± 0.027 | 84.20 ± 0.990 | 0.64 ± 0.035 | 82.84 ± 0.726 | 0.61 ± 0.032 | |||
| Kunming | 91.06 | 0.77 | 84.17 ± 0.566 | 0.62 ± 0.016 | 87.94 ± 0.226 | 0.70 ± 0.006 | 89.11 ± 0.204 | 0.73 ± 0.005 | |||
| Lanzhou | 91.82 | 0.79 | 86.60 ± 0.358 | 0.67 ± 0.010 | 88.94 ± 0.500 | 0.70 ± 0.008 | 88.02 ± 2.079 | 0.68 ± 0.058 | |||
| Nanchang | 88.81 | 0.73 | 85.32 ± 0.914 | 0.63 ± 0.039 | 84.07 ± 3.017 | 0.56 ± 0.111 | 85.51 ± 0.379 | 0.62 ± 0.022 | |||
| Nanning | 87.49 | 0.67 | 80.80 ± 2.114 | 0.53 ± 0.021 | 85.49 ± 1.301 | 0.63 ± 0.039 | 85.37 ± 2.559 | 0.63 ± 0.090 | |||
| Nanyang | 85.76 | 0.66 | 75.22 ± 1.011 | 0.43 ± 0.006 | 82.62 ± 2.220 | 0.56 ± 0.067 | 82.26 ± 1.914 | 0.58 ± 0.028 | |||
| Shijiazhuang | 82.86 | 0.63 | 76.43 ± 0.394 | 0.46 ± 0.007 | 78.41 ± 0.989 | 0.48 ± 0.032 | 80.49 ± 1.650 | 0.54 ± 0.050 | |||
| Urumqi | 91.60 | 0.77 | 86.21 ± 0.778 | 0.62 ± 0.014 | 88.66 ± 0.645 | 0.66 ± 0.023 | 88.11 ± 0.725 | 0.65 ± 0.034 | |||
| Wenzhou | 90.19 | 0.69 | 84.31 ± 0.834 | 0.53 ± 0.002 | 87.36 ± 1.175 | 0.60 ± 0.016 | 88.14 ± 0.157 | 0.60 ± 0.012 | |||
| Xiamen | 89.87 | 0.70 | 79.02 ± 2.878 | 0.50 ± 0.044 | 80.47 ± 4.066 | 0.53 ± 0.064 | 79.79 ± 7.477 | 0.53 ± 0.128 | |||
| Xining | 93.45 | 0.78 | 89.03 ± 0.211 | 0.60 ± 0.016 | 89.44 ± 0.756 | 0.59 ± 0.003 | 91.33 ± 0.847 | 0.65 ± 0.044 | |||
| Yichang | 92.90 | 0.69 | 84.89 ± 2.150 | 0.47 ± 0.034 | 91.18 ± 0.431 | 0.65 ± 0.002 | 90.77 ± 1.004 | 0.62 ± 0.043 | |||
| Yinchuan | 89.74 | 0.72 | 78.83 ± 1.372 | 0.49 ± 0.008 | 85.71 ± 0.834 | 0.62 ± 0.002 | 88.34 ± 0.398 | 0.69 ± 0.014 | |||
| 4 | Bengbu | 90.27 | 0.66 | 86.38 ± 0.410 | 0.53 ± 0.038 | 89.06 ± 1.280 | 0.60 ± 0.052 | 89.83 ± 0.920 | 0.62 ± 0.052 | ||
| Chaoyang | 87.18 | 0.64 | 77.41 ± 1.532 | 0.36 ± 0.067 | 83.49 ± 1.471 | 0.43 ± 0.078 | 82.85 ± 3.157 | 0.40 ± 0.135 | |||
| Chengde | 92.22 | 0.60 | 88.71 ± 0.104 | 0.47 ± 0.010 | 92.16 ± 0.502 | 0.54 ± 0.049 | 91.96 ± 1.535 | 0.47 ± 0.171 | |||
| Hengyang | 89.05 | 0.67 | 77.66 ± 1.039 | 0.36 ± 0.047 | 85.87 ± 0.297 | 0.50 ± 0.069 | 86.15 ± 0.537 | 0.50 ± 0.068 | |||
| Jingdezhen | 94.13 | 0.74 | 90.66 ± 0.356 | 0.48 ± 0.035 | 91.85 ± 0.477 | 0.53 ± 0.038 | 91.98 ± 0.210 | 0.54 ± 0.014 | |||
| Lhasa | 87.70 | 0.60 | 82.01 ± 0.940 | 0.56 ± 0.017 | 83.86 ± 1.666 | 0.56 ± 0.032 | 85.78 ± 0.939 | 0.59 ± 0.018 | |||
| Linfen | 78.33 | 0.55 | 75.14 ± 0.594 | 0.46 ± 0.023 | 75.84 ± 0.785 | 0.47 ± 0.020 | 73.47 ± 1.375 | 0.41 ± 0.041 | |||
| Mudanjiang | 93.75 | 0.72 | 90.17 ± 0.185 | 0.58 ± 0.006 | 92.07 ± 0.770 | 0.59 ± 0.037 | 92.52 ± 0.696 | 0.63 ± 0.049 | |||
| Xingtai | 80.39 | 0.58 | 69.42 ± 0.735 | 0.30 ± 0.012 | 73.68 ± 6.937 | 0.35 ± 0.227 | 71.87 ± 9.671 | 0.29 ± 0.328 | |||
Note: 1. The bold text and the underlined text represent, respectively, the largest and the second largest OAs and Kappa Coefficients for each city; 2. As Guangzhou and Foshan are geographically too close to be split up, the two cities were processed as one and share only one incorporative accuracy assessment result; 3. a ± b stands for average ± standard deviation.
© 2018 by the authors. Licensee MDPI, Basel, Switzerland. This article is an open access article distributed under the terms and conditions of the Creative Commons Attribution (CC BY) license (http://creativecommons.org/licenses/by/4.0/).
Share and Cite
MDPI and ACS Style
Ma, W.; Li, P. An Object Similarity-Based Thresholding Method for Urban Area Mapping from Visible Infrared Imaging Radiometer Suite Day/Night Band (VIIRS DNB) Data. Remote Sens. 2018, 10, 263. https://doi.org/10.3390/rs10020263
AMA Style
Ma W, Li P. An Object Similarity-Based Thresholding Method for Urban Area Mapping from Visible Infrared Imaging Radiometer Suite Day/Night Band (VIIRS DNB) Data. Remote Sensing. 2018; 10(2):263. https://doi.org/10.3390/rs10020263
Chicago/Turabian StyleMa, Wenting, and Peijun Li. 2018. "An Object Similarity-Based Thresholding Method for Urban Area Mapping from Visible Infrared Imaging Radiometer Suite Day/Night Band (VIIRS DNB) Data" Remote Sensing 10, no. 2: 263. https://doi.org/10.3390/rs10020263
Note that from the first issue of 2016, this journal uses article numbers instead of page numbers. See further details here.