
An Optimized Approach for Extracting Urban Land Based on Log-Transformed DMSP-OLS Nighttime Light, NDVI, and NDWI
by
 , ,
, ,
Yuanmao Zheng
1,2 ,
,
Qiang Zhou
1,2,
Yuanrong He
3,4,
Cuiping Wang
5,
Xiaorong Wang
3,4 and
Haowei Wang
1,* 1
Key Lab of Urban Environment and Health, Institute of Urban Environment, Chinese Academy of Sciences, Xiamen 361021, China
2
University of Chinese Academy of Sciences, Beijing 100049, China
3
College of Computer and Information Engineering, Xiamen University of Technology, Xiamen 361024, China
4
Big Data Institute of Digital Natural Disaster Monitoring in Fujian, Xiamen University of Technology, Xiamen 361024, China
5
College of Harbour and Environmental Engineering, Jimei University, Xiamen 361021, China
*
Author to whom correspondence should be addressed.
Remote Sens. 2021, 13(4), 766; https://doi.org/10.3390/rs13040766
Submission received: 30 December 2020
/
Revised: 30 January 2021
/
Accepted: 17 February 2021
/
Published: 19 February 2021
(This article belongs to the Special Issue Remote Sensing of Nighttime Observations)
Abstract
:Quantitative and accurate urban land information on regional and global scales is urgently required for studying socioeconomic and eco-environmental problems. The spatial distribution of urban land is a significant part of urban development planning, which is vital for optimizing land use patterns and promoting sustainable urban development. Composite nighttime light (NTL) data from the Defense Meteorological Program Operational Line-Scan System (DMSP-OLS) have been proven to be effective for extracting urban land. However, the saturation and blooming within the DMSP-OLS NTL hinder its capacity to provide accurate urban information. This paper proposes an optimized approach that combines NTL with multiple index data to overcome the limitations of extracting urban land based only on NTL data. We combined three sources of data, the DMSP-OLS, the normalized difference vegetation index (NDVI), and the normalized difference water index (NDWI), to establish a novel approach called the vegetation–water-adjusted NTL urban index (VWANUI), which is used to rapidly extract urban land areas on regional and global scales. The results show that the proposed approach reduces the saturation of DMSP-OLS and essentially eliminates blooming effects. Next, we developed regression models based on the normalized DMSP-OLS, the human settlement index (HSI), the vegetation-adjusted NTL urban index (VANUI), and the VWANUI to analyze and estimate urban land areas. The results show that the VWANUI regression model provides the highest performance of all the models tested. To summarize, the VWANUI reduces saturation and blooming, and improves the accuracy with which urban areas are extracted, thereby providing valuable support and decision-making references for designing sustainable urban development.
1. Introduction
Urbanization is an important force that is shaping current development patterns [1]. Between 1950 and 2014, the proportion of the world’s population living in cities rose from 30% to 54%, and the global urban population is expected to rise by an additional 2.5 billion in the next few decades, with most of this increase occurring in Asia and Africa [2]. This massive immigration into cities has resulted in rapid urban expansion [3]. Although urban land accounts for only a small part of the global surface, it has a significant impact on climate, biogeochemical cycles, biodiversity, and hydrology on local, regional, and even global scales. Rapid urban expansion has led to resource depletion, water shortages, air pollution, urban heat islands, and other environmental problems, which constitute serious challenges to global and regional sustainable development [4,5]. Urban land is increasingly recognized as an important but difficult-to-quantify component of models for global change [6]. Therefore, the timely and accurate quantification of urban information is vital for assessing the relationship between urbanization and the environmental consequences. In addition, it forms the basis for optimizing land use patterns and promoting sustainable urban development [7,8,9]. To avoid confusion, we use the term “urban land” in this work to refer to impervious land surfaces (i.e., manmade coverings and constructions) [10,11].
Traditionally, obtaining urban land information has been based on the socioeconomic statistics of administrative units [12], but this approach lacks sufficient spatial information. Nowadays, remote sensing technology can be used to observe and acquire regular, large-scale data on urban land, and satellite images are now widely used to monitor urban areas [13]. Previous studies mainly used high- or medium-spatial-resolution images to extract information on individual urban areas [14,15,16]. However, large-scale urban agglomerations require a large number of costly high- or medium-spatial-resolution images, as well as a large amount of time, labor, and computing resources for the processing and interpretation of these images, which means that such data are not suitable for extracting information on large-scale urban land expansion [17]. Thus, it remains difficult to rapidly obtain information on urban land expansion and evolution on a large scale and in a short time, especially in areas undergoing rapid urbanization, such as the Guangdong–Hong Kong–Macao Greater Bay Area of China. Therefore, improved approaches are urgently needed for extracting and analyzing the spatial distribution and evolution of urban land.
Nighttime light (NTL) data from the Defense Meteorological Satellite Program’s Operational Line-Scan System (DMSP-OLS) have proven to be valuable and reliable for mapping urban areas on regional and global scales [18,19,20]. The DMSP-OLS has the requisite low-light sensitivity for detecting artificial lighting from the Earth’s surface at night, and NTL has been widely used in research on urban areas, e.g., mapping [21,22], population estimation [23,24], carbon emission inventory [25,26], and monitoring urbanization [27,28]. Therefore, NTL data provide an alternative or complementary approach for drawing urban maps on regional and global scales [13,29,30]. Researchers have already used DMSP-OLS NTL images to infer the extent of urban areas on regional, national, and global scales [31,32,33,34,35]. For instance, Shi et al. [31] used the threshold method to quantify the urban land areas in 12 major Chinese cities in 2012, and Lu et al. [32] combined DMSP-OLS and terra moderate-resolution imaging spectroradiometry (MODIS) normalized difference vegetation index (NDVI) data to map urban areas in southeastern China, which improved estimates of urban areas. Bagan and Yamagata [33] investigated the spatiotemporal dynamics of urban expansion in Japan. Goldblatt et al. [21] combined NTL with Landsat-8 data to extract the urban land cover of India, Mexico, and the United States and emphasized the benefits of data fusion technology for urban land extraction. Zhang and Seto [34] mapped urbanization dynamics on regional and global scales by applying an iterative unsupervised classification approach, which showed that NTL provides an avenue for regional and, potentially, global land measurements, and Zhou et al. [35] developed consistent spatiotemporal urban maps on a global scale. Although the above research has made contributions, challenges remain for extracting urban land area using DMSP-OLS NTL data because these data are subject to blooming and saturation [36]. Blooming effects arise from incoherent light radiating in all directions from light sources on the Earth’s surface. For instance, the dispersion of light brightness to surrounding areas [37,38] leads to blooming effects from the light brightness. By contrast, the saturation is due to the limited radiometric range of DMSP-OLS [6]. These two deficiencies combine to degrade the precision of urban land information extracted from DMSP-OLS NTL [39].
Blooming effects tend to lead to overestimates of larger urban areas based solely on DMSP-OLS NTL data [40,41]. Simultaneously, saturation in bright urban core areas hinders the use of NTL to accurately estimate urban land areas or to separate different types of land cover [32]. However, the combination of remote sensing data from multiple sources may provide more information than any single source because each source has different characteristics. Previous studies revealed a strong negative correlation between the vegetation index and urban impermeable surface [42], and recent approaches have attempted to combine the vegetation index and NTL images to more accurately extract urban areas [32,41,43]. For instance, Lu et al. [32] combined DMSP-OLS NTL with NDVI data to build a human settlement index (HSI) for mapping urban settlements. However, the HSI overcorrects for saturation from suburban areas, resulting in a loss of available data around urban areas [43]. The vegetation-adjusted NTL urban index (VANUI) was also developed to correct NTL saturation [43]. The NDVI is limited in its ability to distinguish urban land from nonurban land (such as water and wasteland) and cannot identify water bodies around urban land, such as coastal areas. The normalized difference water index (NDWI), however, effectively differentiates between water and nonwater features [44] and can thereby compensate for the limitations of the HSI and VANUI, which consider only NDVI contributions.
Another major obstacle to using DMSP-OLS NTL for urban studies is data saturation; that is, the NTL data for urban core areas tend to be truncated because of the limited radiometric range of DMSP-OLS. Some techniques have been developed to correct NTL saturation; for instance, Letu et al. [45] proposed a saturated nighttime light correction approach to correcting the DMSP-OLS stable nighttime light based on a cubic regression equation (CRE). Then, Letu et al. [46] again put forward a saturated DMSP-OLS nighttime light correction method based on a DMSP-OLS nighttime radiance calibration image. Ziskin et al. [47] attempted to calibrate the radiation brightness by changing the gain on the sensor. In addition, Liu et al. [17] developed a method for systematically correcting multiyear and multisatellite stable NTL data, which were used to correct the on-board calibration and influence of the differences between sensors, differences in crossing time between satellites, and degradation of the sensors during the long time series of the DMSP-OLS data [17,48]. However, the radiation calibration of NTL data is difficult and time-consuming. To improve the accuracy of urban mapping on regional and global scales, simple methods based on combining MODIS NDVI and NTL data, such as the HSI and VANUI, have been proposed for alleviating saturation [32,43]. However, the HSI and VANUI themselves have some limitations.
Thus, given the inherent problems caused by blooming and saturation in DMSP-OLS NTL data, which hinder the wide application of these data for the accurate extraction of urban land information, we propose an optimized approach, namely, the vegetation–water-adjusted NTL urban index (VWANUI), for extracting accurate and timely urban information. The innovative aspect of the VWANUI is that it significantly reduces the blooming and saturation inherent in DMSP-OLS NTL data from urban areas by combining a logarithmic transformation with the NDVI and NDWI to improve the differentiation between urban and nonurban land while better retaining surface details. In short, the aim of this study was to improve the precision of urban land extraction, and our specific objective was to reduce the blooming and saturation inherent in DMSP-OLS NTL data by the proposed approach.
2. Materials and Methods
2.1. Materials
2.1.1. Research Area
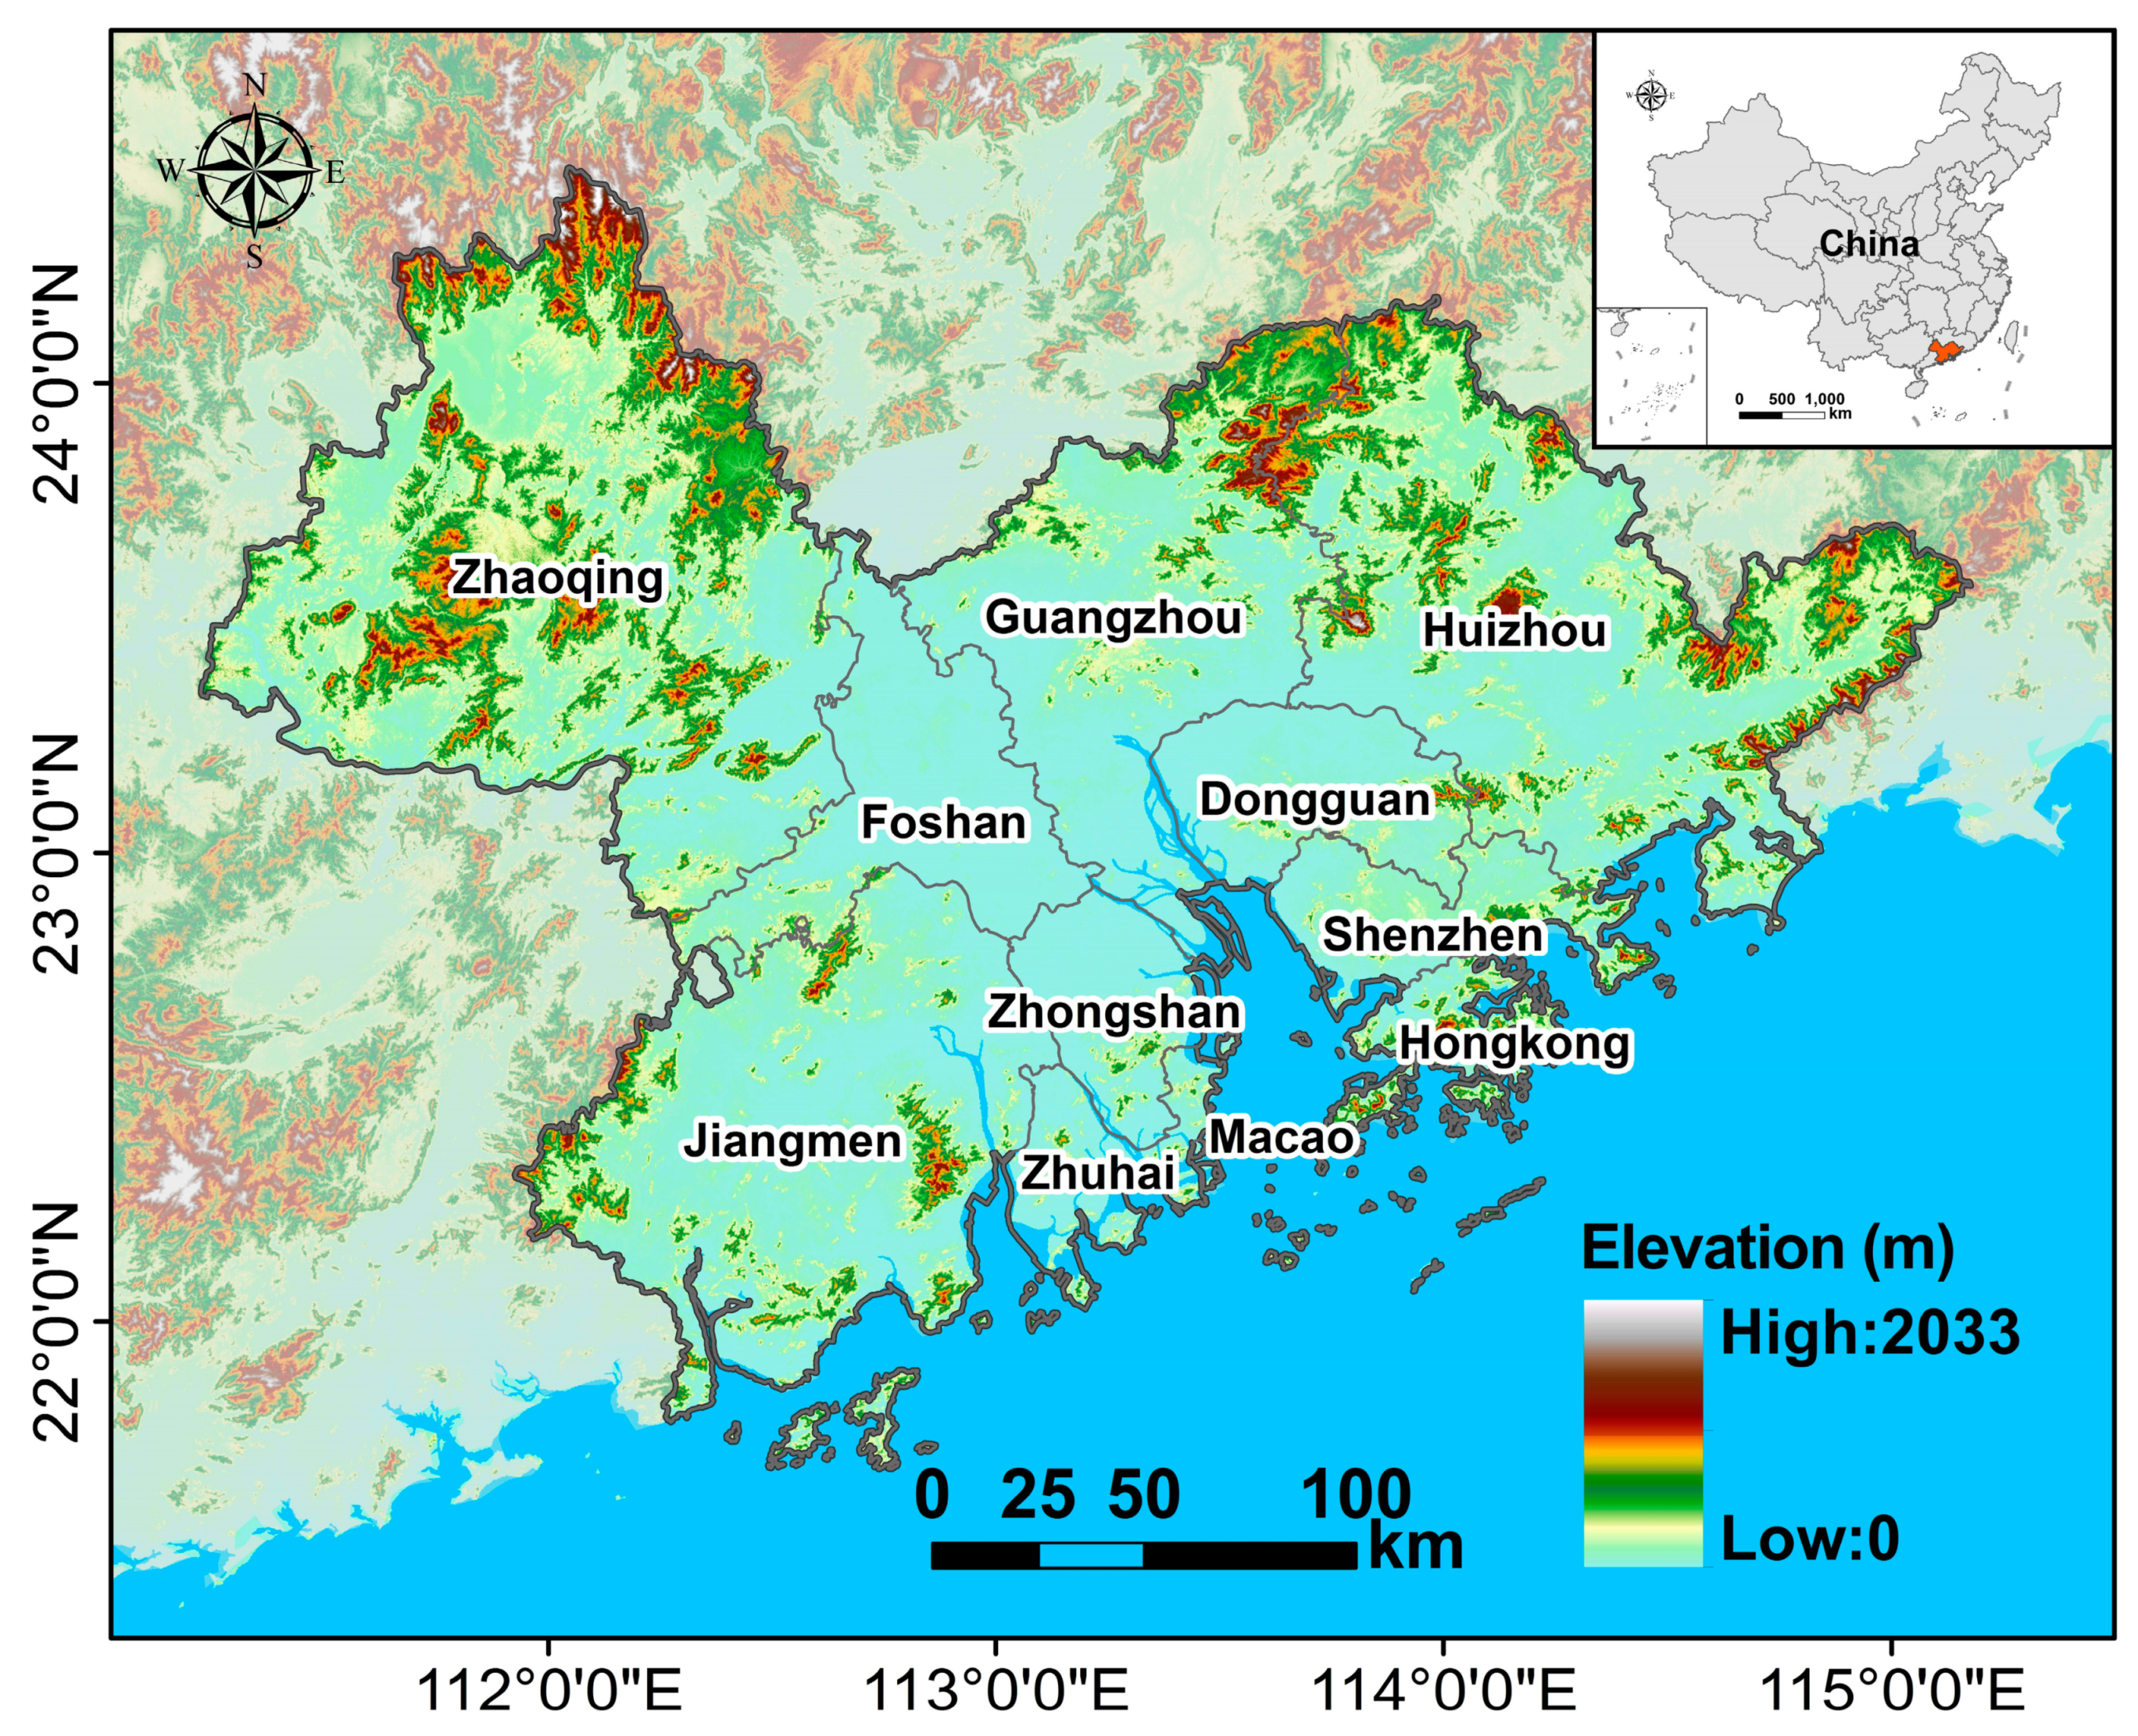
The research area was the Guangdong–Hong Kong–Macao Greater Bay Area of southern China, which has experienced unprecedented urbanization and rapid economic growth over the past 40 years. This urban agglomeration consists of 11 cities with a total area of about 56,000 km2 (Figure 1). In 2018, the population was 71.16 million. This area has long been the “vanguard” of China’s urban development. Although the area takes up less than 1% of China’s land area, it accounted for 12.17% of the national GDP in 2017.
2.1.2. Data Sources
This study used the DMSP-OLS NTL remote sensing data for 2012 from the National Oceanic and Atmospheric Administration National Geophysical Data Center (NOAA NGDC; https://ngdc.noaa.gov/eog/dmsp/downloadV4composites.html). The dataset is composed of the average digital numbers (DNs) of stable light images for an entire year. The DNs for light in the NTL images range from 1 to 63, whereas the background and noise are recorded as zeros.
The NDVI and NDWI were calculated from Landsat-8 OLI data with a 30 m resolution, and Landsat series satellite data were acquired from the International Scientific Data Service Platform, Computer Network Information Center, Chinese Academy of Sciences (CAS). The DMSP-OLS, NDVI, and NDWI were re-registered and projected onto the Albers Conical Equal Area Projection. The DMSP-OLS datasets were resampled by bilinear fitting to the same spatial resolution of 30 m.
The land use/cover (LUC) dataset was high-resolution data at 30 m that were derived from the Resource and Environment Data Cloud Platform of the CAS (http://www.resdc.cn/). Then, the “urban land” derived from the LUC dataset was used as reference data to verify the extraction accuracy, establish regression models, and, finally, validate the performance of the VWANUI.
2.2. Methods
2.2.1. Vegetation–Water-Adjusted Nighttime Light Urban Index (VWANUI)
Following the research of Zhang et al. [43] and Li et al. [49], we propose, herein, the VWANUI to improve the extraction of urban land based on DMSP-OLS NTL, the NDVI, and the NDWI. The VWANUI is calculated as follows:
where NIR refers to the near-infrared band; RED, to the red band; G, to the green band; MIR, to the mid-infrared band; and NTL, to the DMSP-OLS NTL for the study area.
First, the NTL data were processed by applying a logarithmic transformation of the radiation intensity. The sharp jump in radiation intensity around the urban core areas was restrained, and the difference in radiation intensity between the nonurban core areas and the suburban areas was enhanced, which contributed to amplifying the NTL difference between urban and nonurban areas [50]. Therefore, applying the function log10(NTL) (i.e., the logarithmic transformation of the DMSP-OLS NTL composite data) improved the extraction of urban land from NTL composite data.
Second, the NDVI was calculated from Landsat-8 OLI data. The NDVI ranges from −1 to 1, where greater positive values indicate denser vegetation-covered areas and more negative values indicate larger nonvegetated areas [51,52]. In other words, the greater the NDVI, the higher the density of green vegetation coverage. Previous studies also showed that vegetation abundance correlates negatively with urban impervious surface area [53]. Although the NDVI is affected by atmospheric scattering, advanced satellite systems have been thoroughly calibrated to obtain accurate values for the NDVI [54]. The expression 1 − NDVI represents a greater weight of nonvegetated areas in the urban core areas rather than the surrounding areas, which also leads to an increase in data variability in the urban core areas [43]. Therefore, the value of 1 − NDVI for the urban core areas approaches 1, while the value for vegetation-rich nonurban areas is close to zero. The combination of 1 − NDVI and NTL can reduce the saturation of NTL in urban core areas and facilitate the rapid identification of changes in these areas.
The NDWI also ranges from −1 to 1. Theoretically, a positive NDWI indicates water bodies, whereas a negative NDWI indicates nonwater areas [55]. However, a negative NDWI may actually represent a water body—for example, due to bare sediment in rivers, lakes, and seas. The present study shows that the threshold value of the NDWI for water bodies is −0.1. Thus, we used −0.1 as the NDWI threshold value for water bodies. Thus, in this study, NDWI < −0.1 was assigned a value of 1, and NDWI > −0.1 was assigned a value of zero. This is expressed by Equation (3), where the binary index NDWIB can remove water bodies within urban areas. The combination of NDWIB and NTL eliminates blooming from the NTL data for rivers and other water bodies.
To summarize, we combined a logarithmic transformation with the NDVI and NDWI to reduce the saturation of NTL data from urban core areas and eliminate the blooming of NTL data from water bodies and vegetation areas of urban core areas, both of which help to improve the accuracy with which urban land is extracted.
Following the method of Li et al. [49], we used the VWANUI to extract urban land areas. Specifically, the urban land derived from the LUC dataset was used as reference data to determine the optimal threshold of the VWANUI. Because the spatial resolution of the LUC dataset (30 m) is much finer than that of DMSP-OLS data (1000 m), it is feasible to use LUC to produce urban land as reference data for evaluation [41,56,57]. The optimal threshold for the VWANUI was determined as follows:
where Tj is the threshold of the VWANUI in city j and Kappaj is the Kappa coefficient calculated according to the urban land extracted by the VWANUI and the reference data. Specifically, the urban land was extracted by the VWANUI based on the threshold Tj, and the extracted urban land and the reference data were used to calculate the Kappa coefficient. and are the minimum and maximum values of the VWANUI in city j, respectively. Finally, areas with a VWANUI that exceeded the optimal threshold were extracted as the urban land of a given city.
Then, according to the confusion matrix [58], the Kappa coefficient [58] was calculated as follows:
where r is the number of rows in the matrix; xij is the value at row i and column j; xi+ and x+j are the marginal totals of row i and column j, respectively; and N is the total number of observations.
In addition, the LUC dataset published by CAS has been proven to represent the actual land cover for the corresponding year [17]. According to the research of Li et al. and He et al. [17,39], the “urban land” of the LUC dataset published by CAS was used as reference data to verify the extraction results. This supports the credibility of the verification results obtained in the present study.
2.2.2. Accuracy of Urban Land Extraction
Shao et al. [59] and Liu et al. [60] demonstrated that if only a single index is used to verify the accuracy of map classification and extraction, the accuracy evaluation will contain errors and will be unreliable. Therefore, in this study, the accuracy and reliability were evaluated by using the overall accuracy (OA), the producer’s accuracy (PA), the user’s accuracy (UA), and the F-score. The OA, PA, and UA were all calculated by using the confusion matrix table [59]. The error matrix shown in Table 1 was based on the work of Shao et al. [59] and Olofsson et al. [61]. The table also contains the formulas for calculating the PA and UA.
2.2.3. Verifying the Optimality
To thoroughly verify the optimality of the proposed approach based on logarithmic transformation and vegetation and water indexes, we also considered five NTL composite indicators: the NTL vegetation index (NVI), NTL water index (NWI), logarithmic NTL vegetation index (LNVI), logarithmic NTL water index (LNWI), and NTL vegetation–water index (NVWI). These indicators were calculated as follows:
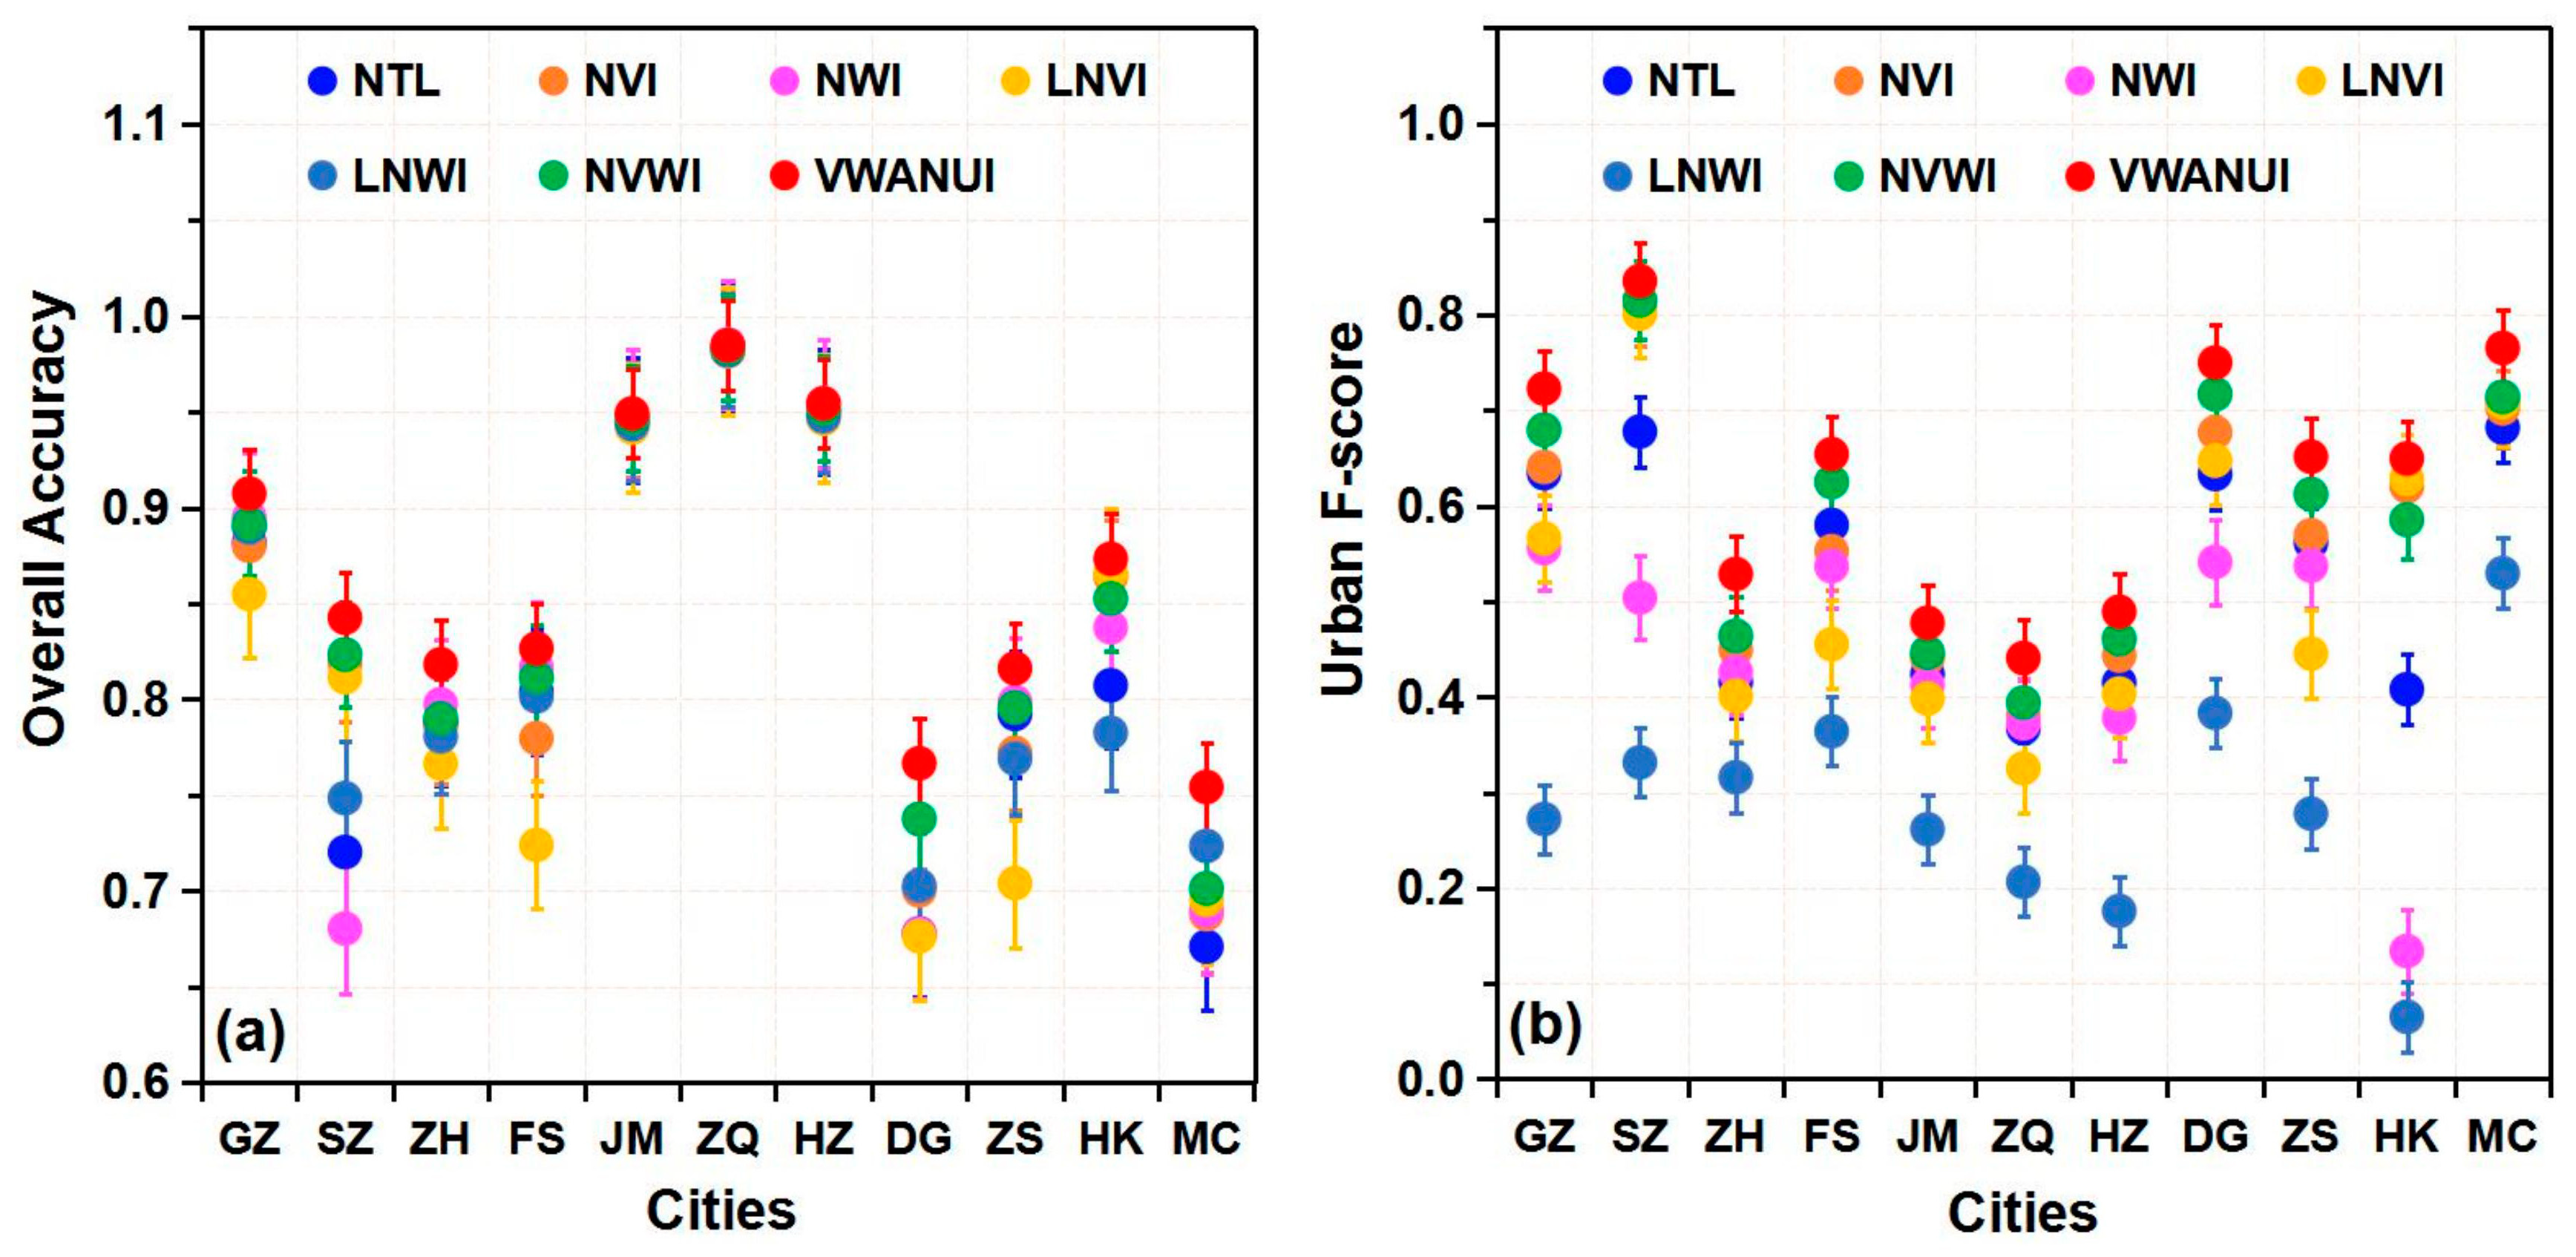
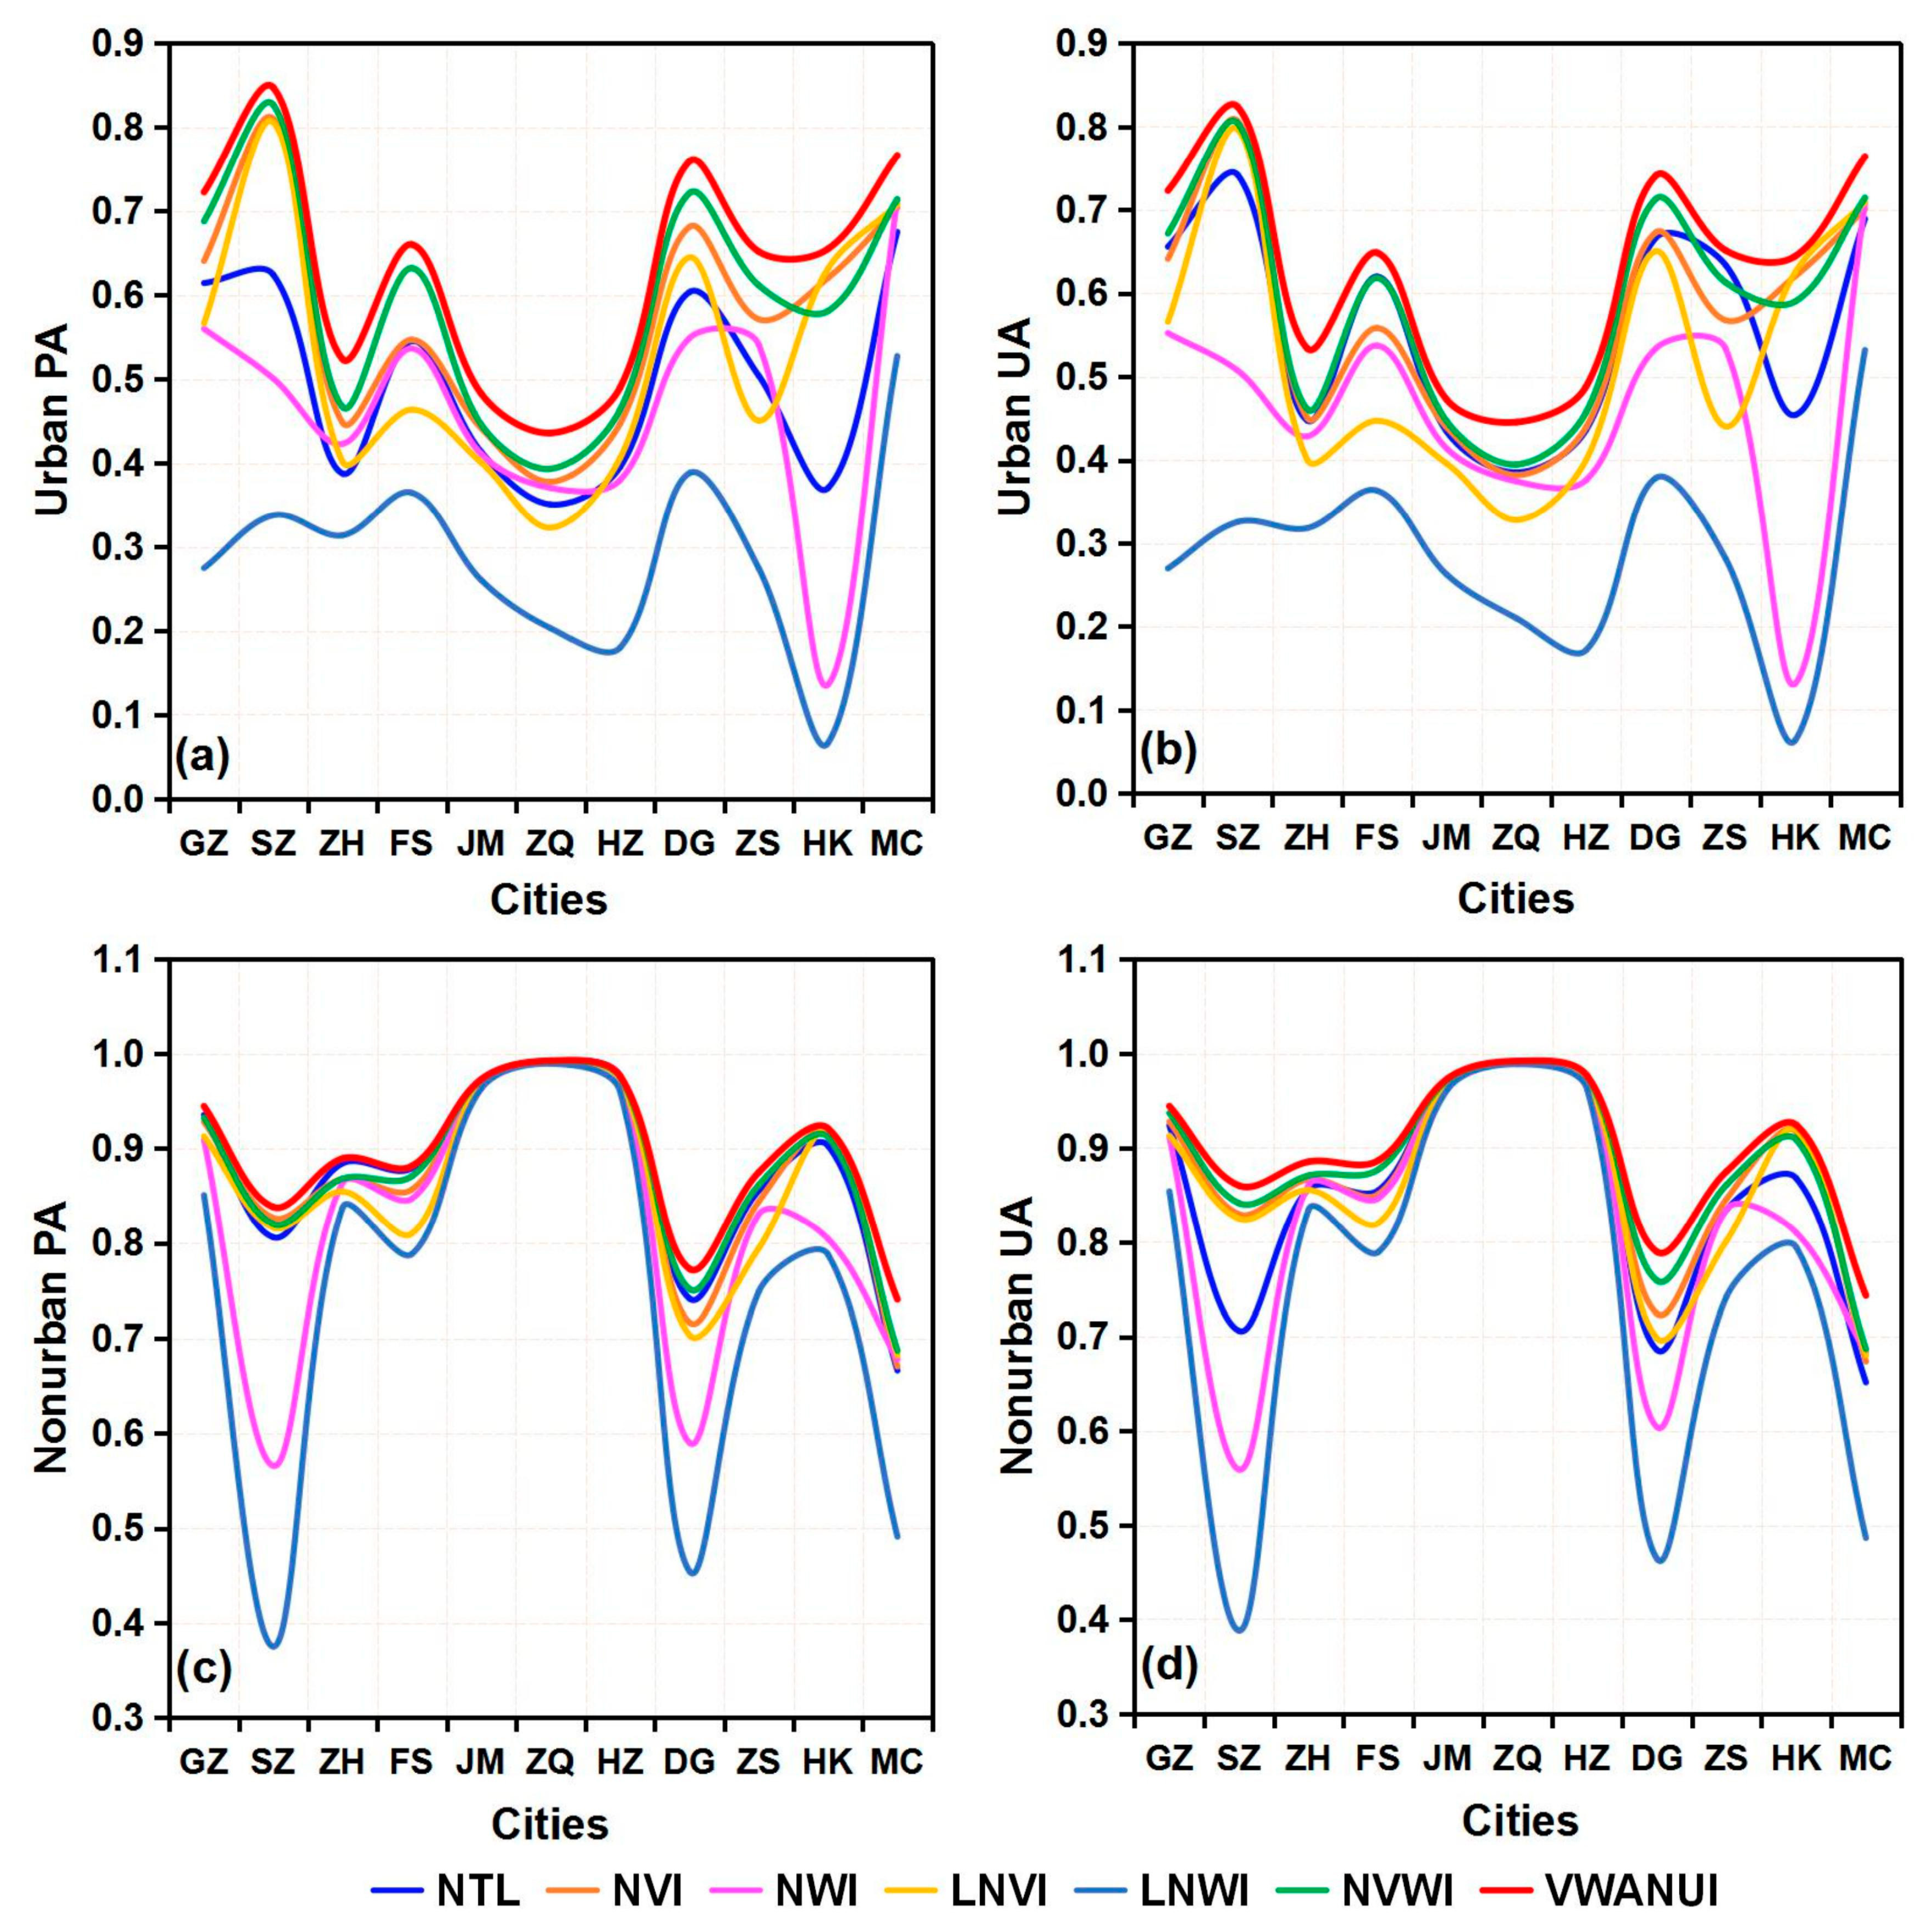
In this study, the overall accuracy, PA, UA, and F-score of urban land extracted based on different indicators were used to fully confirm the optimality of the approach with these indicators (Figure 2 and Figure 3). Specifically, the mean OA obtained with the VWANUI was 4.29%, 2.96%, 3.74%, 4.77%, 3.84%, and 1.89% higher than that obtained by using the NTL, NVI, NWI, LNVI, LNWI, and NVWI, respectively. Likewise, the corresponding mean urban PA was 13.74%, 6.42%, 17.05%, 10.85%, 34.59%, and 4.10% higher; the corresponding mean urban UA was 7.02%, 5.98%, 16.72%, 10.70%, 34.19%, and 4.11% greater; and the corresponding urban F-score was 10.61%, 6.20%, 16.88%, 10.77%, 34.39%, and 4.10% greater.
The results show that, for urban areas extracted using the VWANUI, the overall accuracy, PA, UA, and F-score are all larger than for urban areas extracted using the other indexes. In brief, compared with these different indicators, the VWANUI provides the highest accuracy for the OA, urban PA, urban UA, and F-score for all the cities in the study area. Therefore, the proposed approach based on the log-transformed NTL and vegetation and water indexes is the optimal approach.
3. Results
3.1. Advantage of Using the VWANUI
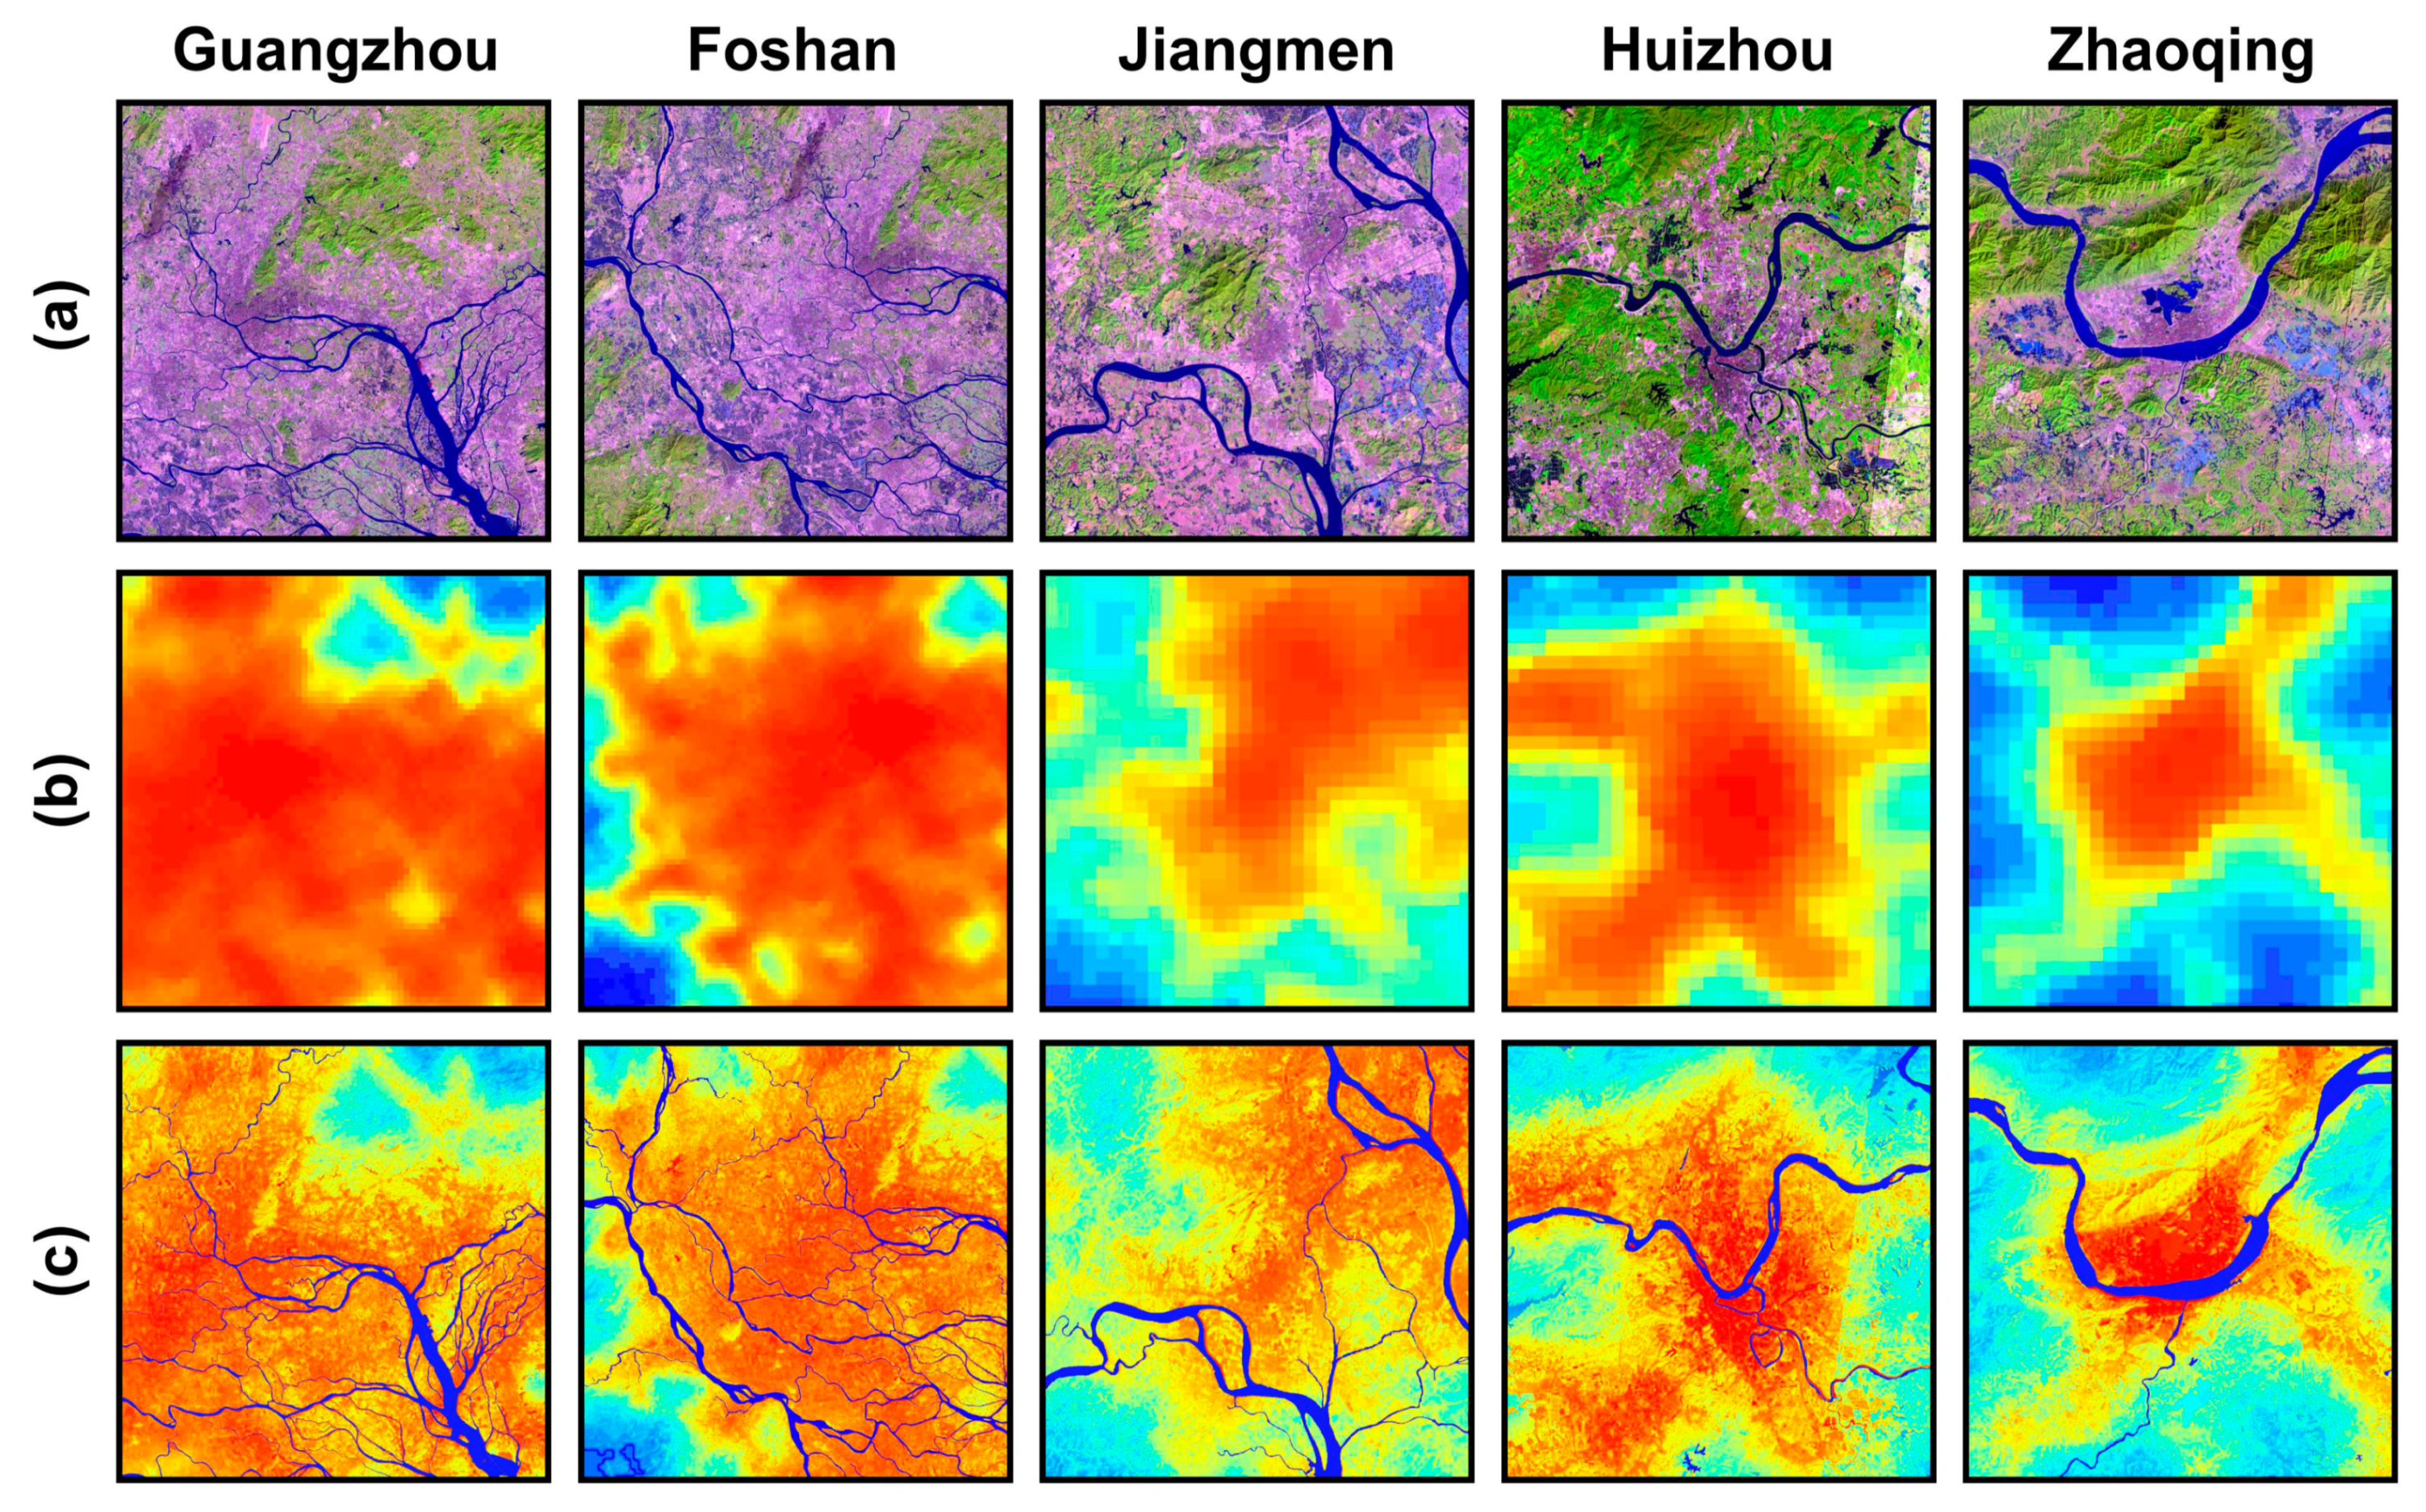
To verify the advantages of the proposed approach, VWANUI images (Figure 4c) and DMSP-OLS NTL images (Figure 4b) were compared with higher-resolution Landsat-8 OLI images (Figure 4a) for five rapidly urbanizing cities: Guangzhou, Foshan, Jiangmen, Huizhou, and Zhaoqing. As shown in Figure 4, the NTL of the urban core areas is constant because of saturation. In addition, the blooming effects in the NTL data give a higher DN to the dispersed images around the urban areas. However, the VWANUI images succeed in separating nonurban land cover from urban land, even in the surrounding urban areas (Figure 4c).
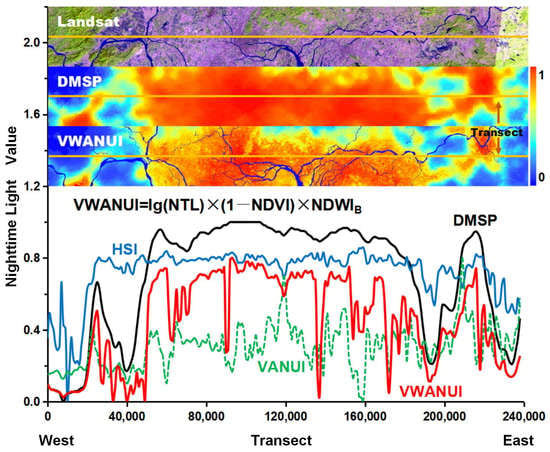
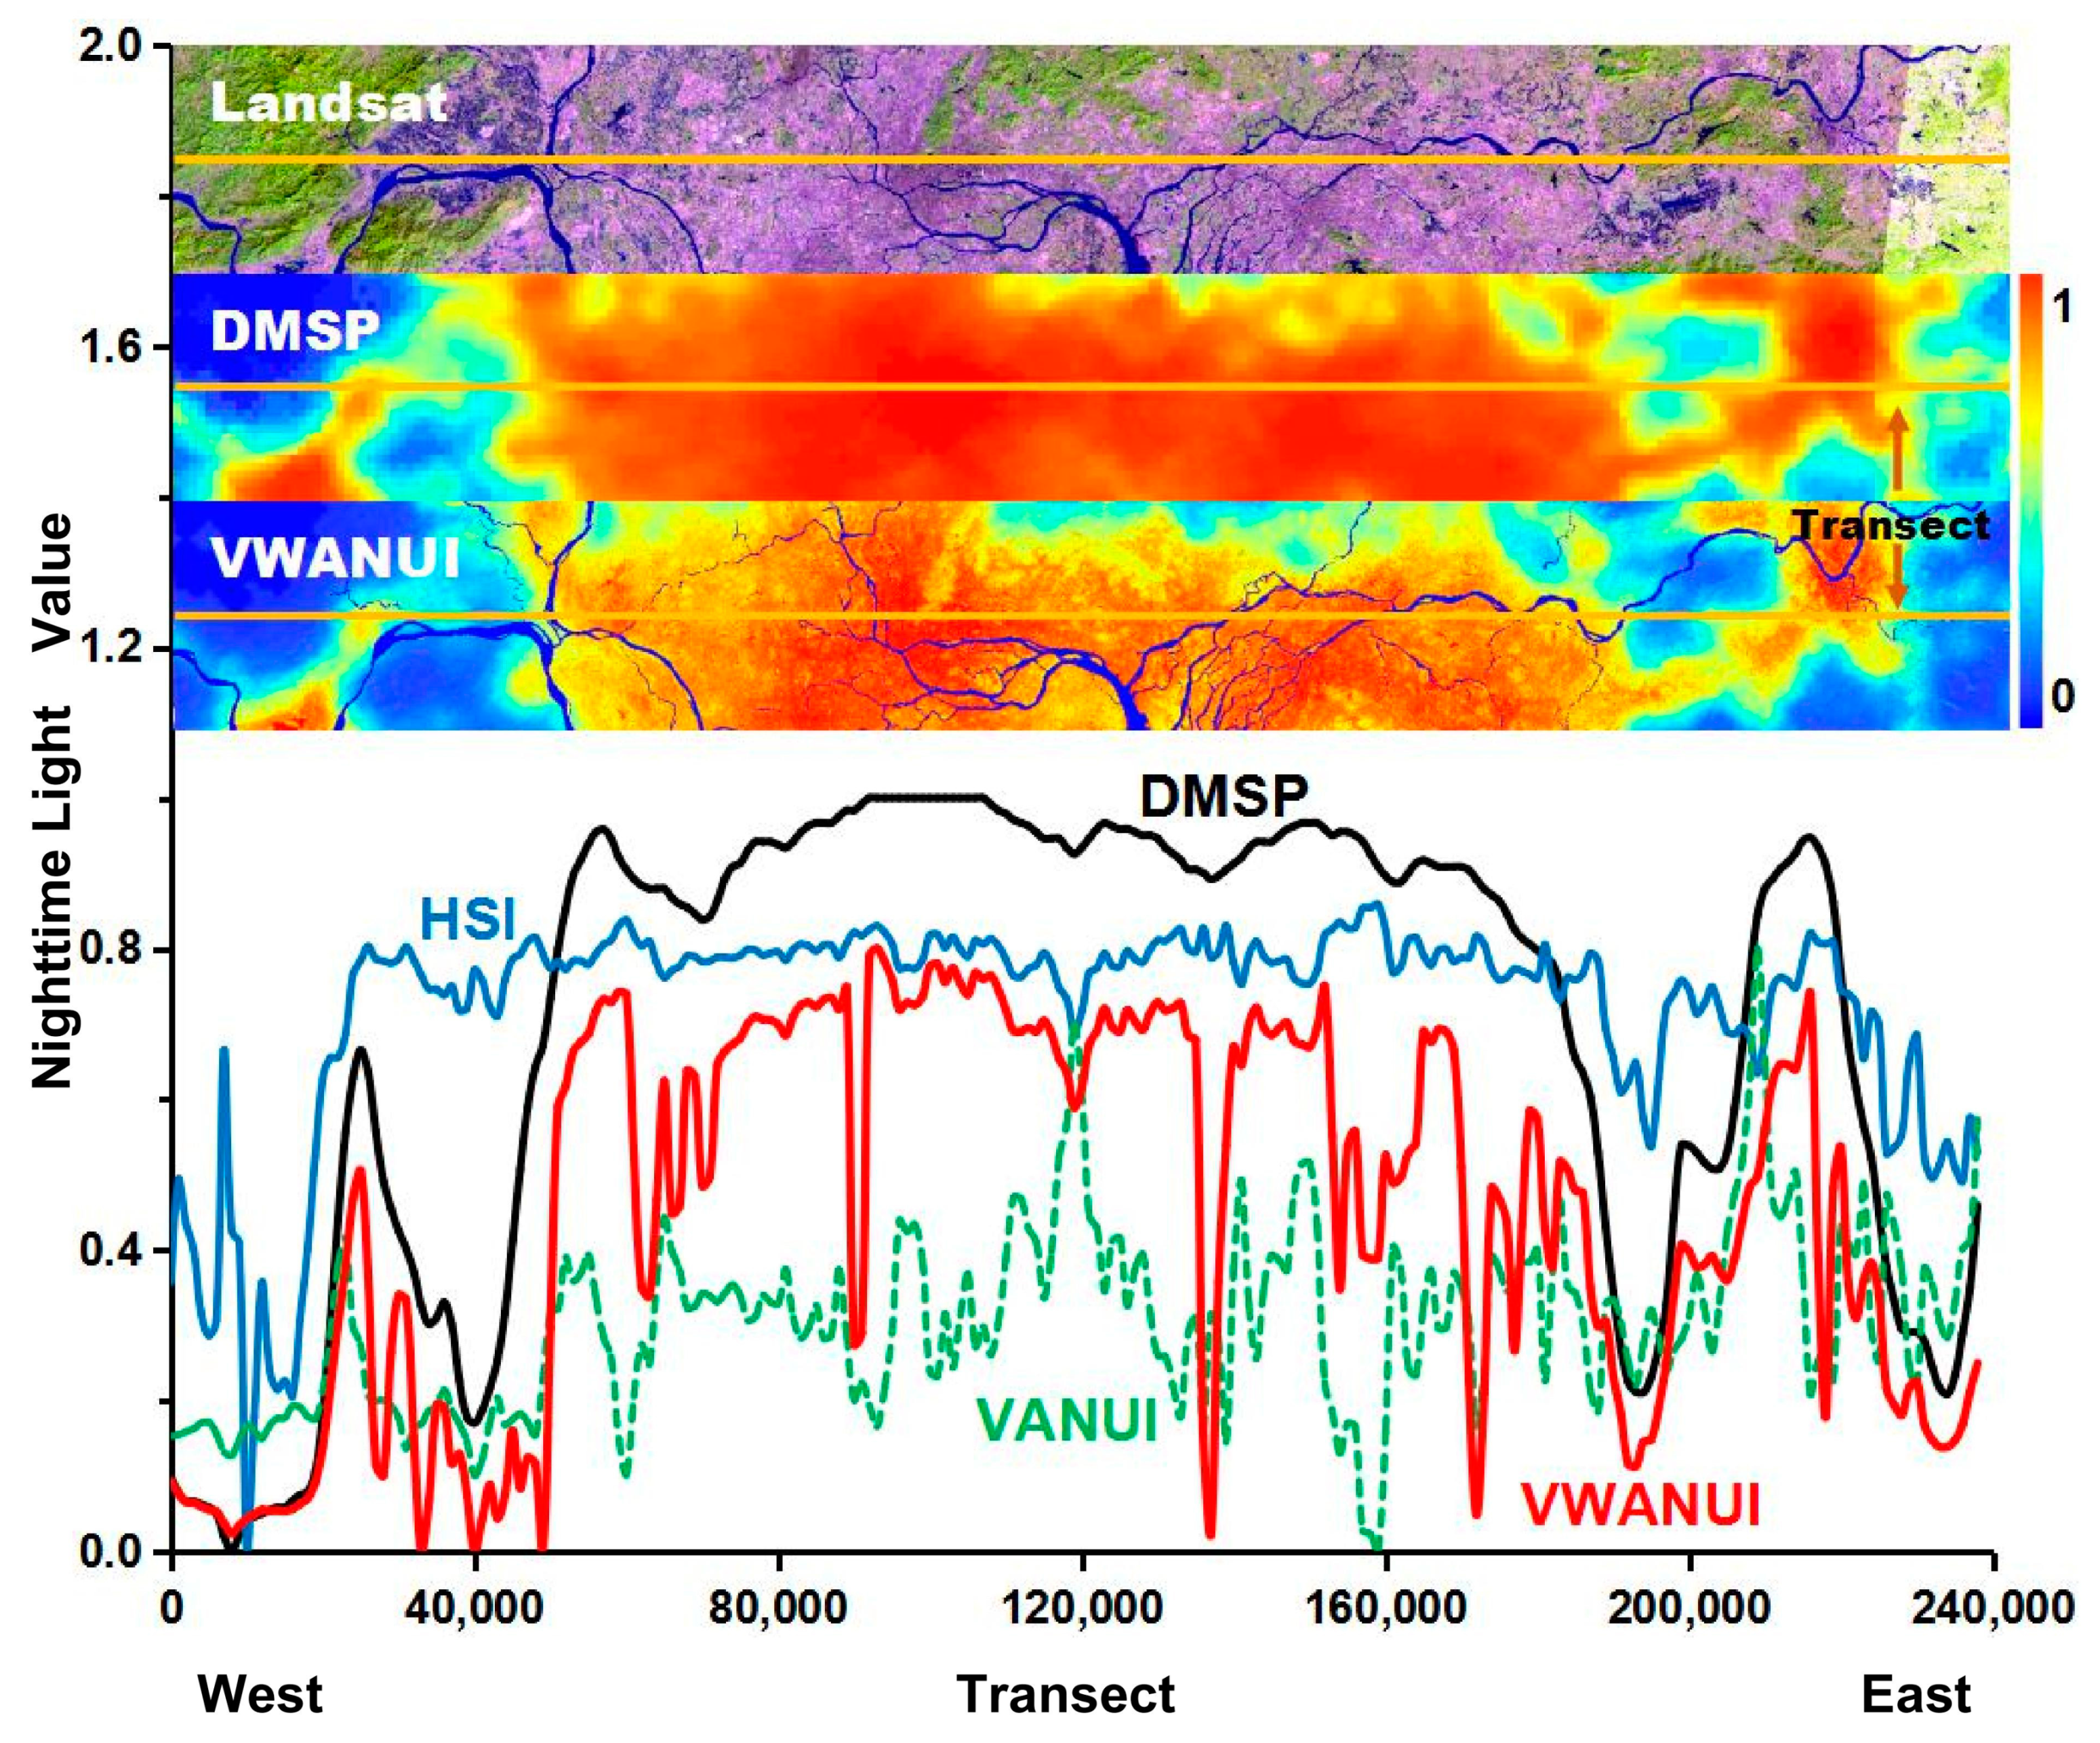
To further evaluate the capability of the VWANUI to reduce saturation and eliminate blooming, the saturated DMSP-OLS NTL, HSI, VANUI, and VWANUI were visually compared along a latitudinal transect through the research areas (Figure 5). The VWANUI image changes significantly in the urban core areas, and its ground surface texture is abundant. Although the HSI, VANUI, and VWANUI can reduce the saturation of the NTL data and increase the variability in urban areas, the VWANUI image has greater variability in the core urban areas and so more clearly benefits from the reduced saturation of the NTL data.
In addition, the VWANUI can eliminate blooming in the DMSP-OLS NTL. However, neither the VANUI nor the HSI reduces blooming because they remain at high values for nonurban land cover, especially water bodies and vegetation areas in core urban areas. By contrast, the VWANUI for these areas is exceptionally low—almost or close to zero, as shown in Figure 5. The results show that the VWANUI effectively eliminates blooming.
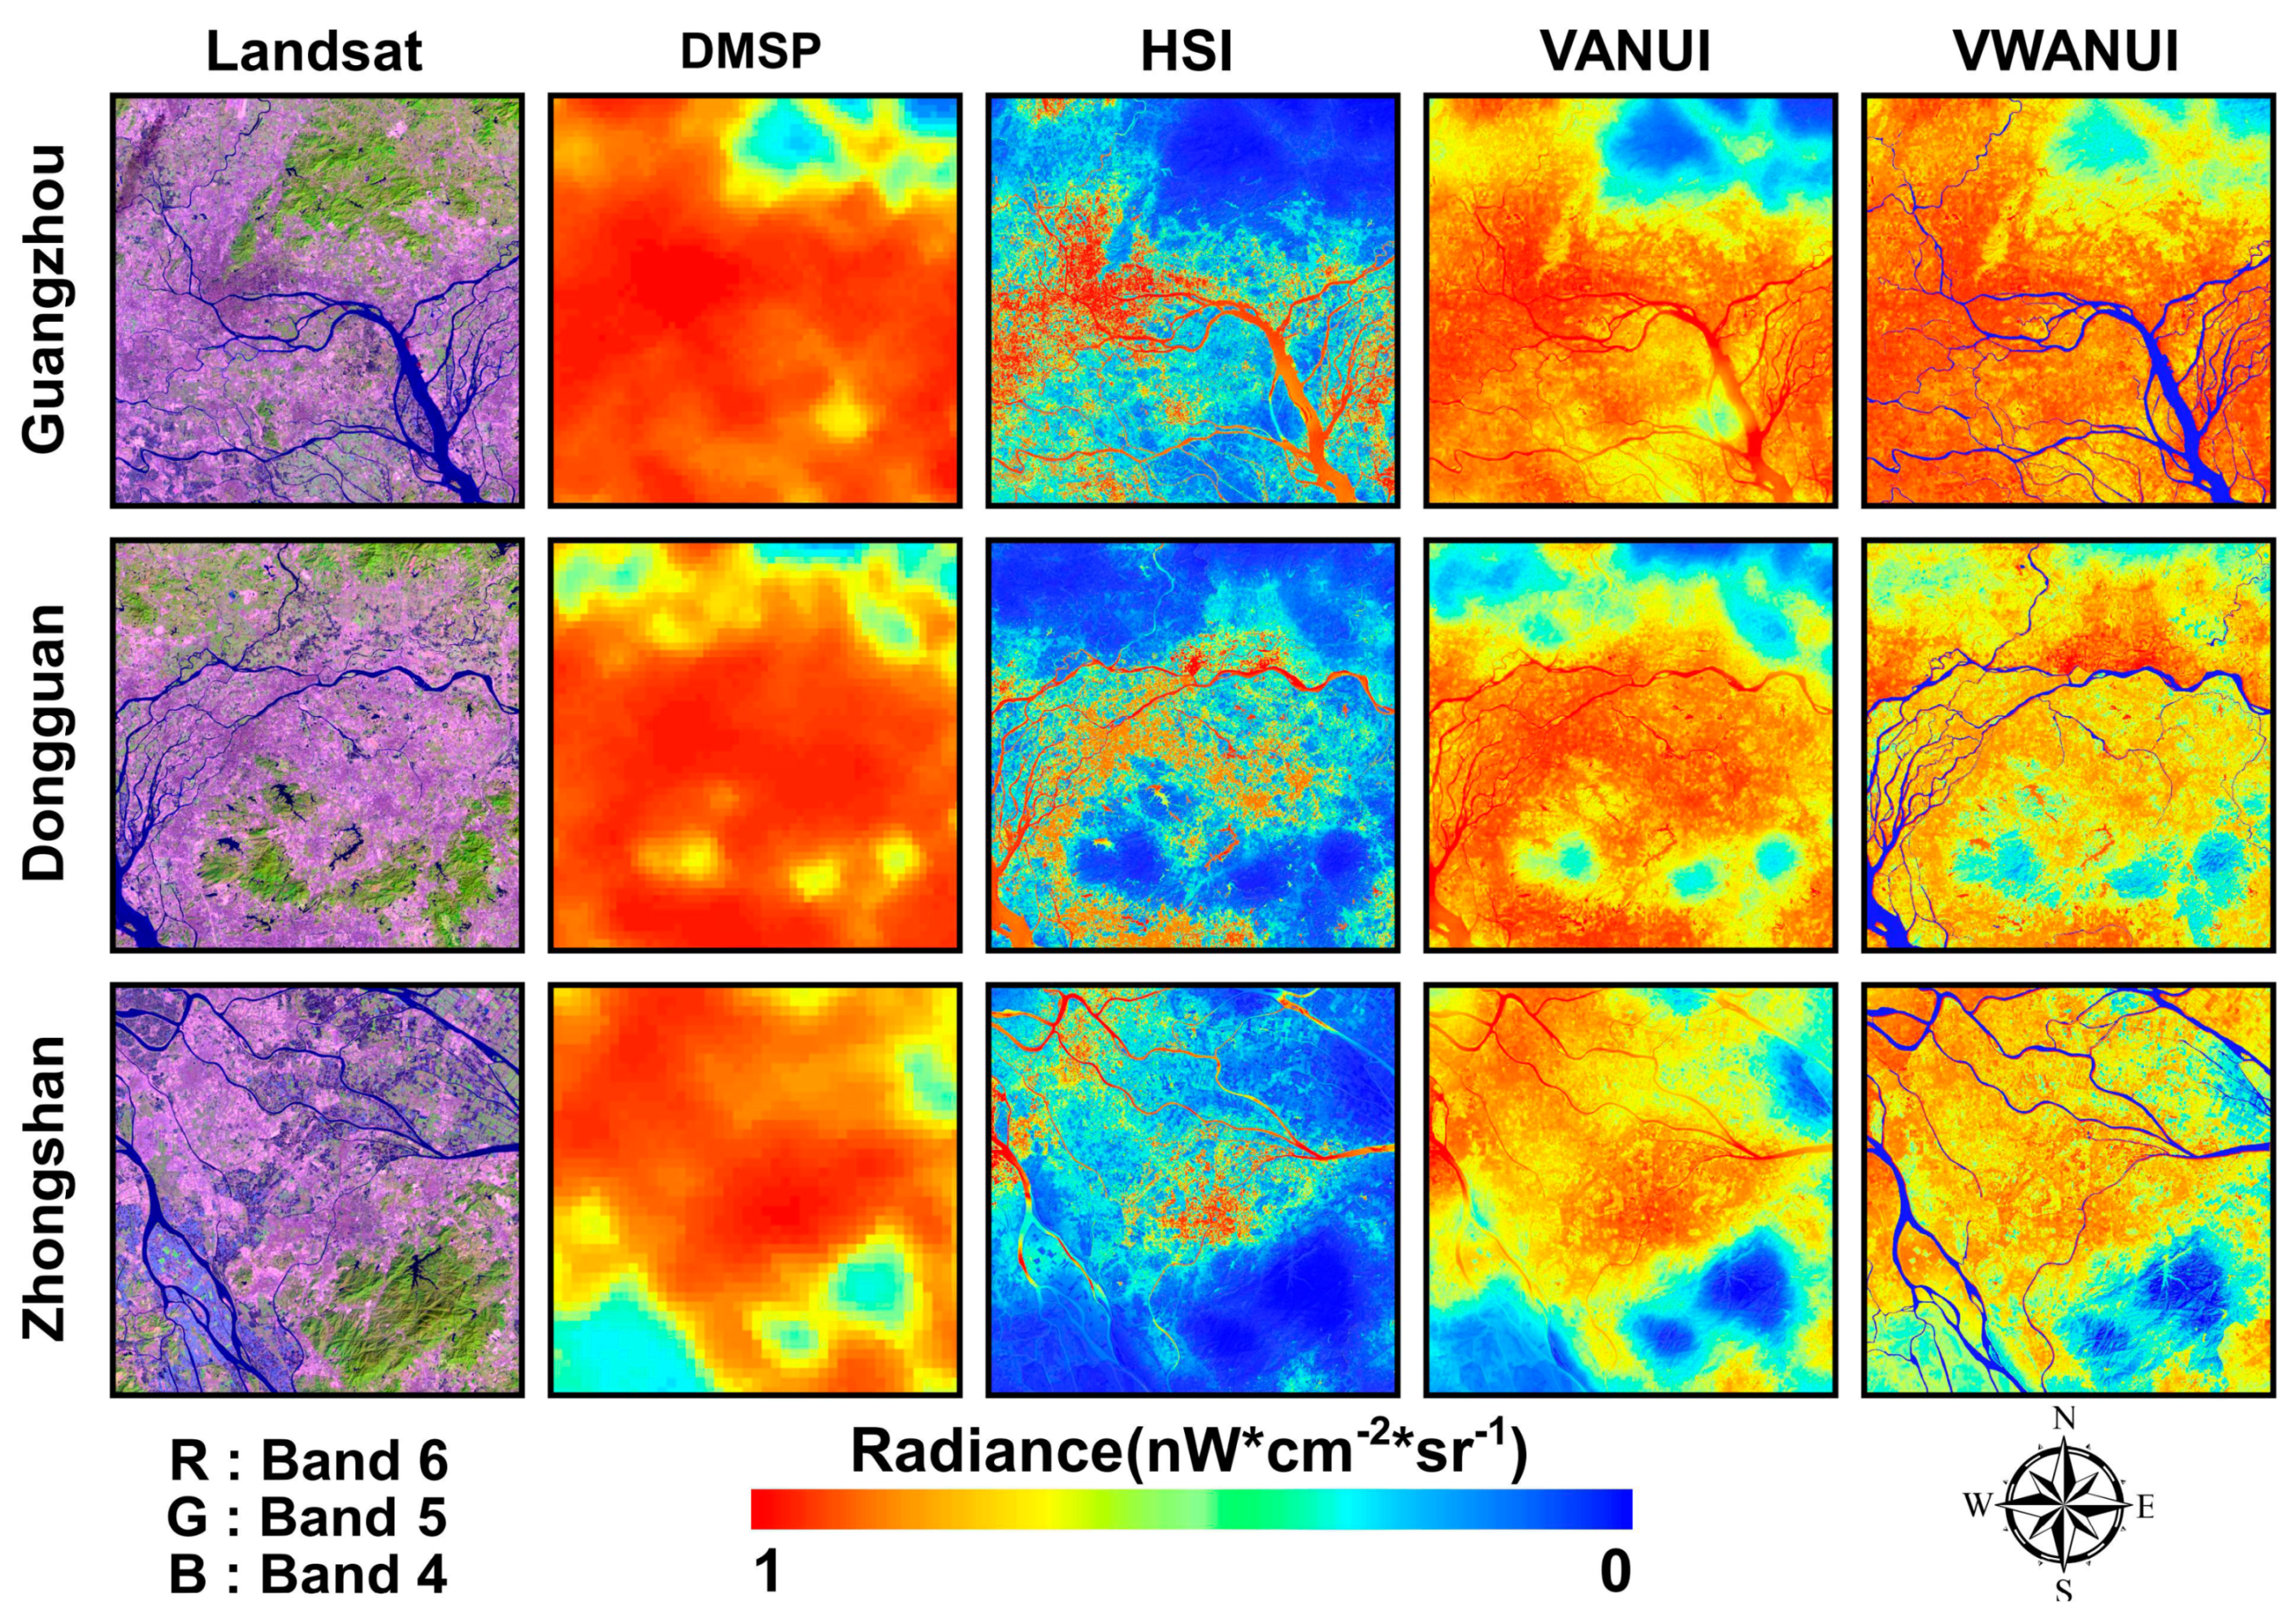
This study not only analyzed the latitudinal transect of the research areas, but also compared cities with different economic levels. Figure 6 visually compares the corrected images obtained by applying the different approaches to the different cities. In the DMSP-OLS NTL images, the urban coastline or riverbank and lakeside are significantly affected by the blooming of the NTL. Blooming is the most obvious phenomenon in the image, and the flashing NTL entering the adjacent water bodies is apparent. Figure 6 also shows that neither the VANUI nor the HSI can distinguish water bodies from urban land areas, whereas the VWANUI accurately removes water bodies and vegetation areas within the urban areas to reveal an accurate spatial distribution of urban land. In a word, NTL blooming is significantly reduced or even eliminated in the VWANUI images.
3.2. Accuracy of the Various Approaches
The accuracy with which urban land is extracted reflects the extent to which saturation and blooming are reduced. In the present work, we selected 11 cities as samples for comparing the urban land extracted by using the DMSP, HSI, and VANUI and the proposed VWANUI to assess the accuracy with which urban land is extracted by using the VWANUI.
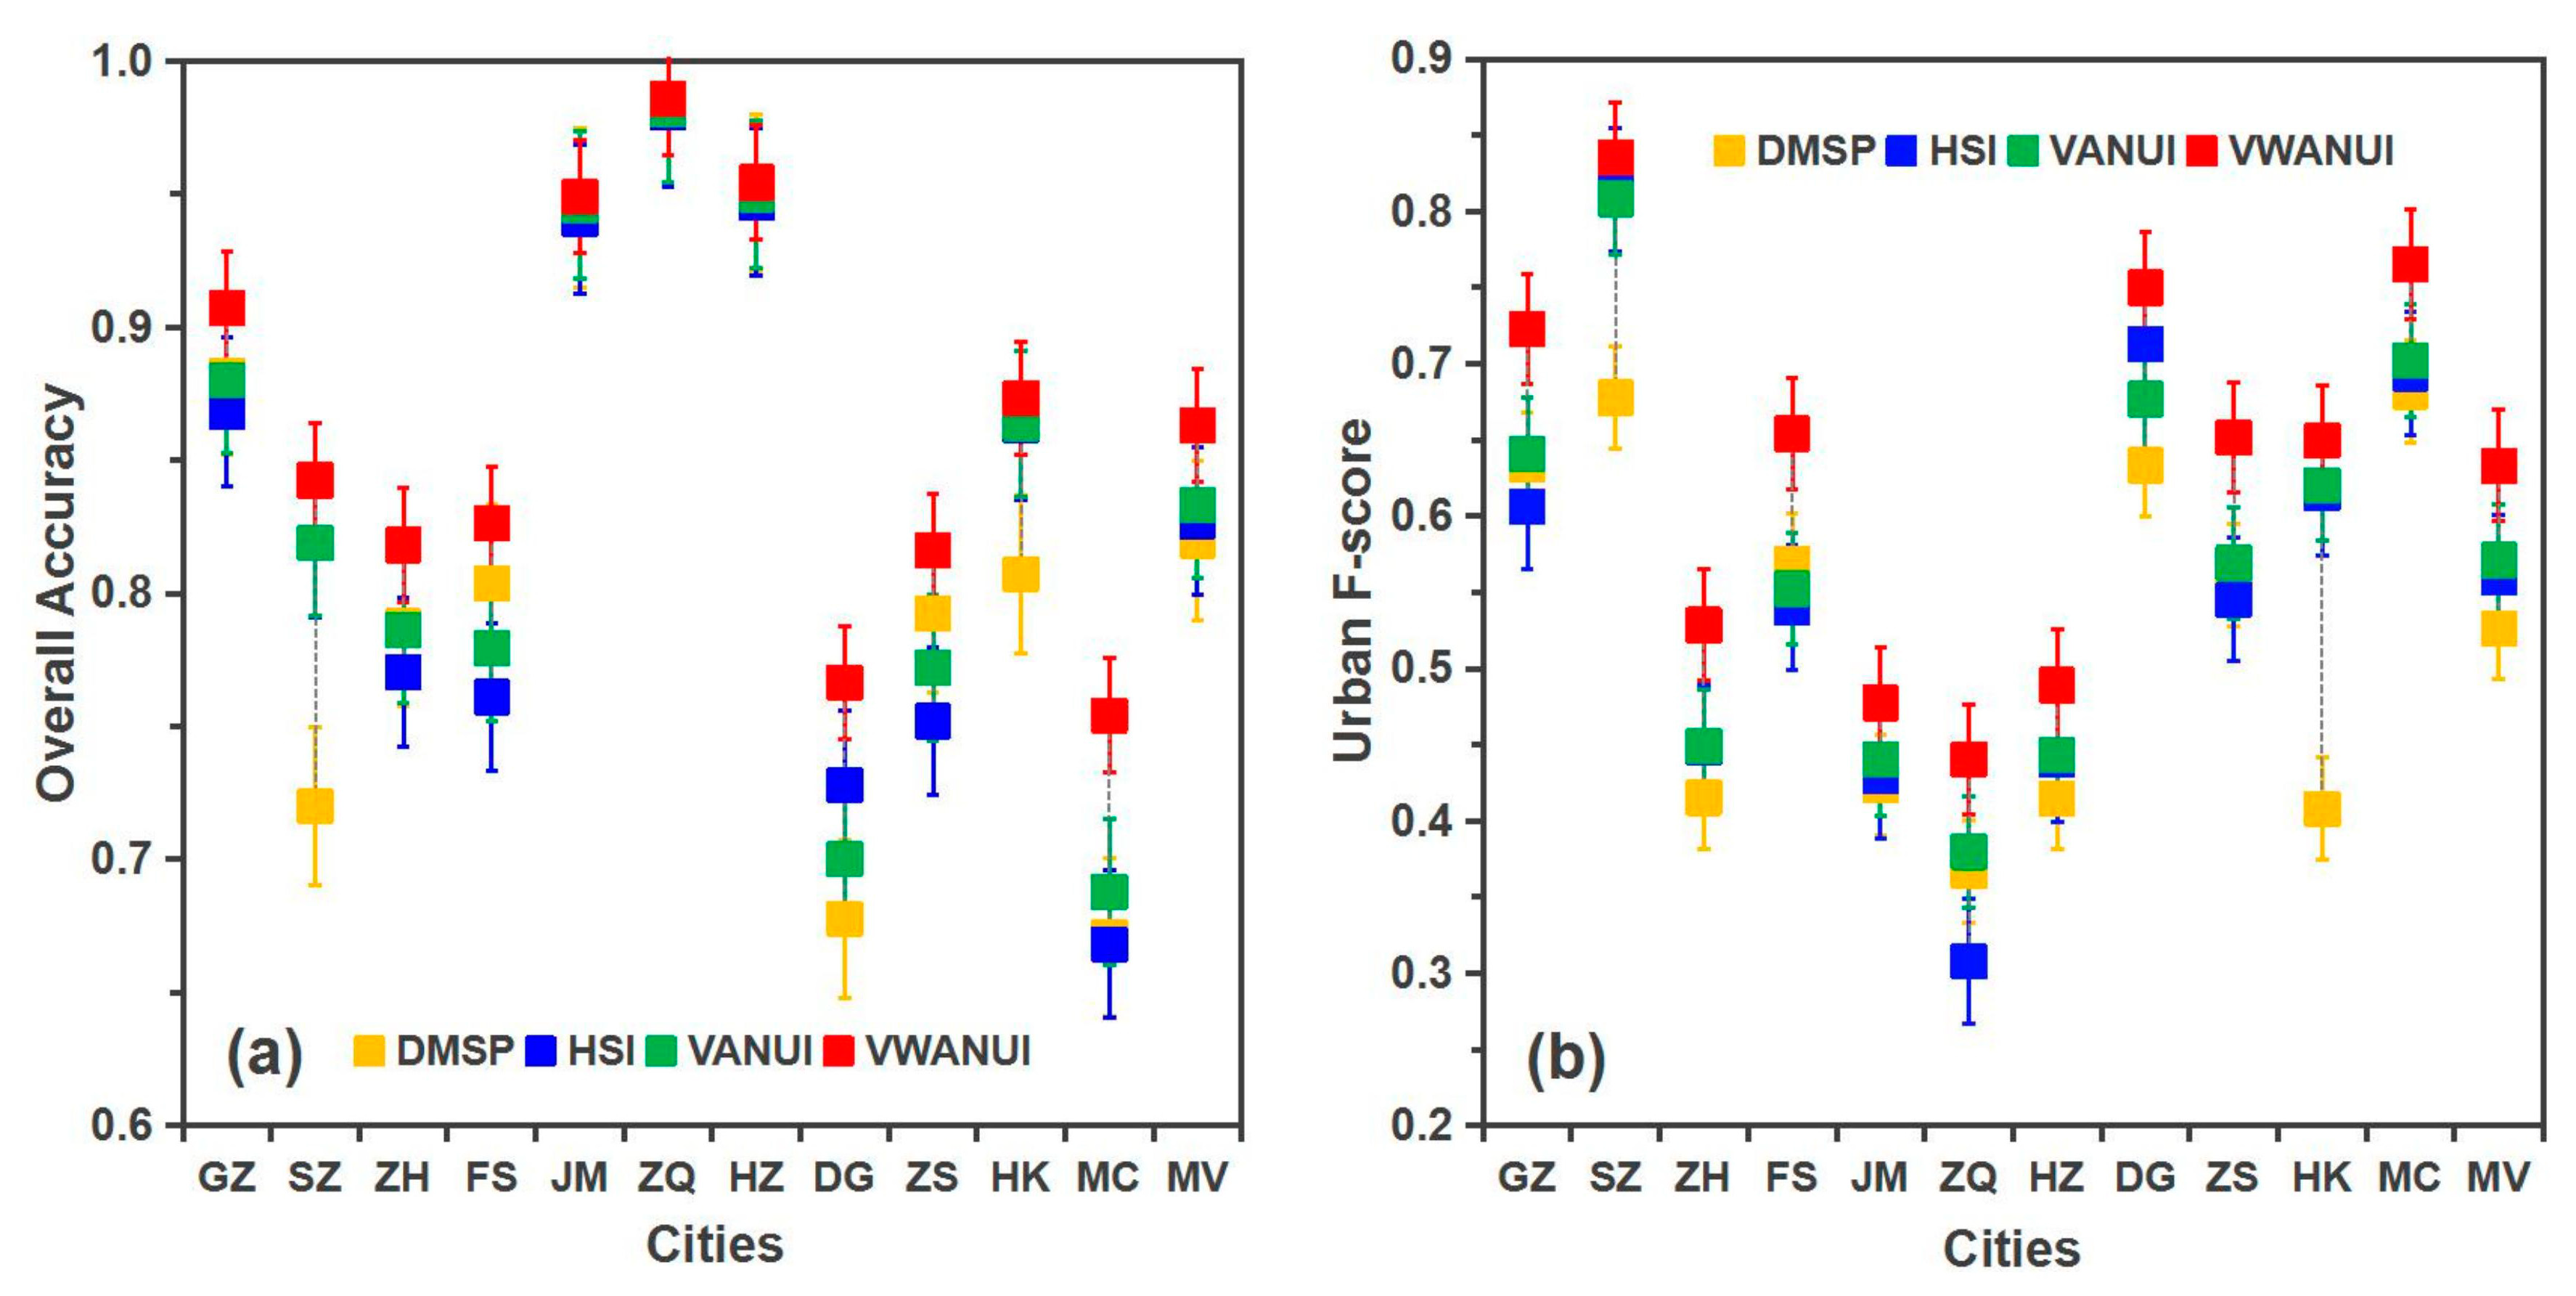
Figure 7 compares the OA and F-score for the urban land of 11 cities in the study area, extracted by the different approaches. The mean OA obtained by using the VWANUI was 4.32%, 3.59%, and 2.98% higher than that obtained by using the DMSP, HSI, and VANUI, respectively. Likewise, the corresponding mean urban F-score was 10.66%, 7.35%, and 6.20% higher. These results indicate that the VWANUI provides a higher extraction accuracy than the other approaches.
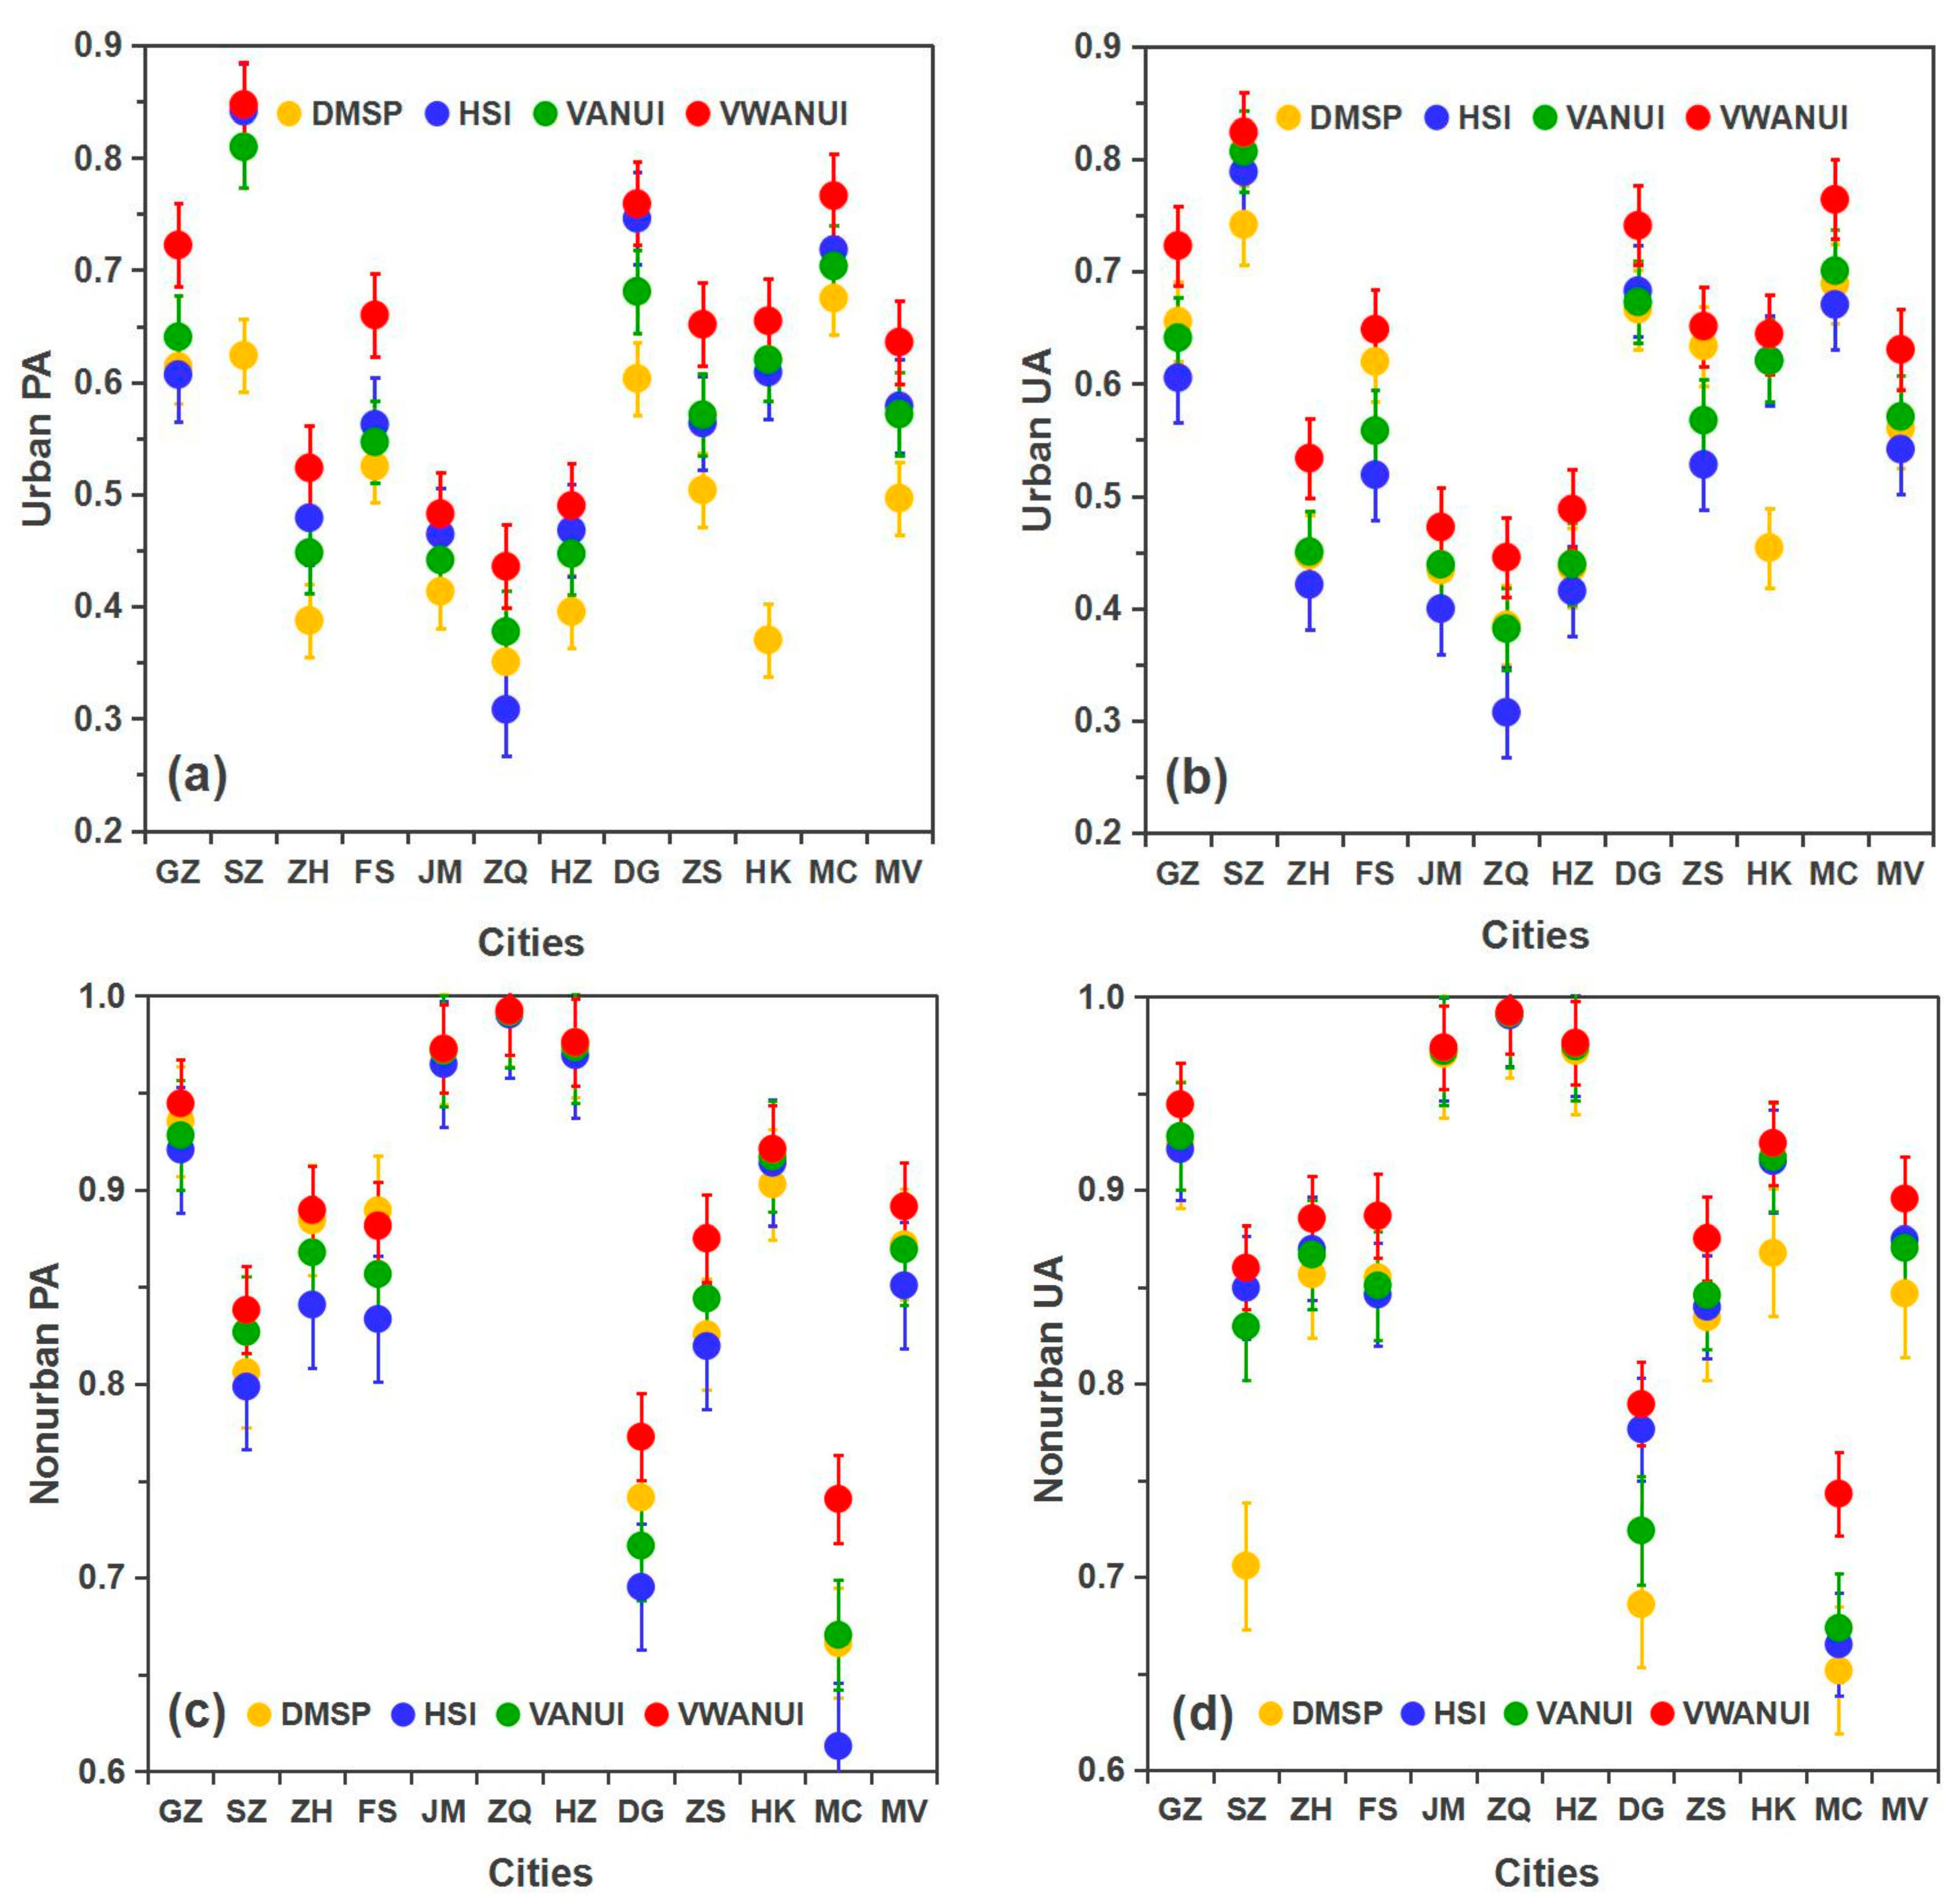
Figure 8 compares the PA and UA obtained with the different approaches for the 11 cities in the study area. The mean urban PA obtained by using the VWANUI was 13.92%, 5.69%, and 6.42% higher than that obtained by using the DMSP, HSI, and VANUI, respectively. Likewise, the corresponding mean urban UA was 7.02%, 8.88%, and 5.98% greater, respectively. These results also show that the VWANUI more precisely extracts the urban land than the other three approaches. In short, compared with the DMSP, HSI, and VANUI, the VWANUI provides the highest accuracy in terms of the OA, urban PA, urban UA, and F-score for all the cities in the study area.
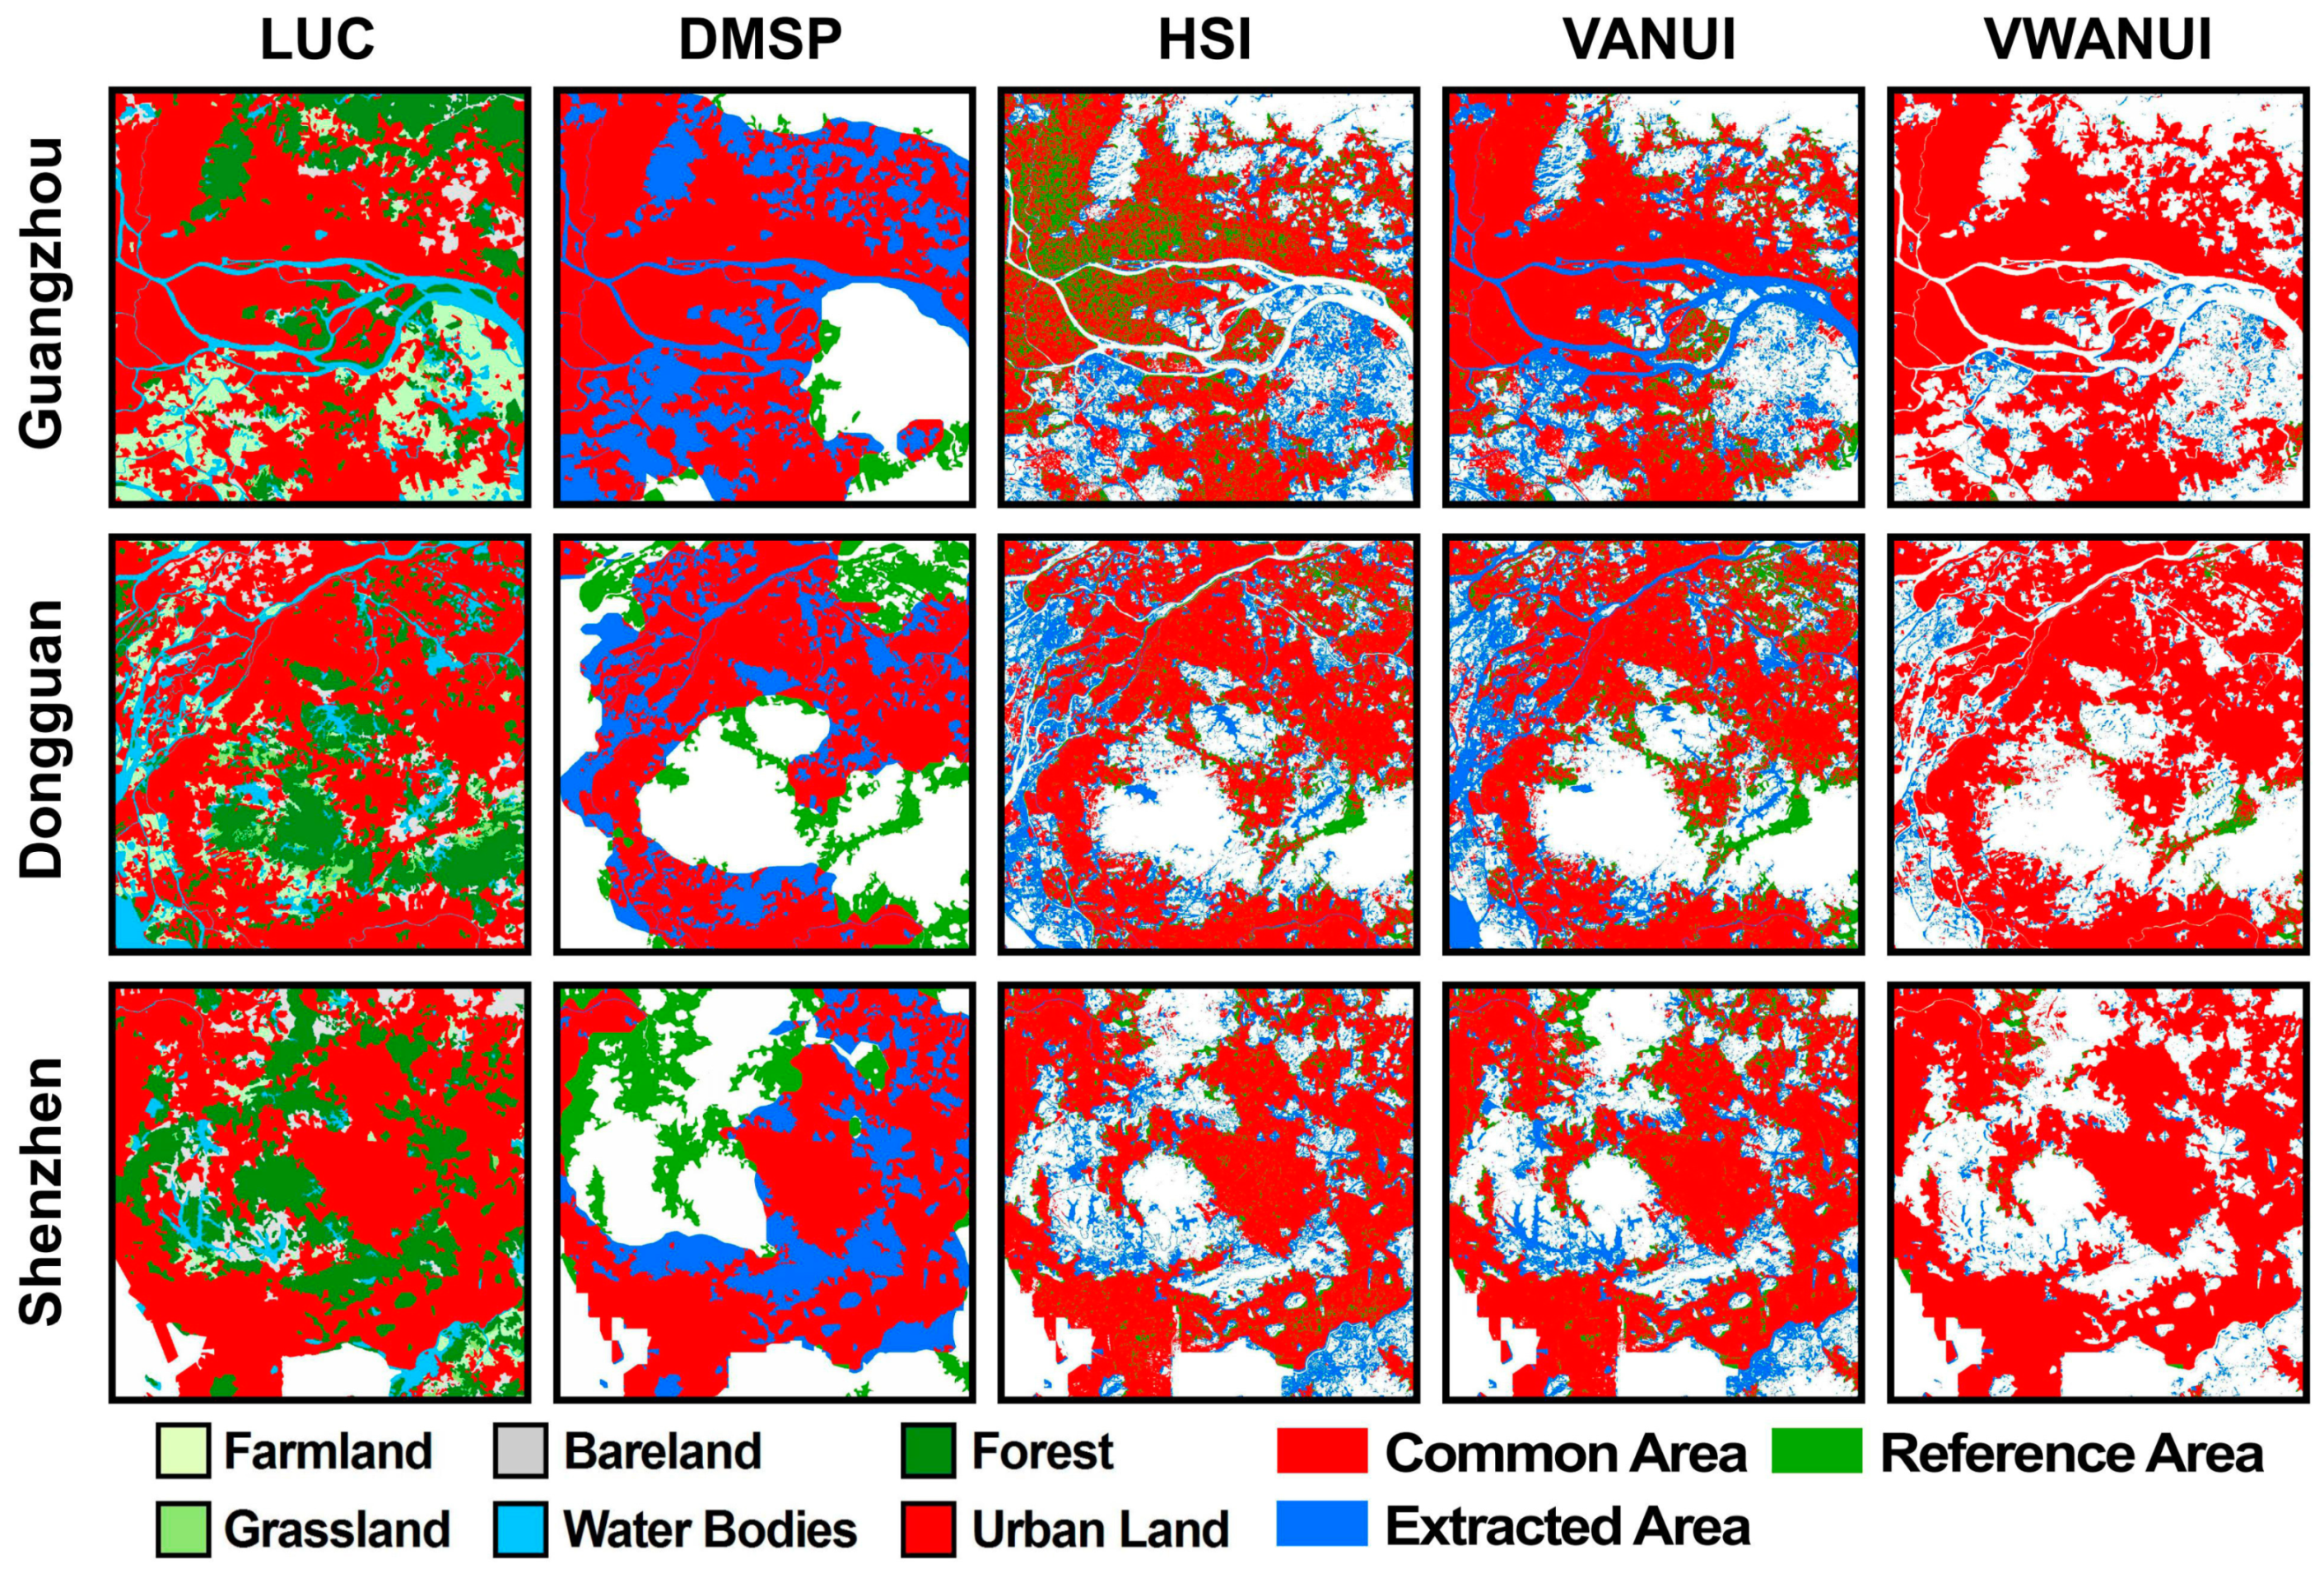
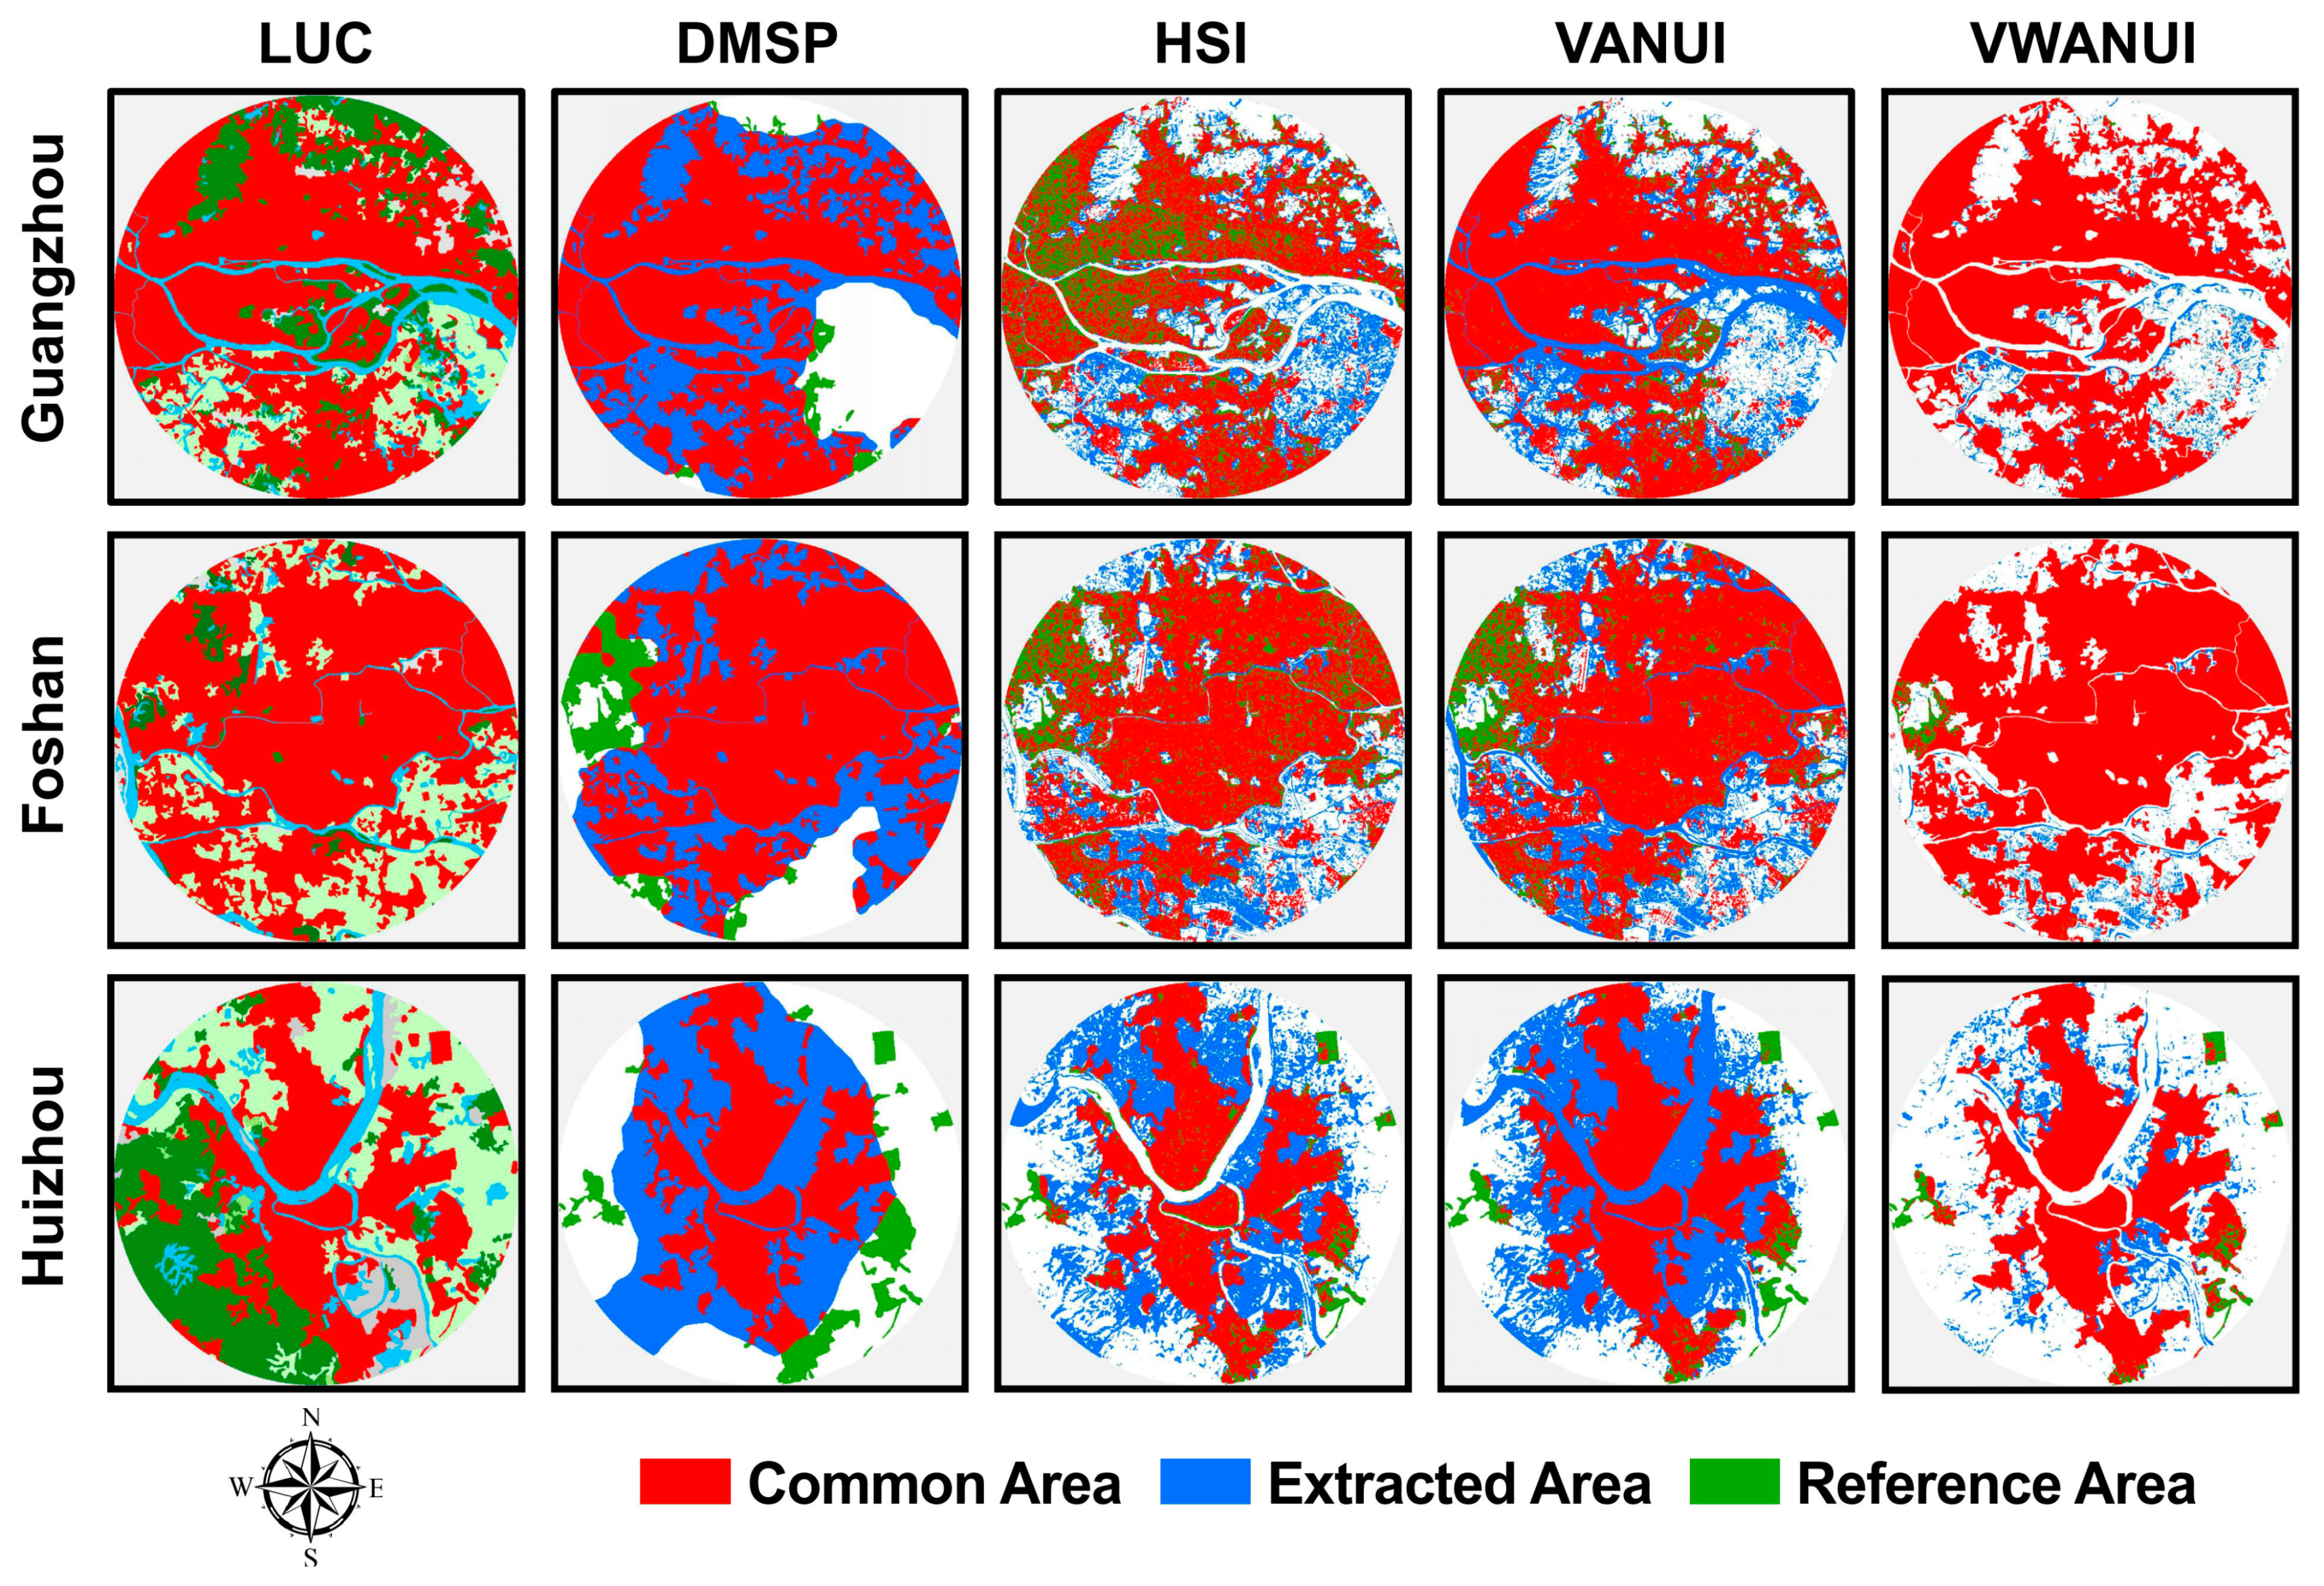
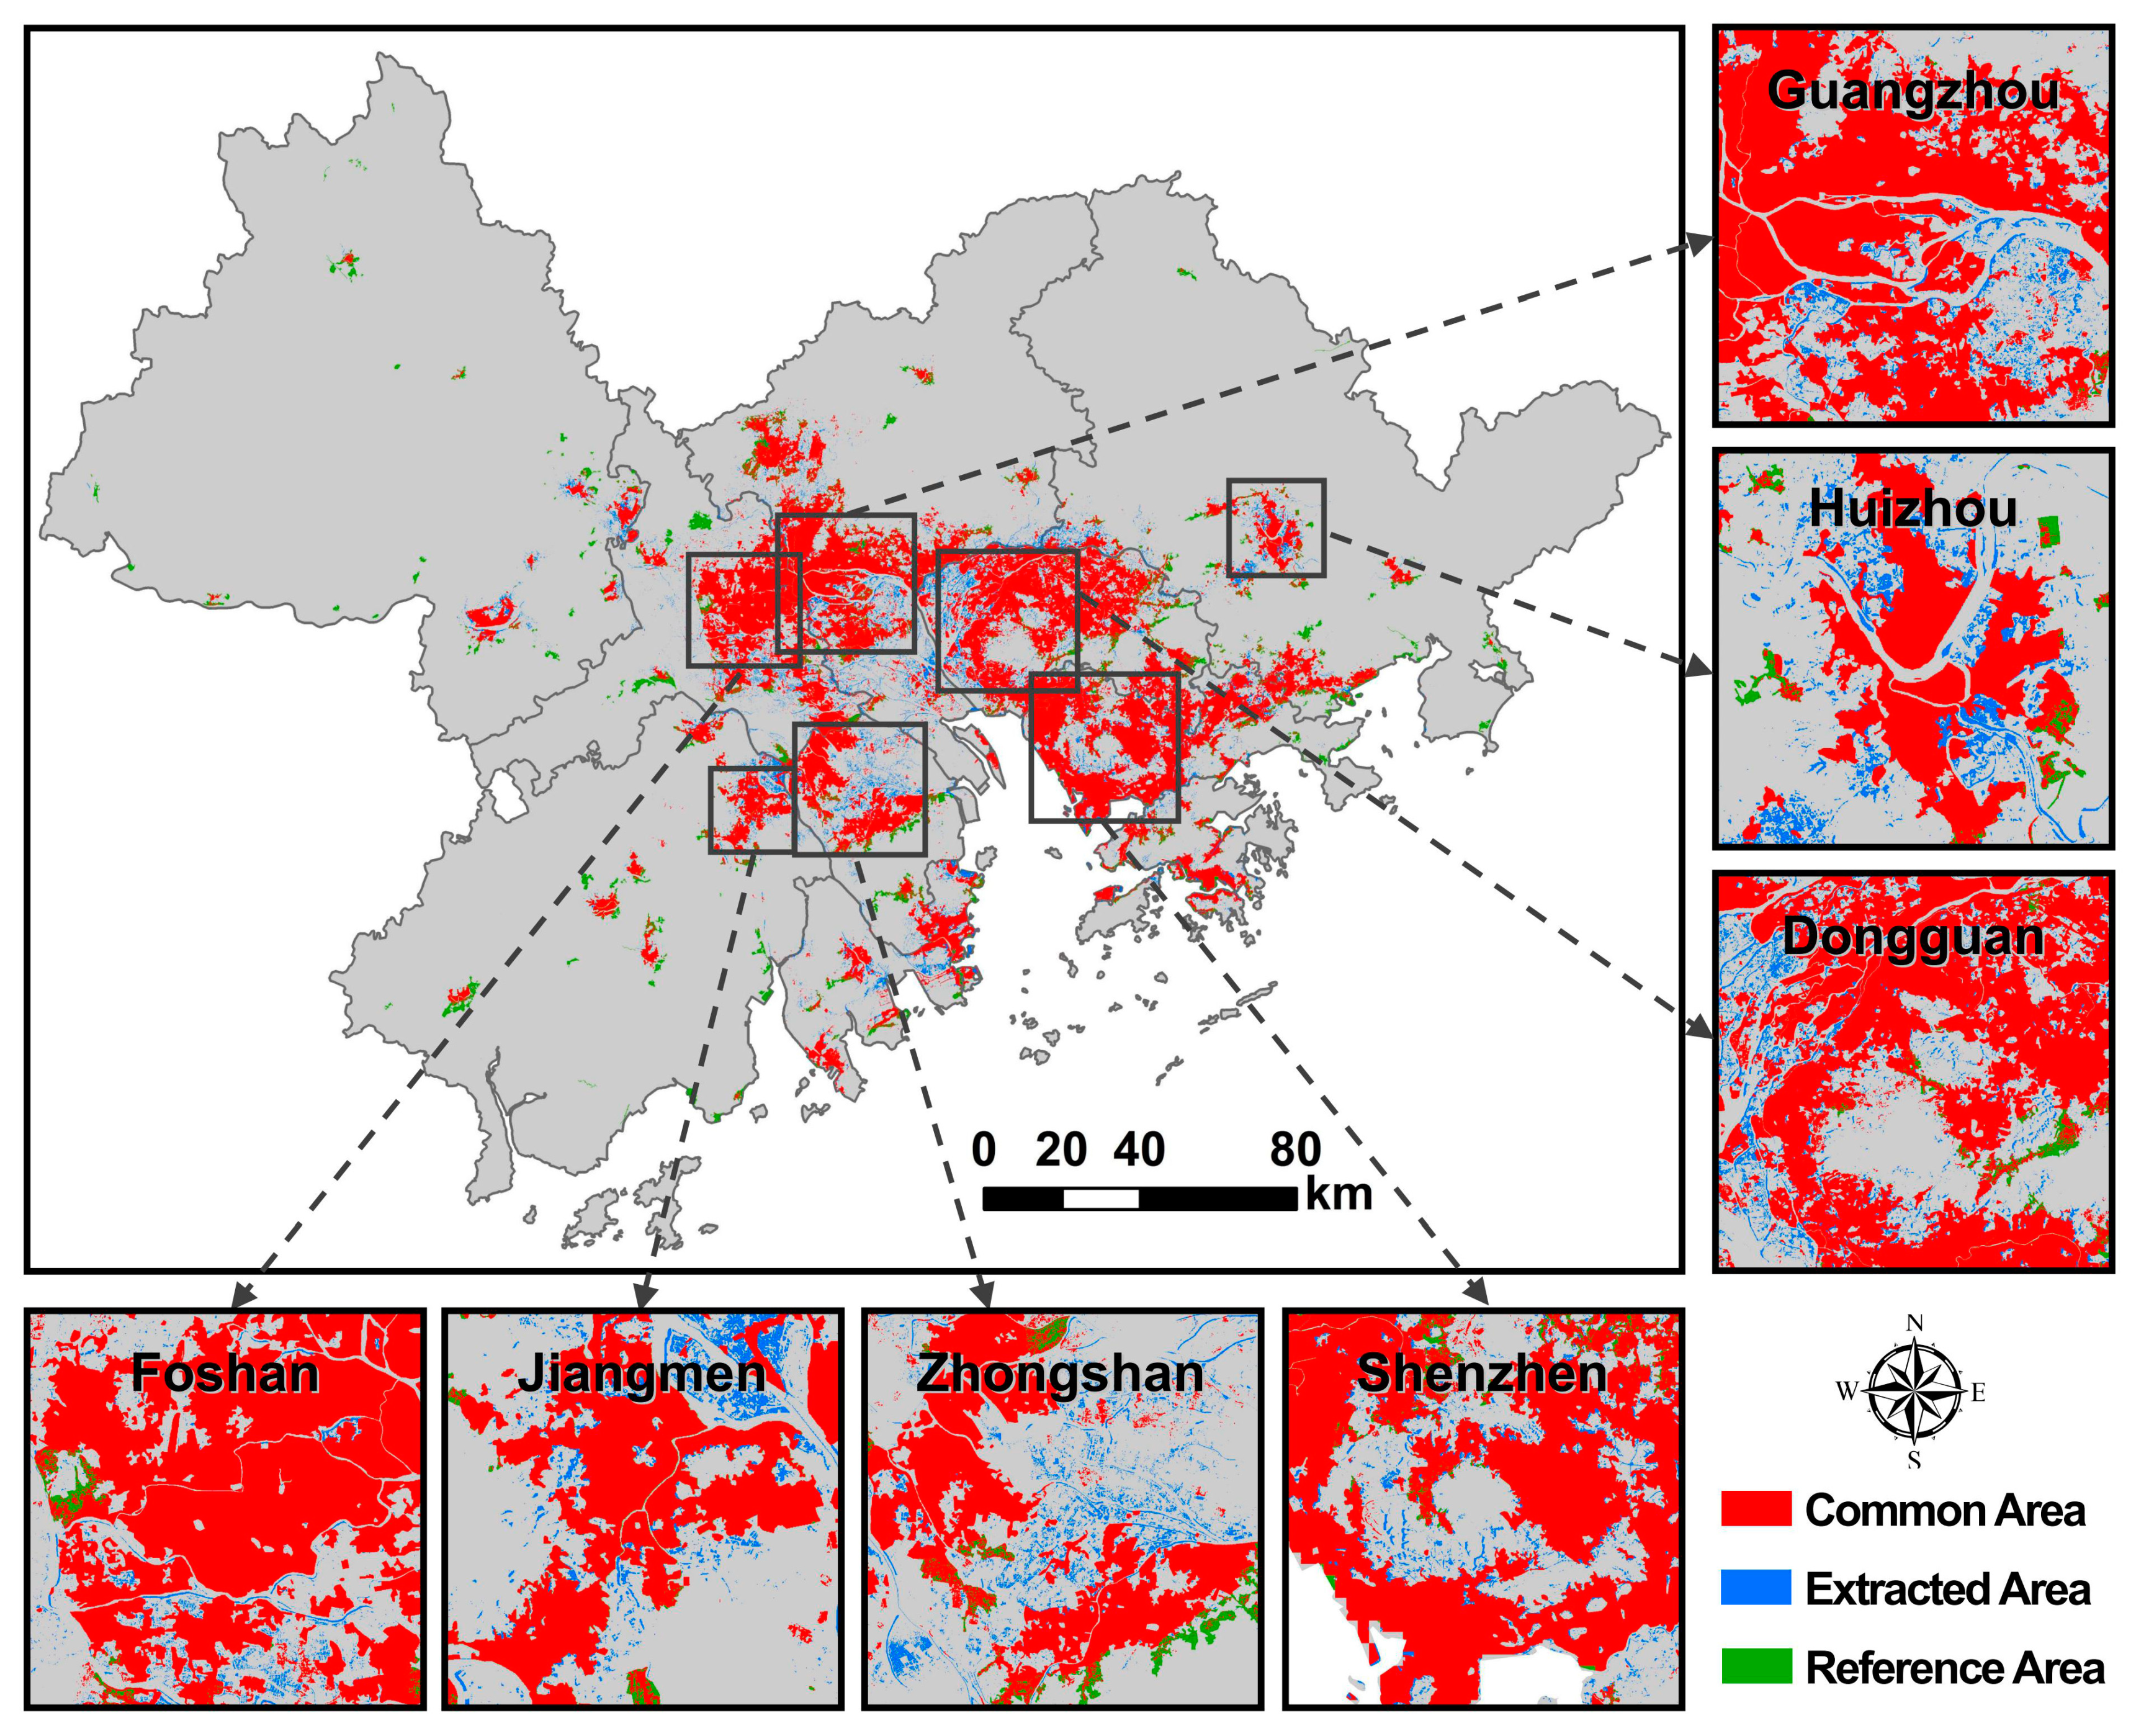
Furthermore, Guangzhou, Dongguan, and Shenzhen were selected as representative cities for comparing the extraction results (Figure 9). The results show that the spatial pattern of urban land obtained by using the VWANUI is more consistent than that obtained from the LUC dataset. Urban land extracted based on DMSP-OLS NTL usually has larger errors (in green) because of saturation in the urban core areas and blooming effects near coastal areas, rivers, vegetation cover, bare soil, and water bodies. However, the VWANUI not only reduces the saturation of urban core areas, but also removes blooming around coastal areas, rivers, large water bodies, etc., although some error remains near small rivers. Finally, the error in urban land extracted by using the VWANUI is also reduced, so the extraction accuracy for urban land is improved when using the VWANUI.
3.3. Estimation of Urban Land with VWANUI
Given that auxiliary vegetation–water information reduces the saturation and blooming of DMSP-OLS NTL data, the VWANUI can extract accurate urban information from coarse-resolution NTL data. Urban land is an important indicator for measuring the degree of urbanization, and numerous studies have shown that NTL data correlate positively with urban land areas [6,43,64].
In this work, we used a regression model to estimate urban land in the study area. In the linear regression model, urban land (UL) is obtained from a LUC dataset as reference data (dependent variable), and the various indexes serve as independent variables. We then compared the models of regression between various indexes and reference data to further evaluate the capability of the VWANUI to extract urban land. The coefficient of the correlation between the extracted results and the reference data was used to determine the performance of the regression model. In addition, the root-mean-square error (RMSE), which indicates the average size of the error, served for assessing the accuracy. The RMSE was calculated as follows:
where N is the number of samples, and pi and ti are the reference and estimated values, respectively.
We first established the regression models for the normalized DMSP-OLS, HSI, VANUI, and VWANUI, respectively, and calculated the quantitative indicators, including the determination coefficient R2, the correlation coefficient R, and the RMSE, to evaluate the regression models. Table 2 provides the results for the regression model and the calculated indicators. The R2 values for the regression models were 0.7000, 0.6352, 0.7530, and 0.8266 for the DMSP, HSI, VANUI, and VWANUI, respectively. The R2 for the VANUI or VWANUI regression model exceeded the R2 for the DMSP model, and the VWANUI regression model had the highest R2 of 0.8266. This result shows that the VWANUI is the most appropriate index for estimating urban land. By contrast, the DMSP regression model had the lowest R2 of 0.7000. The results for the correlation coefficient R are similar to those for R2. The VWANUI regression model had the highest R of 0.9092, whereas the R values for the DMSP, HSI, and VANUI regression models were 0.8367, 0.7970, and 0.8678, respectively. These results show that the VWANUI regression model provides the best performance for the study area. In addition, the VWANUI regression model had the lowest RMSE of 0.1425.
The scatter diagram plotting the extraction results and the reference data (Figure 10) shows that the correlation between the reference area and the extraction results for the VWANUI is higher than that between the reference area and the extraction results based on other indexes. This also indicates that the VWANUI regression model reduces saturation and blooming in DMSP-OLS NTL data, which allows it to estimate the urban land more accurately than the other models.
4. Discussion
4.1. Analysis of Extraction Accuracy
The VWANUI has advantages in terms of reducing saturation and eliminating blooming from the DMSP-OLS NTL data. Because the NDVI and NDWI complement each other in terms of land cover, they are incorporated into the VWANUI to extract urban land information. The VWANUI introduces the NDVI and combines DMSP-OLS NTL with NDVI data. The vegetation coverage on urban land is generally less than that on nonurban land [41], so the NDVI correlates negatively with urban land areas, which can be used to reduce the saturation of NTL data in urban core areas. Thus, combining DMSP-OLS NTL with the NDVI can reduce the saturation in the NTL brightness to improve the accuracy of extraction. For example, Figure 11 shows that extraction using the VWANUI removes vegetated areas in the urban centers of Guangzhou, Foshan, and Huizhou.
Next, the NDWI is introduced into the VWANUI to remove blooming from saturated NTL intensities near water bodies inside core urban areas. As shown in Figure 11, the extraction results from using the VWANUI do not contain water bodies in the cities. In addition, the application of the logarithmic transformation enlarges the NTL difference between urban and nonurban areas, which can improve the accuracy with which urban land is extracted from NTL data.
Therefore, the VWANUI constructed by combining the log-transformed DMSP-OLS NTL, the NDVI, and the NDWI reduces saturation and eliminates blooming from DMSP-OLS NTL data, thereby improving the accuracy with which urban land is extracted. In a previous study, the combination of the NDVI with NTL data reduced the saturation of NTL in urban core areas [43], which indicates the feasibility of combining NTL and vegetation data. In future studies, population data, surface-temperature data, or topographic and geomorphic data could be used to construct a more accurate method for estimating urban land areas [65].
4.2. Analysis of Regression Model
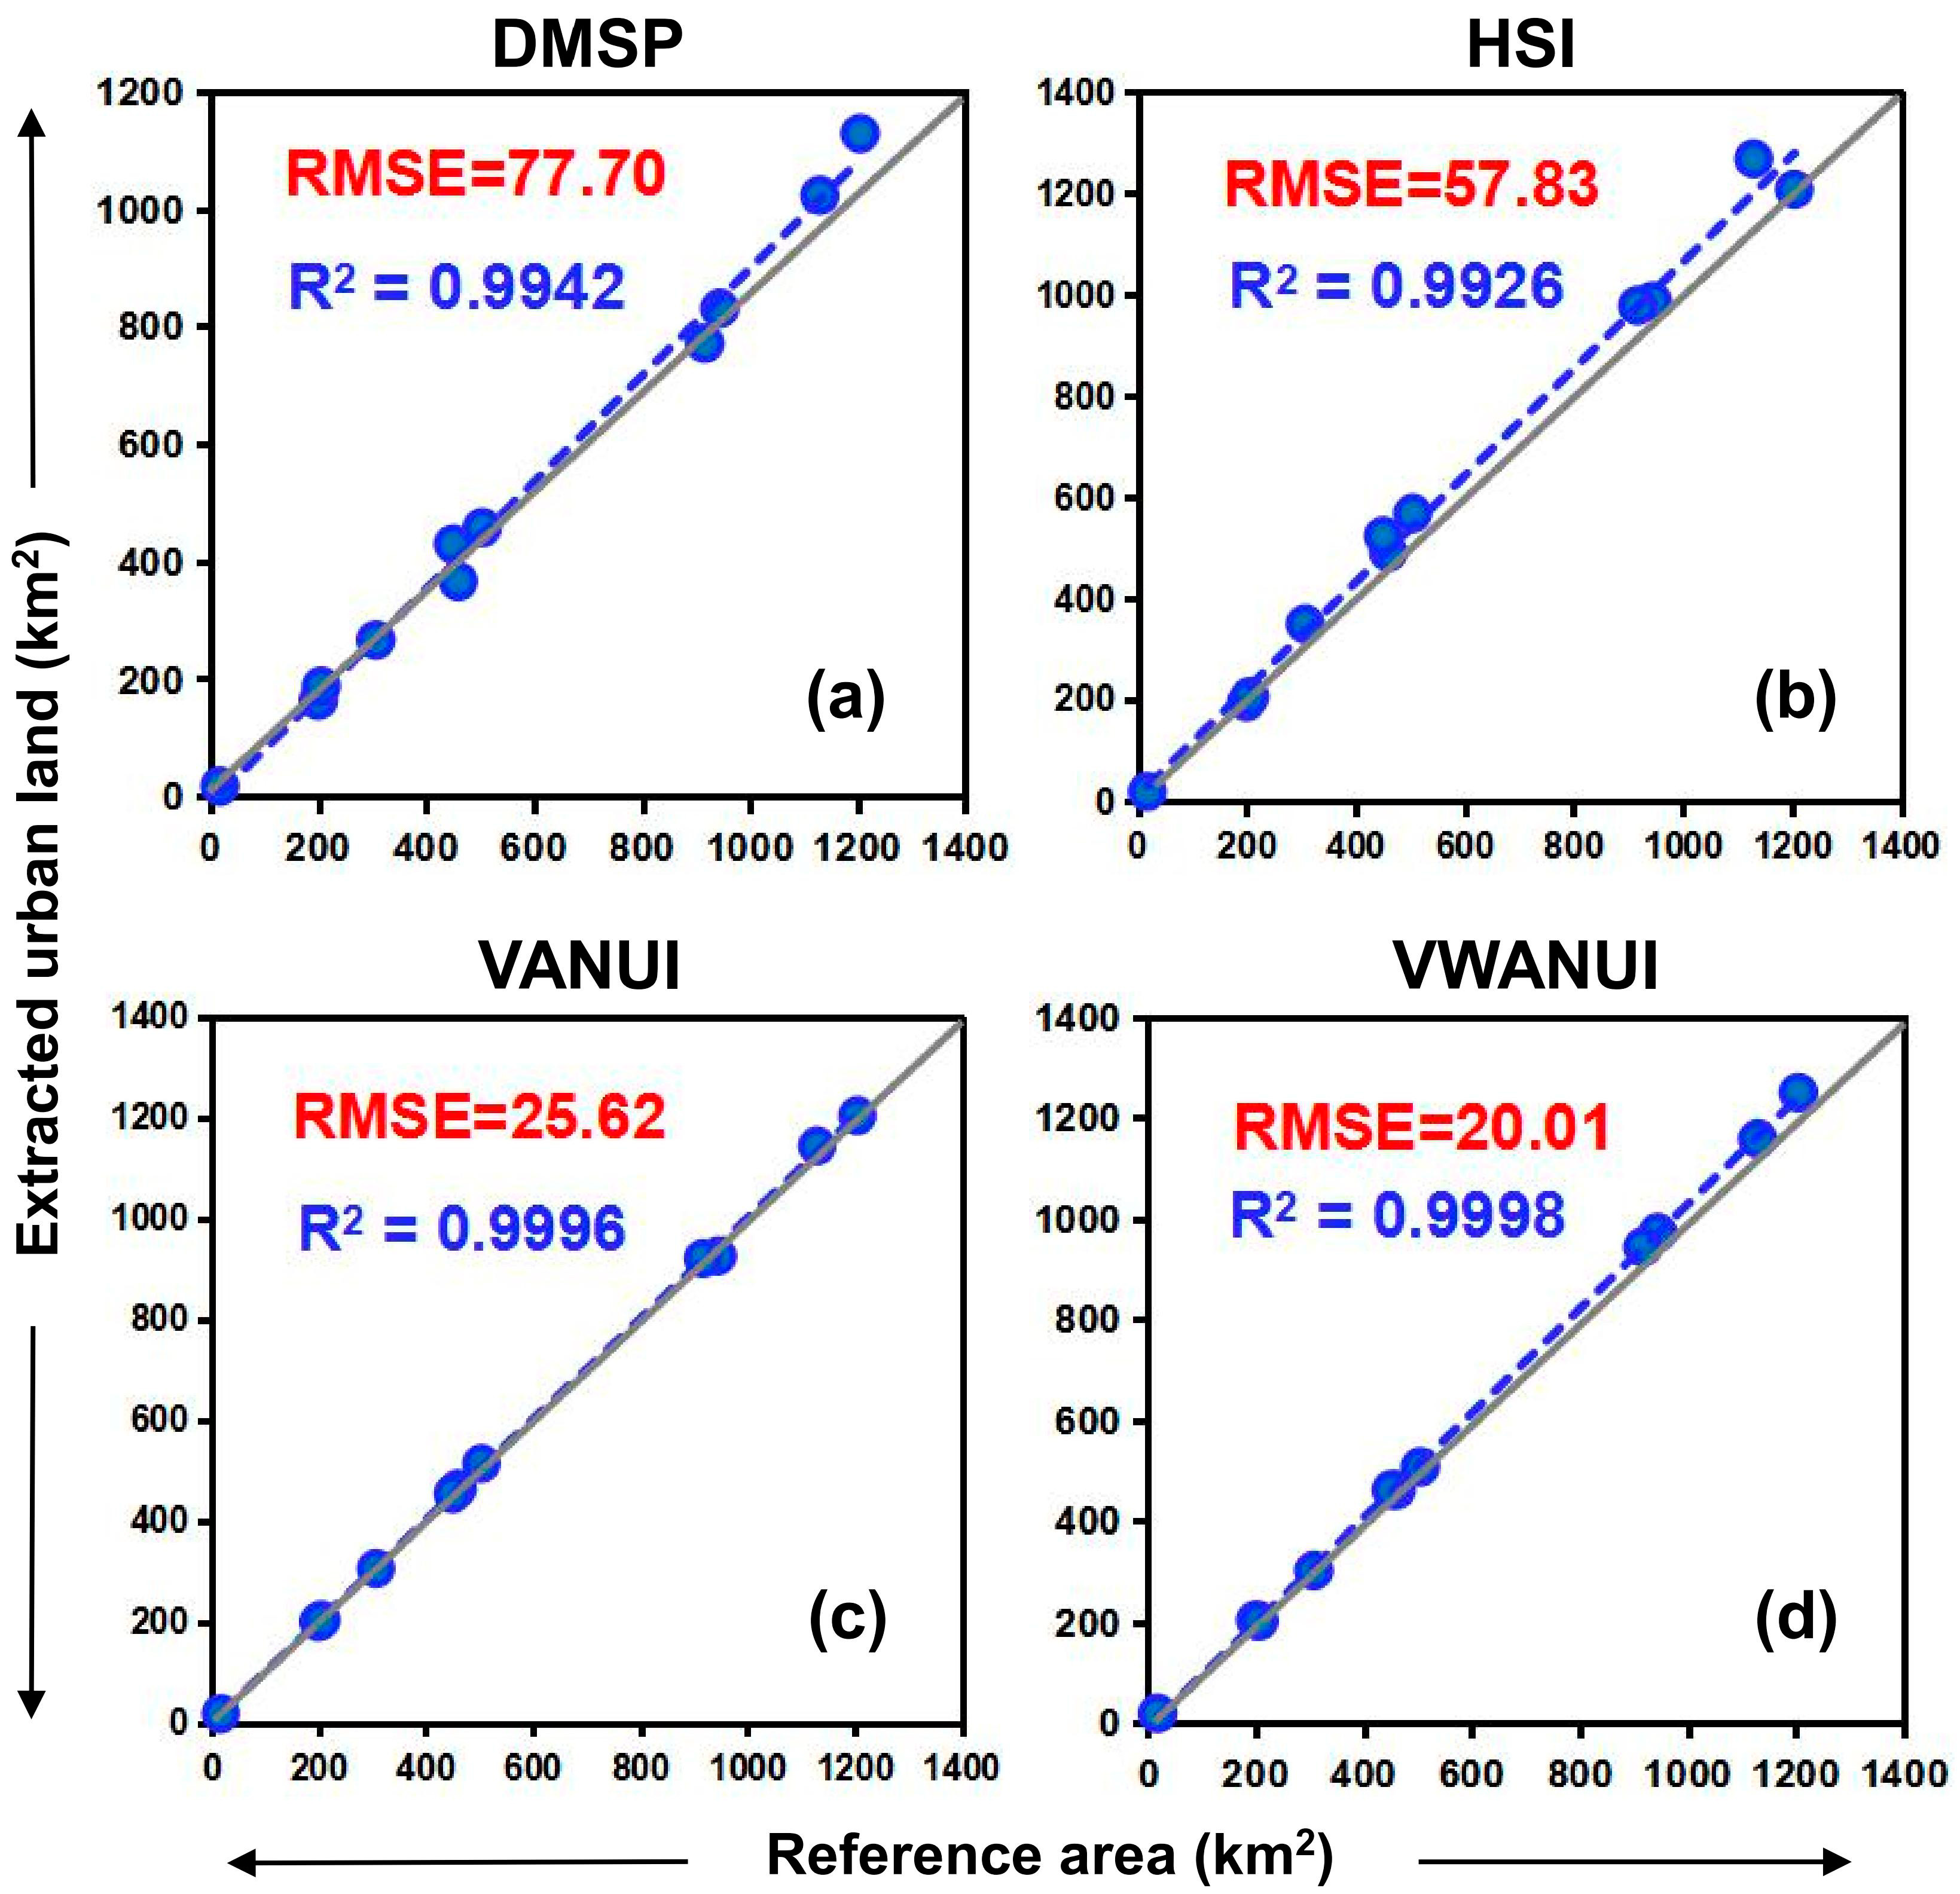
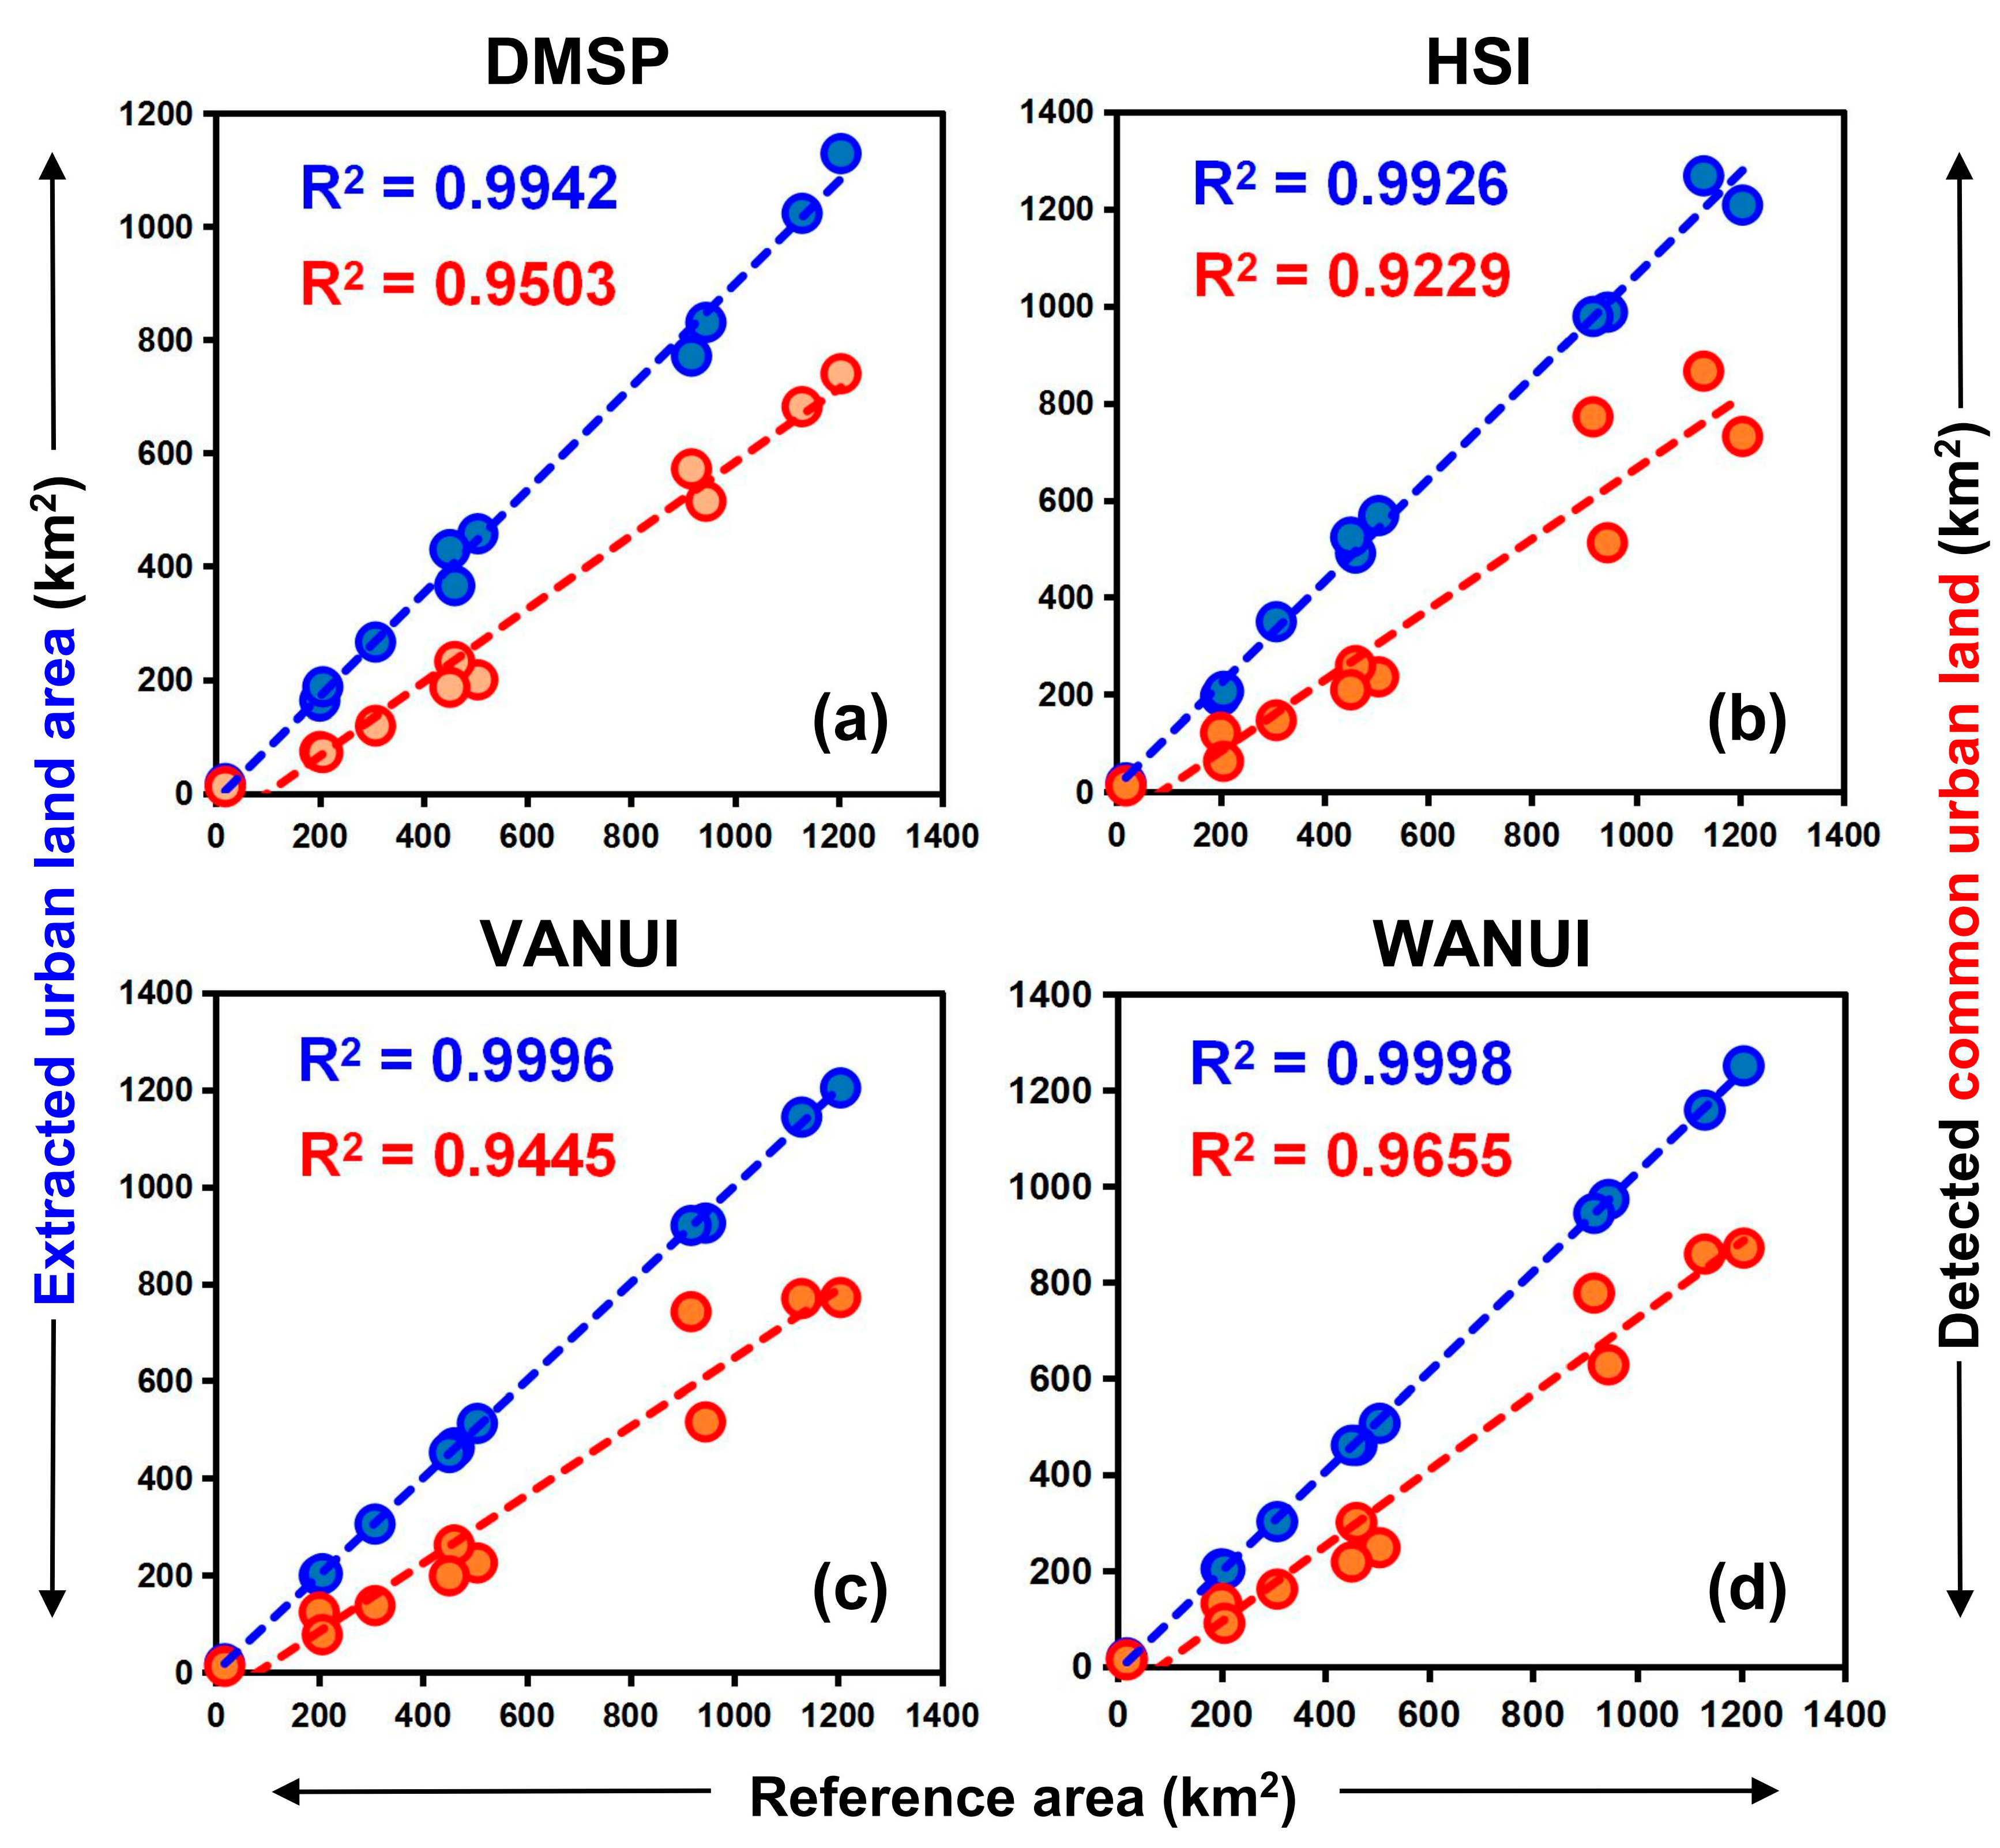
To further verify the performance of the VWANUI, we compared the R2 for the reference data and those for the results extracted by using the DMSP, HSI, VANUA, and VWANUI (Figure 12). In the model of regression between the extracted urban land and reference data, the R2 values from the regression models based on the DMSP, HSI, VANUI, and VWANUI were 0.9942, 0.9926, 0.9996, and 0.9998, respectively. In the model of regression between the extracted common urban land and reference data, the R2 values of the regression models based on the DMSP, HSI, VANUI, and VWANUI were 0.9503, 0.9229, 0.9445, and 0.9655, respectively. Common urban land refers to the common land areas between extracted areas and reference data. These results show that the VWANUI produces an R2 for the regression model greater than that produced by the other three regression models.
This comparative analysis led to the conclusion that the VWANUI accurately extracts the spatial distribution of urban land and that the VWANUI regression model provides the most accurate estimates of urban land compared with the other three approaches. Therefore, we used the proposed VWANUI to extract urban land from the research area; the results appear in Figure 13 and show that the urban land was extracted with high precision in most cities, but the error in the extraction results was slightly larger in Huizhou, Jiangmen, and Zhaoqing, which are less economically developed. This discrepancy is attributed to the fact that the infrastructure in these cities is not sufficiently developed. The NTL brightness is lower in some areas, making the DMSP-OLS NTL data more difficult to obtain.
Next, we briefly show that urban land is mainly distributed in the estuary of the Pearl River Basin and in coastal areas (Figure 13). In particular, urban land distribution accounts for a larger proportion of the total area in Guangzhou, Foshan, Dongguan, and Shenzhen, indicating that these cities have a higher degree of urbanization.
4.3. Limitations and Prospects
4.3.1. Limitations of Data
The process used herein of fusing DMSP-OLS NTL data with the NDVI and NDWI data may introduce some errors. In addition, the limitations of NTL data are as follows. First, the uncertainty caused by the angle of atmospheric and surface optical properties, diurnal variation, and seasonal variation is the primary source of error in NTL data [66]. Surface factors such as surface reflectivity, vegetation coverage, snow cover, and surface impermeability also result in errors in NTL data [67].
Next, because DMSP-OLS data are archived historical data, they should be calibrated with the new NTL data from the Suomi National Polar-orbiting Partnership Visible Infrared Imaging Radiometer Suite (NPP-VIIRS). Recently, Hu et al. [68] and Ryan et al. [69] showed that ground-based stabilization and radiometric calibration light sources might provide a useful method for cross-calibrating NTL sensors. However, this remains a significant challenge due to differences in transit time, sensor calibration, spatial resolution, and other considerations [70,71]. Therefore, obtaining a consistent, long-term time series of NTL data across different platforms and sensors remains a challenge at present.
Third, given the lack of on-board calibration, varying atmospheric conditions, and sensor degradation, the time series of DMSP-OLS NTL data cannot be directly compared across years [72]. Finally, the degree of economic development, differences in urban and rural electricity consumption, and even differences in culture may produce variations in the brightness of urban NTL in different areas [73].
4.3.2. Research Plans and Prospects
An urgent need exists for timely and reliable quantitative information on urban land areas to support sustainable urban development and management [7]. First, the integration of DMSP-OLS NTL data with daytime optical remote sensing data and the fusing of DMSP-OLS with NPP-VIIRS data, or with the higher-resolution Luojia-01 data, can be further studied to develop a longer dataset for future research. In addition, a new model should be constructed by combining NTL remote sensing data with other remote sensing data for exploring the interactions between all the variables [24,74] and obtaining high-resolution data on urban land information with longer time series, which is vital for addressing the environmental problems caused by rapid and long-term urban expansion.
Next, it is necessary to make NTL data more quantifiable; ground and space measurements should be further calibrated. Some researchers have tried to calibrate images with accurate spatial resolution. For example, based on ground measurements, Hale et al. [75] calibrated aerial NTL images and obtained illuminance units. Li et al. [76] proposed using an unmanned aerial vehicle (UAV) to obtain nighttime light with a time resolution on the scale of hours and showed that the UAV is an effective tool for measuring urban NTL. Therefore, in future work, multiangle observation, high-dynamic-range imaging technology, radiation calibration, and more advanced sensors and methods available with UAVs could play a practical role in the accurate monitoring of urban NTL.
Finally, NTL observations should be integrated with other data and knowledge. Integrating NTL observations with geolocated big data, field data, and multispectral and multisource remote sensing data promises to lead to a comprehensive characterization and understanding of human activity, which will provide more opportunities for NTL remote sensing [77,78].
5. Conclusions
Accurate and timely information on urban land on regional and global scales is vital for discussing and studying environmental issues. The quantification of urban land is crucial for evaluating sustainable urban development. To address these needs, this work proposes using the VWANUI to describe urban characteristics. The research results show that the VWANUI reduces the saturation of NTL data from core urban areas, eliminates the blooming of NTL brightness from water bodies and vegetation areas within urban core areas, and provides more accurate and abundant surface details.
The proposed approach allows for more rapid and accurate extraction of urban land than previous methods. The mean OA obtained by using the VWANUI was 4.32%, 3.59%, and 2.98% greater than that obtained by using the DMSP, HSI, and VANUI, respectively; the corresponding mean urban PA increased by 13.92%, 5.69%, and 6.42%, respectively; and the corresponding mean urban UA increased by 7.02%, 8.88%, and 5.98%, respectively. In addition, the corresponding mean urban F-score increased by 10.66%, 7.35%, and 6.20%, respectively.
The determination coefficients, R2, of the regression models were 0.7000, 0.6352, 0.7530, and 0.8266 for the DMSP, HSI, VANUI, and VWANUI, respectively. The VWANUI regression model thus had the highest R2 of 0.8266 and the lowest RMSE, at 0.1425, which indicates that the VWANUI is the most appropriate approach for estimating urban land.
In summary, the VWANUI combined with multisource remote sensing data produces a more accurate and detailed extraction of urban land than using single-source data. Our evaluation shows that the VWANUI reduces the saturation and blooming from DMSP-OLS NTL and provides more accurate urban land estimates. The VWANUI is easy to interpret and implement, facilitating the implementation of the accurate mapping of urban land over large-scale areas within a reasonable amount of time and at a low cost. In the future, the VWANUI will be applied to NPP-VIIRS NTL data or Luojia-01 NTL data with higher spatial resolution and wider radiant detection to extract accurate and timely urban information with higher resolution on national and global scales.
Author Contributions
Y.Z. conceived and performed the research, analyzed the results, and wrote the manuscript; H.W., Y.H. and C.W. provided valuable comments and suggestions on the manuscript and revised the document; Q.Z. and X.W. participated in the data collection and processing. All authors have read and agreed to the published version of the manuscript.
Funding
This research was supported by the Strategic Priority Research Program (A) of the Chinese Academy of Sciences (grant no. XDA23030103 and XDA 23030105), the Science and Technology Planning Project of Xiamen City (grant no. 3502Z20191021), the Fujian Province Natural Fund Project (grant no. 2020J01263), and the Science and Technology Planning Foreign Cooperation Project of Longyan (grant no. 2019LYF7003).
Institutional Review Board Statement
Not applicable.
Informed Consent Statement
Not applicable.
Data Availability Statement
The data presented in this study are available on request from the corresponding author. The data are not publicly available because it is currently being used in relevant research projects.
Acknowledgments
The authors sincerely thank Jingzhu Zhao at the Institute of Urban Environment, Chinese Academy of Sciences, and the anonymous reviewers for their constructive comments and suggestions that greatly improved the manuscript.
Conflicts of Interest
The authors declare no conflict of interest.
References
- Goldblatt, R.; You, W.; Hanson, G.; Khandelwal, K.A. Detecting the boundaries of urban areas in India: A dataset for pixel-based image classification in Google earth engine. Remote. Sens. 2016, 8, 634. [Google Scholar] [CrossRef] [Green Version]
- United Nations. World Urbanization Prospects: The 2014 Revision, Highlights; Department of Economic and Social Affairs: New York, NY, USA, 2014; Available online: https://esa.un.org/unpd/wup/CD-ROM/ (accessed on 28 November 2020).
- Kuang, W.; Liu, J.; Dong, J.; Chi, W.; Zhang, C. The rapid and massive urban and industrial land expansions in China between 1990 and 2010: A CLUD-based analysis of their trajectories, patterns, and drivers. Landsc. Urban Plan. 2016, 145, 21–33. [Google Scholar] [CrossRef]
- Li, H.; Sodoudi, S.; Liu, J.; Tao, W. Temporal variation of urban aerosol pollution island and its relationship with urban heat island. Atmos. Res. 2020, 241, 104957. [Google Scholar] [CrossRef]
- Tang, L.; Ma, W. Assessment and management of urbanization-induced ecological risks. Int. J. Sustain. Dev. World Ecol. 2018, 25, 383–386. [Google Scholar] [CrossRef]
- Liu, X.; Hu, G.; Ai, B.; Li, X.; Shi, Q. A Normalized Urban Areas Composite Index (NUACI) Based on Combination of DMSP-OLS and MODIS for Mapping Impervious Surface Area. Remote Sens. 2015, 7, 17168–17189. [Google Scholar] [CrossRef] [Green Version]
- Ban, Y.; Jacob, A.; Gamba, P. Spaceborne SAR data for global urban mapping at 30 m resolution using a robust urban extractor. ISPRS J. Photogramm. Remote Sens. 2015, 103, 28–37. [Google Scholar] [CrossRef]
- Li, D.; Yu, H.; Li, X. The spatial-temporal pattern analysis of city development in countries along the belt and road initiative based on nighttime light data. Geomat. Inf. Sci. Wuhan Univ. 2017, 42, 711–720. (In Chinese) [Google Scholar]
- Wigginton, N.S.; Fahrenkamp-Uppenbrink, J.; Wible, B.; Malakoff, D. Cities are the Future. Science 2016, 352, 904–905. [Google Scholar] [CrossRef] [PubMed] [Green Version]
- Chen, J.; Chen, J.; Liao, A.; Cao, X.; Chen, L.; Chen, X.; Han, G.; Peng, S.; Lu, M.; Zhang, W.; et al. Global land cover mapping at 30 m resolution: A POK-based operational approach. ISPRS J. Photogramm. Remote Sens. 2015, 103, 7–27. [Google Scholar] [CrossRef] [Green Version]
- Liu, X.; Hu, G.; Chen, Y.; Li, X.; Xu, X.; Li, S.; Pei, F.; Wang, S. High-resolution multi-temporal mapping of global urban land using Landsat images based on the Google Earth Engine Platform. Remote Sens. Environ. 2018, 209, 227–239. [Google Scholar] [CrossRef]
- Yang, K.; Zhang, S.; Luo, Y.; Xu, Q.; Qu, L. The widening urbanization gap between the Three Northeast Provinces and the Yangtze River Delta under China’s economic reform from 1984 to 2014. Int. J. Sustain. Dev. World Ecol. 2018, 25, 262–275. [Google Scholar] [CrossRef]
- Ma, T.; Zhou, C.; Pei, T.; Haynie, S.; Fan, J. Quantitative estimation of urbanization dynamics using time series of DMSP/OLS nighttime light data: A comparative case study from China’s cities. Remote Sens. Environ. 2012, 124, 99–107. [Google Scholar] [CrossRef]
- Lu, D.; Weng, Q. Use of impervious surface in urban land-use classification. Remote Sens. Environ. 2006, 102, 146–160. [Google Scholar] [CrossRef]
- Schneider, A.; Friedl, M.A.; Potere, D. Mapping global urban areas using MODIS 500-m data: New methods and datasets based on ‘urban ecoregions’. Remote Sens. Environ. 2010, 114, 1733–1746. [Google Scholar] [CrossRef]
- Tourea, S.I.; Stowa, D.A.; Shiha, H.; Weeksa, J.; Lopez-Carr, D. Land cover and land use change analysis using multi-spatial resolution data and object-based image analysis. Remote Sens. Environ. 2018, 210, 259–268. [Google Scholar] [CrossRef]
- Liu, Z.; He, C.; Zhang, Q.; Huang, Q.; Yang, Y. Extracting the dynamics of urban expansion in China using DMSP-OLS nighttime light data from 1992 to 2008. Landsc. Urban Plan. 2012, 106, 62–72. [Google Scholar] [CrossRef]
- Zhao, M.; Zhou, Y.; Li, X.; Cheng, W.; Zhou, C.; Ma, T.; Li, M.; Huang, K. Mapping urban dynamics (1992–2018) in Southeast Asia using consistent nighttime light data from DMSP and VIIRS. Remote Sens. Environ. 2020, 248, 111980. [Google Scholar] [CrossRef]
- Pandey, B.; Joshi, P.K.; Seto, K.C. Monitoring urbanization dynamics in India using dmsp/ols night time lights and spot-vgt data. Int. J. Appl. Earth Obs. Geoinf. 2013, 23, 49–61. [Google Scholar] [CrossRef]
- Zou, Y.; Peng, H.; Liu, G.; Yang, K.; Xie, Y.; Weng, Q. Monitoring urban clusters expansion in the middle reaches of the Yangtze River, China, using time-series nighttime light images. Remote Sens. 2017, 9, 1007. [Google Scholar] [CrossRef] [Green Version]
- Goldblatt, R.; Stuhlmacher, M.F.; Tellman, B.; Clinton, N.; Hanson, G.; Georgescu, M.; Wang, C.; Serrano-Candela, F.; Khandelwal, A.K.; Cheng, W.; et al. Using Landsat and nighttime lights for supervised pixel-based image classification of urban land cover. Remote Sens. Environ. 2018, 205, 253–275. [Google Scholar] [CrossRef]
- Yang, X.; Yue, W.; Gao, D. Spatial improvement of human population distribution based on multi-sensor remote-sensing data: An input for exposure assessment. Int. J. Remote Sens. 2013, 34, 5569–5583. [Google Scholar] [CrossRef]
- Bustos, M.F.; Hall, O.; Andersson, M. Nighttime lights and population changes in Europe 1992–2012. Ambio 2015, 44, 653–665. [Google Scholar] [CrossRef] [PubMed] [Green Version]
- Levin, N.; Duke, Y. High spatial resolution nighttime light images for demographic and socio-economic studies. Remote Sens. Environ. 2012, 119, 1–10. [Google Scholar] [CrossRef]
- Meng, Q.; Zhang, L.; Sun, Z.; Meng, F.; Wang, L.; Sun, Y. Characterizing spatial and temporal trends of surface urban heat island effect in an urban main built-up area: A 12-year case study in Beijing, China. Remote Sens. Environ. 2018, 204, 826–837. [Google Scholar] [CrossRef]
- Shi, K.; Chen, Y.; Li, L.; Huang, C. Spatiotemporal variations of urban CO2 emissions in China: A multiscale perspective. Appl. Energy 2018, 211, 218–229. [Google Scholar] [CrossRef]
- Small, C.; Elvidge, C.D. Night on Earth: Mapping decadal changes of anthropogenic night light in Asia. Int. J. Appl. Earth Obs. Geoinf. 2013, 22, 40–52. [Google Scholar] [CrossRef] [Green Version]
- Zhou, Y.; Smith, S.J.; Elvidge, C.D.; Zhao, K.; Thomson, A.; Imhoff, M. A cluster-based method to map urban area from DMSP/OLS nightlights. Remote Sens. Environ. 2014, 147, 173–185. [Google Scholar] [CrossRef]
- Elvidge, C.D.; Tuttle, B.T.; Sutton, P.C.; Baugh, K.E.; Howard, A.T.; Milesi, C.; Bhaduri, B.L.; Nemani, R. Global distribution and density of constructed impervious surfaces. Sensors 2007, 7, 1962–1979. [Google Scholar] [CrossRef]
- Xie, Y.; Weng, Q. Spatiotemporally enhancing time-series DMSP/OLS nighttime light imagery for assessing large-scale urban dynamics. ISPRS J. Photogramm. Remote Sens. 2017, 128, 1–15. [Google Scholar] [CrossRef]
- Shi, K.; Huang, C.; Yu, B.; Yin, B.; Huang, Y.; Wu, J. Evaluation of NPP-VIIRS nighttime light composite data for extracting built-up urban areas. Remote Sens. Lett. 2014, 5, 358–366. [Google Scholar] [CrossRef]
- Lu, D.; Tian, H.; Zhou, G.; Ge, H. Regional mapping of human settlements in southeastern China with multisensor remotely sensed data. Remote Sens. Environ. 2008, 112, 3668–3679. [Google Scholar] [CrossRef]
- Bagan, H.; Yamagata, Y. Analysis of urban growth and estimating population density using satellite images of nighttime lights and land-use and population data. GISci. Remote Sens. 2015, 52, 765–780. [Google Scholar] [CrossRef]
- Zhang, Q.; Seto, K.C. Mapping urbanization dynamics at regional and global scales using multi-temporal DMSP/OLS nighttime light data. Remote Sens. Environ. 2011, 115, 2320–2329. [Google Scholar] [CrossRef]
- Zhou, Y.; Li, X.; Asrar, G.R.; Smith, S.J.; Imhoff, M. A global record of annual urban dynamics (1992–2013) from nighttime lights. Remote Sens. Environ. 2018, 219, 206–220. [Google Scholar] [CrossRef]
- Small, C.; Pozzi, F.; Elvidge, C.D. Spatial analysis of global urban extent from DMSP -OLS night lights. Remote Sens. Environ. 2005, 96, 277–291. [Google Scholar] [CrossRef]
- Baugh, K.; Hsu, F.C.; Elvidge, C.D.; Zhizhin, M. Nighttime lights compositing using the VIIRS day-night band: Preliminary results. Proc. Asia-Pac. Adv. Netw. 2013, 35, 70–86. [Google Scholar] [CrossRef] [Green Version]
- Townsend, A.C.; Bruce, D.A. The use of nighttime lights satellite imagery as a measure of Australia’s regional electricity consumption and population distribution. Int. J. Remote Sens. 2010, 31, 4459–4480. [Google Scholar] [CrossRef]
- He, C.; Liu, Z.; Tian, J.; Ma, Q. Urban expansion dynamics and natural habitat loss in China: A multiscale landscape perspective. Glob. Chang. Biol. 2014, 20, 2886–2902. [Google Scholar] [CrossRef] [PubMed]
- Yang, Y.; He, C.; Zhang, Q.; Han, L.; Du, S. Timely and accurate national-scale mapping of urban land in China using Defense Meteorological Satellite Program’s Operational Linescan System nighttime stable light data. J. Appl. Remote Sens. 2013, 7, 073535. [Google Scholar] [CrossRef]
- Cao, X.; Chen, J.; Imura, H.; Higashi, O. A SVM-based method to extract urban areas from DMSP-OLS and SPOT VGT data. Remote Sens. Environ. 2009, 113, 2205–2209. [Google Scholar] [CrossRef]
- Pozzi, F.; Small, C. Analysis of urban land cover and population density in the United States. Photogramm. Eng. Remote Sens. 2015, 71, 719–726. [Google Scholar] [CrossRef] [Green Version]
- Zhang, Q.; Schaaf, C.; Seto, K.C. The vegetation adjusted NTL urban index: A new approach to reduce saturation and increase variation in nighttime luminosity. Remote Sens. Environ. 2013, 129, 32–41. [Google Scholar] [CrossRef]
- Yang, X.; Zhao, S.; Qin, X.; Zhao, N.; Liang, L. Mapping of Urban Surface Water Bodies from Sentinel-2 MSI Imagery at 10 m Resolution via NDWI-Based Image Sharpening. Remote Sens. 2017, 9, 596. [Google Scholar] [CrossRef] [Green Version]
- Letu, H.; Hara, M.; Yagi, H.; Naoki, K.; Tana, G.; Nisio, F.; Okada, S. Estimating energy consumption from night-time DMPS/OLS imagery after correcting for saturation effects. Int. J. Remote Sens. 2010, 31, 4443–4458. [Google Scholar] [CrossRef]
- Letu, H.; Hara, M.; Tana, G.; Nishio, F. A Saturated Light Correction Method for DMSP/OLS Nighttime Satellite Imagery. IEEE Trans. Geosci. Remote Sens. 2012, 50, 389–396. [Google Scholar] [CrossRef]
- Ziskin, D.; Baugh, K.; Feng, C.H.; Ghosh, T.; Elvidge, C.D. Methods used for the 2006 radiance lights. In Proceedings of the Asia Pacific Advanced Network, Hanoi, Vietnam, 9–13 August 2010. [Google Scholar]
- Elvidge, C.D.; Ziskin, D.; Baugh, K.E.; Tuttle, B.T.; Ghosh, T.; Pack, D.W.; Erwin, E.H.; Zhizhin, M. A Fifteen Year Record of Global Natural Gas Flaring Derived from Satellite Data. Energies 2009, 2, 595–622. [Google Scholar] [CrossRef]
- Li, Q.; Lu, L.; Weng, Q.; Xie, Y.; Guo, H. Monitoring urban dynamics in the southeast USA using time-series DMSP/OLS nightlight imagery. Remote. Sens. 2016, 8, 578. [Google Scholar] [CrossRef] [Green Version]
- Yu, B.; Tang, M.; Wu, Q.; Yang, C.; Deng, S.; Shi, K.; Peng, C.; Wu, J.; Chen, Z. Urban built-up area extraction from log-transformed NPP-VIIRS nighttime light composite data. IEEE Geosci. Remote Sens. Lett. 2018, 15, 1279–1283. [Google Scholar] [CrossRef]
- Pettorelli, N.; Vik, J.O.; Mysterud, A.; Gaillard, J.M.; Tucker, C.J.; Stenseth, N.C. Using the satellite-derived NDVI to assess ecological responses to environmental change. Trends Ecol. Evol. 2005, 20, 503–510. [Google Scholar] [CrossRef]
- Jones, H.G.; Vaughan, R.A. Remote Sensing of Vegetation: Principles, Techniques, and Applications; Oxford University Press: New York, NY, USA, 2010; p. 353. [Google Scholar]
- Weng, Q.; Lu, D.; Schubring, J. Estimation of land surface temperature—Vegetation abundance relationship for urban heat island studies. Remote Sens. Environ. 2004, 89, 467–483. [Google Scholar] [CrossRef]
- Huang, S.; Tang, L.; Hupy, J.; Shao, G. A commentary review on the use of normalized difference vegetation index (NDVI) in the era of popular remote sensing. J. For. Res. 2020, 31, 1–6. [Google Scholar]
- McFeeters, S.K. The use of the Normalized Difference Water Index (NDWI) in the delineation of open water features. Int. J. Remote Sens. 1996, 17, 1425–1432. [Google Scholar] [CrossRef]
- Henderson, M.; Yeh, E.T.; Gong, P.; Elvidge, C.; Baugh, K. Validation of urban boundaries derived from global nighttime satellite imagery. Int. J. Remote Sens. 2003, 24, 595–609. [Google Scholar] [CrossRef]
- He, C.; Shi, P.; Li, J.; Chen, J.; Pan, Y.; Li, J.; Zhuo, L.; Ichinose, T. Restoring urbanization process in China in the 1990s by using non-radiance-calibrated DMSP/OLS nighttime light imagery and statistical data. Chin. Sci. Bull. 2006, 51, 1614–1620. [Google Scholar] [CrossRef]
- Congalton, R.G. A review of assessing the accuracy of classifications of remotely sensed data. Remote Sens. Environ. 1991, 37, 35–46. [Google Scholar] [CrossRef]
- Shao, G.; Tang, L.; Liao, J. Overselling overall map accuracy misinforms about research reliability. Landsc. Ecol. 2019, 34, 2487–2492. [Google Scholar] [CrossRef] [Green Version]
- Liu, C.; Frazier, P.; Kumar, L. Comparative assessment of the measures of thematic classification accuracy. Remote Sens. Environ. 2007, 107, 606–616. [Google Scholar] [CrossRef]
- Olofsson, P.; Foody, G.M.; Herold, M.; Stehman, S.V.; Woodcock, C.E.; Wulder, M.A. Good practices for estimating area and assessing accuracy of land change. Remote Sens. Environ. 2014, 148, 42–57. [Google Scholar] [CrossRef]
- Mudereri, B.T.; Abdel-Rahman, E.M.; Dube, T.; Niassy, S.; Khan, Z.; Tonnang, H.E.Z.; Landmann, T. A two-step approach for detecting Striga in a complex agroecological system using Sentinel-2 data. Sci. Total Environ. 2021, 762, 143151. [Google Scholar] [CrossRef] [PubMed]
- Graesser, J.; Ramankutty, N. Detection of cropland field parcels from Landsat imagery. Remote Sens. Environ. 2017, 201, 165–180. [Google Scholar] [CrossRef] [Green Version]
- Elvidge, C.D.; Cinzano, P.; Pettit, D.R.; Arvesen, J.; Sutton, P.; Small, C.; Nemani, R.; Longcore, T.; Rich, C.; Safran, J.; et al. The Nightsat mission concept. Int. J. Remote Sens. 2007, 28, 2645–2670. [Google Scholar] [CrossRef]
- Zhao, J.; Yan, Y.; Deng, H.; Liu, G.; Dai, L.; Tang, L.; Shi, L.; Shao, G. Remarks about landsenses ecology and ecosystem services. Int. J. Sustain. Dev. World Ecol. 2020, 27, 196–201. [Google Scholar] [CrossRef] [Green Version]
- Román, M.O.; Wang, Z.; Sun, Q.; Kalb, V.; Miller, S.D.; Molthan, A.; Schultz, L.; Bell, J.; Stokes, E.C.; Pandey, B.; et al. NASA’s Black Marble nighttime lights product suite. Remote Sens. Environ. 2018, 210, 113–143. [Google Scholar] [CrossRef]
- Levin, N.; Zhang, Q. A global analysis of factors controlling VIIRS nighttime light levels from densely populated areas. Remote Sens. Environ. 2017, 190, 366–382. [Google Scholar] [CrossRef] [Green Version]
- Hu, S.; Ma, S.; Yan, W.; Lu, W.; Zhao, X. Feasibility of a specialized ground light source for nighttime low-light calibration. Int. J. Remote Sens. 2018, 39, 2543–2559. [Google Scholar] [CrossRef]
- Ryan, R.E.; Pagnutti, M.; Burch, K.; Leigh, L.; Ruggles, T.; Cao, C.; Aaron, D.; Blonski, S.; Helder, D. The Terra Vega Active Light Source: A First Step in a New Approach to Perform Nighttime Absolute Radiometric Calibrations and Early Results Calibrating the VIIRS DNB. Remote. Sens. 2019, 11, 710. [Google Scholar] [CrossRef] [Green Version]
- Li, X.; Li, D.; Xu, H.; Wu, C. Intercalibration between DMSP/OLS and VIIRS nighttime light images to evaluate city light dynamics of Syria’s major human settlement during Syrian Civil War. Int. J. Remote Sens. 2017, 38, 5934–5951. [Google Scholar] [CrossRef]
- Zheng, Q.; Weng, Q.; Wang, K. Developing a new cross-sensor calibration model for DMSP-OLS and Suomi-NPP VIIRS night-light imageries. ISPRS J. Photogramm. Remote Sens. 2019, 153, 36–47. [Google Scholar] [CrossRef]
- Li, X.; Zhou, Y. A stepwise calibration of global DMSP/OLS stable nighttime light data (1992–2013). Remote Sens. 2017, 9, 637. [Google Scholar]
- Zheng, Y.; Shao, G.; Tang, L.; He, Y.; Wang, X.; Wang, Y.; Wang, H. Rapid Assessment of a Typhoon Disaster Based on NPP-VIIRS DNB Daily Data: The Case of an Urban Agglomeration along Western Taiwan Straits, China. Remote Sens. 2019, 11, 1709. [Google Scholar] [CrossRef] [Green Version]
- Levin, N.; Phinn, S. Illuminating the capabilities of Landsat 8 for mapping nightlights. Remote Sens. Environ. 2016, 182, 27–38. [Google Scholar] [CrossRef]
- Hale, J.D.; Davies, G.; Fairbrass, A.J.; Matthews, T.J.; Rogers, C.D.; Sadler, J.P. Mapping lightscapes: Spatial patterning of artificial lighting in an urban landscape. PLoS ONE 2013, 8, e61460. [Google Scholar] [CrossRef] [Green Version]
- Li, X.; Levin, N.; Xie, J.; Li, D. Monitoring hourly nighttime light by an unmanned aerial vehicle and its implications to satellite remote sensing. Remote Sens. Environ. 2020, 247, 111942. [Google Scholar] [CrossRef]
- Zhao, M.; Zhou, Y.; Li, X.; Cao, W.; He, C.; Yu, B.; Li, X.; Elvidge, C.D.; Cheng, W.; Zhou, C. Applications of Satellite Remote Sensing of Nighttime Light Observations: Advances, Challenges, and Perspectives. Remote Sens. 2019, 11, 1971. [Google Scholar] [CrossRef] [Green Version]
- Levin, N.; Kyba, C.C.; Zhang, Q.; De Miguel, A.S.; Roman, M.O.; Li, X.; Portnov, B.A.; Molthan, A.L.; Jechow, A.; Miller, S.D.; et al. Remote sensing of night lights: A review and an outlook for the future. Remote Sens. Environ. 2020, 237, 111443. [Google Scholar] [CrossRef]
Figure 1.
Geographical location of research area.

Figure 2.
(a) Overall accuracy and (b) urban F-scores compared for urban land extracted by the threshold segmentation method based on different indicators in the research areas. Nighttime light (NTL), NTL vegetation index (NVI), NTL water index (NWI), logarithmic NTL vegetation index (LNVI), logarithmic NTL water index (LNWI), NTL vegetation–water index (NVWI), vegetation–water-adjusted nighttime light urban index (VWANUI); GZ = Guangzhou, SZ = Shenzhen, ZH = Zhuhai, FS = Foshan, JM = Jiangmen, ZQ = Zhaoqing, HZ = Huizhou, DG = Dongguan, ZS = Zhongshan, HK = Hong Kong, MC = Macao.

Figure 3.
Producer’s accuracy (PA) and user’s accuracy (UA) compared by the threshold segmentation method based on different indicators in the research areas: (a) urban PA, (b) urban UA, (c) nonurban PA, (d) nonurban UA.
Figure 3.
Producer’s accuracy (PA) and user’s accuracy (UA) compared by the threshold segmentation method based on different indicators in the research areas: (a) urban PA, (b) urban UA, (c) nonurban PA, (d) nonurban UA.

Figure 4.
Comparison of (a) Landsat-8 OLI images, (b) Defense Meteorological Program Operational Line-Scan System (DMSP-OLS) NTL data, and (c) VWANUI data for five cities.
Figure 4.
Comparison of (a) Landsat-8 OLI images, (b) Defense Meteorological Program Operational Line-Scan System (DMSP-OLS) NTL data, and (c) VWANUI data for five cities.

Figure 5.
Latitudinal transects of saturated DMSP-OLS NTL, human settlement index (HSI), vegetation-adjusted NTL urban index (VANUI), and VWANUI in the research areas.
Figure 5.
Latitudinal transects of saturated DMSP-OLS NTL, human settlement index (HSI), vegetation-adjusted NTL urban index (VANUI), and VWANUI in the research areas.

Figure 6.
Visual comparison of corrected images of various cities obtained by the different approaches.
Figure 6.
Visual comparison of corrected images of various cities obtained by the different approaches.

Figure 7.
Comparison of precision of (a) overall accuracy with (b) urban F-score by different approaches. GZ = Guangzhou, SZ = Shenzhen, ZH = Zhuhai, FS = Foshan, JM = Jiangmen, ZQ = Zhaoqing, HZ = Huizhou, DG = Dongguan, ZS = Zhongshan, HK = Hong Kong, MC = Macao, MV = Mean value of 11 cities.
Figure 7.
Comparison of precision of (a) overall accuracy with (b) urban F-score by different approaches. GZ = Guangzhou, SZ = Shenzhen, ZH = Zhuhai, FS = Foshan, JM = Jiangmen, ZQ = Zhaoqing, HZ = Huizhou, DG = Dongguan, ZS = Zhongshan, HK = Hong Kong, MC = Macao, MV = Mean value of 11 cities.

Figure 8.
PA and UA compared between different approaches: (a) urban PA, (b) urban UA, (c) nonurban PA, (d) nonurban UA.
Figure 8.
PA and UA compared between different approaches: (a) urban PA, (b) urban UA, (c) nonurban PA, (d) nonurban UA.

Figure 9.
Comparison of urban land extracted by different approaches in several representative cities from the study.
Figure 9.
Comparison of urban land extracted by different approaches in several representative cities from the study.

Figure 10.
Comparison of R2 and root-mean-square error (RMSE) for scatterplots of the different indexes against the reference data. (a) DMSP index, (b) HSI index, (c) VANUI index, (d) VWANUI index.
Figure 10.
Comparison of R2 and root-mean-square error (RMSE) for scatterplots of the different indexes against the reference data. (a) DMSP index, (b) HSI index, (c) VANUI index, (d) VWANUI index.

Figure 11.
Contrast of urban land extracted by different approaches in the representative cities.

Figure 12.
Comparison of R2 of scatterplots for extracted urban land obtained by applying the various approaches versus reference data and extracted common urban land versus the reference data. The various approaches based on (a) DMSP, (b) HSI, (c) VANUI, (d) WANUI.
Figure 12.
Comparison of R2 of scatterplots for extracted urban land obtained by applying the various approaches versus reference data and extracted common urban land versus the reference data. The various approaches based on (a) DMSP, (b) HSI, (c) VANUI, (d) WANUI.

Figure 13.
Urban land extracted based on proposed VWANUI applied to 11 cities within the research area.
Figure 13.
Urban land extracted based on proposed VWANUI applied to 11 cities within the research area.


Table 1.
Error matrix and various accuracy metrics.
| Map Data | Reference Data | |||||
|---|---|---|---|---|---|---|
| j = 1 | j = 2 | … | j = J | Map Total | User’s Accuracy | |
| i = 1 | x11 | x12 | x1J | x1+ | x11/x1+ | |
| i = 2 | x21 | x22 | x2J | x2+ | x22/x2+ | |
| … | ||||||
| i = J | xJ1 | xJ2 | xJJ | xJ+ | xJJ/xJ+ | |
| Reference total | x+1 | x+2 | x+J | 1 | ||
| Producer’s accuracy | x11/x+1 | x22/x+2 | xJJ/x+J | |||
Note: xjj is the fraction of correctly classified samples of class j in the diagonal of the error matrix, xij is the fraction of samples in row i and column j, J is the total number of land-cover types, xi+ is the total fraction of class i extracted from map data, and x+j is the total fraction of class j obtained from the reference data.
Table 2.
Regression models for estimating urban land based on different indexes.
| Index | Regression Model (y = ax + b) | R2 | R | RMSE |
|---|---|---|---|---|
| DMSP | UL = 1.0295 × DMSP − 0.0051 | 0.7000 | 0.8367 | 0.1791 |
| HSI | UL = 0.8735 × HIS + 0.0930 | 0.6352 | 0.7970 | 0.1644 |
| VANUI | UL = 1.0634 × VANUI − 0.0172 | 0.7530 | 0.8678 | 0.1635 |
| VWANUI | UL = 1.1571 × VWANUI − 0.0916 | 0.8266 | 0.9092 | 0.1425 |
Publisher’s Note: MDPI stays neutral with regard to jurisdictional claims in published maps and institutional affiliations. |
© 2021 by the authors. Licensee MDPI, Basel, Switzerland. This article is an open access article distributed under the terms and conditions of the Creative Commons Attribution (CC BY) license (http://creativecommons.org/licenses/by/4.0/).
Share and Cite
MDPI and ACS Style
Zheng, Y.; Zhou, Q.; He, Y.; Wang, C.; Wang, X.; Wang, H. An Optimized Approach for Extracting Urban Land Based on Log-Transformed DMSP-OLS Nighttime Light, NDVI, and NDWI. Remote Sens. 2021, 13, 766. https://doi.org/10.3390/rs13040766
AMA Style
Zheng Y, Zhou Q, He Y, Wang C, Wang X, Wang H. An Optimized Approach for Extracting Urban Land Based on Log-Transformed DMSP-OLS Nighttime Light, NDVI, and NDWI. Remote Sensing. 2021; 13(4):766. https://doi.org/10.3390/rs13040766
Chicago/Turabian StyleZheng, Yuanmao, Qiang Zhou, Yuanrong He, Cuiping Wang, Xiaorong Wang, and Haowei Wang. 2021. "An Optimized Approach for Extracting Urban Land Based on Log-Transformed DMSP-OLS Nighttime Light, NDVI, and NDWI" Remote Sensing 13, no. 4: 766. https://doi.org/10.3390/rs13040766
Note that from the first issue of 2016, this journal uses article numbers instead of page numbers. See further details here.