Analysis of the Dynamic Urban Expansion Based on Multi-Sourced Data from 1998 to 2013: A Case Study of Jiangsu Province


1
Jiangsu Center for Collaborative Innovation in Geographical Information Resource Development and Application, Nanjing Normal University, Nanjing 210023, China
2
Key Laboratory of Virtual Geographic Environment, Nanjing Normal University, Ministry of Education, Nanjing 210046, China
3
School of Geographic Science, Nanjing Normal University, Nanjing 210046, China
*
Author to whom correspondence should be addressed.
Sustainability 2018, 10(10), 3467; https://doi.org/10.3390/su10103467
Submission received: 1 August 2018
/
Revised: 25 September 2018
/
Accepted: 26 September 2018
/
Published: 28 September 2018
(This article belongs to the Special Issue Urban Sprawl and Sustainability)
Abstract
:Recently, with the fast speed of urban expansion, research concerning the regulation of urban built-up area expansion is a significant topic, especially in Eastern China with its high urbanization level. The Defense Meteorological Satellite Program’s Operational Linescan System (DMSP/OLS) nighttime light data has a high association with the urban-rural distribution, which provides a new method to study urban expansion effectively and with relatively high accuracy. Between 1998 and 2013, China experienced a rapid economic development period, making it crucial to learn the patterns and driving forces to better manage urban master planning and sustainable development. The urban built-up area for the research years are mapped, and the annual urban expansion speed, urbanization intensity index, and built-up area gravity center are analyzed in this paper. The results will show that the amount of the urban built-up area grows continuously from 1998 to 2008, with the development focus in southern Jiangsu, while from 2008 to 2013, the development center moves to northern Jiangsu. The main driving forces behind this urban built-up area expansion are population growth and economic development.
1. Introduction
China has suddenly been exposed to the phenomenon of urban sprawl with its burgeoning economy since 1990. Recent years have witnessed a spurt of progress in urban built-up area expansion [1,2,3,4]. During the twenty-seven years from 1990 to 2017, the population urbanization rate of China has changed from 26.41% to 58.52%, an increase of 2.21 times [5]. The rapid urbanization is closely related to social and environmental changes, which bring huge economic development, but at the same time add to the risk of over-population, natural resource depletion, urban congestion, and a series of environmental problems [6,7]. These effects have captured the attention of experts in related fields, like geographers, urban planners, policy makers, as well as the general public. Tracking spatio-temporal dynamic change has become an important research topic; the number of articles published related to “urbanization expansion” has risen by 1000% over the last twenty years, according to bibliographic information derived from the Web of Science. Understanding the timely characteristics of dynamic urban expansion is essential for estimating its corresponding effects, and can provide constructive suggestions to city master planners and for sustainable development [8,9].
The existing studies regarding urban expansion mainly use socio-economic data, location-based social media data, and Landsat Thematic Mapper (TM) images. Zhang [10] and Yixing [11] analyzed the urbanization trend, economic growth rate, and development differences between regions based on the yearly statistic book. However, the statistic year book only provides statistical data, which cannot provide spatial information. Ferrari [12] used location-based social media data to extract urban patterns. Goodchild [13] pointed out that Volunteer Geographic Information can provide details of spatial information for understanding the Earth’s surface. Shi [14] identified the urban center system to analyze urban expansion accumulation by point-of-interest data. Long [15,16] investigated the urban functional zones and commuting patterns using bus smart card data. The above research only covers a short time period, however, as those types of data providers have only existed for a few years. Thus, the new-type big data cannot be applied to discover the patterns of long-term urban dynamic expansion. Some researchers used Landsat TM images to discover the topic of land-use and cover change (LUCC) at certain scales, mainly to analyze the type of land-use changes or identify the land-use type [17,18,19,20]. Unfortunately, those Landsat TM image data are impractical for the analysis of large-scale regions because poor atmospheric conditions might lead to poor images, especially in a humid subtropical climate region like the Yangtze River delta [21].
Satellite remote sensing technology provides access to various geographic big data, and has gradually received attention. The Defense Meteorological Satellite Program (DMSP) has an Operational Line-Scan System (OLS) which can provide nighttime light data (NTL) to detect various dynamic issues globally [22,23]. The provided nighttime light data contains the lights in a study area with persistent lighting. The provided data has removed occasional data noise like auroras, moonlight, potential clouds, et cetera. The attribution has a digital number (DN) value ranging from 0 to 63 to represent the intensity of light, with 0 representing the darkest area and 63 representing the lightest [24]. The NTL data has already been used widely for numerous issues related to urban studies such as population distribution mapping [25], economic activity estimation [26], urban area extraction [27,28], and light pollution detection [29]. Most previous research studied the relationship between nighttime light and urban issues on different scales, while few studies combined the multi-temporal nighttime light and social census to explore the spatio-temporal patterns of urban expansion. Specifically, Jiangsu province is one of largest economic development provinces of China, with a high urbanization level. Its urban built-up area expansion patterns have attracted more attention recently to understand the dynamics of urbanization [30,31].
To better manage urban master planning and sustainable development, it is crucial to learn about the driving forces of the built-up area expansion. The primary objective of this research is to discover the urban expansion trend of Jiangsu province during this rapid economic development period from 1998 to 2013, based on the DMSP/OLS nighttime light data. The urban built-up area changes are quantified and the expansion patterns and driving forces are analyzed by different models in this study. The methodology and conclusions about the evolution patterns of the urban built-up area can be adapted to other regions with similar development periods of rapid economic growth.
2. Materials and Methods
2.1. Study Area
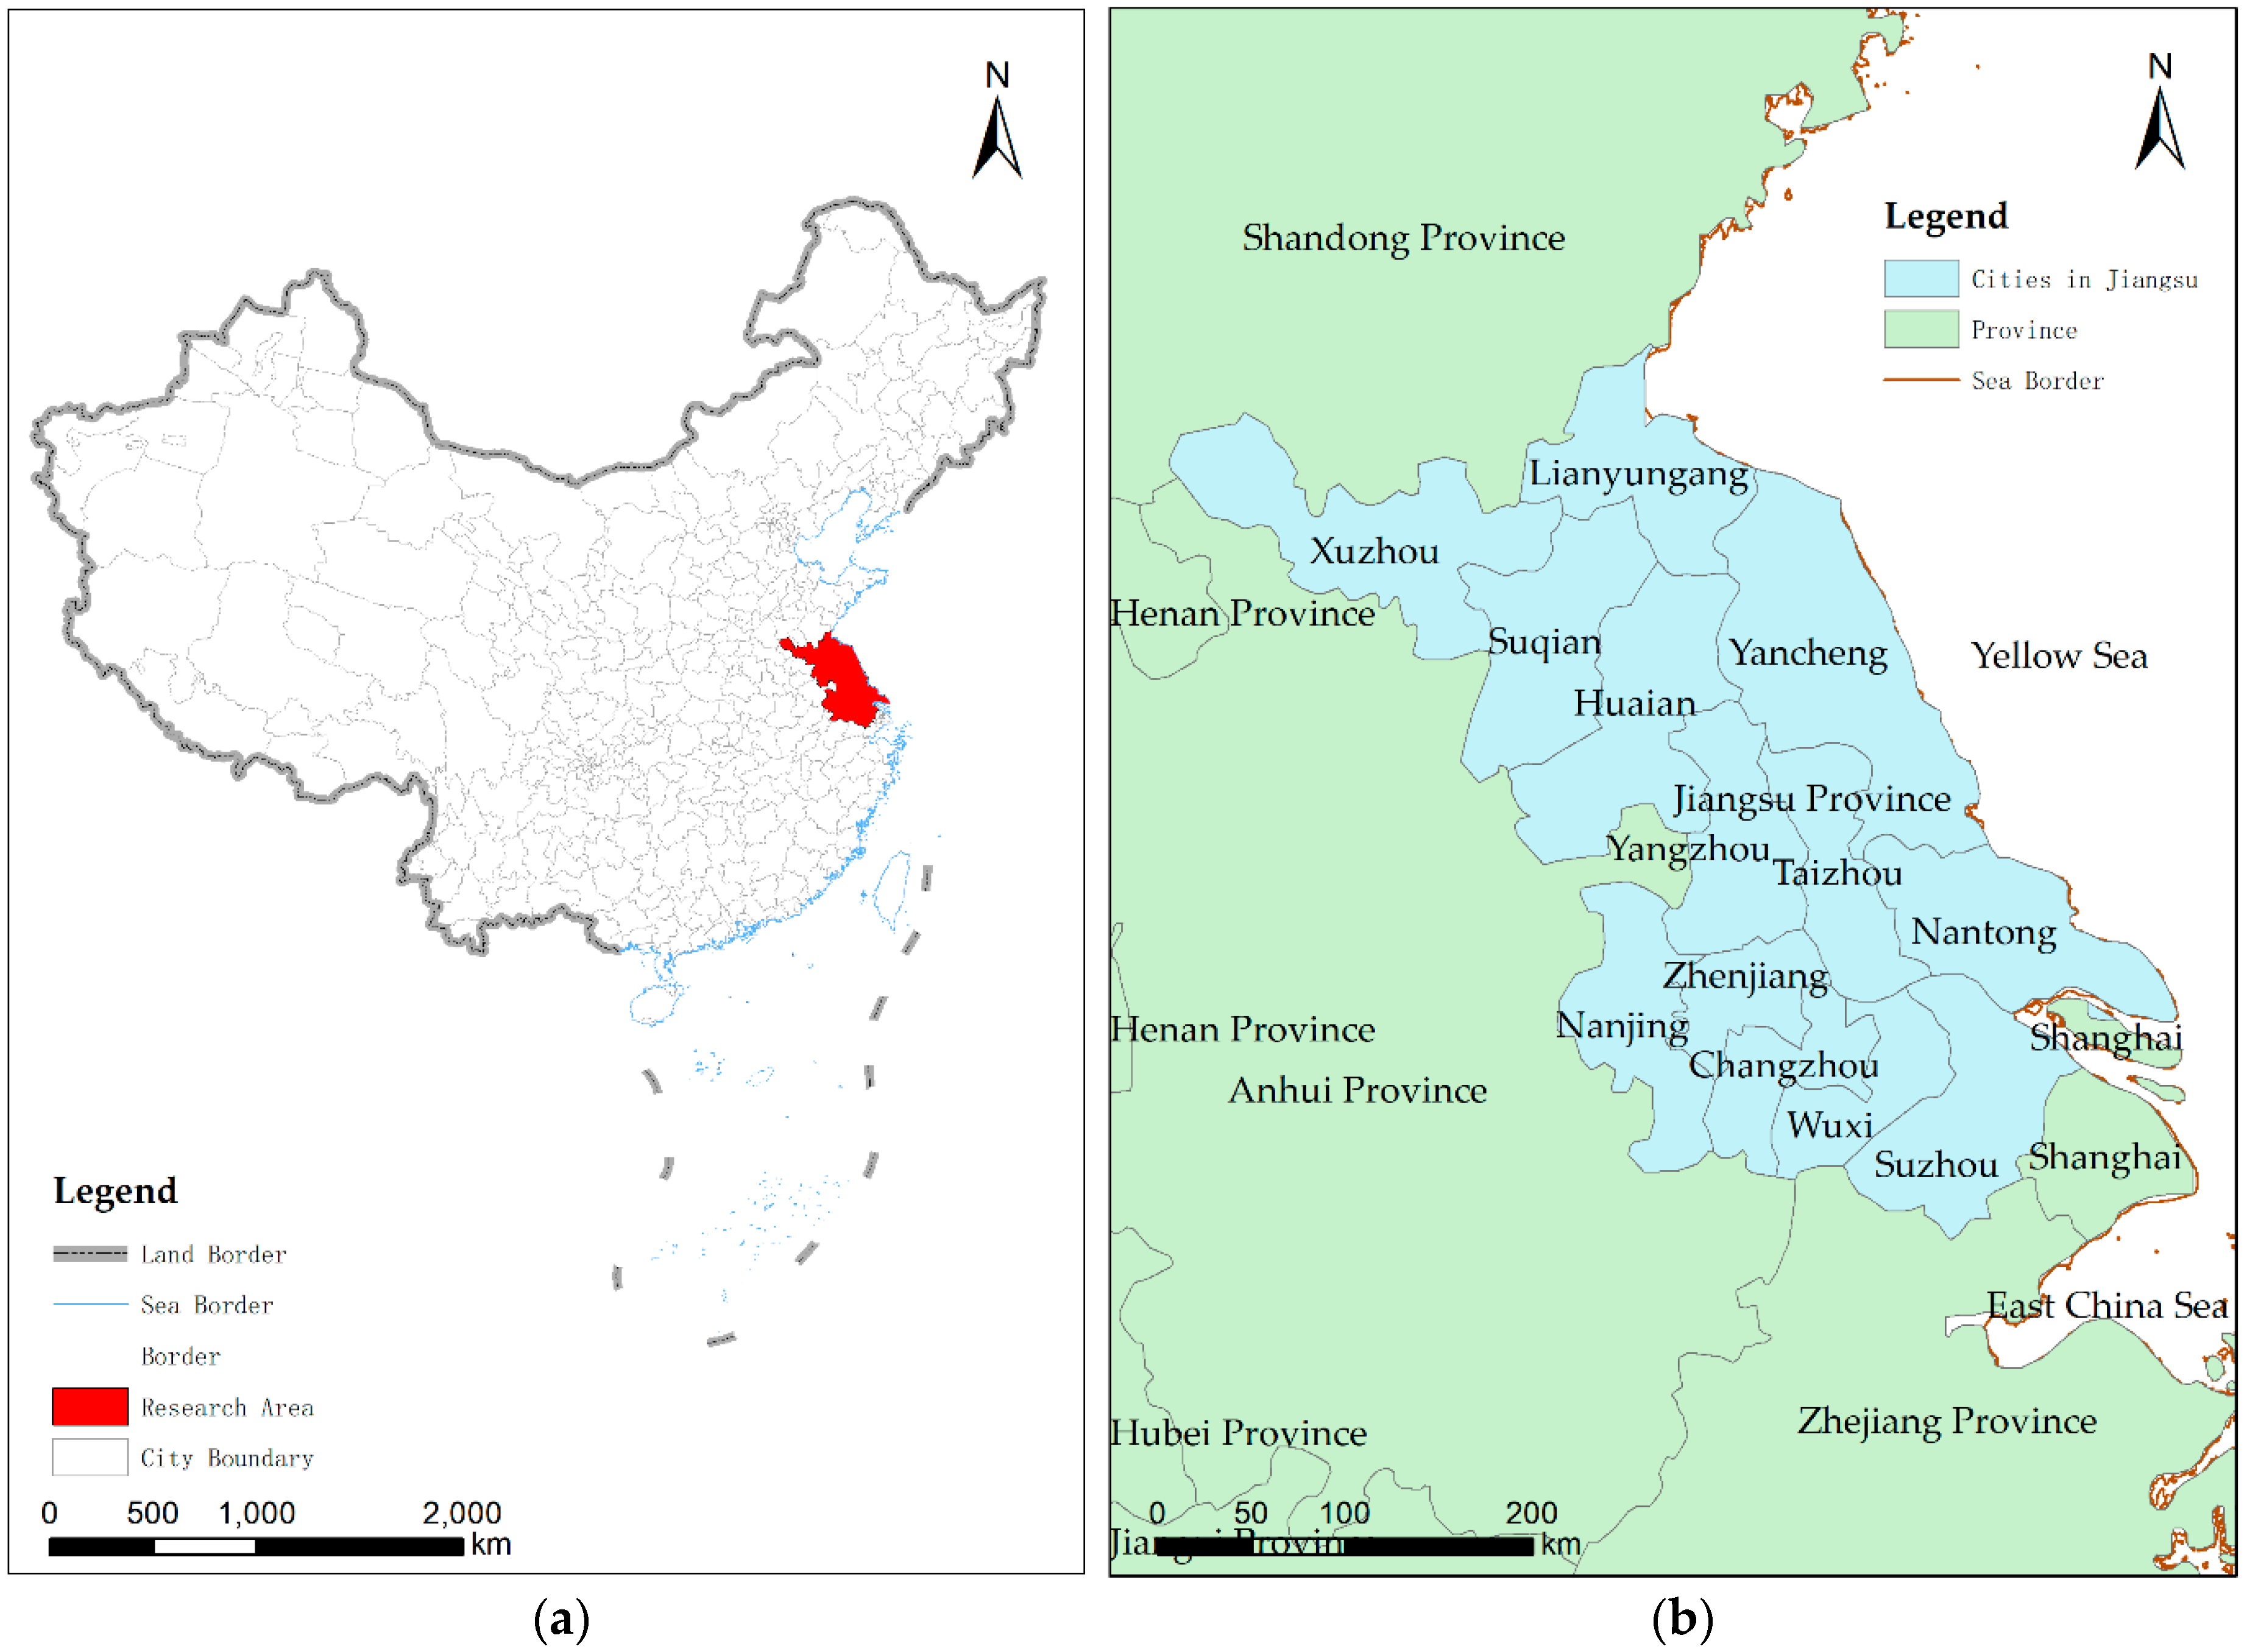
Jiangsu province is located in the Yangtze River Delta of Eastern China, with 954 km of coastline along the Yellow Sea, and spanning from longitude 116°18′ E to 121°57′ E and latitude 30°45′ N to 35°20′ N (see Figure 1). The total land area equals 10.72 km2, accounting for 1.1% of the total area of China. The province is west of the Yellow Sea, south of Shandong province, east of Anhui province, and north of Zhejiang province and Shanghai. The geomorphology of Jiangsu is mainly plains, covering 68% of the total area, and water, covering 18%, with some hilly areas in the southwest region covering 14% of the total area. The elevation is low; most of the area is lower than 50 m. Jiangsu province belongs to the subtropical monsoon humid climate with moderate rainfall and distinctive seasons. The average temperature of all cities is between 13 °C–16 °C. There were 13 cities in Jiangsu province, including Nanjing (provincial capital city), Wuxi, Xuzhou, Changzhou, Suzhou, Nantong, Lianyungang, Huai’an, Yancheng, Yangzhou, Zhenjiang, Taizhou, and Suqian [32,33,34], at the end of 2017.
Since the expansion policy, China has experienced rapid economic development and urbanization. Jiangsu is one of the most urbanized regions, with the highest per capita Gross Domestic Products (GDP). Jiangsu’s residential population was 80,293 thousand at the end of 2017, and its total GDP was 8590 billion Yuan. Jiangsu’s urbanization level is among the highest in China, although unbalanced development between different cities exists, and there is a large gap between urban and rural areas. The urbanization development trend pushes land-use changes, and more rural areas are changing into urban areas. The Yangtze River divides the province into two parts: south and north to the Yangtze River. Overall, the development level of the southern region is higher than that of northern [34].
2.2. Data and Preprocessing
● Nighttime Light Data
This paper uses DMSP/OLS nighttime light data from 1998 to 2013 (Figure A1), derived from the National Oceanic and Atmospheric Administration’s (NOAA) National Geophysical Data Center (available at https://ngdc.noaa.gov/eog.dmsp/downloadV4composites.html) [35]. Images have a resolution of 1 km and a digital number (DN value) of between 0 and 63. There are a total of six satellites to detect the nighttime light data, i.e., F10 (1992–1994), F12 (1994–1999), F14 (1997–2003), F15 (2000–2007), F16 (2004–2009), and F18 (2010–2013). The time phases of nighttime light data used in this paper are 1998, 2003, 2008 and 2013. All the images for the four time phases provided used the WGS1984 coordinate system.
● Land Use and Cover Change Data
This paper uses city boundary data of the Jiangsu province from the National Science and Technology Infrastructure of China [36]. The accuracy of the evaluation of the land use situation of the entire research year is higher than 94%, which is suitable for research on 1:100,000 scale map. The time phases of land use maps used in this research are 2003 and 2013.
● City Boundary Data
This paper uses city boundary data of Jiangsu province from the National Science and Technology Infrastructure of China, National Earth System Science Data Sharing Infrastructure (http://www.geodata.cn) [36].
● Social Economy Data
This paper uses Jiangsu Statistical Yearbook data and China City Statistical Yearbook data from 1996–2013, from the National Bureau of Statistics of China. This dataset is provided by the National Earth System Science Data Sharing Infrastructure (http://www.geodata.cn), Yangtze River Delta Science Data Center (http://nnu.geodata.cn:8008), which serves as the Jiangsu province’s annual socio-economic dataset [36]. This dataset includes statistical information of all cities in Jiangsu province, and includes economic, social, demographic, agricultural, urban construction, environmental, and other related city statistics. This data statistically reflects the yearly economic and social development of Jiangsu province. The storage format is an Excel file.
2.3. Method
2.3.1. Urban Built-Up Area Extraction
The urban built-up areas are usually decorated with lights at night; thus, the corresponding region in nighttime light data (NTL) has a higher digital number (DN) value than the other non-built-up area. There are some deviations between different time series for NTL data, making data unusable directly due to existing sensors differing, background noise, cloud reflection, orbital parameter differences, et cetera [23,27]. Moreover, due to the development variance between the southern and northern regions, it is hard to determine the urban built-up area by one typical threshold for all 13 cities in Jiangsu province. Thus, before further analysis, the authors needed to correct the nighttime light data comparisons from different time periods and from different satellites.
Existing studies usually use a threshold value to segment urban areas for nighttime light images [37,38]. The authors of the current study applied a threshold correction method to extract the urban built-up area. Using the statistical year book’s reported data as a reference [36], the area calculated by the threshold value for urban built-up area extraction was compared by choosing the threshold value with a minimum difference between the area reported by the statistical year book and derived by nighttime light data. This method has a relatively high accuracy and was easily accomplished [39]. However, this method can only be applied in the research with sufficient urban statistical data provided by a government such as that of Jiangsu province has.
2.3.2. Annual Urban Expansion Speed
To study the urban expansion situation, the authors used the annual urban expansion speed model to perform the analysis [40,41]. It showed the annual rate of the built-up area change over the study period. When the value was above zero, that period was experiencing expansion. Otherwise, if the value was below zero, loss was experienced in terms of development. The formula for annual urban expansion speed is shown below:
where is the annual urban expansion speed from the year to the year + ; and are the total area of the built-up area at the time of year and year + , respectively and is the study time.
2.3.3. Urbanization Intensity Index
The urban expansion speed cannot describe the urbanization dynamic level quantitively. The authors used an urbanization intensity index (UII) to reflect the urbanization intensity, making the urbanization trend between years comparable [42]. This index shows the situation of the urbanization period. When the value was above 1, it showed that this period of urbanization was faster. Otherwise, if the value was below 1, it showed a slowing of the urbanization period. The calculation formula is shown below:
where is the urbanization intensity index between the year and year + , and and are the total area of the built-up area at the time of year and year + , respectively.
2.3.4. Built-Up Area Gravity Center
The land-use gravity center model is used to express the spatial distribution change of a certain land-use type [43,44]. The authors used the Arc/Info spatial statistics tool (ESRI, CA, USA) to calculate the coordinates of the built-up area gravity center for different time periods. The calculation formula is as below:
where and are the gravity centers of the built-up area’s value of x-coordinate and y-coordinate in year , respectively, is the area of the built-up area in the region of polygon in year , is the average x-coordinate, and is the total area of the built-up area in year .
3. Results
3.1. Urban Expansion for the Fifteen Years
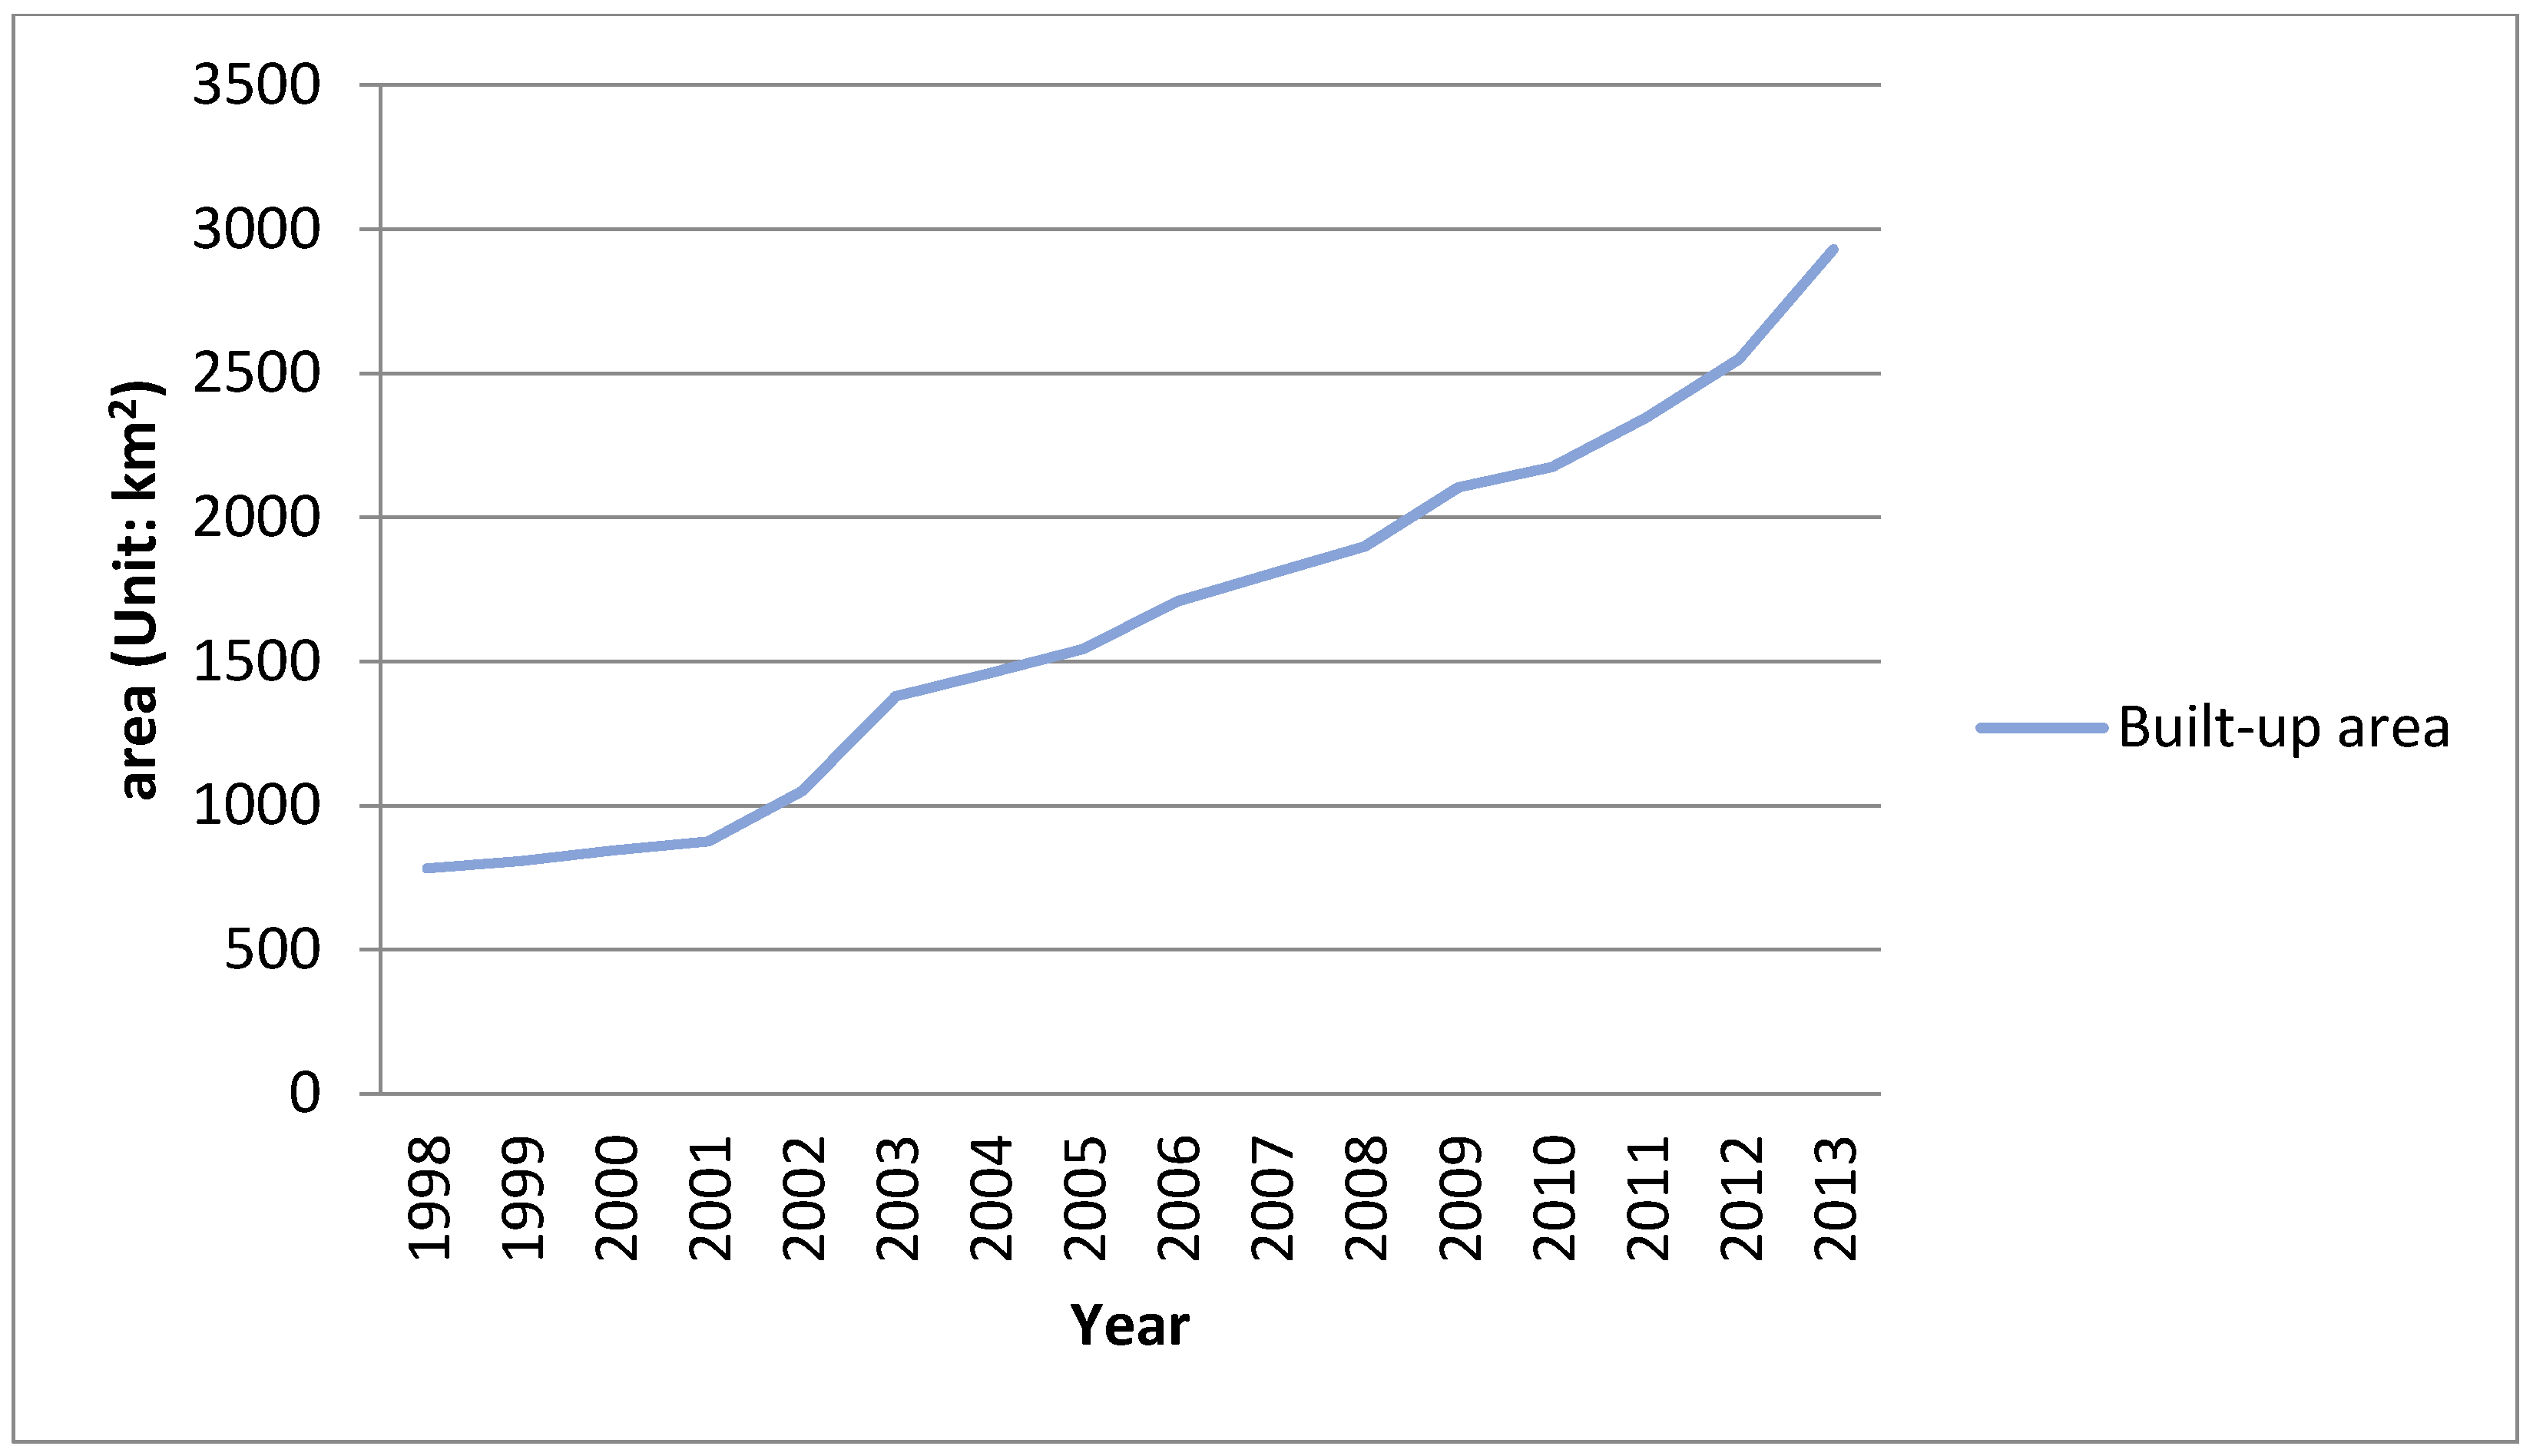
According to the Jiangsu Statistical Yearbook [36], the urban built-up area in Jiangsu province from 1998 to 2013 was extracted as shown in Figure 2. The areas of the urban built-up area in Jiangsu province expanded from 808 km2 in 1998 to 2930 km2 in 2013, with an average increase speed of 141.5 km2 per year. Therefore, the area increased by 363% during the total study period. Over the past 1455 years, the urban built-up area expansion experienced some stages with relatively high or low speeds, and it shows a trend of continuous growth in the coming years. It was divided into three periods, as follows: (1) an initial expansion period from 1998 to 2001, with a relatively low speed; (2) a short, high-speed development period from 2001 to 2003; (3) a stable development period from 2004 to 2013 with some turning points like 2008 and 2012.
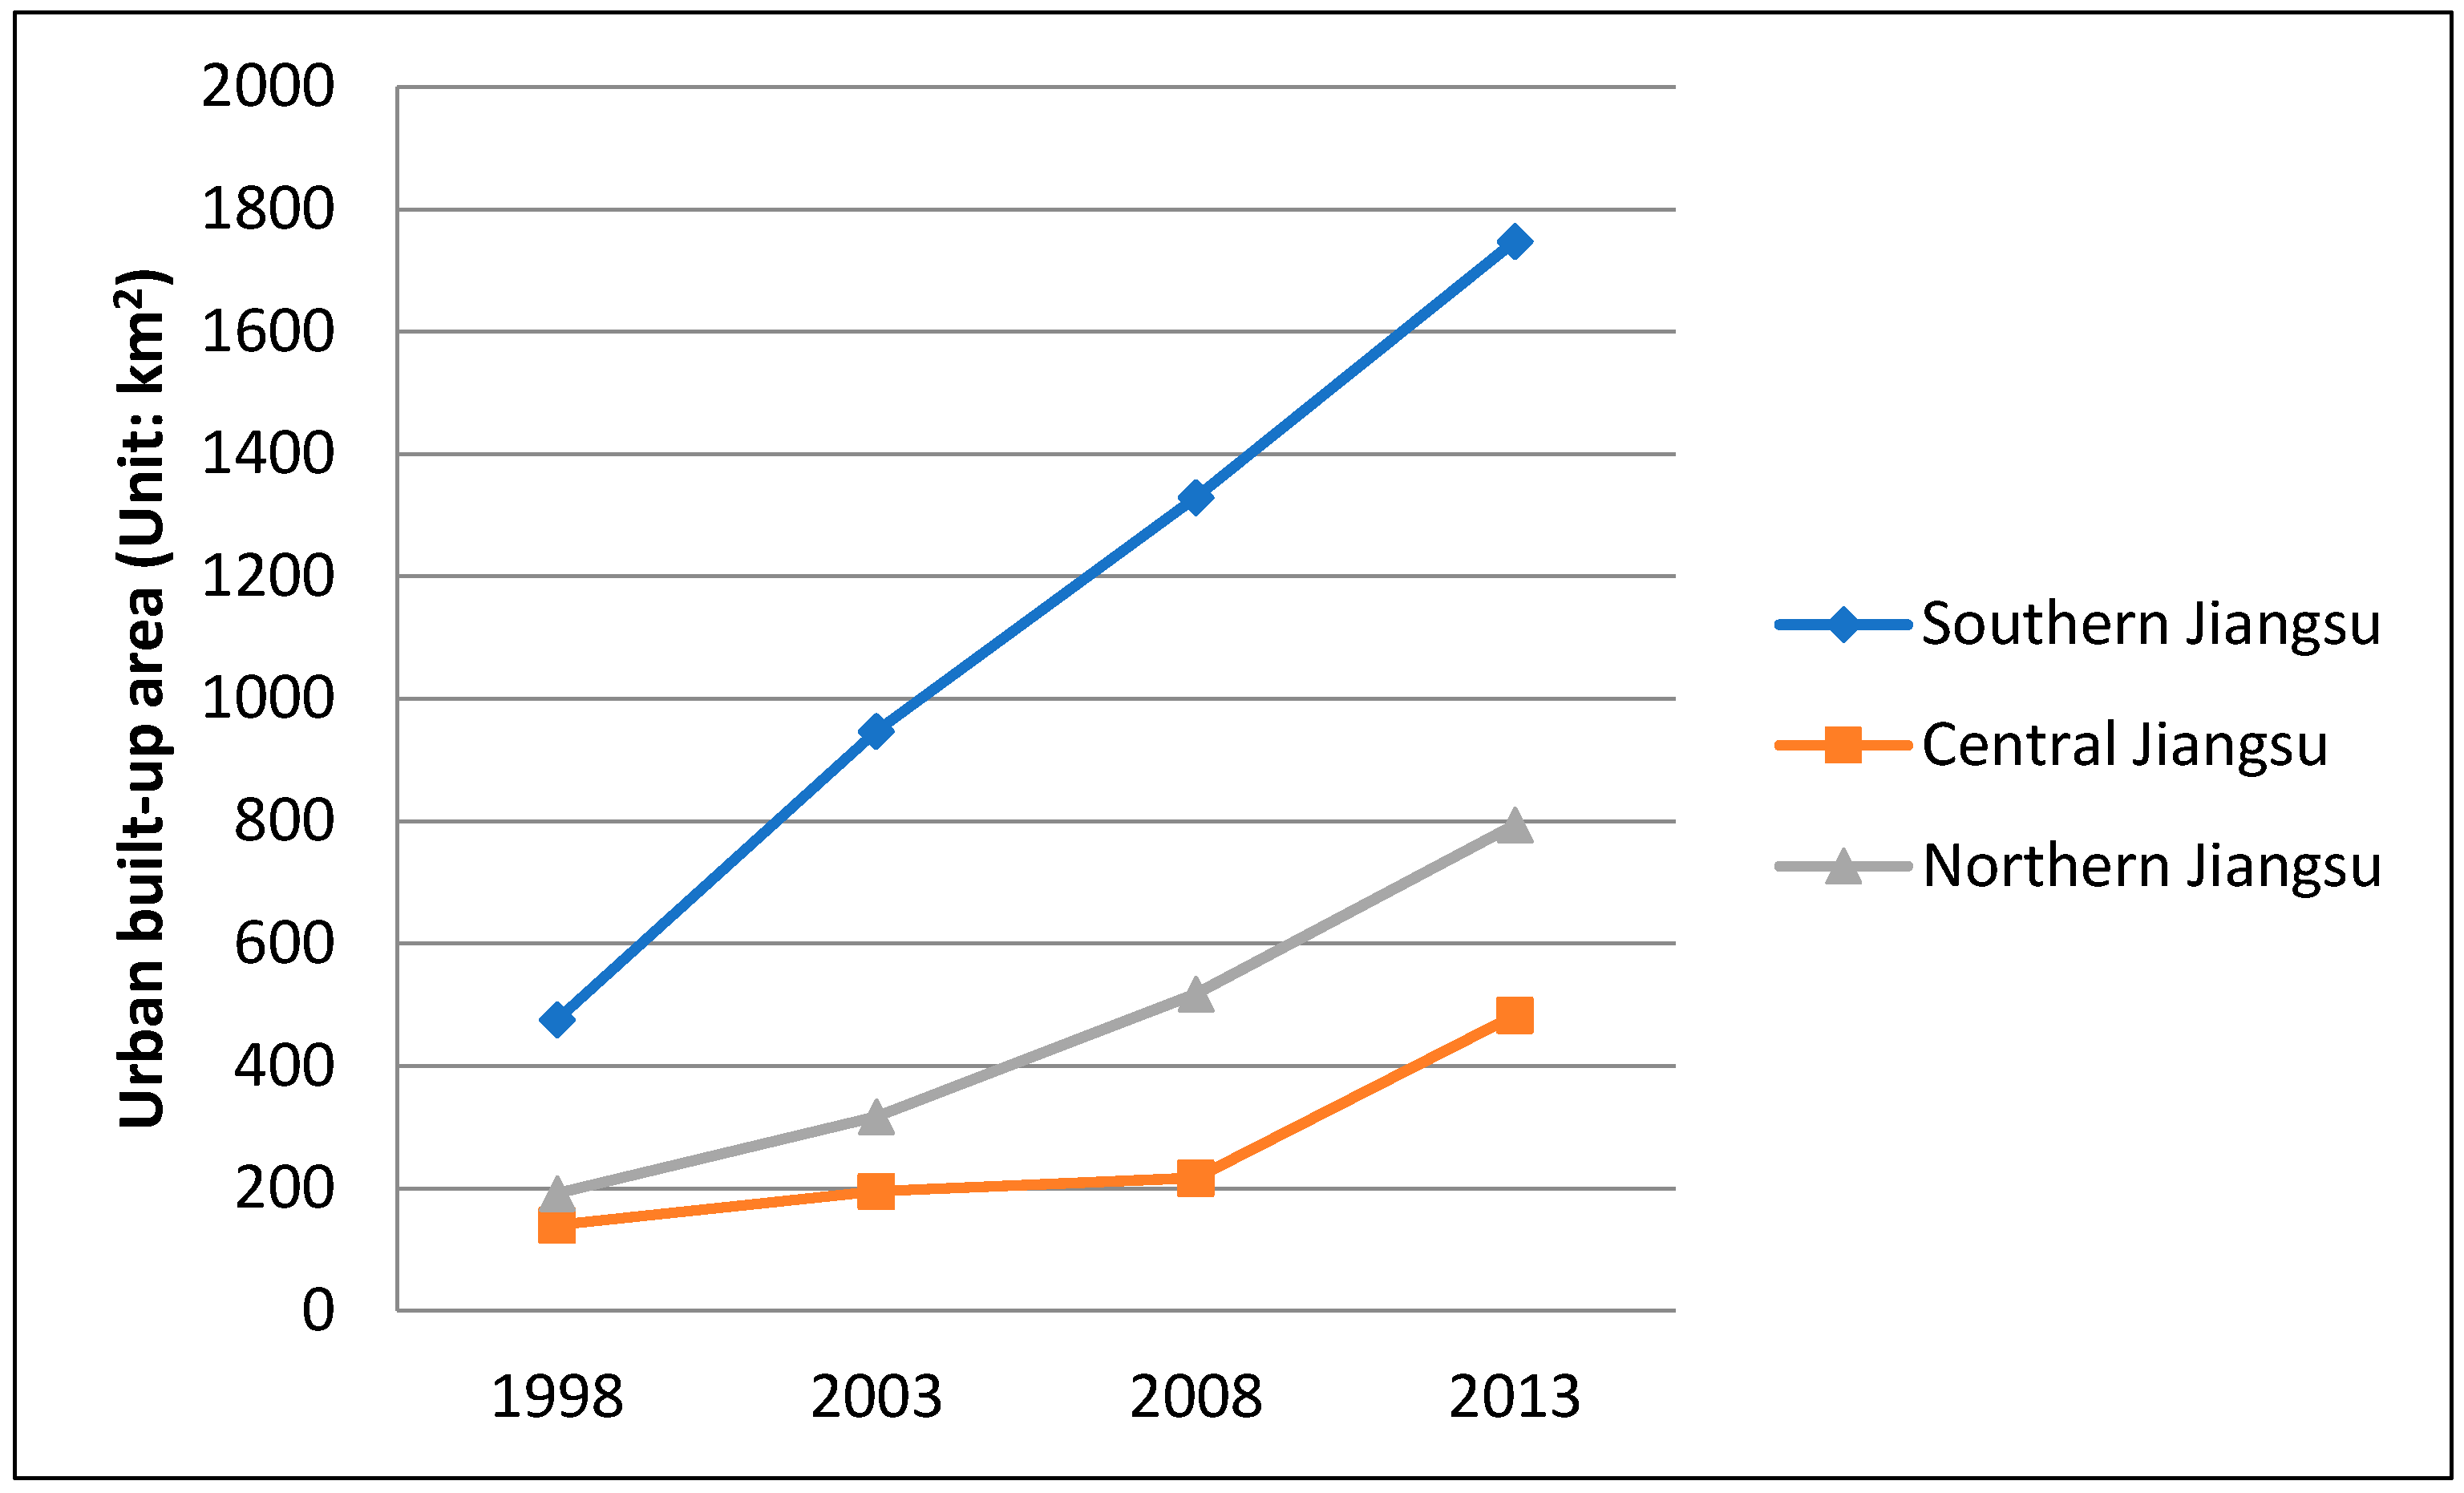
Traditionally, Jiangsu province is divided into three regions: southern Jiangsu (including Nanjing, Zhenjiang, Suzhou, Wuxi, and Changzhou), central Jiangsu (including Yangzhou, Taizhou, and Nantong), and northern Jiangsu (including Xuzhou, Lianyungang, Yancheng, Huai’an and Suqian). The urban built-up area growth situation in the three regions is shown in Figure 3. Looking at the increase of the urban built-up area of the three regions in Jiangsu province from 1998 to 2013, the increase trend of all regions is significant. Overall, the urban built-up area of southern Jiangsu covered 476 km2 in 1998, and increased to 1748 km2, a rate of 367%. The size of the urban built-up area in central Jiangsu increased from 140 km2 in 1998 to 483 km2 in 2013, or 345%. Northern Jiangsu increased from 192 km2 in 1998 to 794 km2 in 2013, or 414%. The authors can conclude that the main change in the urban built-up area is an overall increasing trend, but there is a gap between the three regions in Jiangsu. The initial area of urban built-up area in 1998 in southern Jiangsu is much larger than the central and northern Jiangsu, and has a higher development speed for the 15 years study period.
3.2. Spatio-Temporal Patterns of Urban Growth of Jiangsu Province
To further analyze the spatial distribution of the built-up area, the authors used the method described in Section 2.3.1 to compare the area extracted by nighttime light data with each threshold and the urban built-up area reported by the government Statistical Yearbook, choosing the threshold for each research year which had the least deviation to extract the urban built-up area (see Table 1). The selected thresholds to extract the urban built-up area in 1998, 2003, 2008, and 2013 were 53, 54, 59, and 62, accordingly. The deviation between the built-up areas recorded in the Jiangsu Yearbook and extracted by the lighted area of the four research years were all lower than 5%. To qualify the suitability of the extracted lighted area, the authors calculated Kappa values based on the extracted built-up area by nighttime light data and the built-up area recorded in land use and cover change data in year 2003 and 2018. The kappa values are 0.603 and 0.624 respectively, which means that the lighted area with proper DN values have a level of high correlation with that in land use maps.
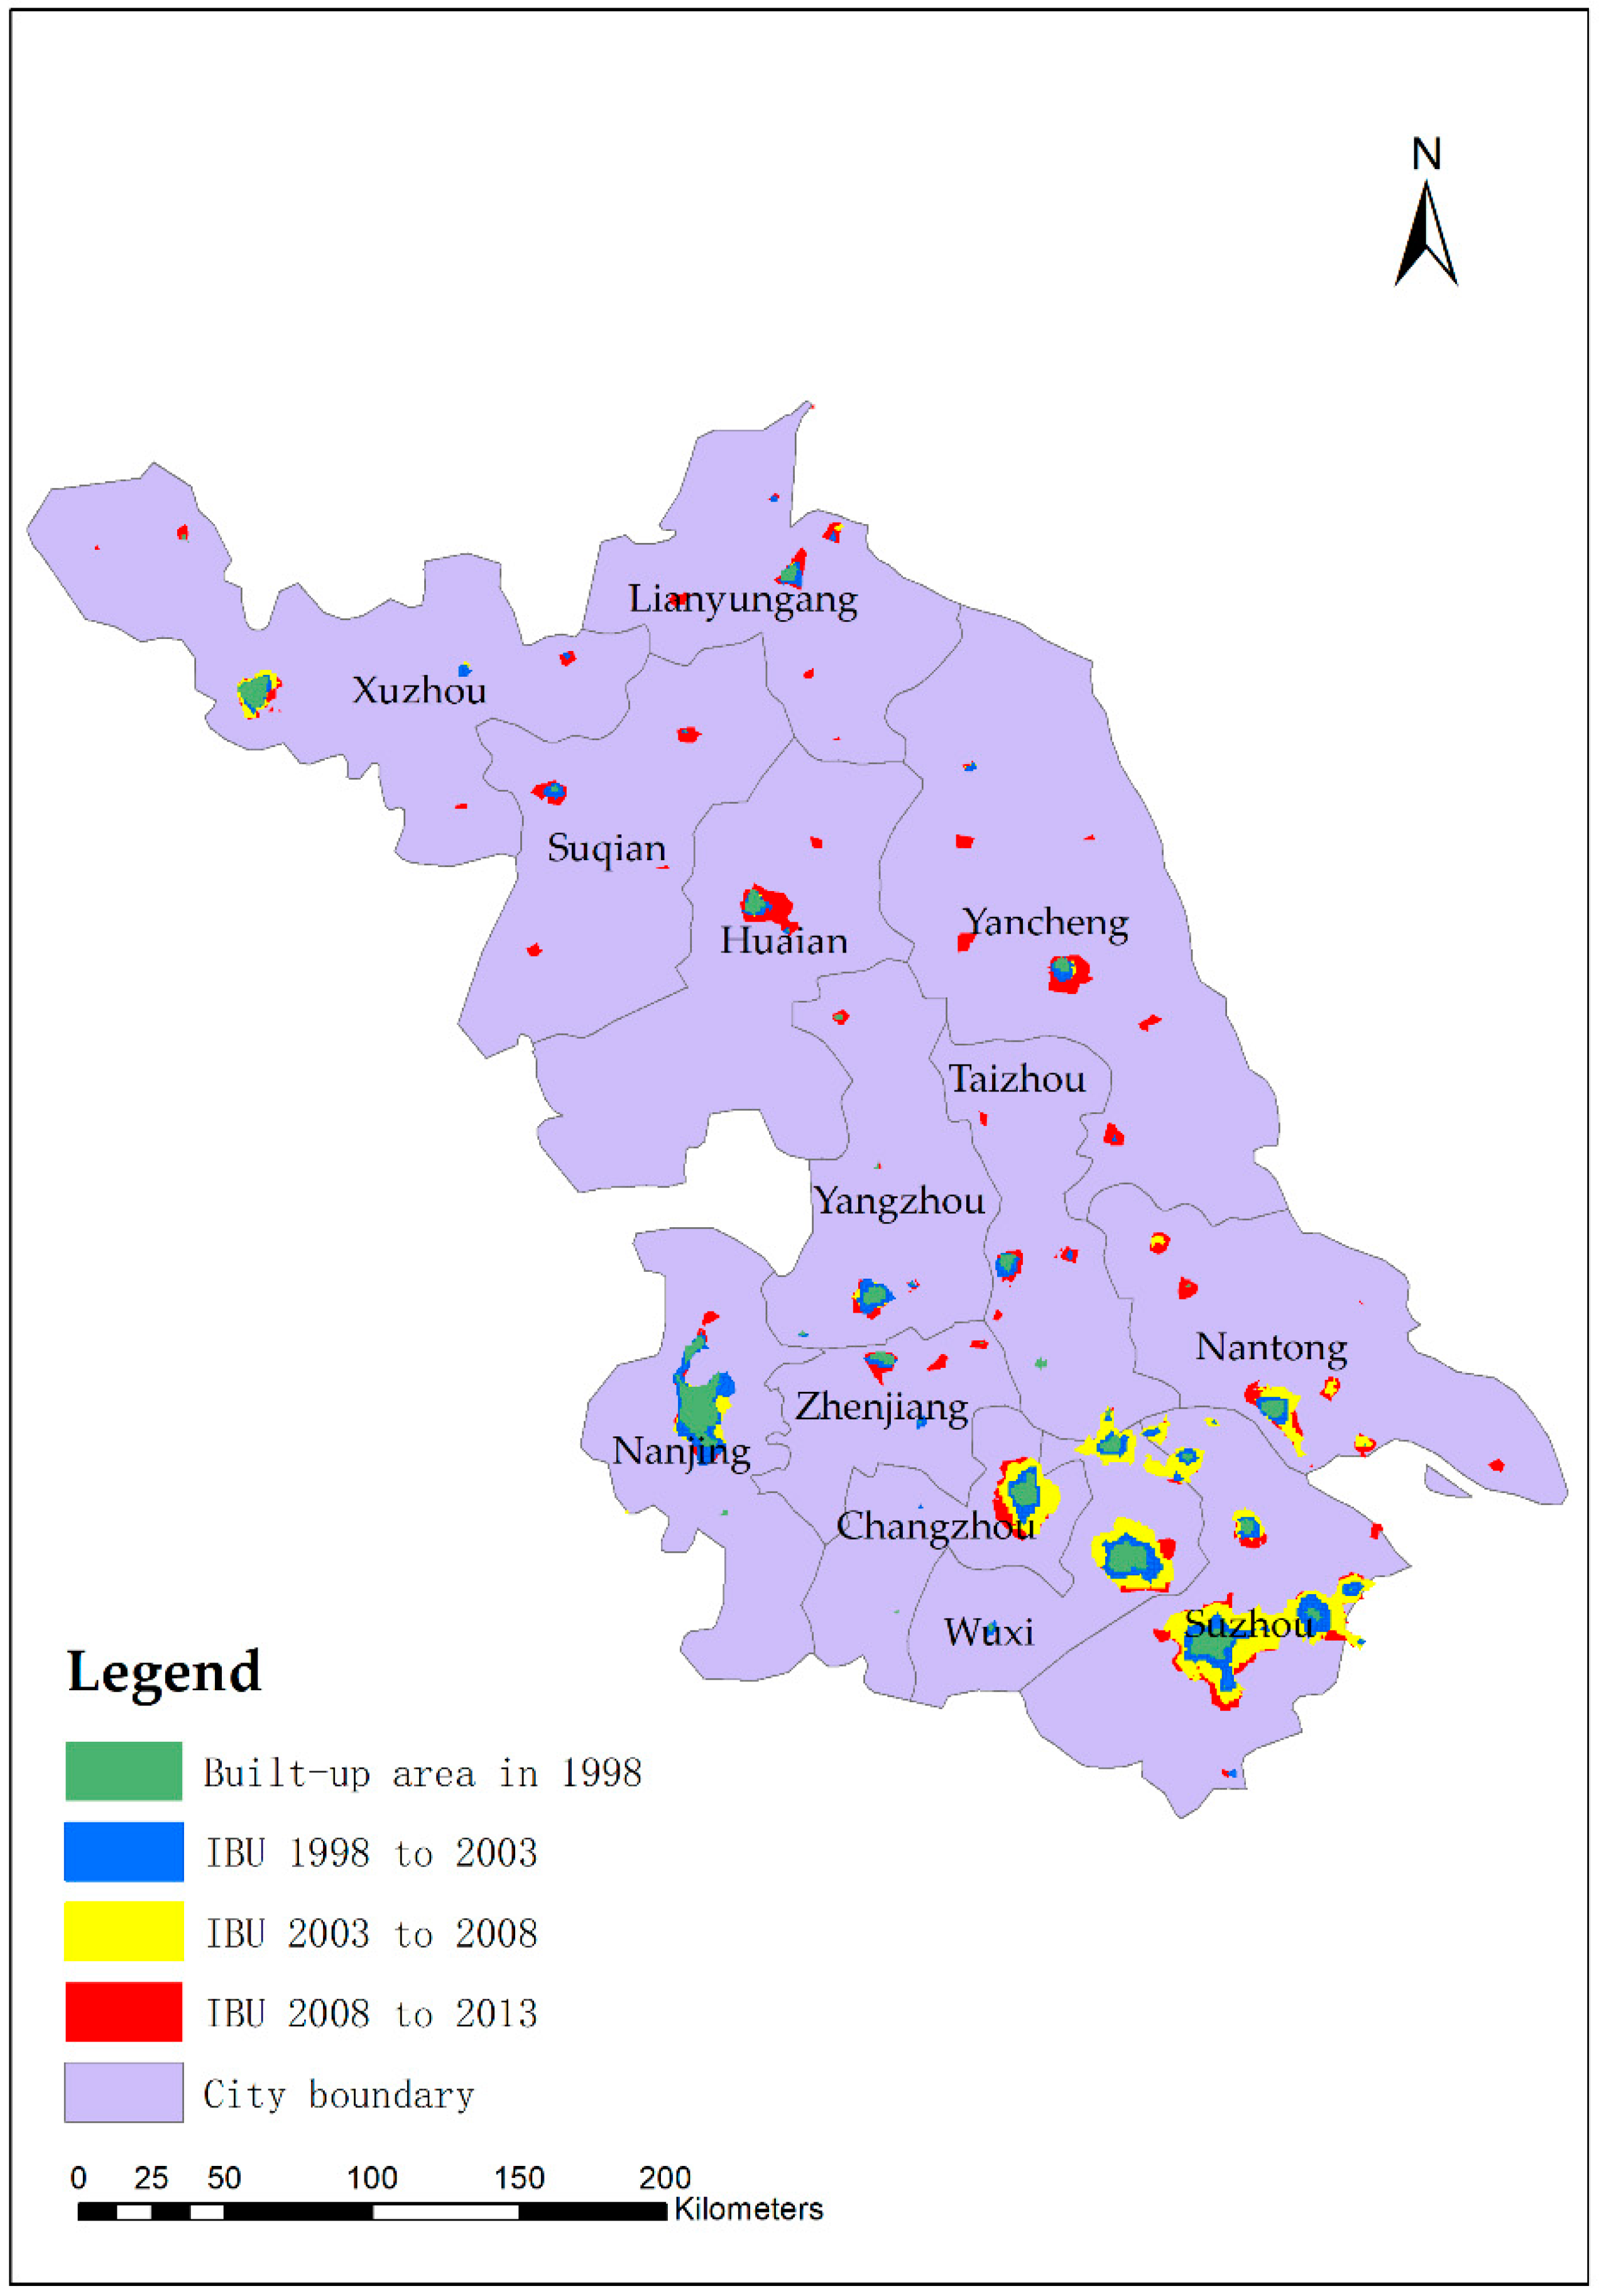
Based on the threshold calculated above, the authors generated the urban sprawl map (see Figure 4) for the four study periods. It is clear to see that the urban built-up area increased greatly over the fifteen-year period. The spatial and temporal patterns of the urban built-up area growth regarding those fifteen years for Jiangsu province were analyzed by spatial superposition of the extraction of nighttime light data using the Arc/Info Grid module (ESRI, CA, USA).
The urban built-up area in 1998 was distributed mainly in the southern Jiangsu area. Moreover, there were pronounced aggregation regions in Nanjing, Wuxi, Suzhou, and Changzhou of southern Jiangsu, Nantong of central Jiangsu, and Xuzhou of northern Jiangsu. The increase of the urban built-up area from 1998 to 2013 was mainly distributed in southern Jiangsu, shown as the blue-colored region in Figure 4, but the expansion region was small. The increased amount from 2003 to 2008 was much larger than during the former period. Continuous development can be seen in southern Jiangsu’s expansion of its urban built-up area. However, in central and northern Jiangsu, the development of the urban built-up area was far less prevalent; only Yangzhou, Xuzhou, and Yancheng had relatively obvious expansion. The urban built-up area expansion from 2008 to 2013 was more pronounced than before, and the development trend changed greatly. Southern Jiangsu expanded continuously but the expansion rate was slower than the prior research period. Numerous small clusters sprung up in central and northern Jiangsu, which was distributed in the rural area. The rural area developed rapidly and formed obvious built-up area clusters during this period. The change of urban built-up area was active as a whole during the 15 year period, accompanying the rapid development of the economy and high investment into urban infrastructure construction.
3.3. Urbanization Indices of Jiangsu Province
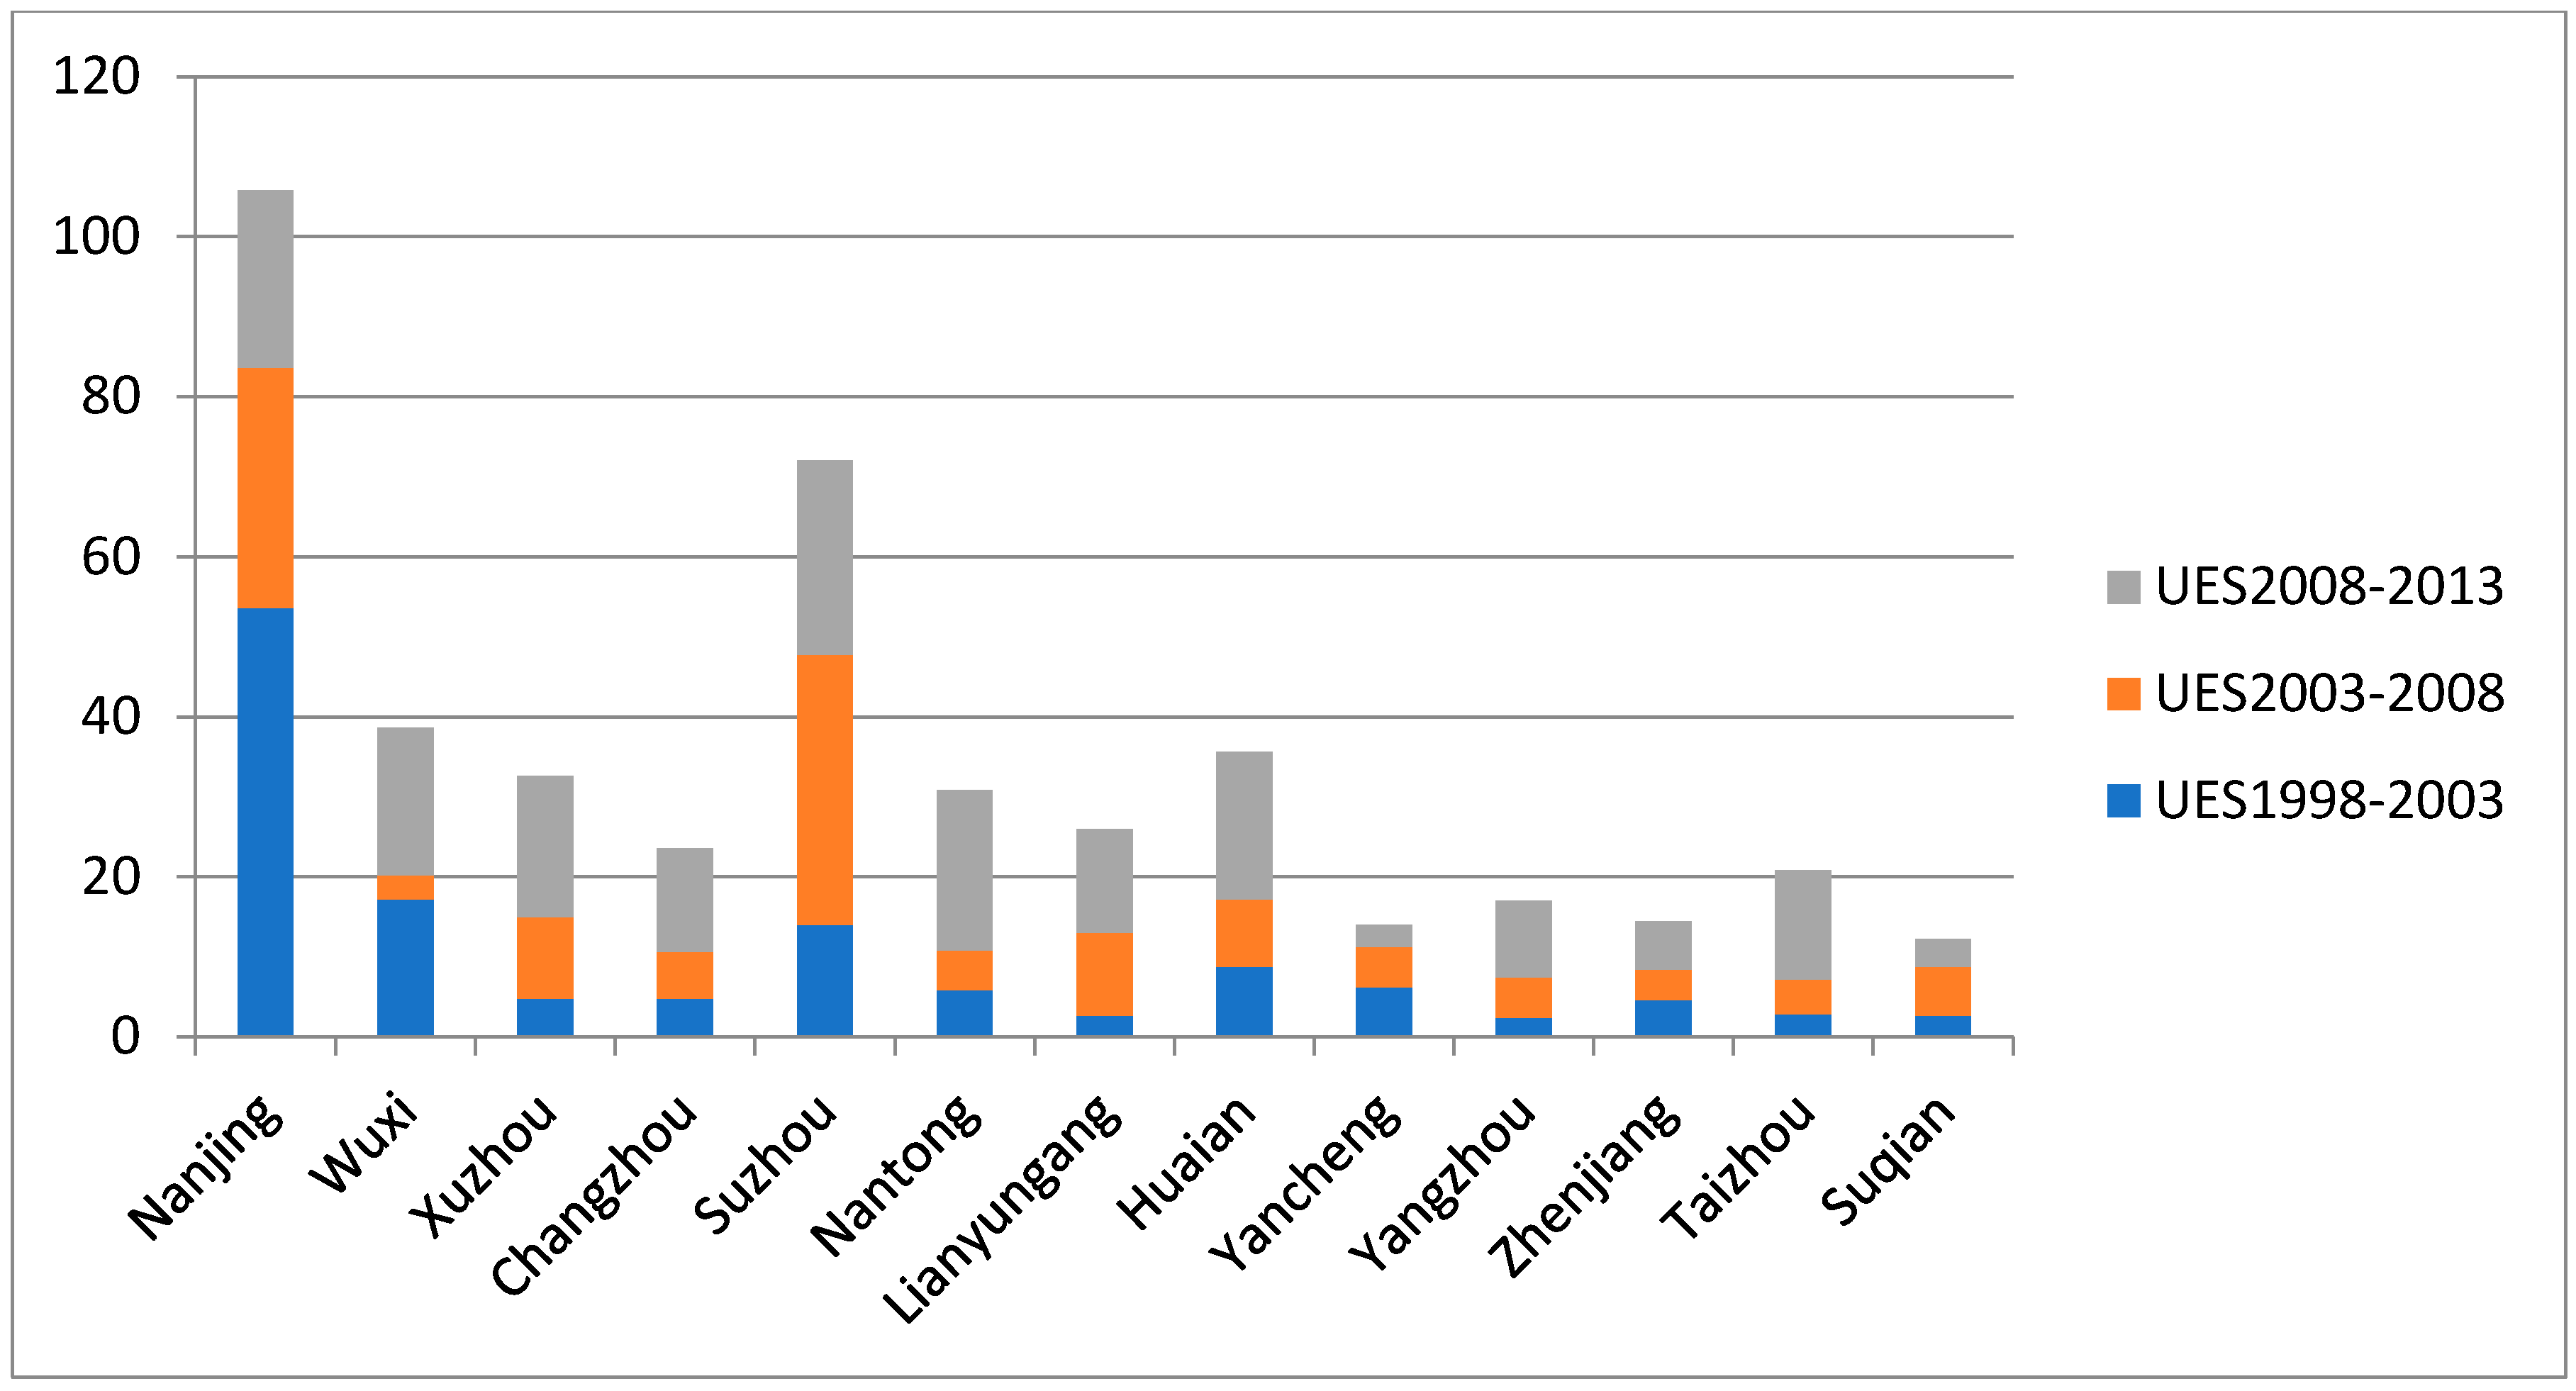
The urban expansion speed index and urbanization intensity index are used to study the change situation of urban built-up areas in a certain region. Based on the area expansion situation, the urban expansion speed model and the urbanization intensity model described in Section 2, the authors calculated Jiangsu’s indices from 1998 to 2013 (see Table 2 and Figure 5).
The urban expansion speed of Nanjing ranked first from 1998 to 2003, at 53.6 km2 per year. Next was Wuxi at 17.2 km2 per year. Among the rest, the speed of Suzhou was obvious at 14 km2 per year. The top ranked cities were all distributed in southern Jiangsu, and the urban expansion speed of southern Jiangsu (94.2 km2 per year) was 8.56 times that of central Jiangsu (11 km2 per year) and 3.77 times that of northern Jiangsu (25 km2 per year). The urbanization intensity index of Nanjing was also ranked first at 149.72%, followed by Huaian with a value of 125.71%, and Yancheng with a value of 124%, although they had a relatively low urban expansion speeds since their basic areas were smaller than cities in southern Jiangsu. Looking at 2003 to 2008, the UES2003–2008 of Suzhou ranked first at 33.8 km2 per year, Nanjing ranked second at 30 km2 per year; among the rest, the values for Lianyungang (10.4 km2 per year), Xuzhou (10.2 km2 per year), and Huaian (8.4 km2 per year) were obvious, each of which is located in northern Jiangsu. During this period, the urban built-up area expansion speed in southern Jiangsu was decreasing, while that in northern Jiangsu was increasing by 1.6 times. The urbanization intensity index during these five years changed greatly compared to that of the former period. The UII2003–2008 of Suzhou ranked first at 113.42%; next was Suqian at 103.33% in northern Jiangsu, the less developed region. Moreover, the UII2003–2008 of northern Jiangsu became larger than that of southern Jiangsu.
The UES2008–2013 of the major southern cities decreased slightly, such as for Suzhou at 24.2 km2 per year and Nanjing at 22.22 km2 per year, but they still ranked at the top. The UES2008–2013 among the rest was Nantong (20 km2 per year), Wuxi (18.4 km2 per year), and Huaian (18.4 km2 per year), all of which were obvious. The UII2008–2013 trend changed significantly with Taizhou (97.14%), Nantong (87.72%), and Huaian (76.03%) ranked at the top while located in central and northern Jiangsu. The UII2008–2013 of developed cities in southern Jiangsu decreased dramatically, such as for Nanjing (18.59%) and Suzhou (38.05%). The overall urban expansion speed in Jiangsu was increasing continuously during the study period from 1998 to 2013. The urban expansion speed from 2008 to 2013 was 1.4 times that of the period from 2003 to 2008, while the UES2003–2008 was nearly equal to the UES1998–2003, which reveals that Jiangsu province has been experiencing an accelerating developmental period since 2008.
3.4. Urbanization Gravity Center Change of Jiangsu Province
Based on the urban built-up area maps and the gravity center model, the gravity centers of Jiangsu’s urban built-up area in 1998, 2003, 2008 and 2013 were calculated. The gravity centers of the four research periods were mainly distributed in the southern Jiangsu area (see Figure 6a). Thus, the authors expanded the scale of the southern Jiangsu region, shown as Figure 6b, to map the trends of the gravity center development more clearly.
Taking the perspective of spatial distribution, the gravity centers of the four research times were all in southern Jiangsu and to the south of the geometrical center of Jiangsu province. The gravity center of the urban built-up area from 1998 to 2003 moved to the southeast by 28,883 m. The gravity center from 2003 to 2008 continued to move southeast by a longer distance, 69,257 m. During this 10-year period, Jiangsu province strove to develop the southern region, causing the urban built-up area to expand greatly; thus, the gravity center moved to the southeast. The gravity center from 2008 to 2013 changed direction to the northwest at a distance of 51,882 m. During this five-year period, the southern Jiangsu region continued to develop rapidly in step with the core cities of Yangtze River Delta region. Recently, the expansion of the Yangtze River Delta city algorithm accelerated the economic development of the northern Jiangsu region, thus promoting the expansion of urban built-up areas. Therefore, the gravity center moved to northwest. The regional economic development promoted the urban expansion, while the urban built-up area expansion accelerated economic development, providing a solid foundation for trade economy development.
4. Discussion
The results described above provide a detailed analysis of the spatial and temporal characteristics of the changes of the urban built-up area in Jiangsu province during the rapid social economic development period from 1998 to 2013. Generally, the growth of the urban built-up area was probably caused by social and governmental policy factors [45,46]. During this rapid economic development period, there was an obvious trend of population migration from rural areas to the urban regions; this is considered one of the major driving forces. Thus, the authors consider population growth, regional social economic growth, and urban construction as the most important causes leading to the expansion of the urban built-up area within a limited time scale of 15 years, which will be discussed in detail below.
4.1. Rapid Population Growth
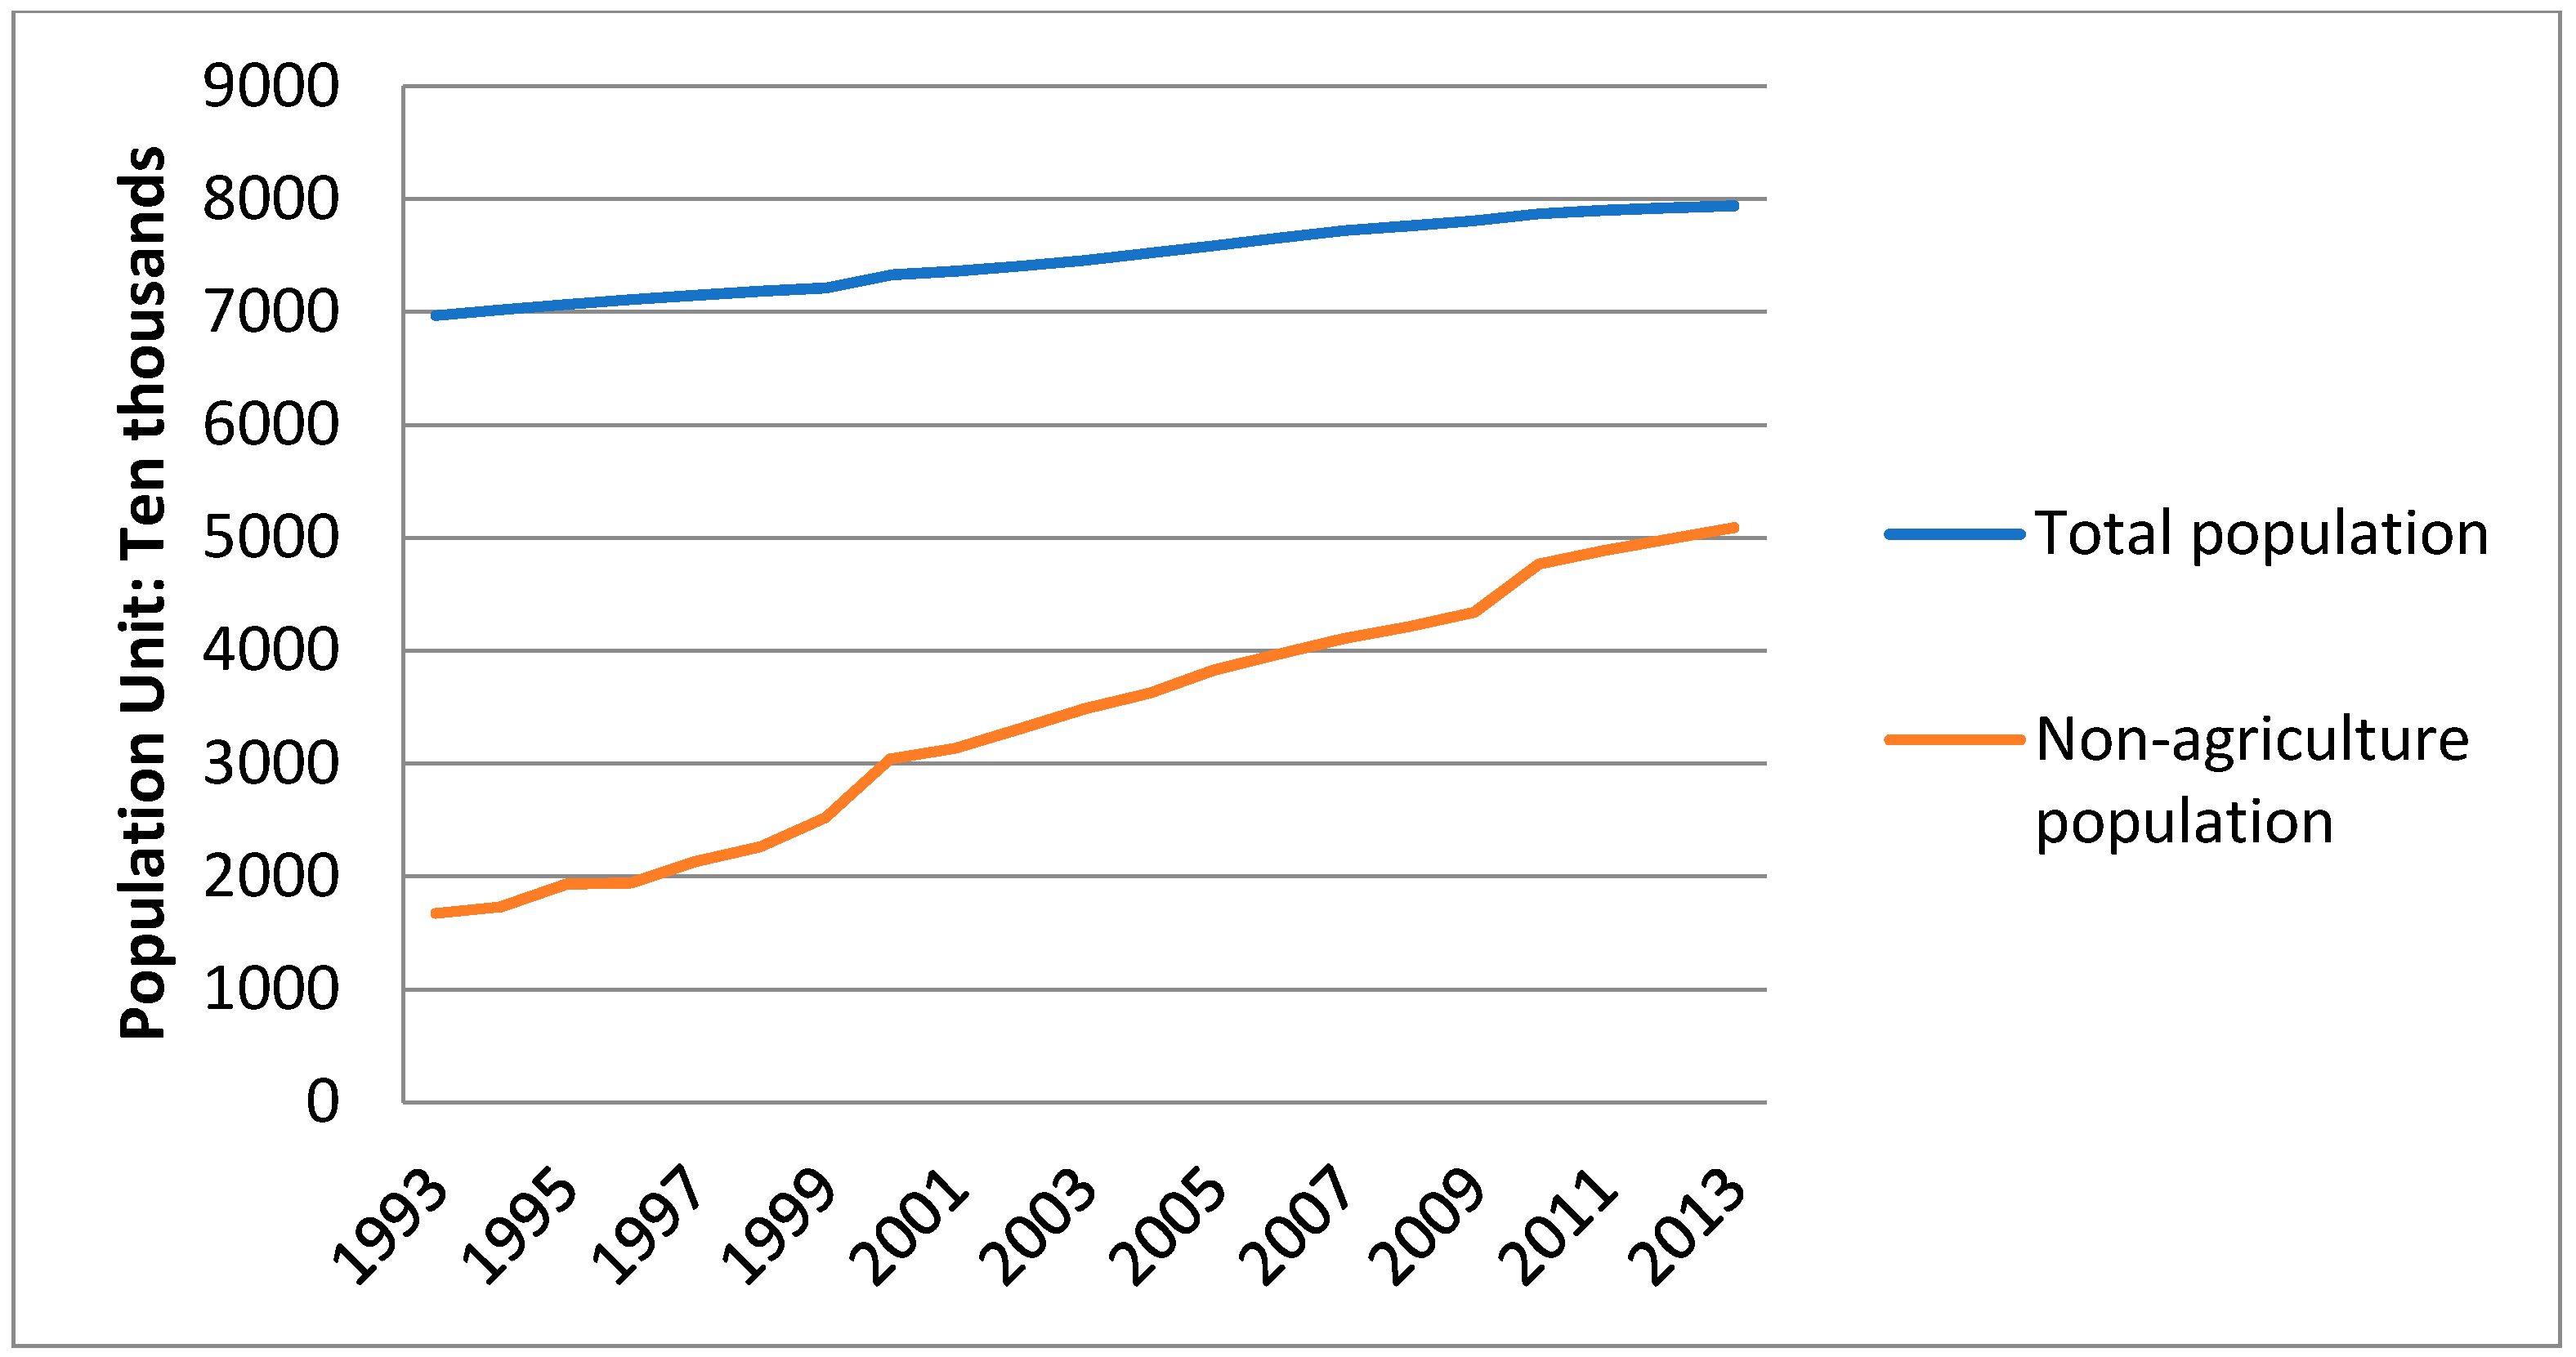
Human activity largely affects the urban land-use situation and mainly consists of population increase, population migration, and economic development [47]. The eastern coastal developed regions, like Jiangsu province, were facing huge population pressure, reflected by population growth and the ratio of urban and rural population. Using data obtained from the Jiangsu Bureau of Statistics of China and the Jiangsu Yearbook 2016 [36], the total population of Jiangsu province, percentage of population increase, non-agricultural population, and the percentage of non-agricultural population are shown in Figure 7 and Table A1. This dataset reflects the situation of the population development of Jiangsu, which is far above the national average and shows a trend of continued growth. Since the total land area of Jiangsu region is established, the continuously-increasing population might lead to environmental deterioration, traffic congestion, limited living spaces, food security problems, and more.
The continuous rise in people’s living standards is an important driving force in land-use changes. The rapid development of the urban built-up area in a developed region will lead to a rapid rise in land prices, environmental pollution, and rising basic living costs. Thus, people must move outside the region to a suburban area, which leads to built-up area expansion in those outer areas. According to the Jiangsu Yearbook [36], Jiangsu province’s per capita housing area was 11.74 m2 per person in 1998, which expanded to 36.8 m2 per person in 2013, an increase of 313.46%. During the urban population growth and people’s per capita housing area expansion, the urban area will need to extend the urban built-up area and occupy other types of land-use such as arable land, green land, and unused areas.
4.2. Regional Social Economic Development
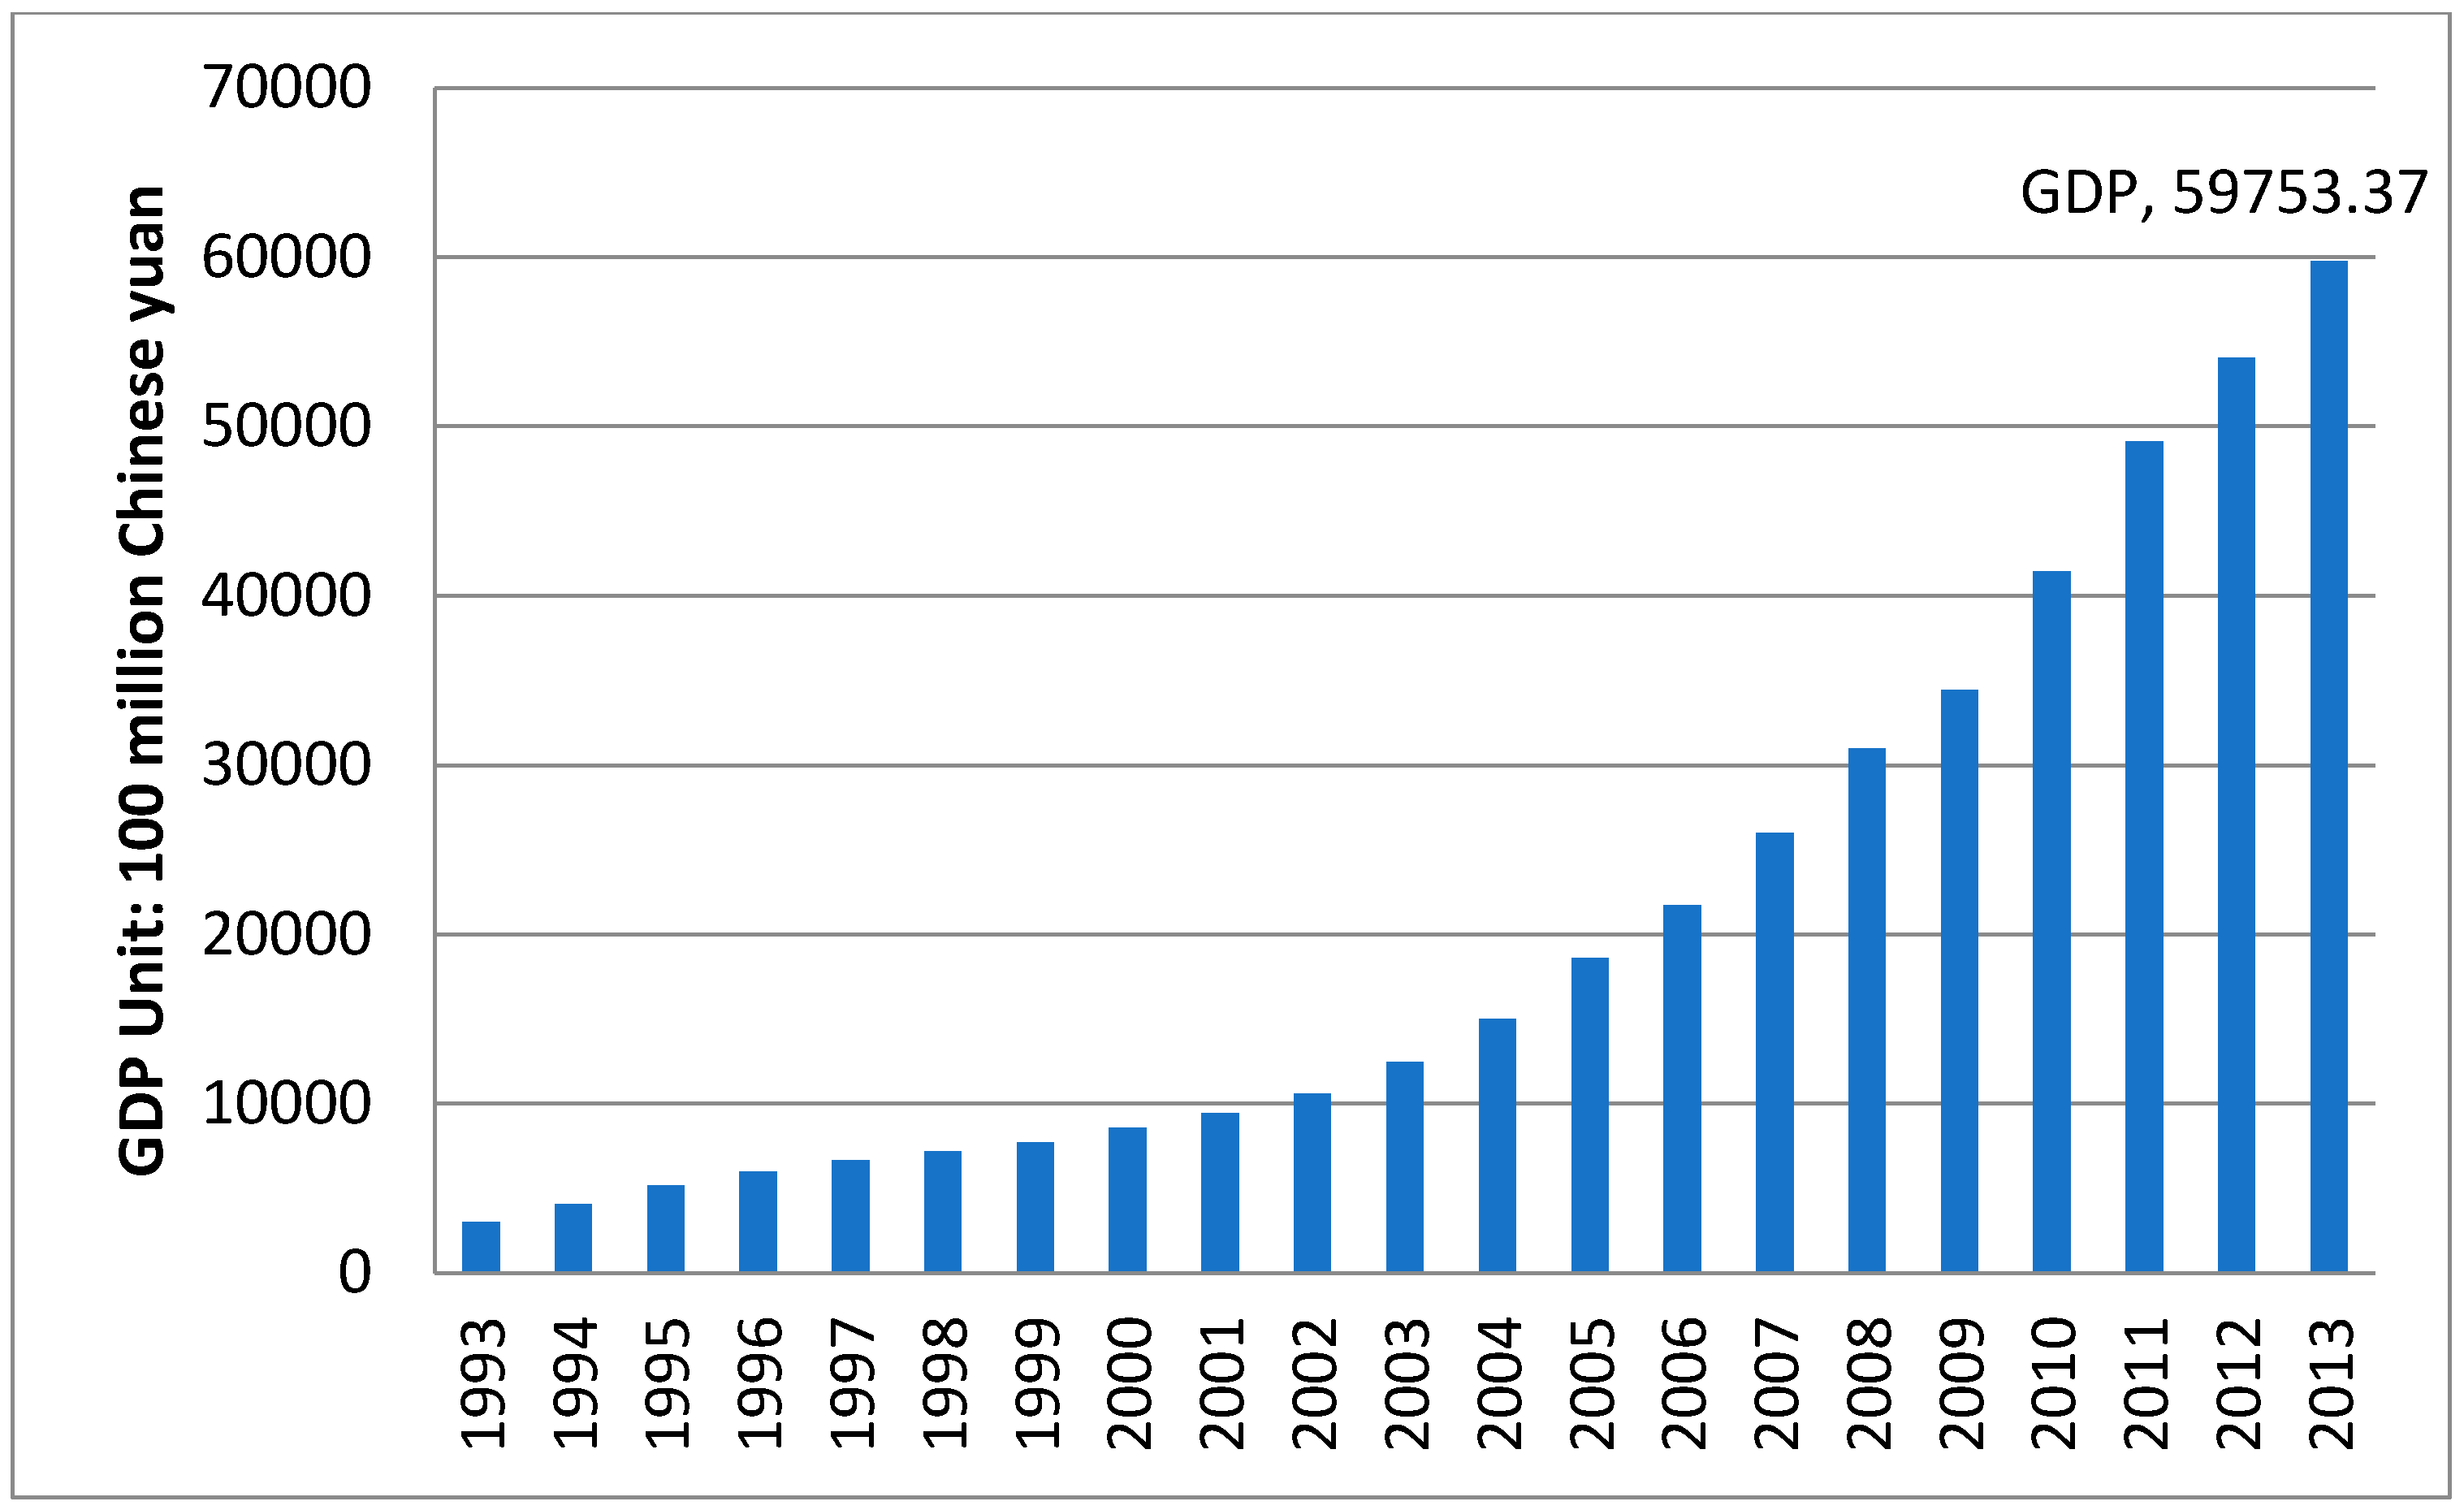
Regional social and economic development is one of the major driving forces of the expansion of urban built-up areas during the process of urbanization. Jiangsu’s economy followed an accelerating growth trend from 1993 to 2013. The total GDP in 1993 was 299.82 billion, then increased to 1244.29 billion by 2003, and continued to increase to 5975.34 billion by 2013. Within the 20-year research period, the total GDP of Jiangsu province grew nonlinearly and suggests a faster speed in the future (see Figure 8), since it grew by a factor of 19.93 from 1993 to 2013. Similarly, the per capita GDP also grew rapidly at the same time. The per capita GDP was 4321 Chinese yuan per person, increasing to 16,743 Chinese yuan per person, and increasing again to 74,607 Chinese yuan per person, showing a total increase of 17.27 times [36].
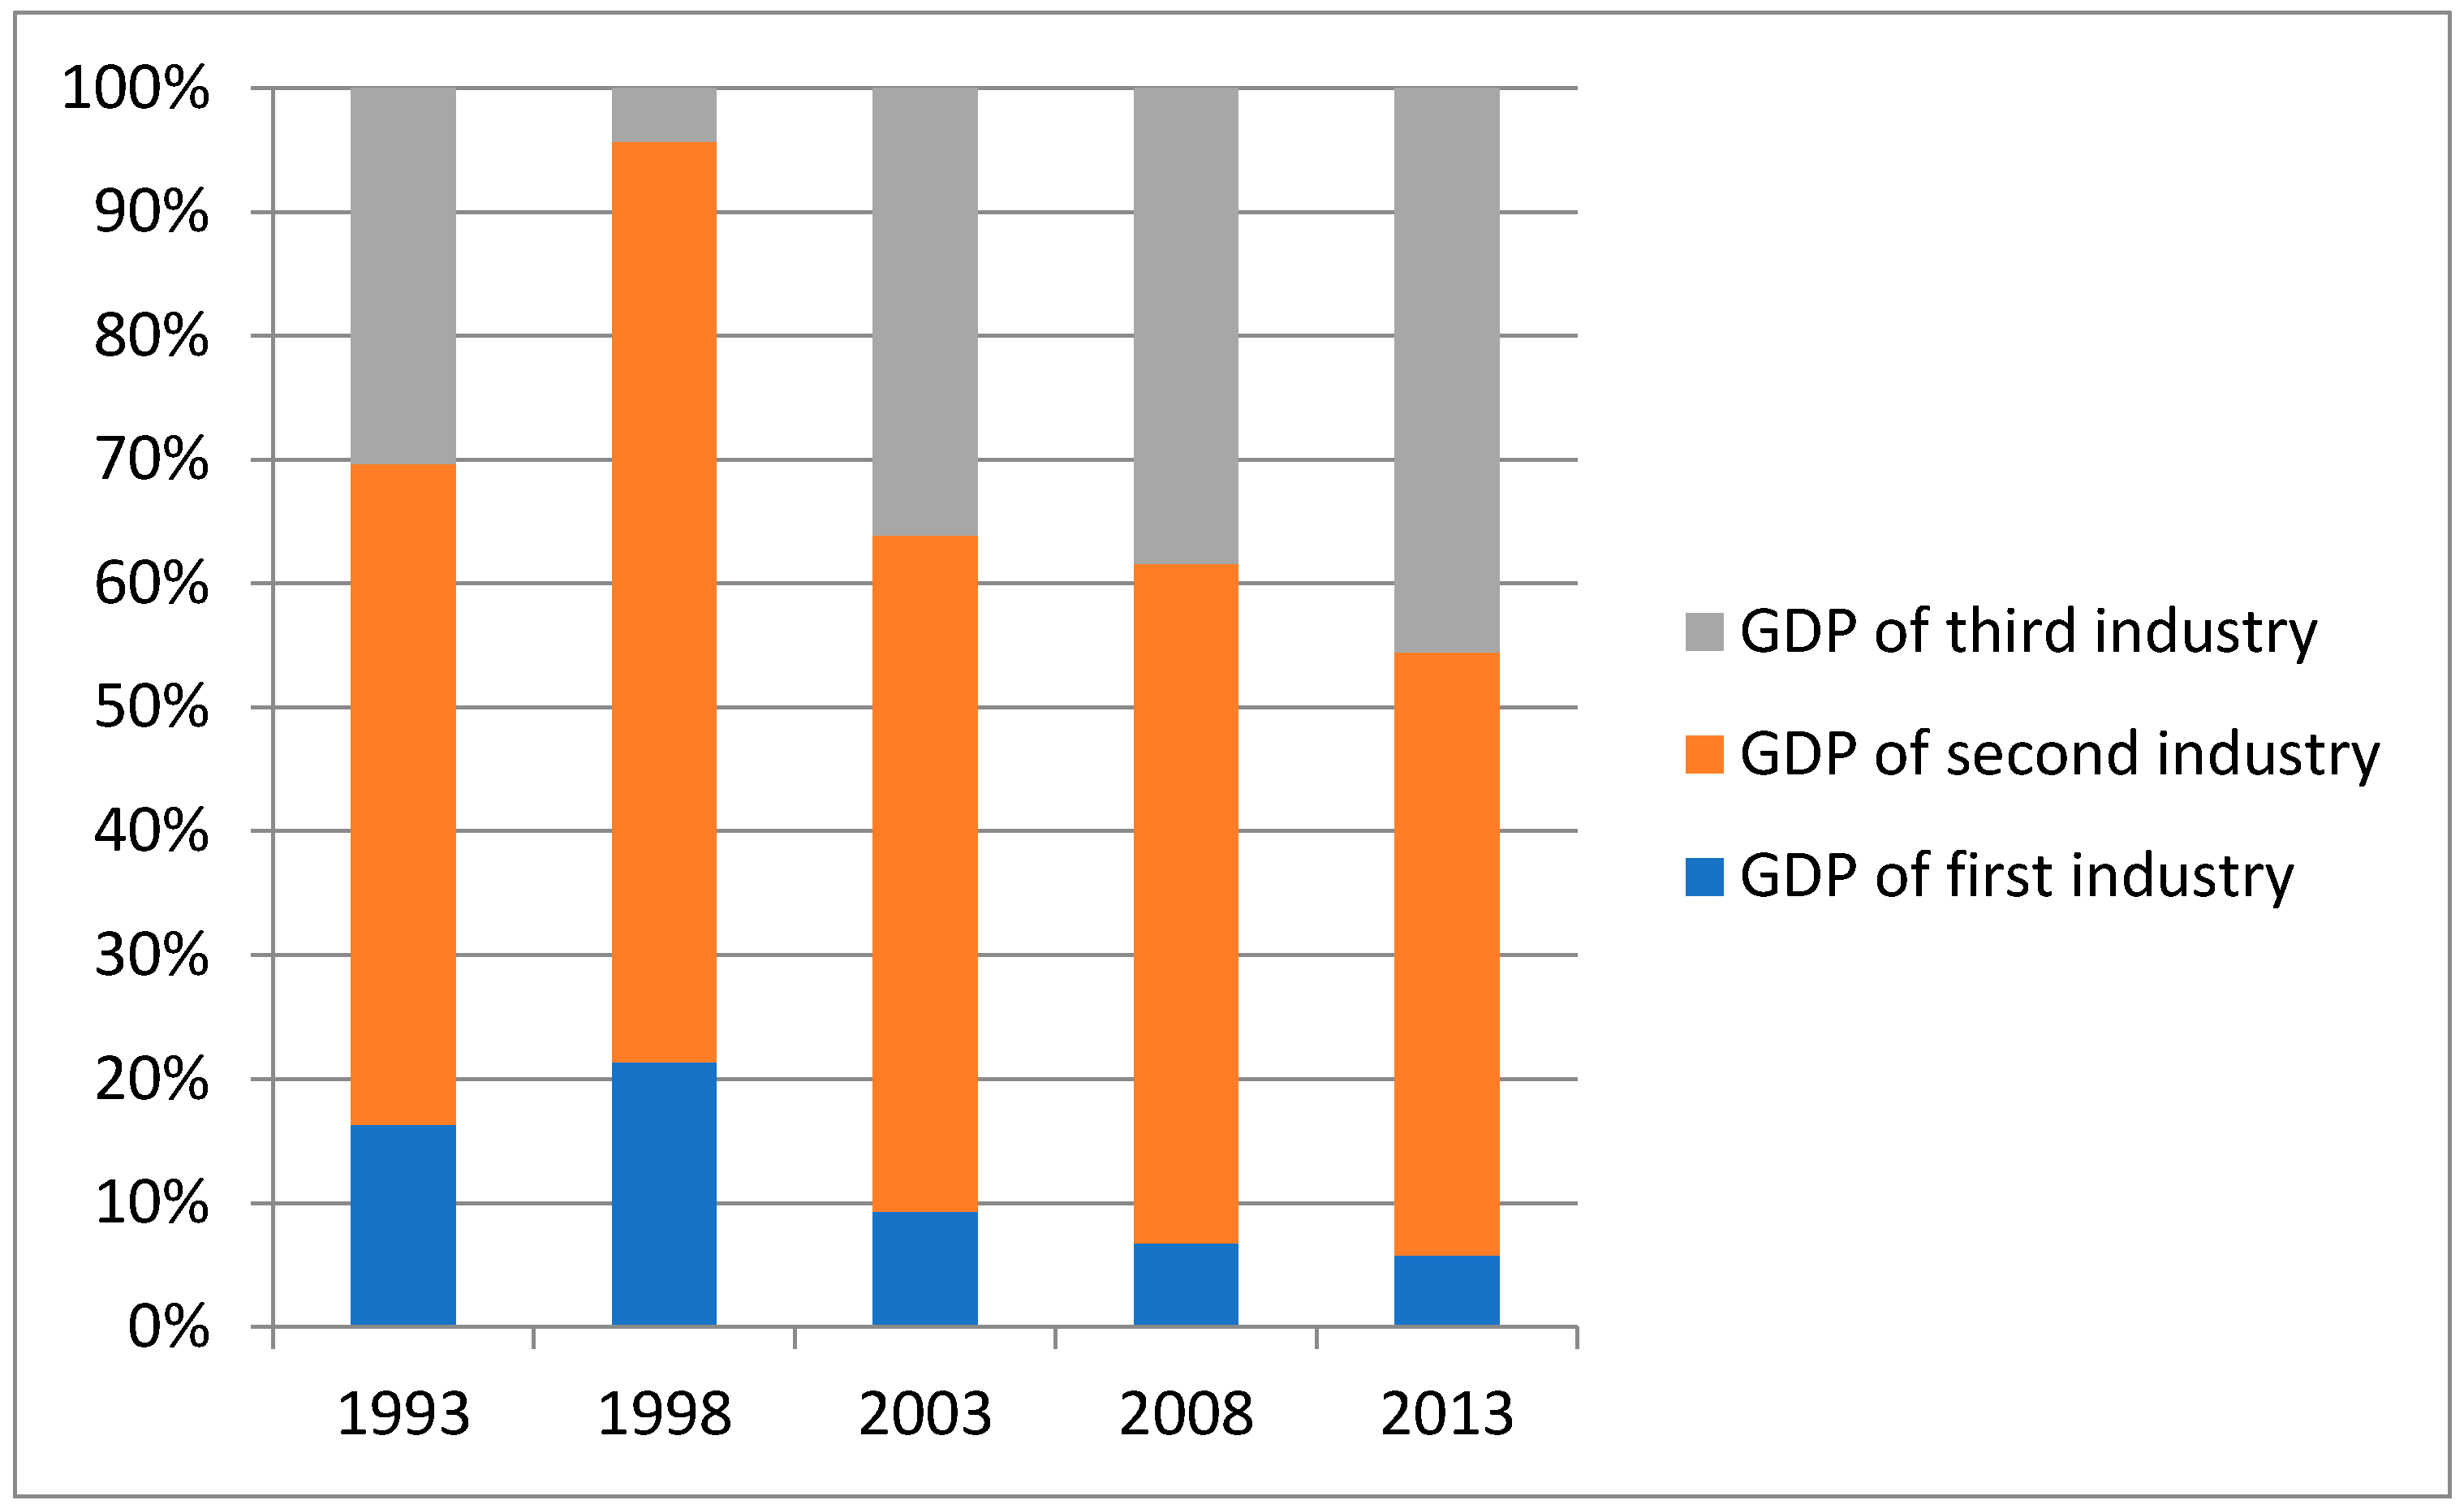
The industrial structure reflects the growth period of the national economic development period, which keeps optimizing and transforming with the rapid development of the economy [48,49]. The proportion of each industry’s GDP from 1993 to 2013 is shown in Figure 9. The proportion of agriculture and industry both increased from 1993 to 1998, while in 1993, the proportions of agriculture, industry, and services were 16.36%, 53.3%, and 30.34% respectively. This changed in 2003 to 14.54%, 50.56%, and 2.95%, respectively. Following 2003, the proportion of agriculture decreased rapidly and that of industry decreased slightly, while the proportion for service increased greatly., The proportion of agriculture, industry, and services in 2003 were 9.34%, 54.55% and 36.11%, respectively, while by 2008 this had changed to 6.78%, 54.85%, and 38.37%, respectively. These evolved into 5.81%, 48.68%, and 45.52%, respectively by 2013. The industrial structure of Jiangsu province considers industry and services to be the main industry type and agriculture as subsidiary business. Accompanying this economic development trend comes the transition of rural and natural areas to urban areas, an urbanization of population, and urban scale expansion. Thus, the urban built-up area has been increasing at a high speed.
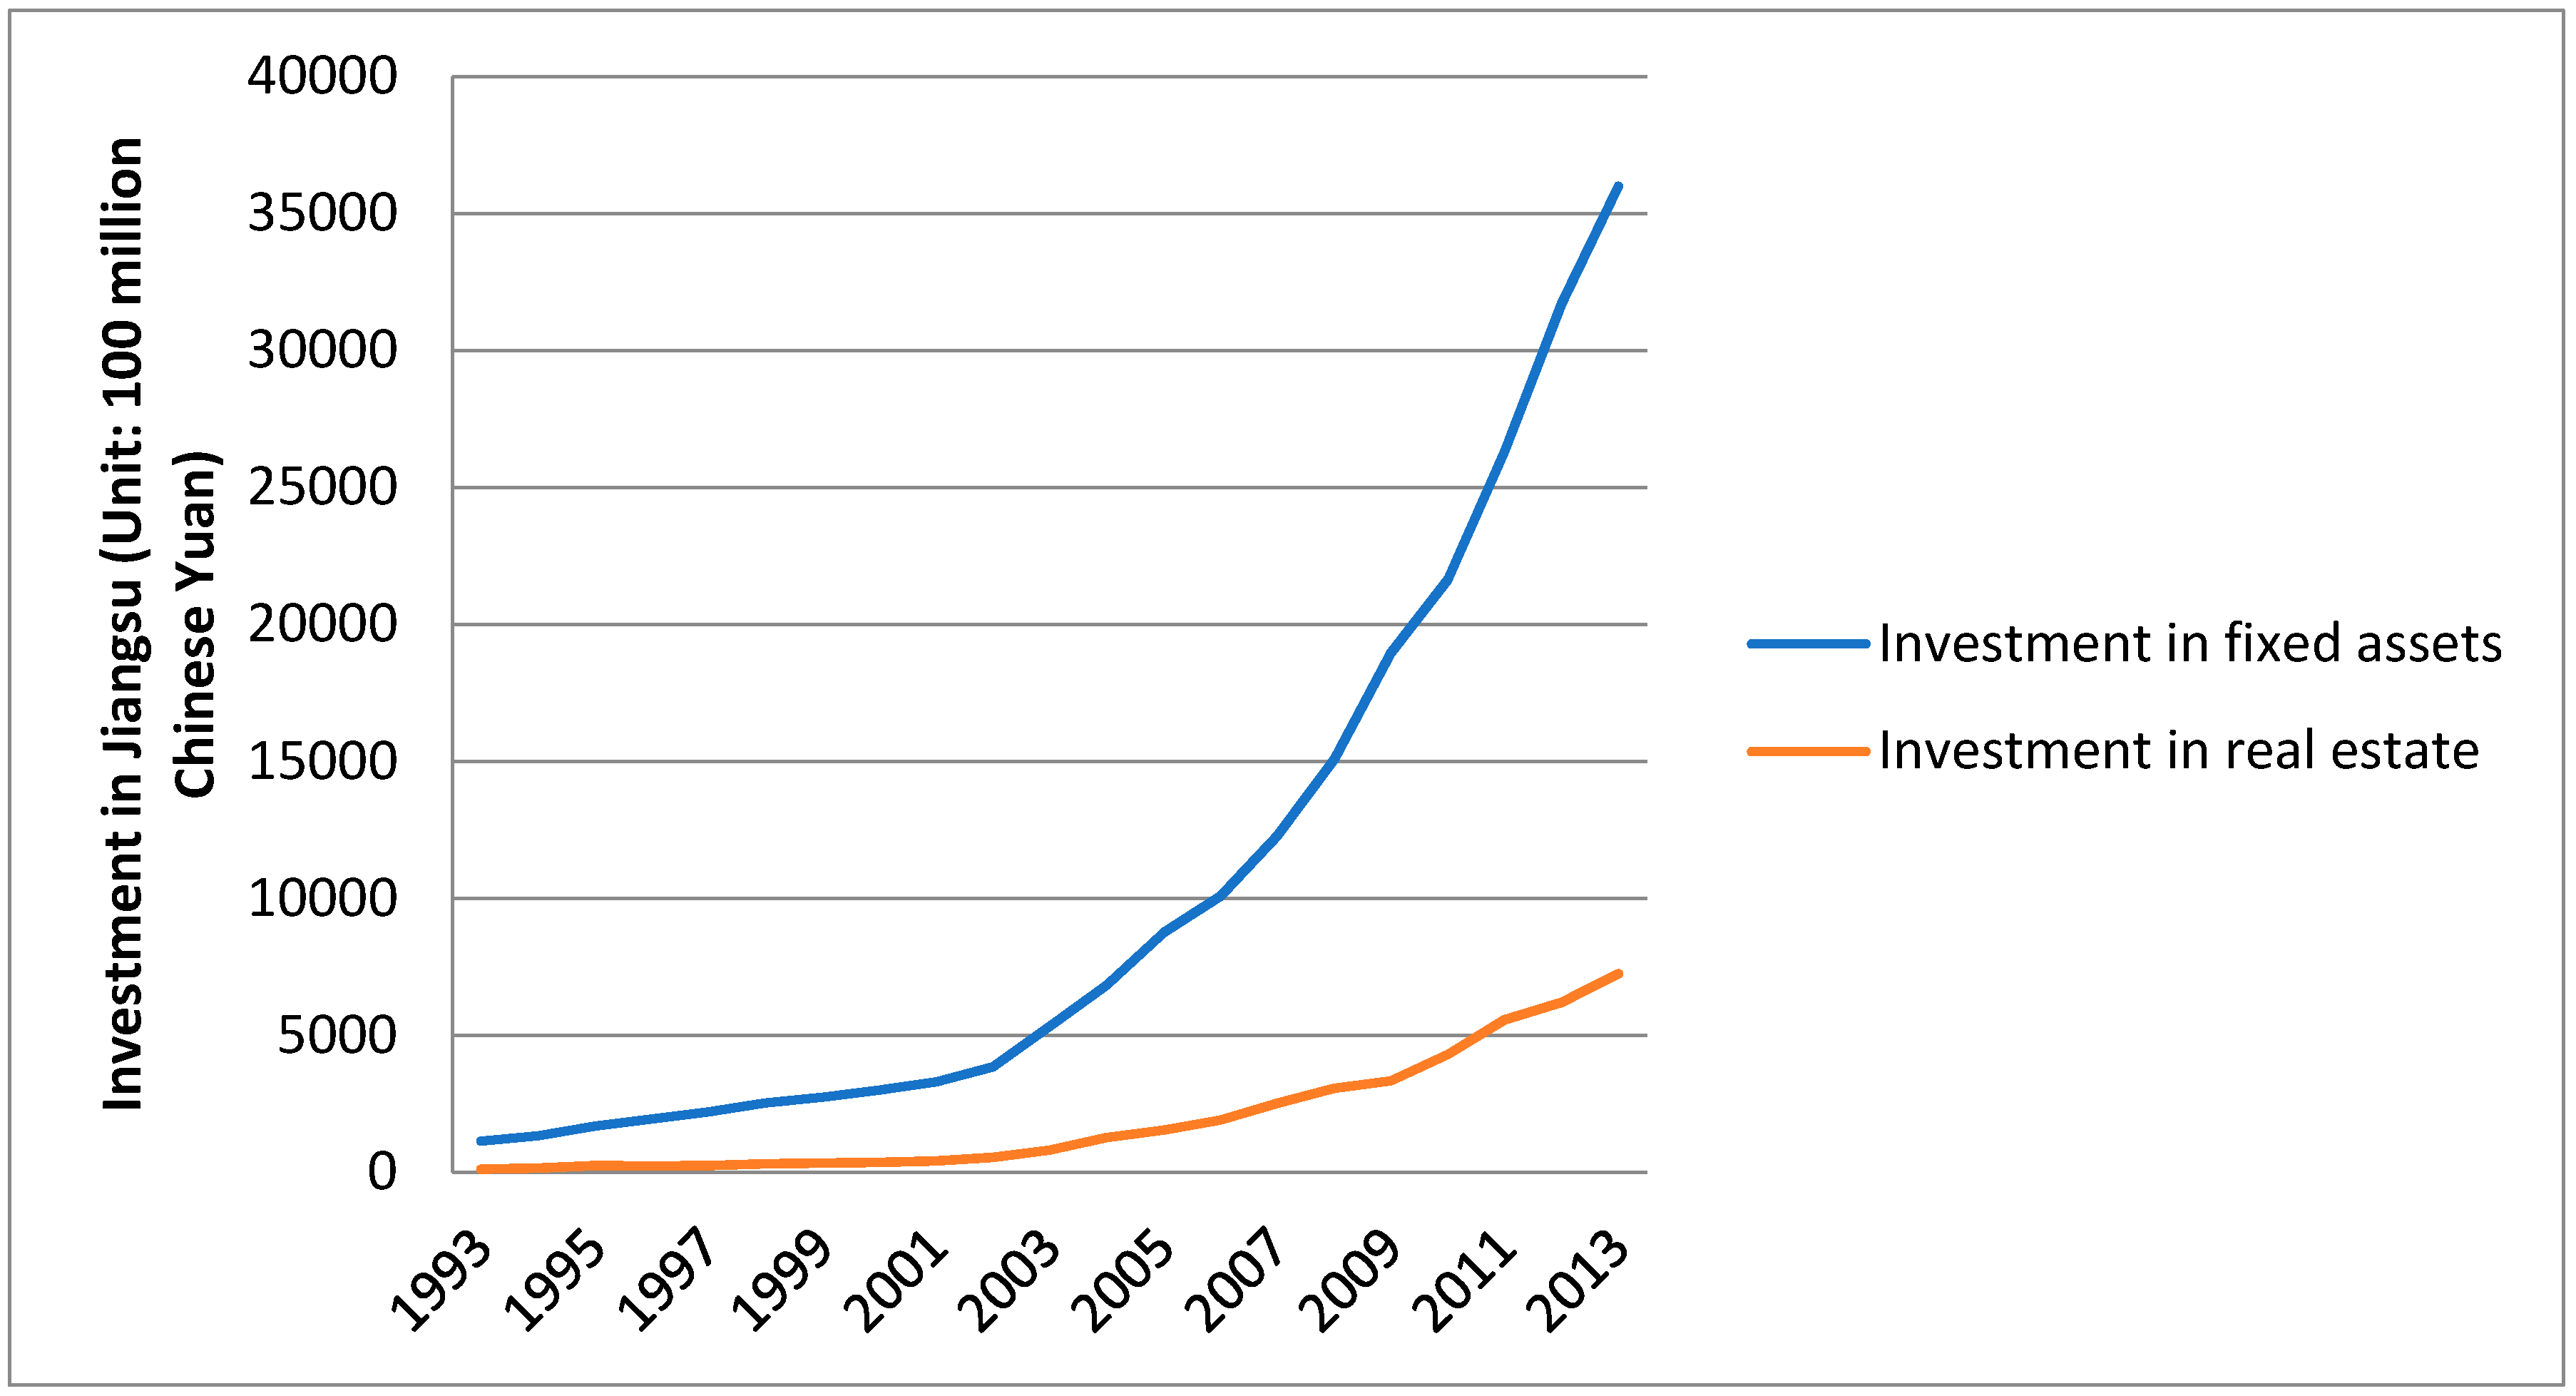
Accompanying the rapid acceleration of the economic development trend and the wide increase in the third industry, the urban scale extended and urban construction expanded. Reflected by the investment in fixed assets and in real estate (see Figure 10 and Table A2), investment increased nonlinearly since 1993, and showed an accelerating trend for the future. Reviewing the investment history during the past 20 years, before 2000, the investment in fixed assets was growing steadily and slowly, while the investment in real estate remained very low. However, after 2000, the development situation changed to increase explosively, and had two important acceleration points in 2002 and 2010. The Chinese government put numerous large investments into society to further push urban development. Additionally, many large-scale urban infrastructure projects were completed during this period; for example, the Nanjing Youth Olympic Village, Suzhou Industrial Park, Runyang Yangtze River Bridge, Nanjing-Zhenjiang-Yancheng freeway reconstruction, Nanjing-Shanghai high-speed railway, and more. This economic investment largely promoted the expansion of the urban built-up area and the process of urbanization.
5. Conclusions
The authors employed the DMSP/OLS nighttime light data of Jiangsu province from 1998 to 2013 as an example in this study. The spatial-temporal dynamic characteristics of the expansion of the urban built-up area were analyzed. More specifically, the urban built-up area expansion distribution, expansion rates, urbanization intensity index, and the movement of the gravity centers of urban built-up area were examined. The clearest change was the continuous and rapid increase in the domain of the urban built-up area. This research method still has some limitations, however. First, the DMSP/OLS nighttime light data, having a limited spatial resolution, would affect the accuracy of the extraction of the built-up area. Future research should consider corrected remote sensing data products with relatively higher resolution and wide radiometric detection ranges to improve result accuracy, such as the new nighttime light data from the National Polar-Orbiting Partnership-Visible Infrared Imaging Radiometer Suite, which has provided nighttime light data since 2013. Second, the authors applied the thresholding method to extract the lighted region as the built-up area using socio-economic statistical data, which could ignore the regional light differences, since some regions might be constructed with weak lighting. The authors might further adapt this research with multi-sourced data, such as social media check-in data, residents’ daily traffic data and more. Overall, considering the discussions above, the DMSP/OLS nighttime light data is effective for the extraction of the urban built-up area at the provincial scale, and provides an effective plan for the research of the changes of the built-up area.
Jiangsu province is the core region with rapid expansion in the Yangtze River Delta region in the Eastern coastal area of China. Trends show it will maintain this accelerated social and economic development in the near future. Concurrently, Jiangsu province will face pressure regarding the loss of arable land and natural areas to the built-up areas to support urban construction. The findings of this research might provide suggestions for future land-use planning and optimization of current land-use structures. Society, in future, should try to promote the vitality of the existing built-up area, optimize the land-use structures, use high-efficiency land-use planning, and consider sustainable development from the perspective of land-use.
Author Contributions
G.S. had the original idea for this study, wrote the paper, did literature review and analyzed the data; N.J. reviewed the paper structure and gave advices to research methodology. Y.L. promoted to data analysis; B.H. helped to do data analysis. All authors contributed to data collection and methodology. All authors have read and approved the final manuscript.
Funding
This research received funding of Postgraduate Research & Practice Innovation Program of Jiangsu Province (KYCX18_1209); National Natural Science Foundation of China (41771421, 41601449; 41501431).
Acknowledgments
Acknowledgement for the data support from Yangtze River Delta Science Data Center National Earth System Science Data Sharing Infrastructure, National Science & Technology Infrastructure of China (http://nnu.geodata.cn). We would also like to acknowledge the support provided by China Scholarship Council.
Conflicts of Interest
The authors declare no conflict of interest.
Appendix A
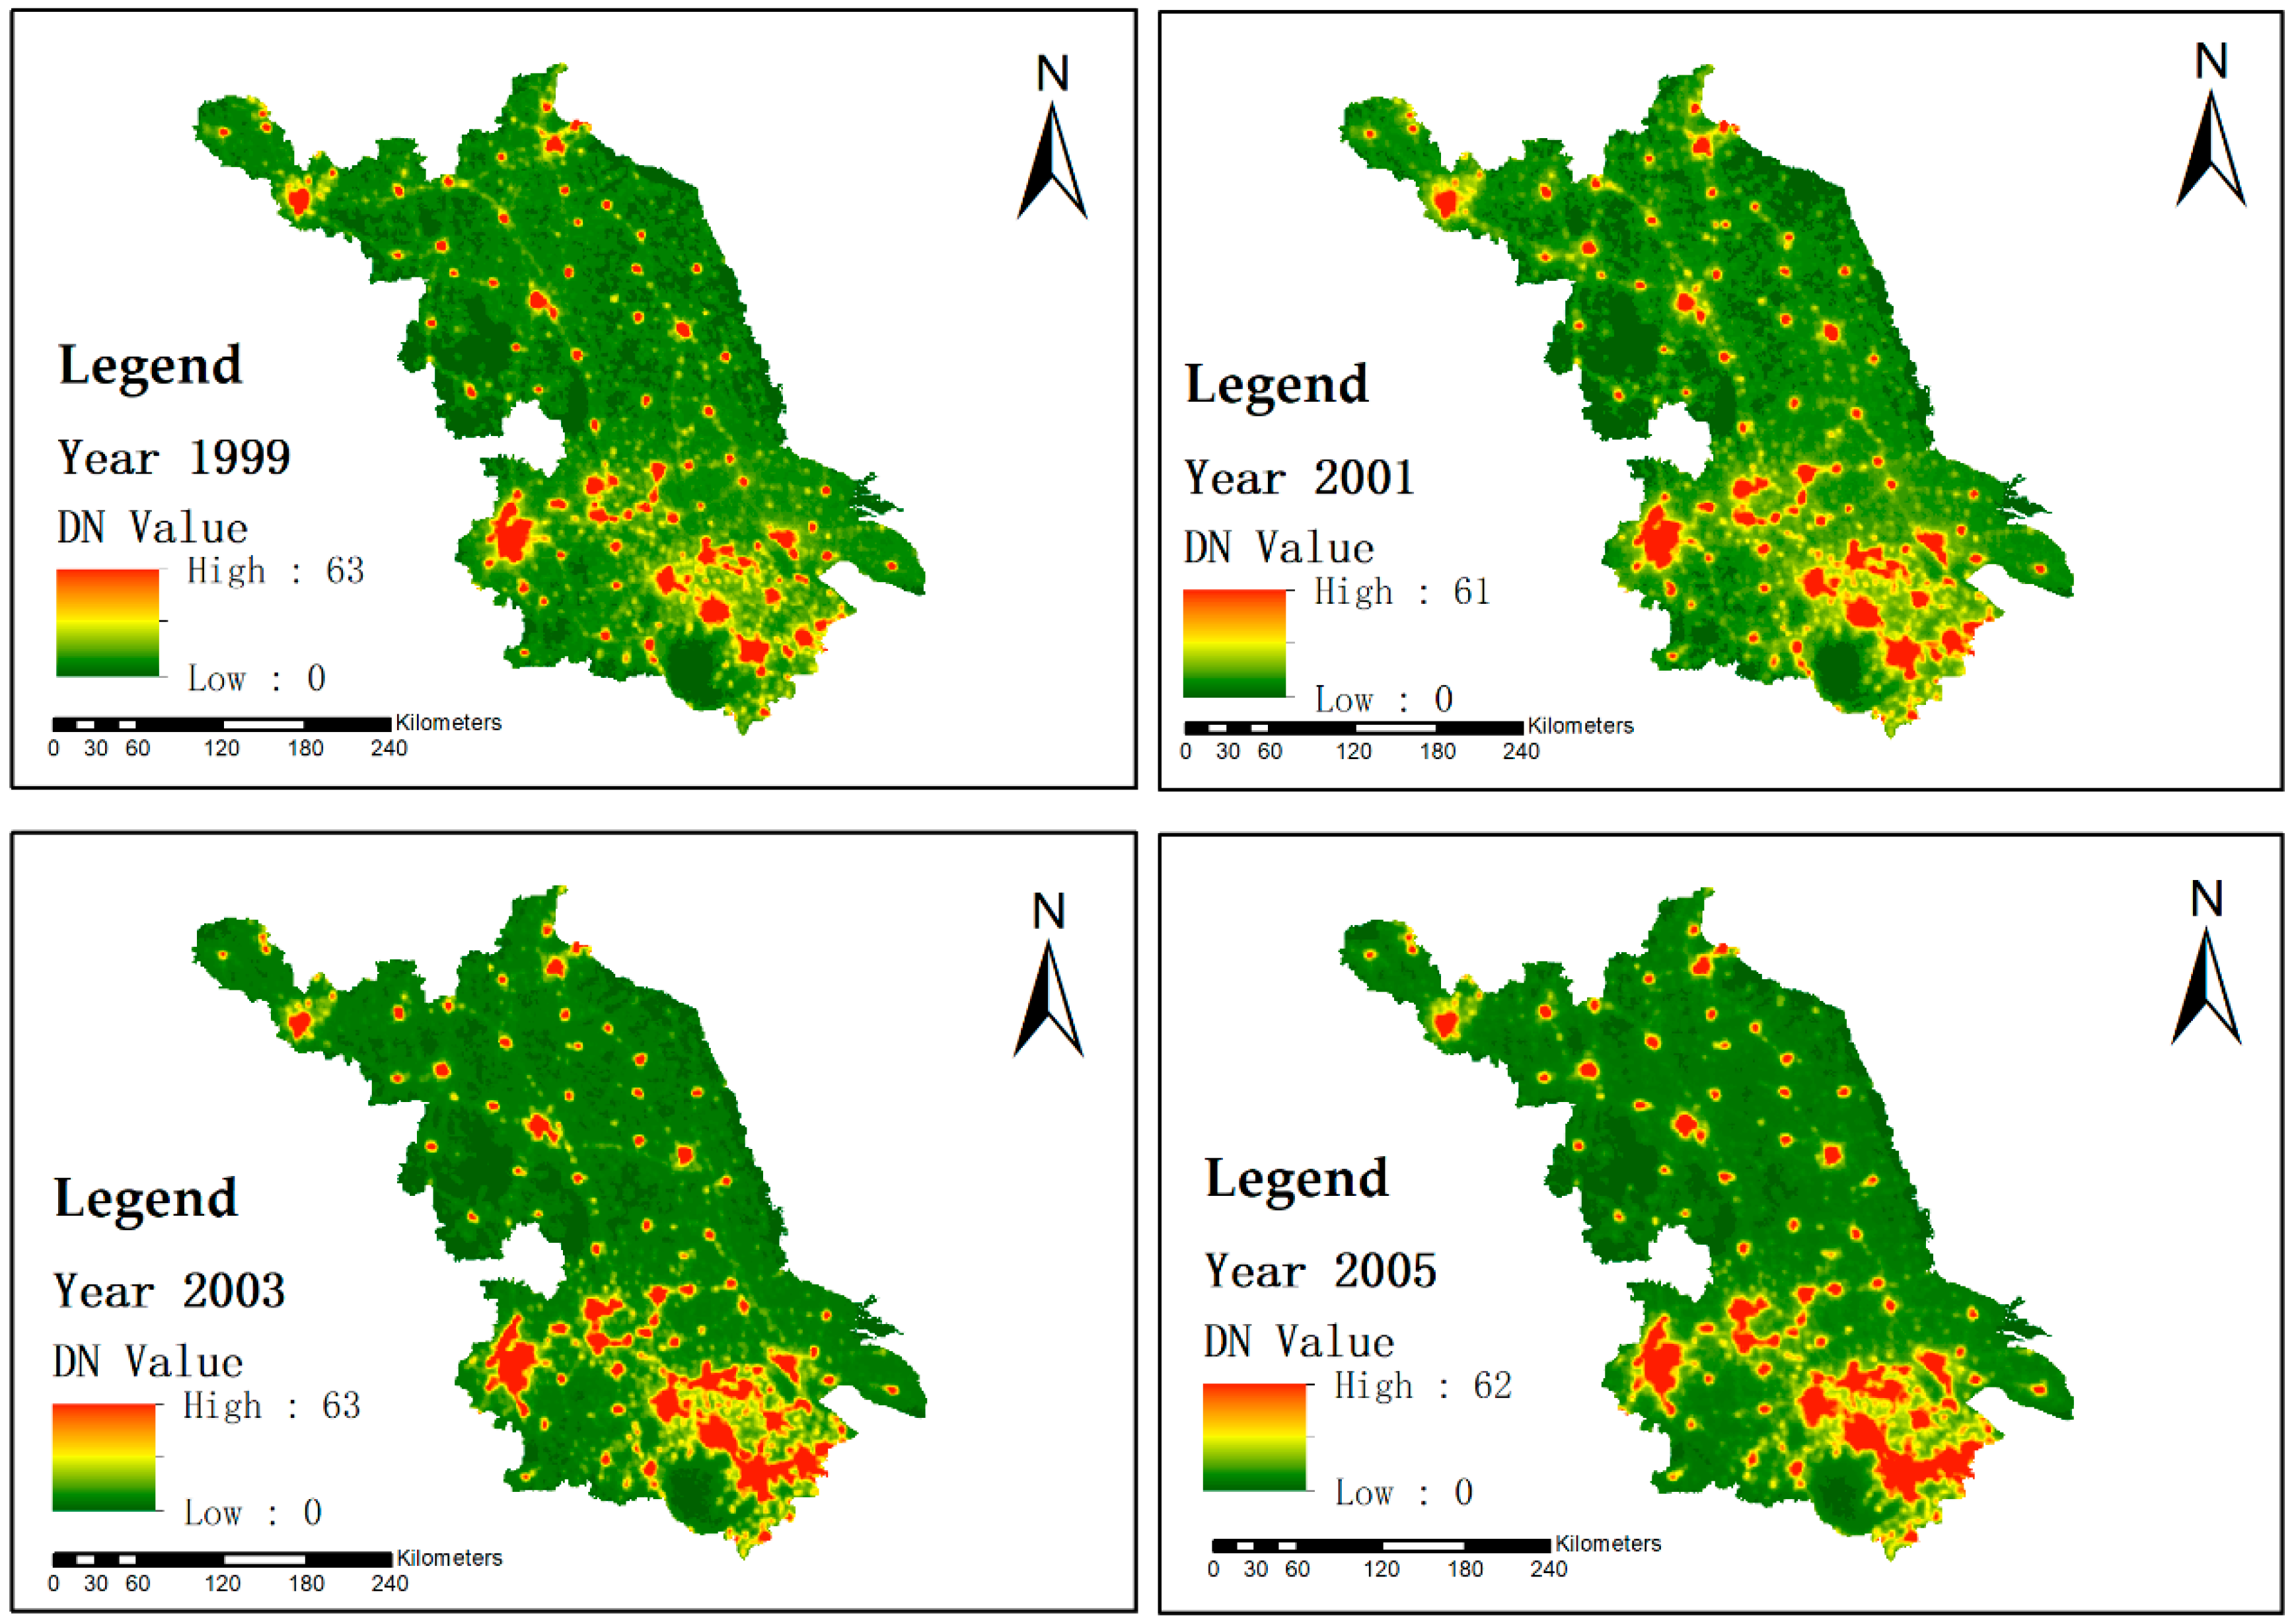
Figure A1.
The bi-yearly change in nighttime light levels in Jiangsu province from 1998 to 2013 Note: DN value means the digital number of nighttime light data.
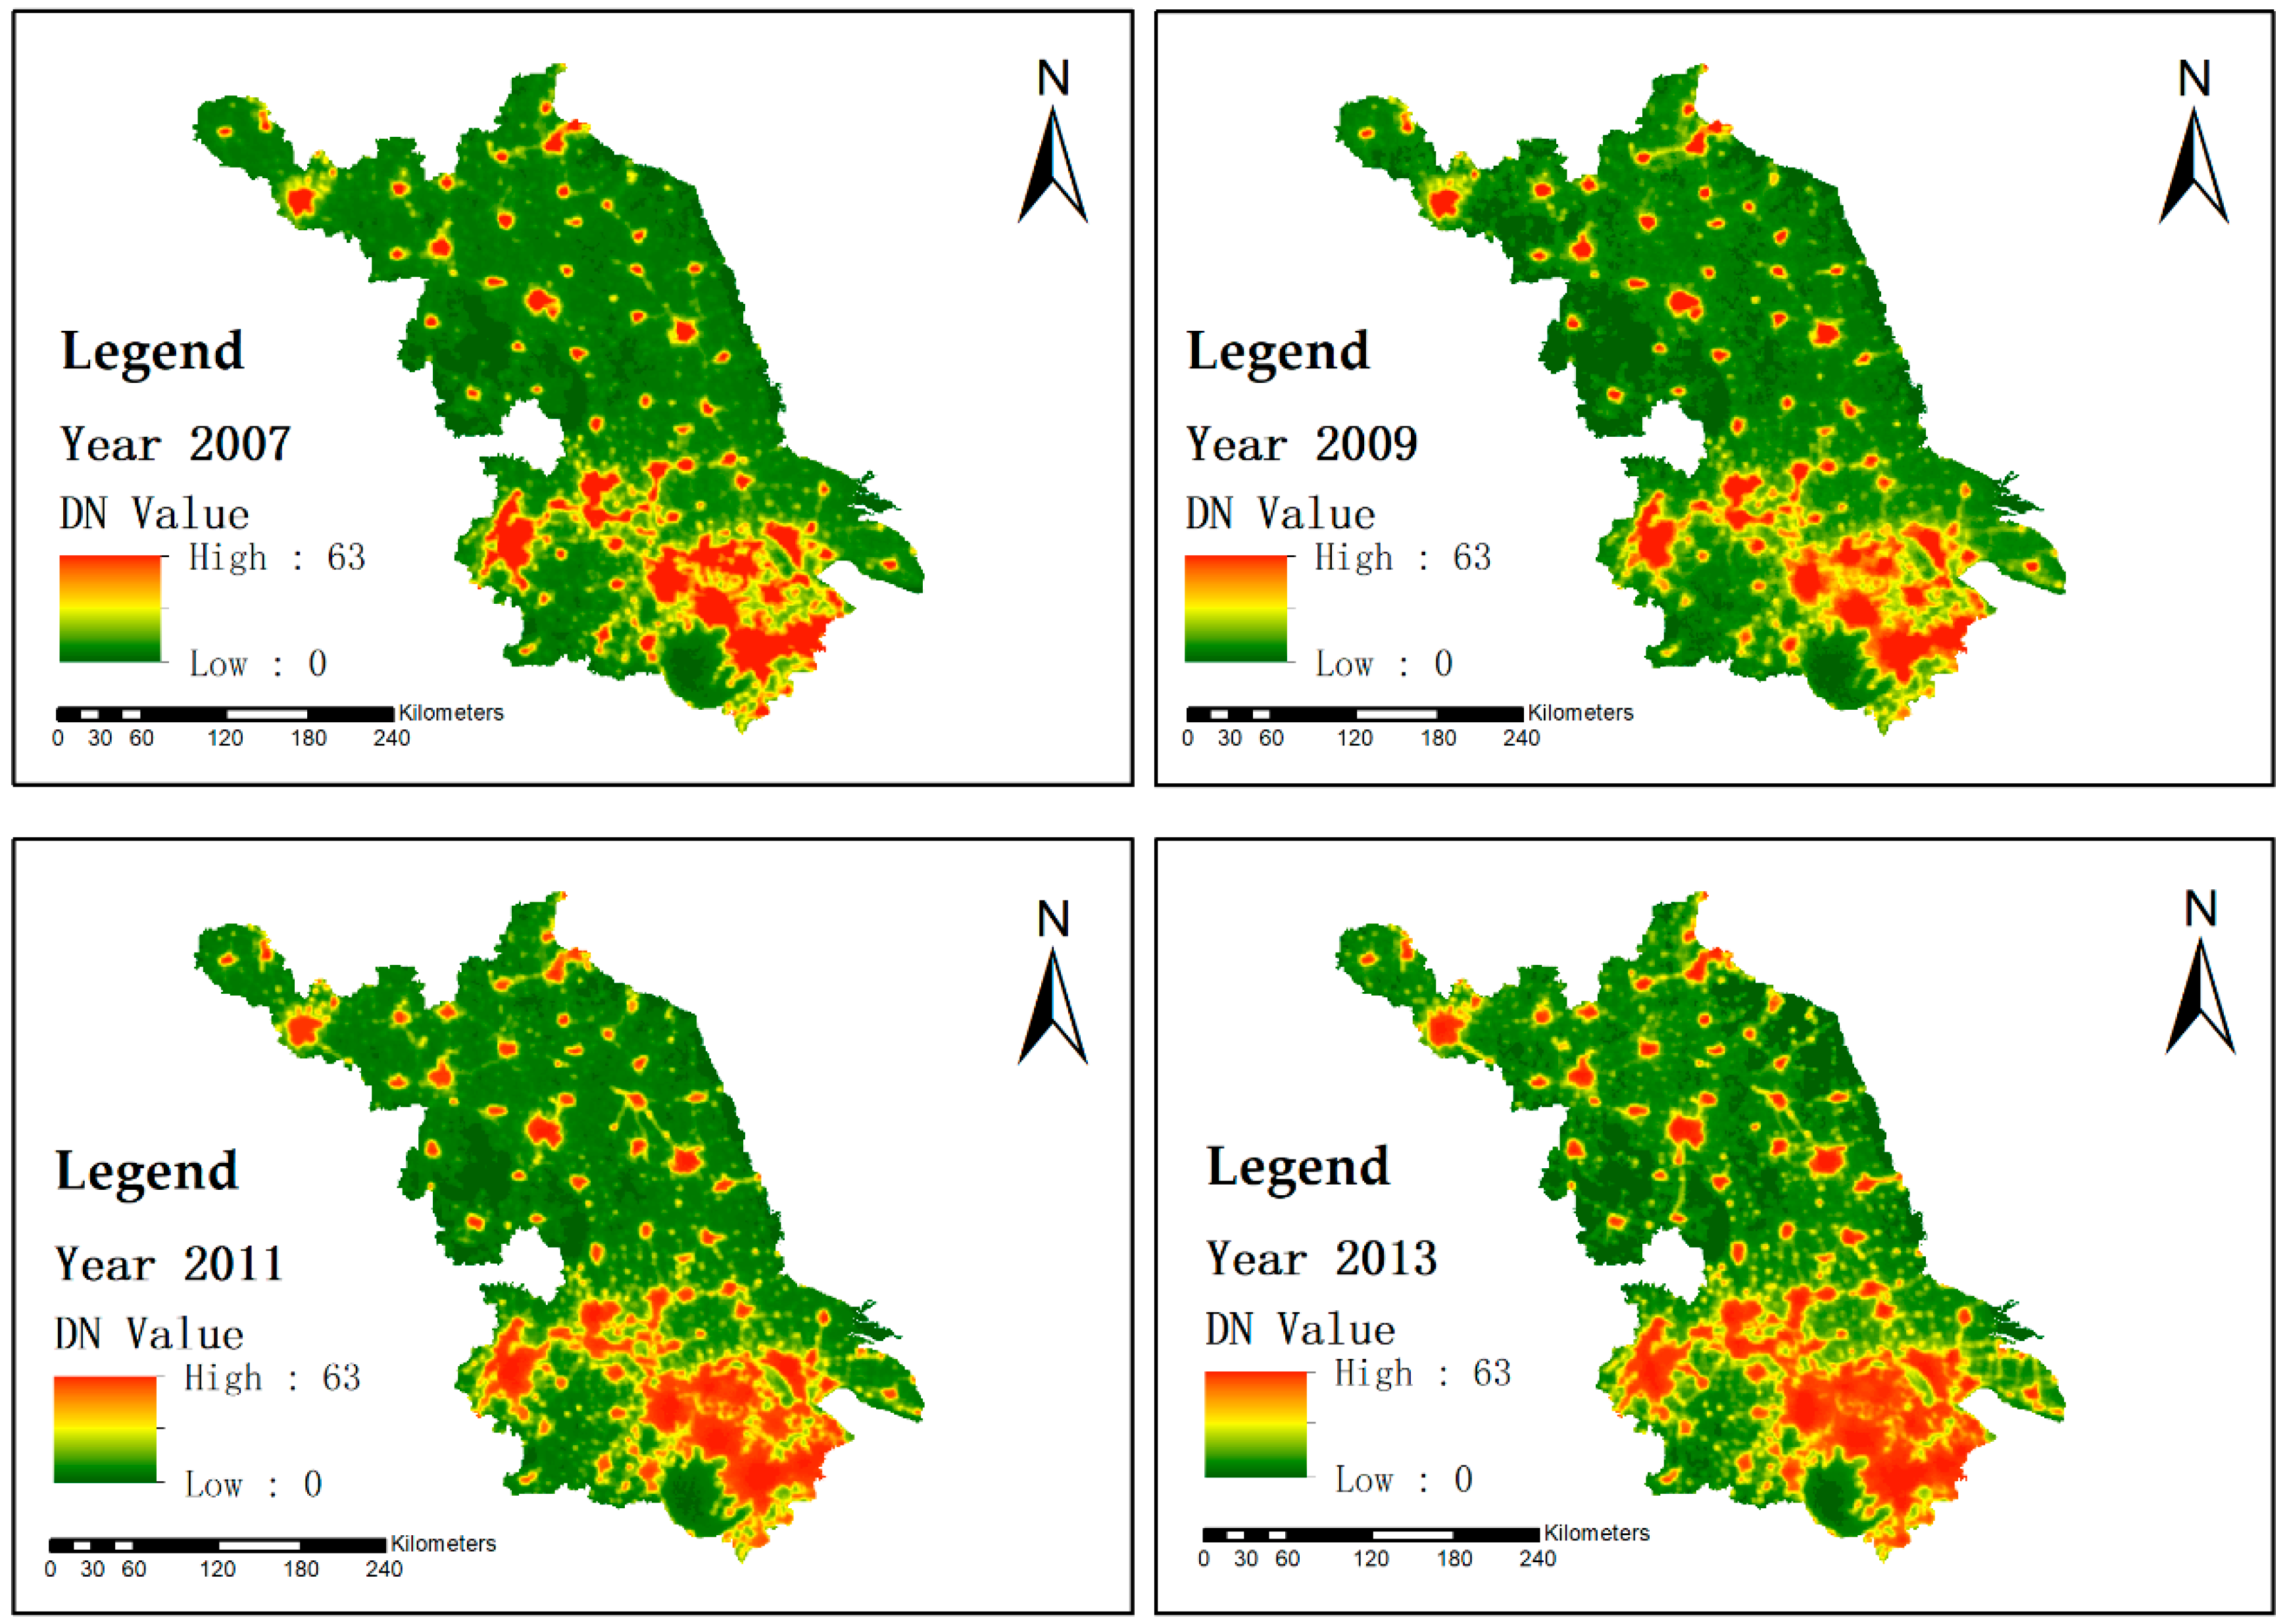
Figure A1.
The bi-yearly change in nighttime light levels in Jiangsu province from 1998 to 2013 Note: DN value means the digital number of nighttime light data.


Table A1.
Population of Jiangsu province.
| Year | Total Population (Unit: Ten Thousands) | Percentage of Total Population Increase | Non-Agricultural Population | Percentage of Non-Agricultural Population |
|---|---|---|---|---|
| 1993 | 6967.27 | - | 1673.58 | 24.02% |
| 1994 | 7020.54 | 0.76% | 1733.01 | 24.68% |
| 1995 | 7066.02 | 0.65% | 1929.09 | 27.3% |
| 1996 | 7110.16 | 0.62% | 1942.5 | 27.32% |
| 1997 | 7147.86 | 0.53% | 2133.64 | 29.85% |
| 1998 | 7182.46 | 0.48% | 2262.47 | 31.49% |
| 1999 | 7213.13 | 0.43% | 2520.09 | 34.94% |
| 2000 | 7327.24 | 1.58% | 3040.81 | 41.5% |
| 2001 | 7358.52 | 0.43% | 3134.73 | 42.6% |
| 2002 | 7405.5 | 0.64% | 3310.25 | 44.7% |
| 2003 | 7457.7 | 0.7% | 3487.97 | 46.77% |
| 2004 | 7522.95 | 0.87% | 3624.56 | 48.18% |
| 2005 | 7588.24 | 0.87% | 3832.06 | 50.5% |
| 2006 | 7655.66 | 0.89% | 3973.29 | 51.9% |
| 2007 | 7723.13 | 0.88% | 4108.7 | 53.20% |
| 2008 | 7762.48 | 0.5% | 4215.17 | 54.3% |
| 2009 | 7810.27 | 0.61% | 4342.51 | 55.6% |
| 2010 | 7869.34 | 0.76% | 4767.63 | 60.58% |
| 2011 | 7898.8 | 0.37% | 4889.36 | 61.9% |
| 2012 | 7919.98 | 0.27% | 4990.09 | 63% |
| 2013 | 7939.49 | 0.25% | 5090.01 | 64.11% |
Table A2.
Investment in fixed assets and in real estate for Jiangsu province.
| Year | Investment in Fixed Assets (Unit: 100 Million Chinese Yuan) | Investment in Real Estate (Unit: 100 Million Chinese Yuan) |
|---|---|---|
| 1993 | 1144.2 | 114.01 |
| 1994 | 1331.13 | 152.42 |
| 1995 | 1680.17 | 240.85 |
| 1996 | 1949.53 | 232.62 |
| 1997 | 2203.09 | 241.55 |
| 1998 | 2535.5 | 300.24 |
| 1999 | 2742.65 | 330.55 |
| 2000 | 2995.43 | 358.72 |
| 2001 | 3302.96 | 414.36 |
| 2002 | 3849.24 | 544.13 |
| 2003 | 5335.8 | 809.96 |
| 2004 | 6827.59 | 1269.78 |
| 2005 | 8739.71 | 1545.15 |
| 2006 | 10,071.42 | 1906.71 |
| 2007 | 12,268.07 | 2515.91 |
| 2008 | 15,060.45 | 3064.46 |
| 2009 | 18,949.88 | 3338.5 |
| 2010 | 21,643.02 | 4299.38 |
| 2011 | 26,314.66 | 5567.94 |
| 2012 | 31,706.58 | 6206.1 |
| 2013 | 35,982.52 | 7241.45 |
References
- Shiu, A.; Lam, P.-L. Electricity consumption and economic growth in China. Energy Policy 2004, 32, 47–54. [Google Scholar] [CrossRef]
- Chen, J. Rapid urbanization in China: A real challenge to soil protection and food security. Catena 2007, 69, 1–15. [Google Scholar] [CrossRef]
- Zhou, L.; Dickinson, R.E.; Tian, Y.; Fang, J.; Li, Q.; Kaufmann, R.K.; Tucker, C.J.; Myneni, R.B. Evidence for a significant urbanization effect on climate in China. Proc. Natl. Acad. Sci. USA 2004, 101, 9540–9544. [Google Scholar] [CrossRef] [PubMed] [Green Version]
- Chen, H.; Jia, B.; Lau, S.S.Y. Sustainable urban form for Chinese compact cities: Challenges of a rapid urbanized economy. Habitat Int. 2008, 32, 28–40. [Google Scholar] [CrossRef]
- National Bureau of Statistics of the People’s Republic of China. China Statistical Bureau. 2017. Available online: http://www.stats.gov.cn/tjsj/ndsj/2017/indexch.htm (accessed on 15 February 2018).
- Imhoff, M.L.; Bounoua, L.; DeFries, R.; Lawrence, W.T.; Stutzer, D.; Tucker, C.J.; Ricketts, T. The consequences of urban land transformation on net primary productivity in the United States. Remote Sens. Environ. 2004, 89, 434–443. [Google Scholar] [CrossRef]
- Zhao, S.; Da, L.; Tang, Z.; Fang, H.; Song, K.; Fang, J. Ecological consequences of rapid urban expansion: Shanghai, China. Front. Ecol. Environ. 2006, 4, 341–346. [Google Scholar] [CrossRef] [Green Version]
- Kalnay, E.; Cai, M. Impact of urbanization and land-use change on climate. Nature 2003, 423, 528–531. [Google Scholar] [CrossRef] [PubMed]
- Lambin, E.F.; Meyfroidt, P. Global land use change, economic globalization, and the looming land scarcity. Proc. Natl. Acad. Sci. USA 2011, 108, 3465–3472. [Google Scholar] [CrossRef] [PubMed] [Green Version]
- Zhang, K.H.; Shunfeng, S. Rural–urban migration and urbanization in China: Evidence from time-series and cross-section analyses. China Econ. Rev. 2003, 14, 386–400. [Google Scholar] [CrossRef]
- Yixing, Z.; Ma, L.J. China’s urbanization levels: Reconstructing a baseline from the fifth population census. China Q. 2003, 173, 176–196. [Google Scholar] [CrossRef]
- Ferrari, L.; Rosi, A.; Mamei, M.; Zambonelli, F. Extracting urban patterns from location-based social networks. In Proceedings of the 3rd ACM SIGSPATIAL International Workshop on Location-Based Social Networks, Chicago, IL, USA, 1 November 2011; pp. 9–16. [Google Scholar]
- Goodchild, M.F. Citizens as sensors: The world of volunteered geography. GeoJournal 2007, 69, 211–221. [Google Scholar] [CrossRef]
- Shi, G.; Jiang, N.; Yao, L.Q. Study on the identification of urban center system based on GIS and POI—A case study of shanghai. Mod. Surv. Mapp. 2017, 6, 27–30. [Google Scholar]
- Long, Y.; Zhang, Y.; Cui, C.Y. Identifying commuting pattern of Beijing using bus smart card data. Acta Geogr. Sin. 2012, 67, 1339–1352. [Google Scholar]
- Long, Y.; Shen, Z. Discovering functional zones using bus smart card data and points of interest in Beijing. In Geospatial Analysis to Support Urban Planning in Beijing; Springer: Cham, Switzerland, 2015; pp. 193–217. [Google Scholar]
- Shi, G.; Jiang, N.; Yao, L. Land Use and Cover Change during the Rapid Economic Growth Period from 1990 to 2010: A Case Study of Shanghai. Sustainability 2018, 10, 426. [Google Scholar] [CrossRef]
- Fan, F.; Weng, Q.; Wang, Y. Land use and land cover change in Guangzhou, China, from 1998 to 2003, based on Landsat TM/ETM+ imagery. Sensors 2007, 7, 1323–1342. [Google Scholar] [CrossRef]
- Hu, T.; Yang, J.; Li, X.; Gong, P. Mapping urban land use by using Landsat images and open social data. Remote Sens. 2016, 8, 151. [Google Scholar] [CrossRef]
- Huang, F.; Huang, B.; Huang, J.; Li, S. Measuring Land Change in Coastal Zone around a Rapidly Urbanized Bay. Int. J. Environ. Res. Public Health 2018, 15, 1059. [Google Scholar] [CrossRef] [PubMed]
- Asner, G.P. Cloud cover in Landsat observations of the Brazilian Amazon. Int. J. Remote Sens. 2001, 22, 3855–3862. [Google Scholar] [CrossRef]
- Elvidge, C.D.; Baugh, K.E.; Dietz, J.B.; Bland, T.; Sutton, P.C.; Kroehl, H.W. Radiance calibration of DMSP-OLS low-light imaging data of human settlements. Remote Sens. Environ. 1999, 68, 77–88. [Google Scholar] [CrossRef]
- Imhoff, M.L.; Lawrence, W.T.; Stutzer, D.C.; Elvidge, C.D. A technique for using composite DMSP/OLS “city lights” satellite data to map urban area. Remote Sens. Environ. 1997, 61, 361–370. [Google Scholar] [CrossRef]
- Liu, Q.; Yang, Y.; Tian, H.; Bo, Z.; Lei, G. Assessment of human impacts on vegetation in built-up areas in china based on AVVHR, Modis and DMSP/OLS nighttime light data, 1992–2010. Chin. Geogr. Sci. 2014, 24, 231–244. [Google Scholar] [CrossRef]
- Huang, Q.; Yang, Y.; Li, Y.; Gao, B. A simulation study on the urban population of china based on nighttime light data acquired from DMSP/OLS. Sustainability 2016, 8, 521. [Google Scholar] [CrossRef]
- Keola, S.; Andersson, M.; Hall, O. Monitoring economic development from space: Using nighttime light and land cover data to measure economic growth. World Dev. 2015, 66, 322–334. [Google Scholar] [CrossRef]
- Liu, Z.; He, C.; Zhang, Q.; Huang, Q.; Yang, Y. Extracting the dynamics of urban expansion in china using DMSP-OLS nighttime light data from 1992 to 2008. Landsc. Urban Plan. 2012, 106, 62–72. [Google Scholar] [CrossRef]
- Yu, B.; Shu, S.; Liu, H.; Song, W.; Wu, J.; Wang, L.; Chen, Z. Object-based spatial cluster analysis of urban landscape pattern using nighttime light satellite images: A case study of china. Int. J. Geogr. Inf. Sci. 2014, 28, 2328–2355. [Google Scholar] [CrossRef]
- Jiang, W.; He, G.; Leng, W.; Long, T.; Wang, G.; Liu, H.; Peng, Y.; Yin, R.; Guo, H. Characterizing Light Pollution Trends across Protected Areas in China Using Nighttime Light Remote Sensing Data. ISPRS Int. J. Geo-Inf. 2018, 7, 243. [Google Scholar] [CrossRef]
- Zhang, C.M.; Zhang, X.L.; Qi-Yan, W.U.; Hong-Bo, L.I. The coordination about quality and scale of urbanization: Case study of Jiangsu province. Sci. Geogr. Sin. 2013, 33, 16–22. [Google Scholar]
- Zhai, W.; Huang, X.; Zhang, Q. Intensive land use potential in urban development zones: A case study in typical urban development zones in Jiangsu province. Resour. Sci. 2006, 28, 54–60. [Google Scholar]
- Du, X.; Jin, X.; Yang, X.; Yang, X.; Zhou, Y. Spatial Pattern of Land Use Change and Its Driving Force in Jiangsu Province. Int. J. Environ. Res. Public Health 2014, 11, 3215–3232. [Google Scholar] [CrossRef] [PubMed] [Green Version]
- Ou, X.; Zhen, F.; Qin, Y. Study on Compression Level and Ideal Impetus of Regional Urbanization: The Case of Jiangsu Province. 2008. Available online: http://www.dlyj.ac.cn/EN/10.11821/yj2008050003 (accessed on 20 May 2018).
- National Bureau of Statistics of the People’s Republic of China. Jiangsu Statistical Yearbook. 2017. Available online: http://www.jssb.gov.cn/2017nj/indexc.html (accessed on 20 May 2018).
- NOAA. National Centers for Environmental Information. Available online: https://www.ngdc.noaa.gov/eog/dmsp/downloadV4composites.html (accessed on 10 January 2018).
- National Science & Technology Infrastructure of China. National Earth System Science Data Sharing Infrastructure. 2015. Available online: http://www.geodata.cn (accessed on 10 January 2018).
- Lu, H.; Zhang, M.; Sun, W.; Li, W. Expansion Analysis of Yangtze River Delta Urban Agglomeration Using DMSP/OLS Nighttime Light Imagery for 1993 to 2012. ISPRS Int. J. Geo-Inf. 2018, 7, 52. [Google Scholar] [CrossRef]
- Shi, K.; Yu, B.; Huang, Y.; Hu, Y.; Yin, B.; Chen, Z.; Chen, L.; Wu, J. Evaluating the Ability of NPP-VIIRS Nighttime Light Data to Estimate the Gross Domestic Product and the Electric Power Consumption of China at Multiple Scales: A Comparison with DMSP-OLS Data. Remote Sens. 2014, 6, 1705–1724. [Google Scholar] [CrossRef] [Green Version]
- Shu, S.; Bai-Lang, Y.U.; Jian-Ping, W.U.; Liu, H.X. Methods for deriving urban built-up area using night-light data: Assessment and application. Remote Sens. Technol. Appl. 2011, 26, 169–176. [Google Scholar]
- Ma, Y.; Xu, R. Remote sensing monitoring and driving force analysis of urban expansion in Guangzhou city, China. Habitat Int. 2010, 34, 228–235. [Google Scholar] [CrossRef]
- Xiao, J.; Shen, Y.; Ge, J.; Tateishi, R.; Tang, C.; Liang, Y.; Huang, Z. Evaluating urban expansion and land use change in Shijiazhuang, China, by using GIS and remote sensing. Landsc. Urban Plan. 2006, 75, 69–80. [Google Scholar] [CrossRef]
- Liu, S.; Wu, C.; Shen, H. A GIS based model of urban land use growth in Beijing. Acta Geogr. Sin. 2000, 55, 407–416. [Google Scholar]
- Zhang, X.Y.; Huang, X.J.; Zhao, Y.T.; Wang, Q.Q.; Ru-Cheng, L.U.; Zhao, X.F. Shift route and comparative analysis of land use gravity and economy gravity center in recent ten years in Jiangsu province. Resour. Environ. Yangtze Basin 2011, 20, 14–20. [Google Scholar]
- Zhou, Q.G.; Chen, D.; Chen, Q. Research on the transfer of land use gravity centers from 1985 to 2010 in Chongqing mountainous metropolitan area. Res. Soil Water Conserv. 2013, 20, 189–193. [Google Scholar]
- Ju, H.; Zhang, Z.; Zuo, L.; Wang, J.; Zhang, S.; Wang, X.; Zhao, X. Driving forces and their interactions of built-up land expansion based on the geographical detector–a case study of Beijing, China. Int. J. Geogr. Inf. Sci. 2016, 30, 2188–2207. [Google Scholar] [CrossRef]
- Bai, X.; Chen, J.; Shi, P. Landscape urbanization and economic growth in china: Positive feedbacks and sustainability dilemmas. Environ. Sci. Technol. 2011, 46, 132–139. [Google Scholar] [CrossRef] [PubMed]
- Li, J.; Zhang, Y.; Qin, Q.; Yan, Y. Investigating the impact of human activity on land use/cover change in china’s Lijiang river basin from the perspective of flow and type of population. Sustainability 2017, 9, 383. [Google Scholar] [CrossRef]
- Rajan, R.G.; Zingales, L. Financial systems, industrial structure, and growth. Oxf. Rev. Econ. Policy 2001, 17, 467–482. [Google Scholar] [CrossRef]
- Gan, C.; Zheng, R.; Yu, D. An empirical study on the effects of industrial structure on economic growth and fluctuations in china. Econ. Res. J. 2011, 21, 85–100. [Google Scholar]
Figure 1.
The location of research area: (a) Location map of Jiangsu Province; (b) Distributions of cities in Jiangsu Province.
Figure 1.
The location of research area: (a) Location map of Jiangsu Province; (b) Distributions of cities in Jiangsu Province.

Figure 2.
The yearly increase of the built-up area in the urban area of Jiangsu province from 1998 to 2013 based on the Jiangsu Yearbook (Unit: km2).
Figure 2.
The yearly increase of the built-up area in the urban area of Jiangsu province from 1998 to 2013 based on the Jiangsu Yearbook (Unit: km2).

Figure 3.
Changes of urban built-up area from 1998 to 2013 in Jiangsu province divided into Southern Jiangsu, Central Jiangsu and Northern Jiangsu.
Figure 3.
Changes of urban built-up area from 1998 to 2013 in Jiangsu province divided into Southern Jiangsu, Central Jiangsu and Northern Jiangsu.

Figure 4.
Changes to built-up area from 1998 to 2013 in Jiangsu province, extracted from corrected nighttime light data. Note: “IBU” means the increase of built-up area.
Figure 4.
Changes to built-up area from 1998 to 2013 in Jiangsu province, extracted from corrected nighttime light data. Note: “IBU” means the increase of built-up area.

Figure 5.
Urbanization expansion speed of 13 cities in Jiangsu province from 1998 to 2013.

Figure 6.
Changes of gravity center of the built-up area from 1998 to 2013 in Jiangsu province: (a) The location of gravity center at the province scale; (b) Changes of gravity center of four research periods.
Figure 6.
Changes of gravity center of the built-up area from 1998 to 2013 in Jiangsu province: (a) The location of gravity center at the province scale; (b) Changes of gravity center of four research periods.

Figure 7.
Population of Jiangsu province from 1998 to 2013.

Figure 8.
Total GDP of Jiangsu province from 1998 to 2013.

Figure 9.
Industrial structure of Jiangsu province from 1998 to 2013.

Figure 10.
Investment in Jiangsu province from 1998 to 2013.

Table 1.
Optimal threshold for four study periods.
| Year | Threshold (DN Value) | Lighted Area Based on Threshold (km2) | Urban Built-Up Area Recorded in City Year Book (km2) | Deviation (%) |
|---|---|---|---|---|
| 1998 | 53 | 820.41 | 808 | 1.54 |
| 2003 | 54 | 1418.54 | 1459 | 2.77 |
| 2008 | 59 | 2189.26 | 2105 | 4.00 |
| 2013 | 62 | 3009.48 | 2930 | 2.71 |
Table 2.
Urban expansion speed (UES) and urbanization intensity index (UII) of Jiangsu from 1998 to 2013 (Unit of UES is km2 per year).
Table 2.
Urban expansion speed (UES) and urbanization intensity index (UII) of Jiangsu from 1998 to 2013 (Unit of UES is km2 per year).
| Year | 1998–2003 | 2003–2008 | 2008–2013 | |||
|---|---|---|---|---|---|---|
| Index | UES1998–2003 | UII1998–2003 | UES2003–2008 | UII2003–2008 | UES2008–2013 | UII2008–2013 |
| Nanjing | 53.6 | 149.72% | 30 | 33.56% | 22.2 | 18.59% |
| Wuxi | 17.2 | 91.49% | 3 | 8.33% | 18.4 | 47.18% |
| Xuzhou | 4.8 | 36.92% | 10.2 | 57.3% | 17.6 | 62.86% |
| Changzhou | 4.8 | 35.29% | 5.8 | 31.52% | 13 | 53.72% |
| Suzhou | 14 | 88.61% | 33.8 | 113.42% | 24.2 | 38.05% |
| Nantong | 5.8 | 48.33% | 5 | 28.09% | 20 | 87.72% |
| Lianyungang | 2.6 | 26% | 10.4 | 82.54% | 13 | 56.52% |
| Huaian | 8.8 | 125.71% | 8.4 | 53.16% | 18.4 | 76.03% |
| Yancheng | 6.2 | 124% | 5 | 44.64% | 2.8 | 17.28% |
| Yangzhou | 2.4 | 26.09% | 5 | 43.1% | 9.6 | 57.83% |
| Zhenjiang | 4.6 | 41.07% | 3.8 | 24.05% | 6 | 30.61% |
| Taizhou | 2.8 | 41.18% | 4.4 | 45.83% | 13.6 | 97.14% |
| Suqian | 2.6 | 76.47% | 6.2 | 103.33% | 3.4 | 27.87% |
| Southern Jiangsu | 94.2 | 98.95% | 76.4 | 40.34% | 83.8 | 31.53% |
| Central Jiangsu | 11 | 39.29% | 14.4 | 36.92% | 43.2 | 80.9% |
| Northern Jiangsu | 25 | 65.1% | 40.2 | 63.41% | 55.2 | 53.28% |
| Jiangsu Province | 130.2 | 80.57% | 131 | 44.89% | 182.2 | 43.09% |
© 2018 by the authors. Licensee MDPI, Basel, Switzerland. This article is an open access article distributed under the terms and conditions of the Creative Commons Attribution (CC BY) license (http://creativecommons.org/licenses/by/4.0/).
Share and Cite
MDPI and ACS Style
Shi, G.; Jiang, N.; Li, Y.; He, B. Analysis of the Dynamic Urban Expansion Based on Multi-Sourced Data from 1998 to 2013: A Case Study of Jiangsu Province. Sustainability 2018, 10, 3467. https://doi.org/10.3390/su10103467
AMA Style
Shi G, Jiang N, Li Y, He B. Analysis of the Dynamic Urban Expansion Based on Multi-Sourced Data from 1998 to 2013: A Case Study of Jiangsu Province. Sustainability. 2018; 10(10):3467. https://doi.org/10.3390/su10103467
Chicago/Turabian StyleShi, Ge, Nan Jiang, Yang Li, and Bin He. 2018. "Analysis of the Dynamic Urban Expansion Based on Multi-Sourced Data from 1998 to 2013: A Case Study of Jiangsu Province" Sustainability 10, no. 10: 3467. https://doi.org/10.3390/su10103467
Note that from the first issue of 2016, this journal uses article numbers instead of page numbers. See further details here.