Applications of Satellite Remote Sensing of Nighttime Light Observations: Advances, Challenges, and Perspectives


 , , , , and
Abstract
:
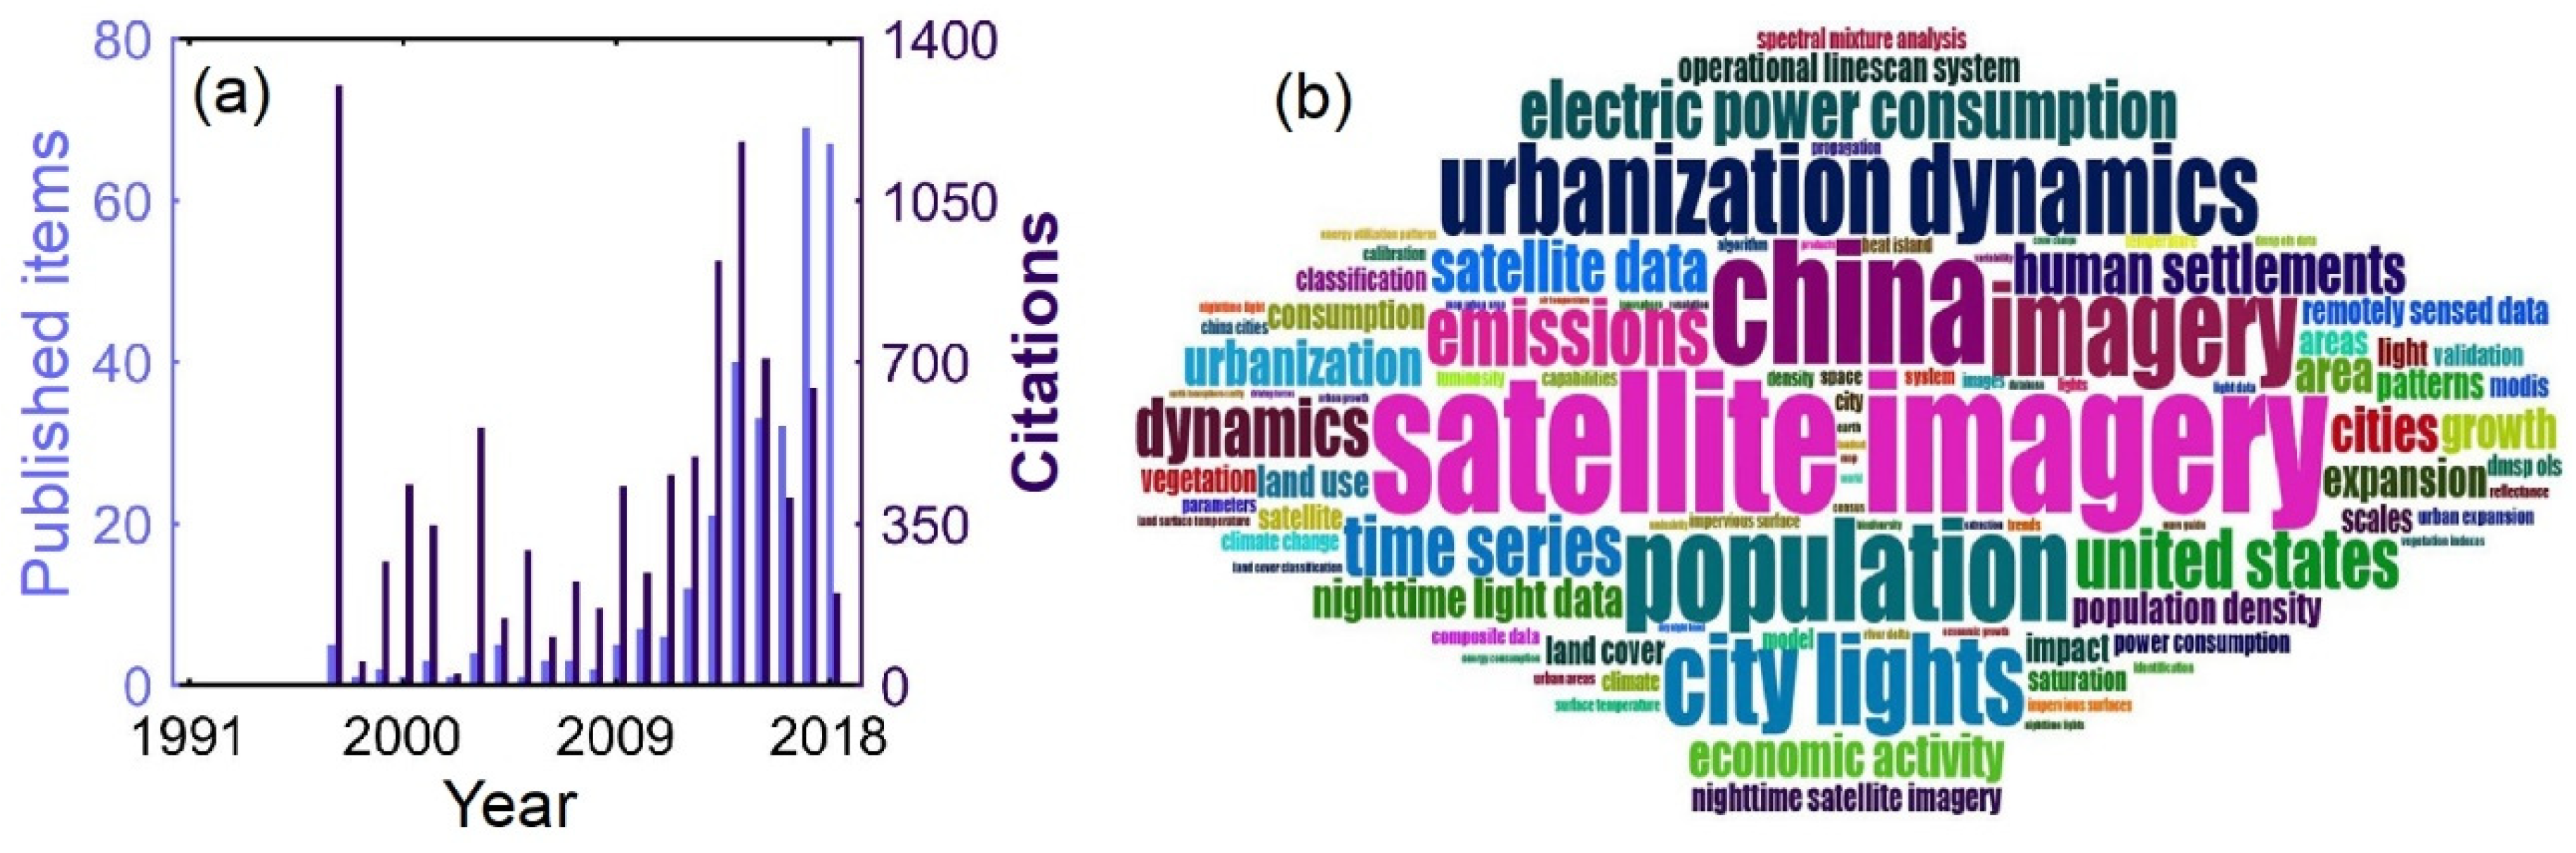
1. Introduction
2. An Overview of Major Nighttime Light Datasets
2.1. DMSP-OLS
2.2. NPP-VIIRS
2.3. Other Satellites and Cubesats
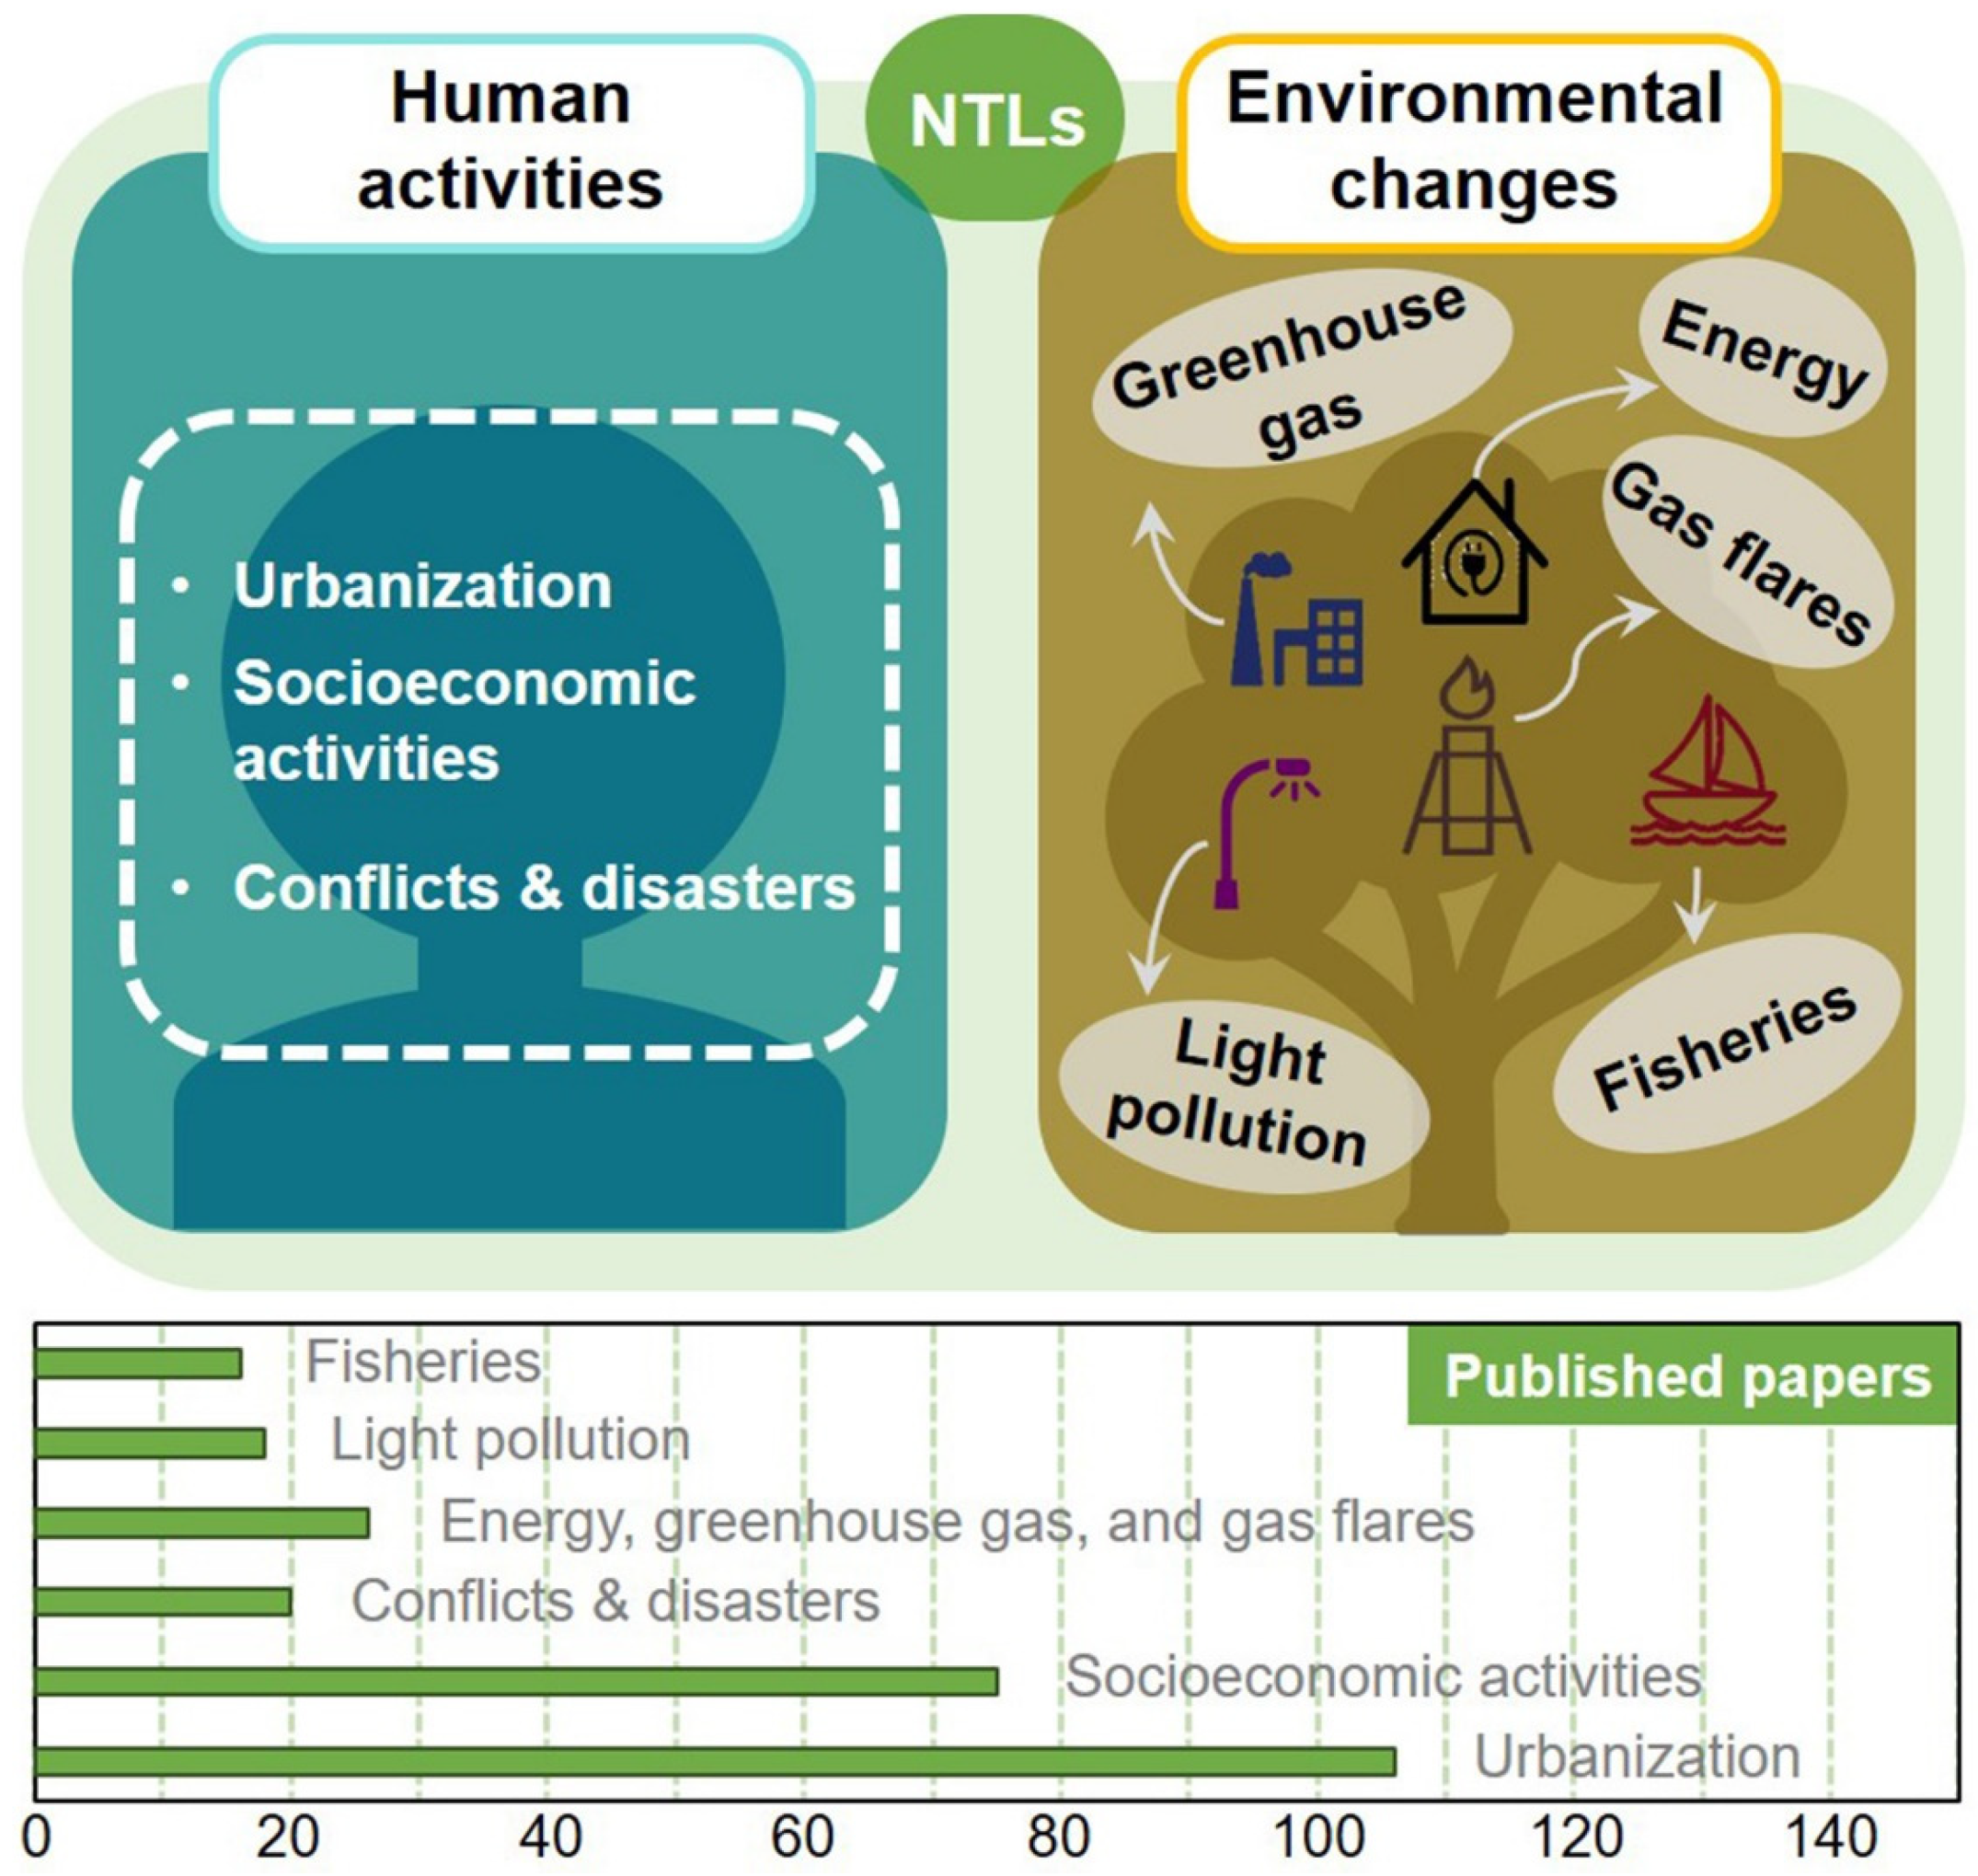
3. Contributions of Nighttime Lights to Perceiving the Changing World
3.1. Human Activities
3.1.1. Urbanization
3.1.2. Socioeconomic Activities
3.1.3. Conflicts and Disasters
3.2. Environmental Changes
3.2.1. Fisheries
3.2.2. Energy, Greenhouse Gas, and Gas Flares
3.2.3. Light Pollution and Associated Effects
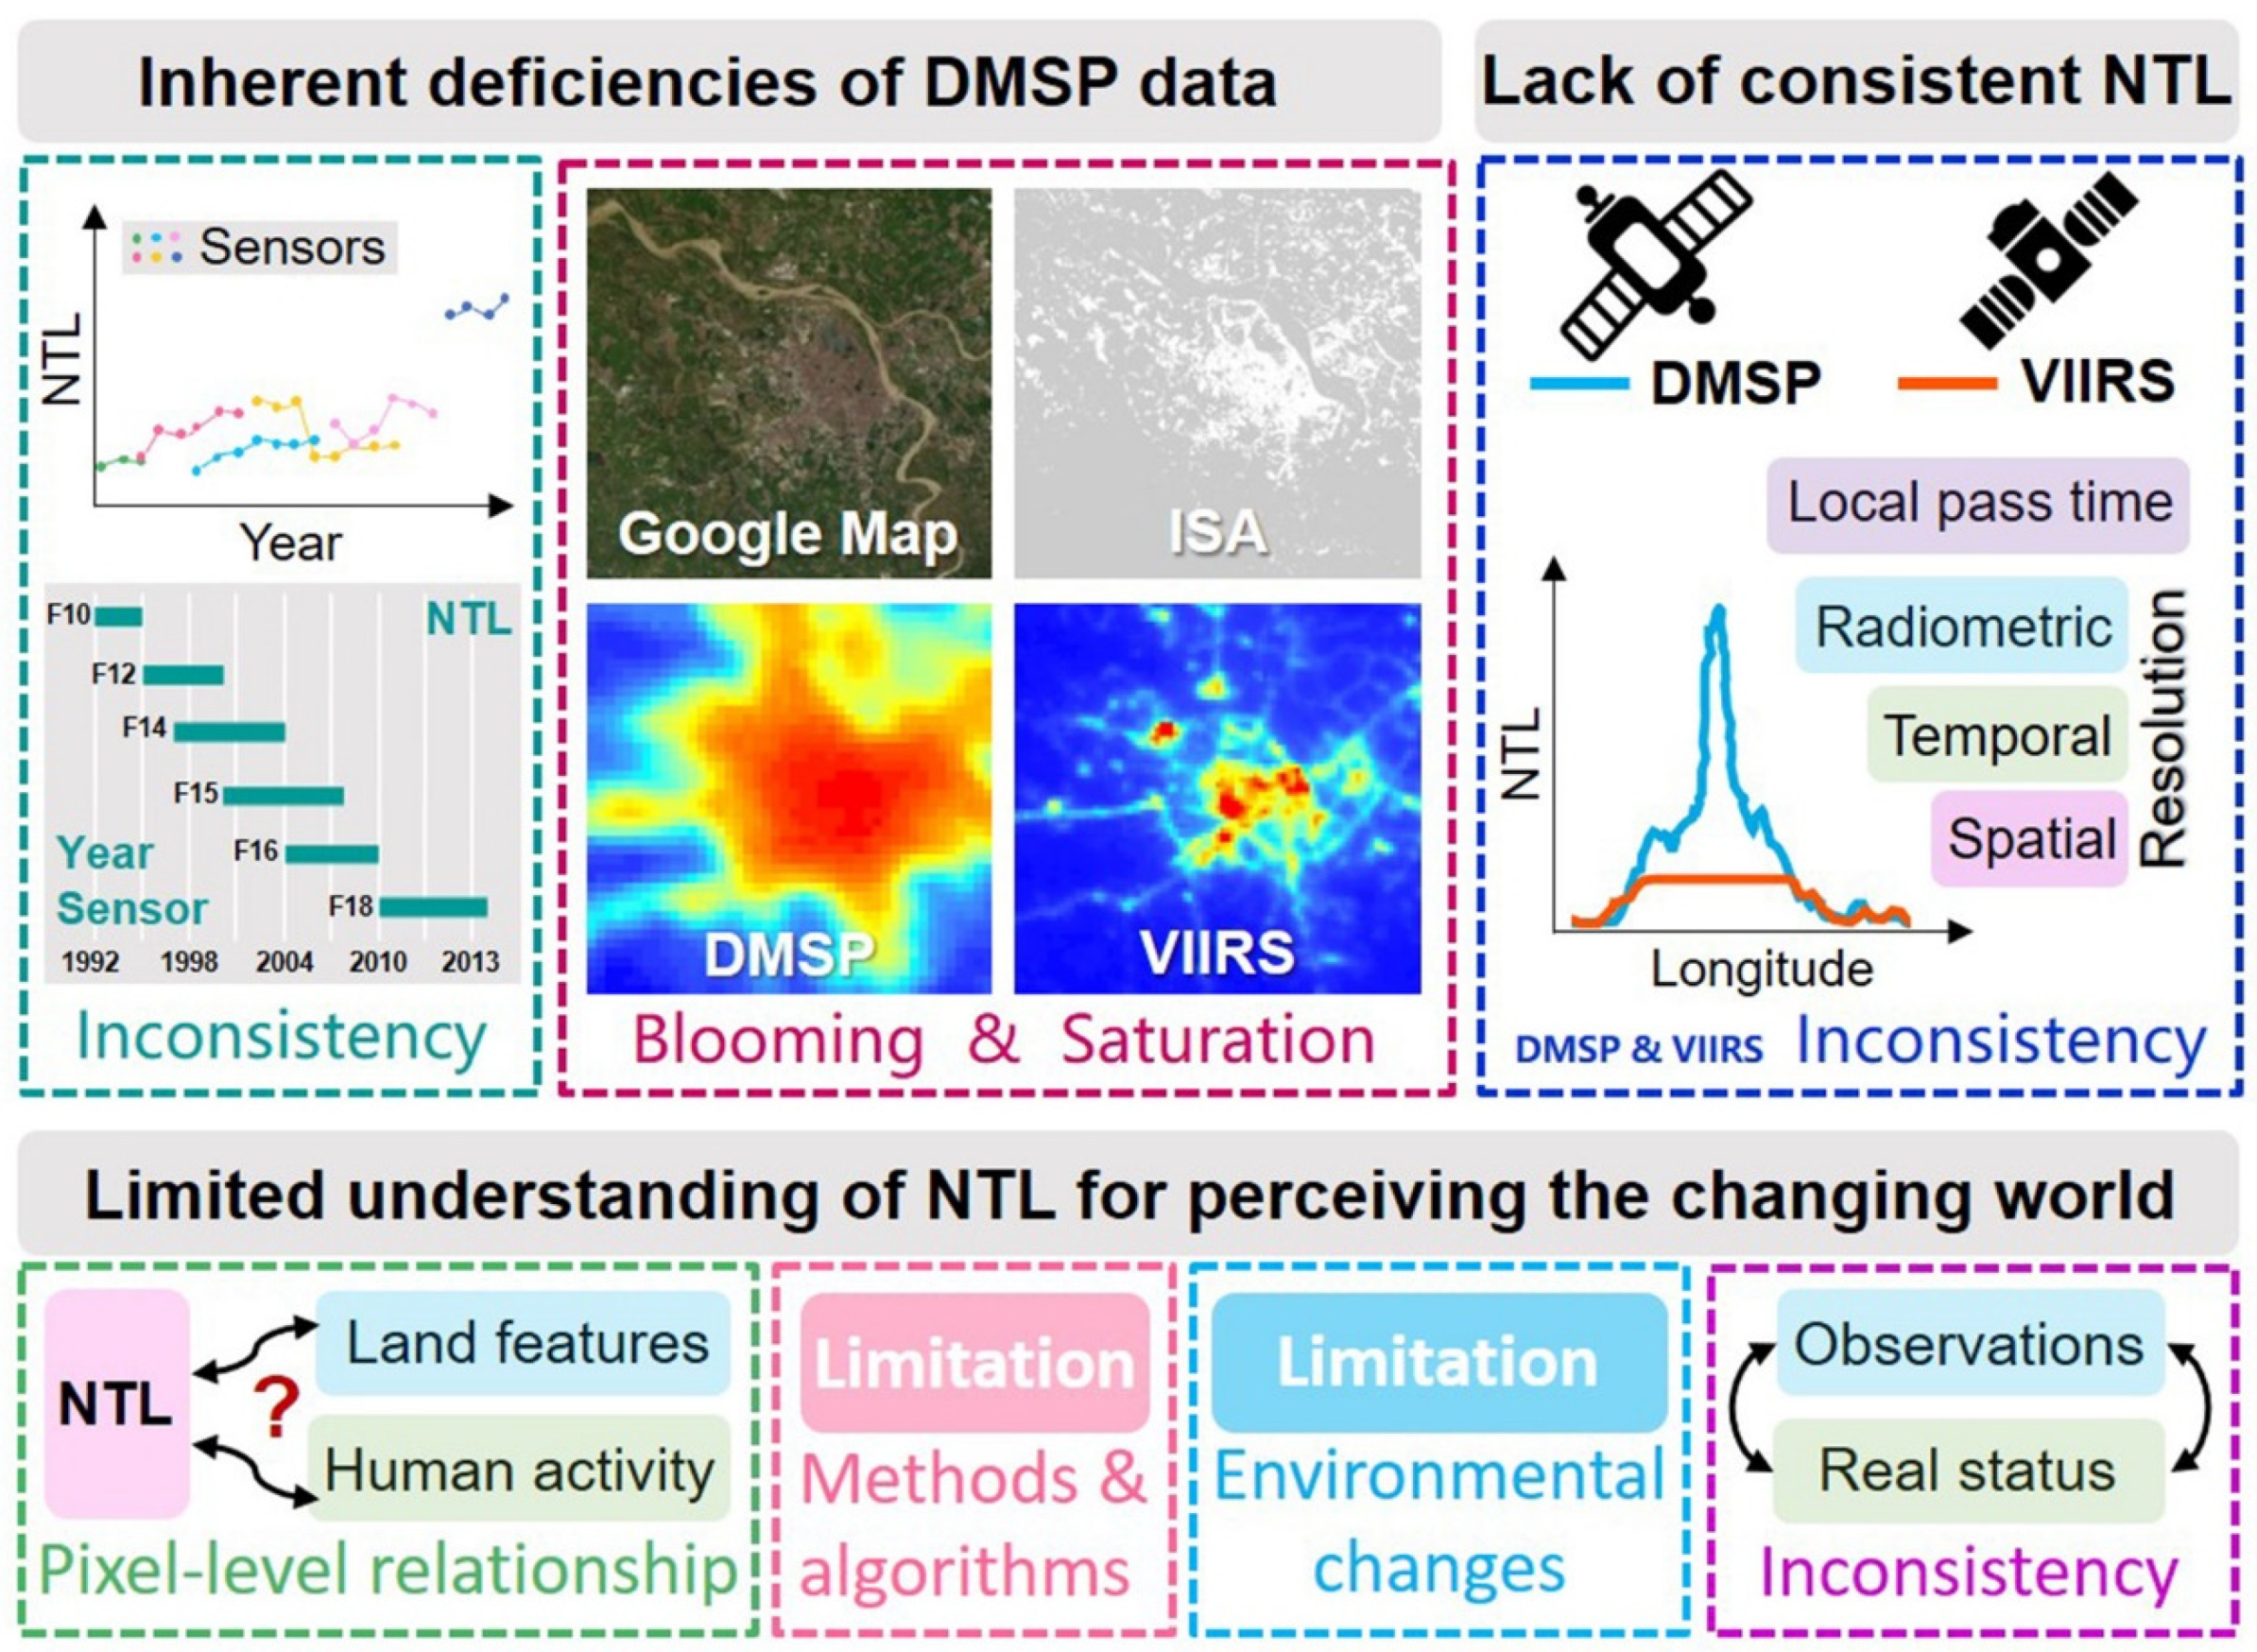
4. Challenges and Limitations of Current Nighttime Light Studies
4.1. Inherent Deficiencies of the Long Time Series of DMSP Data
4.1.1. Inconsistency Among Different DMSP Sensors
4.1.2. Saturation and Blooming Effects of DMSP Data
4.2. Lack of a Long Time Series of Consistent Nighttime Light Observations
4.3. Limited Understanding of Nighttime Lights for Perceiving the Changing World
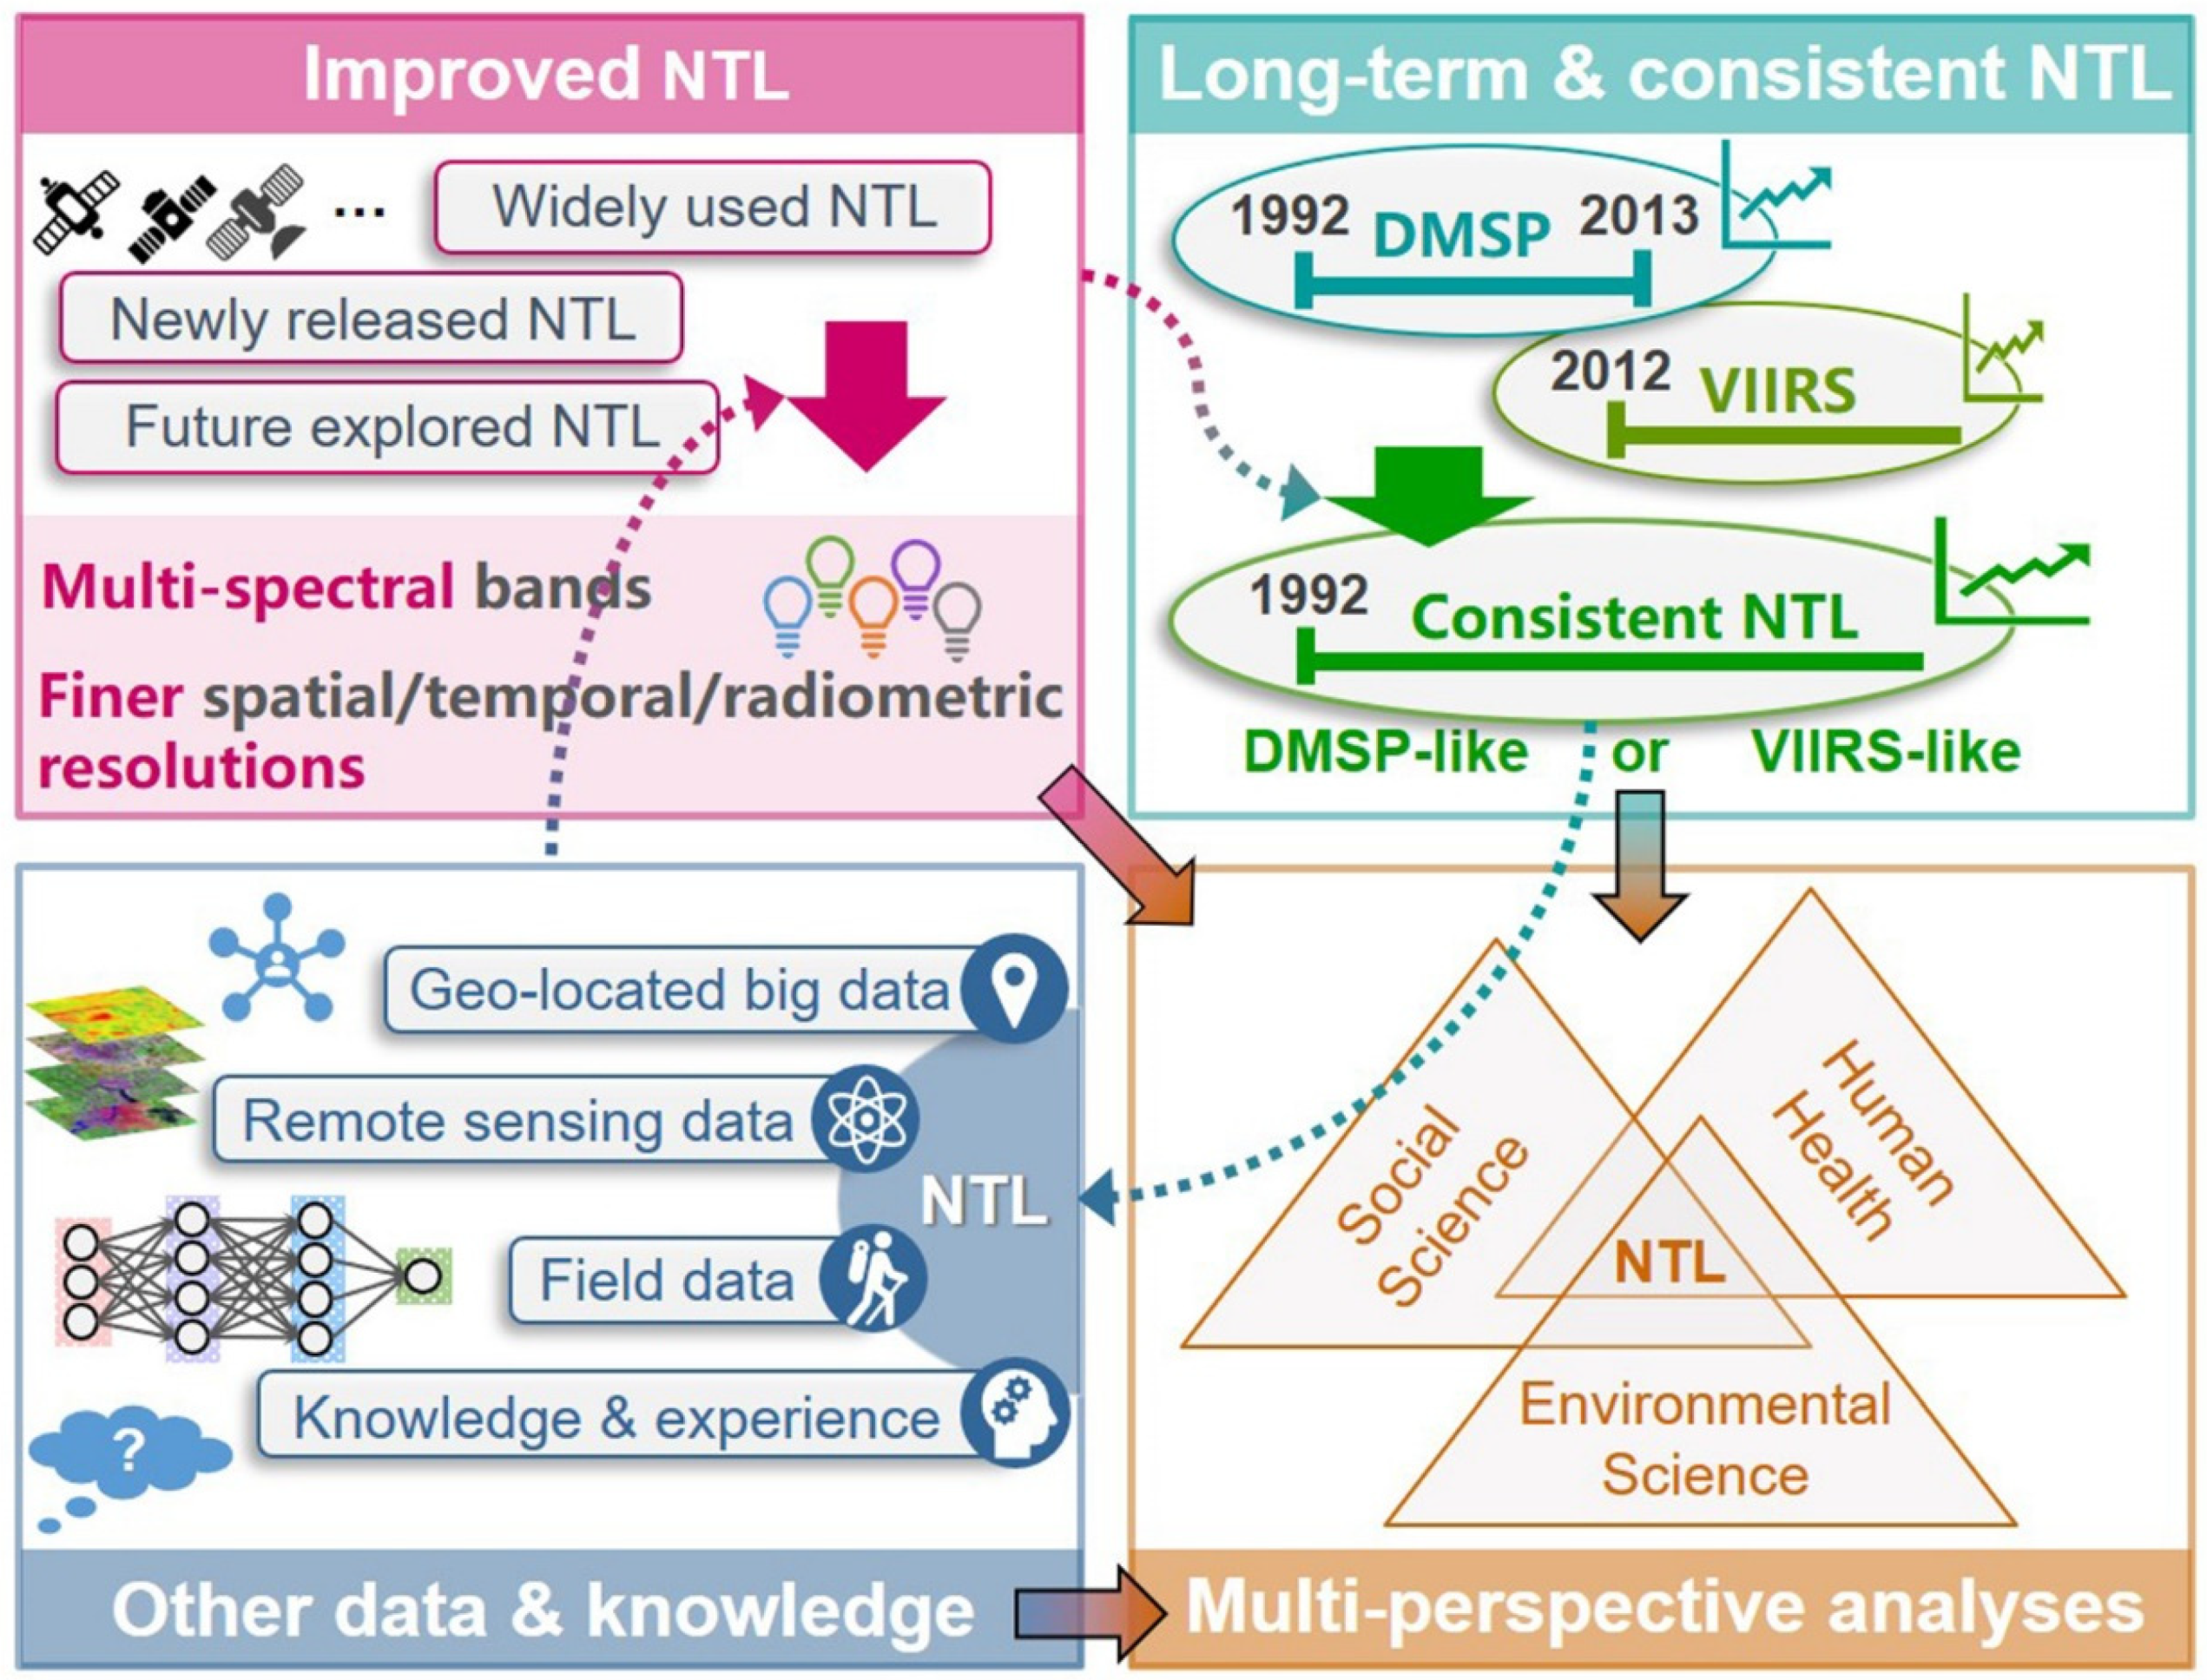
5. Strategic Directions for Nighttime Light Remote Sensing Research
5.1. Improving Nighttime Light Data
5.2. Developing a Long Time Series of Consistent Nighttime Light Data
5.3. Integrating Nighttime Light Observations with Other Data and Knowledge
5.4. Promoting Multidisciplinary and Interdisciplinary Analyses of Nighttime Lights
6. Conclusions
Author Contributions
Funding
Conflicts of Interest
References
- Council, N.R. Understanding the Changing Planet: Strategic Directions for the Geographical Sciences; National Academies Press: Washington, DC, USA, 2010. [Google Scholar]
- Defries, R.S.; Bounoua, L.; Collatz, G.J. Human modification of the landscape and surface climate in the next fifty years. Glob. Chang. Biol. 2002, 8, 438–458. [Google Scholar] [CrossRef]
- Wannebo, A.V.; Sanderson, E.W.; Woolmer, G.; Redford, K.H.; Jaiteh, M.; Levy, M.A. The Human Footprint and the Last of the Wild: The human footprint is a global map of human influence on the land surface, which suggests that human beings are stewards of nature, whether we like it or not. BioScience 2002, 52, 891–904. [Google Scholar]
- Chuvieco, E. Earth Observation of Global Change: The Role of Satellite Remote Sensing in Monitoring the Global Environment; Springer: Berlin/Heidelberg, Germany, 2008. [Google Scholar]
- Elvidge, C.D.; Baugh, K.E.; Anderson, S.J.; Sutton, P.C.; Ghosh, T. The Night Light Development Index (NLDI): A spatially explicit measure of human development from satellite data. Soc. Geogr. 2012, 7, 23–35. [Google Scholar] [CrossRef]
- Chen, X.; Nordhaus, W.D. Using luminosity data as a proxy for economic statistics. Proc. Natl. Acad. Sci. USA 2011, 108, 8589–8594. [Google Scholar] [CrossRef] [PubMed] [Green Version]
- Doll, C.N.H.; Muller, J.-P.; Morley, J.G. Mapping regional economic activity from night-time light satellite imagery. Ecol. Econ. 2006, 57, 75–92. [Google Scholar] [CrossRef]
- He, C.; Shi, P.; Li, J.; Chen, J.; Pan, Y.; Li, J.; Zhuo, L.; Ichinose, T. Restoring urbanization process in China in the 1990s by using non-radiance-calibrated DMSP/OLS nighttime light imagery and statistical data. Chin. Sci. Bull. 2006, 51, 1614–1620. [Google Scholar] [CrossRef]
- Roman, M.O.; Stokes, E.C. Holidays in lights: Tracking cultural patterns in demand for energy services. Earths Future 2015, 3, 182–205. [Google Scholar] [CrossRef]
- Yu, B.; Shi, K.; Hu, Y.; Huang, C.; Chen, Z.; Wu, J. Poverty Evaluation Using NPP-VIIRS Nighttime Light Composite Data at the County Level in China. IEEE J. Sel. Top. Appl. Earth Obs. Remote Sens. 2015, 8, 1217–1229. [Google Scholar] [CrossRef]
- Zheng, Q.; Deng, J.; Jiang, R.; Wang, K.; Xue, X.; Lin, Y.; Huang, Z.; Shen, Z.; Li, J.; Shahtahmassebi, A.R. Monitoring and assessing “ghost cities” in Northeast China from the view of nighttime light remote sensing data. Habitat Int. 2017, 70, 34–42. [Google Scholar] [CrossRef]
- Kamrowski, R.L.; Limpus, C.; Jones, R.; Anderson, S.; Hamann, M. Temporal changes in artificial light exposure of marine turtle nesting areas. Glob. Chang. Biol. 2014, 20, 2437–2449. [Google Scholar] [CrossRef]
- Jiang, W.; He, G.; Leng, W.; Long, T.; Wang, G.; Liu, H.; Peng, Y.; Yin, R.; Guo, H. Characterizing Light Pollution Trends across Protected Areas in China Using Nighttime Light Remote Sensing Data. ISPRS Int. Geo-Inf. 2018, 7, 243. [Google Scholar] [CrossRef]
- Zhao, M.; Cheng, W.; Zhou, C.; Li, M.; Huang, K.; Wang, N. Assessing Spatiotemporal Characteristics of Urbanization Dynamics in Southeast Asia Using Time Series of DMSP/OLS Nighttime Light Data. Remote Sens. 2018, 10, 47. [Google Scholar] [CrossRef]
- Li, X.; Zhou, Y. Urban mapping using DMSP/OLS stable night-time light: A review. Int. J. Remote Sens. 2017, 38, 6030–6046. [Google Scholar] [CrossRef]
- Huang, Q.; Yang, X.; Gao, B.; Yang, Y.; Zhao, Y. Application of DMSP/OLS Nighttime Light Images: A Meta-Analysis and a Systematic Literature Review. Remote Sens. 2014, 6, 6844–6866. [Google Scholar] [CrossRef] [Green Version]
- Hu, K.; Qi, K.; Guan, Q.; Wu, C.; Yu, J.; Qing, Y.; Zheng, J.; Wu, H.; Li, X. A scientometric visualization analysis for night-time light remote sensing research from 1991 to 2016. Remote Sens. 2017, 9, 802. [Google Scholar] [CrossRef]
- Doll, C.N. CIESIN Thematic Guide to Night-Time Light Remote Sensing and Its Applications; Center for International Earth Science Information Network (CIESIN): Palisades, NY, USA, 2008. [Google Scholar]
- Bennett, M.M.; Smith, L.C. Advances in using multitemporal night-time lights satellite imagery to detect, estimate, and monitor socioeconomic dynamics. Remote Sens. Environ. 2017, 192, 176–197. [Google Scholar] [CrossRef]
- Cho, Y.; Ryu, S.H.; Lee, B.R.; Kim, K.H.; Lee, E.; Choi, J. Effects of artificial light at night on human health: A literature review of observational and experimental studies applied to exposure assessment. Chronobiol. Int. 2015, 32, 1294–1310. [Google Scholar] [CrossRef]
- Zhang, Q.; Levin, N.; Chalkias, C.; Letu, H. Nighttime Light Remote Sensing—Monitoring Human Societies from Outer Space; Thenkabail, P.S., Ed.; Taylor & Francis Inc.: Abingdon-on-Thames, UK, 2015; p. 289e310. [Google Scholar]
- Li, D.; Zhao, X.; Li, X. Remote sensing of human beings—A perspective from nighttime light. Geo-Spat. Inf. Sci. 2016, 19, 69–79. [Google Scholar] [CrossRef]
- Elvidge, C.D.; Baugh, K.E.; Dietz, J.B.; Bland, T.; Sutton, P.C.; Kroehl, H.W. Radiance calibration of DMSP-OLS low-light imaging data of human settlements. Remote Sens. Environ. 1999, 68, 77–88. [Google Scholar] [CrossRef]
- Li, X.; Zhou, Y. A stepwise calibration of global DMSP/OLS stable nighttime light data (1992–2013). Remote Sens. 2017, 9, 637. [Google Scholar]
- Baugh, K.; Elvidge, C.D.; Ghosh, T.; Ziskin, D. Development of a 2009 Stable Lights Product using DMSP-OLS data. Proc. Asia-Pac. Adv. Netw. 2010, 30, 114. [Google Scholar] [CrossRef]
- Elvidge, C.D.; Imhoff, M.L.; Baugh, K.E.; Hobson, V.R.; Nelson, I.; Safran, J.; Dietz, J.B.; Tuttle, B.T. Night-time lights of the world: 1994–1995. ISPRS-J. Photogramm. Remote Sens. 2001, 56, 81–99. [Google Scholar] [CrossRef]
- Elvidge, C.D.; Baugh, K.E.; Zhizhin, M.; Hsu, F.-C. Why VIIRS data are superior to DMSP for mapping nighttime lights. Proc. Asia-Pac. Adv. Netw. 2013, 35, 62. [Google Scholar] [CrossRef] [Green Version]
- Elvidge, C.D.; Baugh, K.E.; Kihn, E.A.; Kroehl, H.W.; Davis, E.R. Mapping city lights with nighttime data from the DMSP Operational Linescan System. Photogramm. Eng. Remote Sens. 1997, 63, 727–734. [Google Scholar]
- Ziskin, D.; Baugh, K.; Hsu, F.-C.; Elvidge, C.D. Methods Used For the 2006 Radiance Lights. Proc. Asia-Pac. Adv. Netw. 2010, 30, 131. [Google Scholar] [CrossRef] [Green Version]
- Hsu, F.-C.; Baugh, K.; Ghosh, T.; Zhizhin, M.; Elvidge, C. DMSP-OLS Radiance Calibrated Nighttime Lights Time Series with Intercalibration. Remote Sens. 2015, 7, 1855–1876. [Google Scholar] [CrossRef] [Green Version]
- Waluda, C.; Yamashiro, C.; Elvidge, C.; Hobson, V.; Rodhouse, P. Quantifying light-fishing for Dosidicus gigas in the eastern Pacific using satellite remote sensing. Remote Sens. Environ. 2004, 91, 129–133. [Google Scholar] [CrossRef]
- Badarinath, K.; Sharma, A.; Kharol, S. Forest fire monitoring and burnt area mapping using satellite data: a study over the forest region of Kerala State, India. Int. J. Remote Sens. 2011, 32, 85–102. [Google Scholar] [CrossRef]
- Filho, C.D.S.; Zullo, J., Jr.; Elvidge, C. Brazil’s 2001 energy crisis monitored from space. Int. J. Remote Sens. 2004, 25, 2475–2482. [Google Scholar] [CrossRef]
- Min, B.; Gaba, K. Tracking Electrification in Vietnam Using Nighttime Lights. Remote Sens. 2014, 6, 9511–9529. [Google Scholar] [CrossRef] [Green Version]
- Hillger, D.; Kopp, T.; Lee, T.; Lindsey, D.; Seaman, C.; Miller, S.; Solbrig, J.; Kidder, S.; Bachmeier, S.; Jasmin, T.; et al. First-Light Imagery from Suomi NPP VIIRS. Bull. Am. Meteorol. Soc. 2013, 94, 1019–1029. [Google Scholar] [CrossRef]
- Liao, L.B.; Weiss, S.; Mills, S.; Hauss, B. Suomi NPP VIIRS day-night band on-orbit performance. J. Geophys. Res. Atmos. 2013, 118, 12705–12718. [Google Scholar] [CrossRef]
- Miller, S.; Straka, W.; Mills, S.; Elvidge, C.; Lee, T.; Solbrig, J.; Walther, A.; Heidinger, A.; Weiss, S. Illuminating the Capabilities of the Suomi National Polar-Orbiting Partnership (NPP) Visible Infrared Imaging Radiometer Suite (VIIRS) Day/Night Band. Remote Sens. 2013, 5, 6717–6766. [Google Scholar] [CrossRef] [Green Version]
- Liang, C.K.; Mills, S.; Hauss, B.I.; Miller, S.D. Improved VIIRS day/night band imagery with near-constant contrast. IEEE Trans. Geosci. Remote Sens. 2014, 52, 6964–6971. [Google Scholar] [CrossRef]
- Miller, S.D.; Mills, S.P.; Elvidge, C.D.; Lindsey, D.T.; Lee, T.F.; Hawkins, J.D. Suomi satellite brings to light a unique frontier of nighttime environmental sensing capabilities. Proc. Natl. Acad. Sci. USA 2012, 109, 15706–15711. [Google Scholar] [CrossRef] [PubMed] [Green Version]
- Baugh, K.; Hsu, F.-C.; Elvidge, C.D.; Zhizhin, M. Nighttime Lights Compositing Using the VIIRS Day-Night Band: Preliminary Results. Proc. Asia-Pac. Adv. Netw. 2013, 35, 70. [Google Scholar] [CrossRef] [Green Version]
- Mills, S.; Weiss, S.; Liang, C. VIIRS day/night band (DNB) stray light characterization and correction. In Proceedings of the Earth Observing Systems XVIII, San Diego, CA, USA, 25–29 August 2013. [Google Scholar]
- Elvidge, C.D.; Baugh, K.; Zhizhin, M.; Hsu, F.C.; Ghosh, T. VIIRS night-time lights. Int. J. Remote Sens. 2017, 38, 5860–5879. [Google Scholar] [CrossRef]
- Ma, T.; Zhou, C.; Pei, T.; Haynie, S.; Fan, J. Responses of Suomi-NPP VIIRS-derived nighttime lights to socioeconomic activity in China’s cities. Remote Sens. Lett. 2014, 5, 165–174. [Google Scholar] [CrossRef]
- Zhao, M.; Cheng, W.; Zhou, C.; Li, M.; Wang, N.; Liu, Q. GDP Spatialization and Economic Differences in South China Based on NPP-VIIRS Nighttime Light Imagery. Remote Sens. 2017, 9, 673. [Google Scholar] [CrossRef]
- Li, X.; Xu, H.; Chen, X.; Li, C. Potential of NPP-VIIRS Nighttime Light Imagery for Modeling the Regional Economy of China. Remote Sens. 2013, 5, 3057–3081. [Google Scholar] [CrossRef] [Green Version]
- Shi, K.; Yu, B.; Hu, Y.; Huang, C.; Chen, Y.; Huang, Y.; Chen, Z.; Wu, J. Modeling and mapping total freight traffic in China using NPP-VIIRS nighttime light composite data. GISci. Remote Sens. 2015, 52, 274–289. [Google Scholar] [CrossRef]
- Román, M.O.; Wang, Z.; Shrestha, R.; Yao, T.; Kalb, V. Black Marble User Guide Version 1.0; NASA: Washington, DC, USA, 2019.
- Román, M.O.; Wang, Z.; Sun, Q.; Kalb, V.; Miller, S.D.; Molthan, A.; Schultz, L.; Bell, J.; Stokes, E.C.; Pandey, B.; et al. NASA’s Black Marble nighttime lights product suite. Remote Sens. Environ. 2018, 210, 113–143. [Google Scholar] [CrossRef]
- Wang, Z.; Shrestha, R.; Román, M. NASA’s Black Marble Nighttime Lights Product Suite Algorithm Theoretical Basis Document (ATBD). Version 1.0; 2018. Available online: https://viirsland.gsfc.nasa.gov/PDF/VIIRS_BlackMarble_ATBD_V1.0.pdf (accessed on 10 August 2019).
- Wang, Z.; Román, M.O.; Sun, Q.; Molthan, A.L.; Schultz, L.A.; Kalb, V.L. Monitoring Disaster-Related Power Outages Using Nasa Black Marble Nighttime Light Product. ISPRS Int. Arch. Photogramm. Remote Sens. Spat. Inf. Sci. 2018, XLII-3, 1853–1856. [Google Scholar] [CrossRef]
- Román, M.O.; Stokes, E.C.; Shrestha, R.; Wang, Z.; Schultz, L.; Carlo, E.A.S.; Sun, Q.; Bell, J.; Molthan, A.; Kalb, V. Satellite-based assessment of electricity restoration efforts in Puerto Rico after Hurricane Maria. PLoS ONE 2019, 14, e0218883. [Google Scholar] [CrossRef] [PubMed]
- De Miguel, A.S.; Castaño, J.G.; Zamorano, J.; Pascual, S.; Ángeles, M.; Cayuela, L.; Martinez, G.M.; Challupner, P.; Kyba, C.C. Atlas of astronaut photos of Earth at night. Astron. Geophys. 2014, 55, 4.36. [Google Scholar] [CrossRef]
- Kyba, C.; Garz, S.; Kuechly, H.; de Miguel, A.; Zamorano, J.; Fischer, J.; Hölker, F. High-Resolution Imagery of Earth at Night: New Sources, Opportunities and Challenges. Remote Sens. 2015, 7, 1–23. [Google Scholar] [CrossRef]
- Kotarba, A.Z.; Aleksandrowicz, S. Impervious surface detection with nighttime photography from the International Space Station. Remote Sens. Environ. 2016, 176, 295–307. [Google Scholar] [CrossRef]
- Wicht, M.; Kuffer, M. The continuous built-up area extracted from ISS night-time lights to compare the amount of urban green areas across European cities. Eur. J. Remote Sens. 2019, 52, 58–73. [Google Scholar] [CrossRef]
- Kuffer, M.; Sliuzas, R.; van Maarseveen, M.; Pfeffer, K.; Baud, I. City nighttime light variations using ISS images. In Proceedings of the 2017 Joint Urban Remote Sensing Event (JURSE), Dubai, UAE, 6–8 March 2017; pp. 1–4. [Google Scholar]
- Metcalf, J.P. Detecting and Characterizing Nighttime Lighting Using Multispectral and Hyperspectral Imaging; Naval Postgraduate School: Monterey, CA, USA, 2012. [Google Scholar]
- Mazor, T.; Levin, N.; Possingham, H.P.; Levy, Y.; Rocchini, D.; Richardson, A.J.; Kark, S. Can satellite-based night lights be used for conservation? The case of nesting sea turtles in the Mediterranean. Biol. Conserv. 2013, 159, 63–72. [Google Scholar] [CrossRef] [Green Version]
- Pauwels, J.; Le Viol, I.; Azam, C.; Valet, N.; Julien, J.F.; Bas, Y.; Lemarchand, C.; Sanchez de Miguel, A.; Kerbiriou, C. Accounting for artificial light impact on bat activity for a biodiversity-friendly urban planning. Landsc. Urban Plan. 2019, 183, 12–25. [Google Scholar] [CrossRef]
- Levin, N.; Duke, Y. High spatial resolution night-time light images for demographic and socio-economic studies. Remote Sens. Environ. 2012, 119, 1–10. [Google Scholar] [CrossRef]
- Li, K.; Chen, Y.; Li, Y. The Random Forest-Based Method of Fine-Resolution Population Spatialization by Using the International Space Station Nighttime Photography and Social Sensing Data. Remote Sens. 2018, 10, 1650. [Google Scholar] [CrossRef]
- Kuffer, M.; Pfeffer, K.; Sliuzas, R.; Taubenböck, H.; Baud, I.; van Maarseveen, M. Capturing the urban divide in nighttime light images from the International Space Station. IEEE J. Sel. Top. Appl. Earth Obs. Remote Sens. 2018, 11, 2578–2586. [Google Scholar] [CrossRef]
- Levin, N.; Johansen, K.; Hacker, J.M.; Phinn, S. A new source for high spatial resolution night time images—The EROS-B commercial satellite. Remote Sens. Environ. 2014, 149, 1–12. [Google Scholar] [CrossRef]
- Zheng, Q.; Weng, Q.; Huang, L.; Wang, K.; Deng, J.; Jiang, R.; Ye, Z.; Gan, M. A new source of multi-spectral high spatial resolution night-time light imagery—JL1-3B. Remote Sens. Environ. 2018, 215, 300–312. [Google Scholar] [CrossRef]
- Van Doren, B.M.; Horton, K.G.; Dokter, A.M.; Klinck, H.; Elbin, S.B.; Farnsworth, A. High-intensity urban light installation dramatically alters nocturnal bird migration. Proc. Natl. Acad. Sci. USA 2017, 114, 11175–11180. [Google Scholar] [CrossRef] [PubMed] [Green Version]
- Walczak, K.; Gyuk, G.; Kruger, A.; Byers, E.; Huerta, S. Nitesat: A high resolution, full-color, light pollution imaging satellite mission. Int. J. Sustain. Lighting 2017, 19, 48–55. [Google Scholar] [CrossRef]
- Li, X.; Li, X.; Li, D.; He, X.; Jendryke, M. A preliminary investigation of Luojia-1 night-time light imagery. Remote Sens. Lett. 2019, 10, 526–535. [Google Scholar] [CrossRef]
- Jiang, W.; He, G.; Long, T.; Guo, H.; Yin, R.; Leng, W.; Liu, H.; Wang, G. Potentiality of Using Luojia 1-01 Nighttime Light Imagery to Investigate Artificial Light Pollution. Sensors 2018, 18, 2900. [Google Scholar] [CrossRef]
- Li, X.; Zhao, L.; Li, D.; Xu, H. Mapping Urban Extent Using Luojia 1-01 Nighttime Light Imagery. Sensors 2018, 18, 3665. [Google Scholar] [CrossRef]
- Pack, D.W.; Hardy, B.S. CubeSat Nighttime Lights. In Proceedings of the 30th Annual AIAA/USU Conference on Small Satellites, Logan, UT, USA, 6–11 August 2016. [Google Scholar]
- Zhou, Y.; Smith, S.J.; Elvidge, C.D.; Zhao, K.; Thomson, A.; Imhoff, M. A cluster-based method to map urban area from DMSP/OLS nightlights. Remote Sens. Environ. 2014, 147, 173–185. [Google Scholar] [CrossRef]
- Zhou, Y.; Smith, S.J.; Zhao, K.; Imhoff, M.; Thomson, A.; Bond-Lamberty, B.; Asrar, G.R.; Zhang, X.; He, C.; Elvidge, C.D. A global map of urban extent from nightlights. Environ. Res. Lett. 2015, 10, 054011. [Google Scholar] [CrossRef]
- Sharma, R.C.; Tateishi, R.; Hara, K.; Gharechelou, S.; Iizuka, K. Global mapping of urban built-up areas of year 2014 by combining MODIS multispectral data with VIIRS nighttime light data. Int. J. Digit. Earth 2016, 9, 1004–1020. [Google Scholar] [CrossRef]
- He, C.; Liu, Z.; Gou, S.; Zhang, Q.; Zhang, J.; Xu, L. Detecting global urban expansion over the last three decades using a fully convolutional network. Environ. Res. Lett. 2019, 14, 034008. [Google Scholar] [CrossRef]
- Zhou, Y.; Li, X.; Asrar, G.R.; Smith, S.J.; Imhoff, M. A global record of annual urban dynamics (1992–2013) from nighttime lights. Remote Sens. Environ. 2018, 219, 206–220. [Google Scholar] [CrossRef]
- Chen, Z.; Yu, B.; Zhou, Y.; Liu, H.; Yang, C.; Shi, K.; Wu, J. Mapping Global Urban Areas From 2000 to 2012 Using Time-Series Nighttime Light Data and MODIS Products. IEEE J. Sel. Top. Appl. Earth Obs. Remote Sens. 2019, 12, 1143–1153. [Google Scholar] [CrossRef]
- Liu, Z.; He, C.; Zhou, Y.; Wu, J. How much of the world’s land has been urbanized, really? A hierarchical framework for avoiding confusion. Landsc. Ecol. 2014, 29, 763–771. [Google Scholar] [CrossRef]
- Roy Chowdhury, P.; Maithani, S. Monitoring growth of built-up areas in indo-gangetic plain using multi-sensor remote sensing data. J. Indian Soc. Remote Sens. 2010, 38, 291–300. [Google Scholar] [CrossRef]
- Shi, K.; Huang, C.; Yu, B.; Yin, B.; Huang, Y.; Wu, J. Evaluation of NPP-VIIRS night-time light composite data for extracting built-up urban areas. Remote Sens. Lett. 2014, 5, 358–366. [Google Scholar] [CrossRef]
- Xie, Y.; Weng, Q. Updating urban extents with nighttime light imagery by using an object-based thresholding method. Remote Sens. Environ. 2016, 187, 1–13. [Google Scholar] [CrossRef]
- Zhang, J.; Zhou, Z.; Shuai, G.; Liu, H. Support vector data description model to map urban extent from National Polar-Orbiting Partnership Satellite–Visible Infrared Imaging Radiometer Suite nightlights and normalized difference vegetation index. J. Appl. Remote Sens. 2016, 10, 026012. [Google Scholar] [CrossRef]
- Henderson, M.; Yeh, E.T.; Gong, P.; Elvidge, C.; Baugh, K. Validation of urban boundaries derived from global night-time satellite imagery. Int. J. Remote Sens. 2003, 24, 595–609. [Google Scholar] [CrossRef]
- Ju, C.; Zhou, X.; He, Q. On the application of a concentric zone model (CZM) for classifying and extracting urban boundaries using night-time stable light data in Urumqi of Xinjiang, China. Remote Sens. Lett. 2016, 7, 1033–1042. [Google Scholar] [CrossRef]
- Sutton, P.C.; Anderson, S.J.; Elvidge, C.D.; Tuttle, B.T.; Ghosh, T. Paving the planet: Impervious surface as proxy measure of the human ecological footprint. Prog. Phys. Geogr. Earth Environ. 2009, 33, 510–527. [Google Scholar] [CrossRef]
- Ma, Q.; He, C.; Wu, J.; Liu, Z.; Zhang, Q.; Sun, Z. Quantifying spatiotemporal patterns of urban impervious surfaces in China: An improved assessment using nighttime light data. Landsc. Urban Plan. 2014, 130, 36–49. [Google Scholar] [CrossRef]
- Imhoff, M.L.; Lawrence, W.T.; Stutzer, D.C.; Elvidge, C.D. A technique for using composite DMSP/OLS “city lights” satellite data to map urban area. Remote Sens. Environ. 1997, 61, 361–370. [Google Scholar] [CrossRef]
- Liu, Z.; He, C.; Zhang, Q.; Huang, Q.; Yang, Y. Extracting the dynamics of urban expansion in China using DMSP-OLS nighttime light data from 1992 to 2008. Landsc. Urban Plan. 2012, 106, 62–72. [Google Scholar] [CrossRef]
- Cao, X.; Chen, J.; Imura, H.; Higashi, O. A SVM-based method to extract urban areas from DMSP-OLS and SPOT VGT data. Remote Sens. Environ. 2009, 113, 2205–2209. [Google Scholar] [CrossRef]
- Jing, W.; Yang, Y.; Yue, X.; Zhao, X. Mapping Urban Areas with Integration of DMSP/OLS Nighttime Light and MODIS Data Using Machine Learning Techniques. Remote Sens. 2015, 7, 12419–12439. [Google Scholar] [CrossRef] [Green Version]
- Lu, D.; Tian, H.; Zhou, G.; Ge, H. Regional mapping of human settlements in southeastern China with multisensor remotely sensed data. Remote Sens. Environ. 2008, 112, 3668–3679. [Google Scholar] [CrossRef]
- Dou, Y.; Liu, Z.; He, C.; Yue, H. Urban Land Extraction Using VIIRS Nighttime Light Data: An Evaluation of Three Popular Methods. Remote Sens. 2017, 9, 175. [Google Scholar] [CrossRef]
- Lo, C. Modeling the population of China using DMSP operational linescan system nighttime data. Photogramm. Eng. Remote Sens. 2001, 67, 1037–1047. [Google Scholar]
- Zhuo, L.; Ichinose, T.; Zheng, J.; Chen, J.; Shi, P.J.; Li, X. Modelling the population density of China at the pixel level based on DMSP/OLS non-radiance-calibrated night-time light images. Int. J. Remote Sens. 2009, 30, 1003–1018. [Google Scholar] [CrossRef]
- Sutton, P.C.; Elvidge, C.D.; Ghosh, T. Estimation of gross domestic product at sub-national scales using nighttime satellite imagery. Int. J. Ecol. Econ. Stat. 2007, 8, 5–21. [Google Scholar]
- Ebener, S.; Murray, C.; Tandon, A.; Elvidge, C.C. From wealth to health: modelling the distribution of income per capita at the sub-national level using night-time light imagery. Int. J. Health Geogr. 2005, 4, 5. [Google Scholar] [CrossRef]
- Takahashi, K.I.; Terakado, R.; Nakamura, J.; Daigo, I.; Matsuno, Y.; Adachi, Y. In-Use Stock of Copper Analysis Using Satellite Nighttime Light Observation Data. Mater. Trans. 2009, 50, 1871–1874. [Google Scholar] [CrossRef] [Green Version]
- Tian, J.; Zhao, N.; Samson, E.L.; Wang, S. Brightness of nighttime lights as a proxy for freight traffic: A case study of China. IEEE J. Sel. Top. Appl. Earth Obs. Remote Sens. 2014, 7, 206–212. [Google Scholar] [CrossRef]
- Zhu, X.; Ma, M.; Yang, H.; Ge, W. Modeling the Spatiotemporal Dynamics of Gross Domestic Product in China Using Extended Temporal Coverage Nighttime Light Data. Remote Sens. 2017, 9, 626. [Google Scholar] [CrossRef]
- Lal-Tabak, A. Identifying Bias in Luminosity-Based Estimation: A Local Level Assessment of Night Light Data as a Proxy for Economic Activity; Northwestern University: Evanston, IL, USA, 2019. [Google Scholar]
- Ghosh, T.; Powell, R.L.; Elvidge, C.D.; Baugh, K.E.; Sutton, P.C.; Anderson, S. Shedding light on the global distribution of economic activity. Open Geogr. J. 2010, 3, 147–160. [Google Scholar]
- Bennie, J.; Davies, T.W.; Inger, R.; Gaston, K.J.; Chisholm, R. Mapping artificial lightscapes for ecological studies. Methods Ecol. Evol. 2014, 5, 534–540. [Google Scholar] [CrossRef]
- Henderson, J.V.; Storeygard, A.; Weil, D.N. Measuring Economic Growth from Outer Space. Am. Econ. Rev. 2012, 102, 994–1028. [Google Scholar] [CrossRef] [PubMed]
- Xu, H.; Yang, H.; Li, X.; Jin, H.; Li, D. Multi-Scale Measurement of Regional Inequality in Mainland China during 2005–2010 Using DMSP/OLS Night Light Imagery and Population Density Grid Data. Sustainability 2015, 7, 13469–13499. [Google Scholar] [CrossRef]
- Zhou, Y.; Ma, T.; Zhou, C.; Xu, T. Nighttime Light Derived Assessment of Regional Inequality of Socioeconomic Development in China. Remote Sens. 2015, 7, 1242–1262. [Google Scholar] [CrossRef] [Green Version]
- Ge, W.; Yang, H.; Zhu, X.; Ma, M.; Yang, Y. Ghost City Extraction and Rate Estimation in China Based on NPP-VIIRS Night-Time Light Data. ISPRS Int. Geo-Inf. 2018, 7, 219. [Google Scholar] [CrossRef]
- Elvidge, C.D.; Sutton, P.C.; Ghosh, T.; Tuttle, B.T.; Baugh, K.E.; Bhaduri, B.; Bright, E. A global poverty map derived from satellite data. Comput. Geosci. 2009, 35, 1652–1660. [Google Scholar] [CrossRef]
- Wang, W.; Cheng, H.; Zhang, L. Poverty assessment using DMSP/OLS night-time light satellite imagery at a provincial scale in China. Adv. Space Res. 2012, 49, 1253–1264. [Google Scholar] [CrossRef]
- Jean, N.; Burke, M.; Xie, M.; Davis, W.M.; Lobell, D.B.; Ermon, S. Combining satellite imagery and machine learning to predict poverty. Science 2016, 353, 790–794. [Google Scholar] [CrossRef] [PubMed] [Green Version]
- Henderson, J.V.; Squires, T.L.; Storeygard, A.; Weil, D.N. The Global Spatial Distribution of Economic Activity: Nature, History, and the Role of Trade; National Bureau of Economic Research: Cambridge, MA, USA, 2016. [Google Scholar]
- Ma, T.; Zhou, Y.; Wang, Y.; Zhou, C.; Haynie, S.; Xu, T. Diverse relationships between Suomi-NPP VIIRS night-time light and multi-scale socioeconomic activity. Remote Sens. Lett. 2014, 5, 652–661. [Google Scholar] [CrossRef]
- Doll, C.H.; Muller, J.-P.; Elvidge, C.D. Night-time imagery as a tool for global mapping of socioeconomic parameters and greenhouse gas emissions. AMBIO 2000, 29, 157–162. [Google Scholar] [CrossRef]
- Ma, T. An estimate of the pixel-level connection between Visible Infrared Imaging Radiometer Suite Day/Night Band (VIIRS DNB) nighttime lights and land features across China. Remote Sens. 2018, 10, 723. [Google Scholar] [CrossRef]
- Ma, T. Quantitative responses of satellite-derived nighttime lighting signals to anthropogenic land-use and land-cover changes across China. Remote Sens. 2018, 10, 1447. [Google Scholar] [CrossRef]
- Keola, S.; Andersson, M.; Hall, O. Monitoring economic development from space: using nighttime light and land cover data to measure economic growth. World Dev. 2015, 66, 322–334. [Google Scholar] [CrossRef]
- Ma, T. Multi-Level Relationships between Satellite-Derived Nighttime Lighting Signals and Social Media–Derived Human Population Dynamics. Remote Sens. 2018, 10, 1128. [Google Scholar] [CrossRef]
- Li, X.; Chen, F.; Chen, X. Satellite-observed nighttime light variation as evidence for global armed conflicts. IEEE J. Sel. Top. Appl. Earth Obs. Remote Sens. 2013, 6, 2302–2315. [Google Scholar] [CrossRef]
- Li, X.; Li, D. Can night-time light images play a role in evaluating the Syrian Crisis? Int. J. Remote Sens. 2014, 35, 6648–6661. [Google Scholar] [CrossRef]
- Li, X.; Li, D.; Xu, H.; Wu, C. Intercalibration between DMSP/OLS and VIIRS night-time light images to evaluate city light dynamics of Syria’s major human settlement during Syrian Civil War. Int. J. Remote Sens. 2017, 38, 5934–5951. [Google Scholar] [CrossRef]
- Jiang, W.; He, G.; Long, T.; Liu, H. Ongoing conflict makes Yemen dark: From the perspective of nighttime light. Remote Sens. 2017, 9, 798. [Google Scholar] [CrossRef]
- Li, X.; Zhang, R.; Huang, C.; Li, D. Detecting 2014 Northern Iraq Insurgency using night-time light imagery. Int. J. Remote Sens. 2015, 36, 3446–3458. [Google Scholar] [CrossRef]
- Li, X.; Liu, S.; Jendryke, M.; Li, D.; Wu, C. Night-Time Light Dynamics during the Iraqi Civil War. Remote Sens. 2018, 10, 858. [Google Scholar] [CrossRef]
- Gillespie, T.W.; Frankenberg, E.; Fung Chum, K.; Thomas, D. Night-time lights time series of tsunami damage, recovery, and economic metrics in Sumatra, Indonesia. Remote Sens. Lett. 2014, 5, 286–294. [Google Scholar] [CrossRef] [Green Version]
- Elliott, R.J.R.; Strobl, E.; Sun, P. The local impact of typhoons on economic activity in China: A view from outer space. J. Urban Econ. 2015, 88, 50–66. [Google Scholar] [CrossRef]
- Olshansky, R.B.; Hopkins, L.D.; Johnson, L.A. Disaster and recovery: Processes compressed in time. Nat. Hazards Rev. 2012, 13, 173–178. [Google Scholar] [CrossRef]
- Cao, C.; Shao, X.; Uprety, S. Detecting light outages after severe storms using the S-NPP/VIIRS day/night band radiances. IEEE Geosci. Remote Sens. Lett. 2013, 10, 1582–1586. [Google Scholar] [CrossRef]
- Zhao, X.; Yu, B.; Liu, Y.; Yao, S.; Lian, T.; Chen, L.; Yang, C.; Chen, Z.; Wu, J. NPP-VIIRS DNB Daily Data in Natural Disaster Assessment: Evidence from Selected Case Studies. Remote Sens. 2018, 10, 1526. [Google Scholar] [CrossRef]
- Croft, T.A. Nighttime images of the earth from space. Sci. Am. 1978, 239, 86–101. [Google Scholar] [CrossRef]
- Kiyofuji, H.; Saitoh, S.-I. Use of nighttime visible images to detect Japanese common squid Todarodes pacificus fishing areas and potential migration routes in the Sea of Japan. Mar. Ecol. Prog. Ser. 2004, 276, 173–186. [Google Scholar] [CrossRef]
- Cho, K.; Ito, R.; Shimoda, H.; Sakata, T. Technical note and cover Fishing fleet lights and sea surface temperature distribution observed by DMSP/OLS sensor. Int. J. Remote Sens. 1999, 20, 3–9. [Google Scholar] [CrossRef]
- Waluda, C.M.; Griffiths, H.J.; Rodhouse, P.G. Remotely sensed spatial dynamics of the Illex argentinus fishery, Southwest Atlantic. Fish Res. 2008, 91, 196–202. [Google Scholar] [CrossRef]
- Waluda, C.M.; Trathan, P.N.; Elvidge, C.D.; Hobson, V.R.; Rodhouse, P.G. Throwing light on straddling stocks of Illex argentinus: Assessing fishing intensity with satellite imagery. Can. J. Fish. Aquat. Sci. 2002, 59, 592–596. [Google Scholar] [CrossRef]
- Paulino, C.; Aroni, E.; Xu, H.; Alburqueque, E.; Demarcq, H. Use of nighttime visible images in the study of the spatial and temporal variability of fishing areas of jumbo flying squid (Dosidicus gigas) outside Peruvian EEZ 2004–2015. Fish Res. 2017, 191, 144–153. [Google Scholar] [CrossRef]
- Elvidge, C.; Zhizhin, M.; Baugh, K.; Hsu, F.-C. Automatic Boat Identification System for VIIRS Low Light Imaging Data. Remote Sens. 2015, 7, 3020–3036. [Google Scholar] [CrossRef] [Green Version]
- Geronimo, R.; Franklin, E.; Brainard, R.; Elvidge, C.; Santos, M.; Venegas, R.; Mora, C. Mapping Fishing Activities and Suitable Fishing Grounds Using Nighttime Satellite Images and Maximum Entropy Modelling. Remote Sens. 2018, 10, 1604. [Google Scholar] [CrossRef]
- Syarifudin, U.; Salman, D.; Alam Ali, S. Application of Viirs-Dnb Satellite Data to Detect Ship Distribution Patterns, Fishing Activity Index and Planning Instrument of Pelagic Capture Fisheries in Bone Bay Waters. Int. J. Sci. Res. 2017, 6, 693–702. [Google Scholar]
- Elvidge, C.D.; Ghosh, T.; Baugh, K.; Zhizhin, M.; Hsu, F.-C.; Katada, N.S.; Penalosa, W.; Hung, B.Q. Rating the Effectiveness of Fishery Closures with Visible Infrared Imaging Radiometer Suite Boat Detection Data. Front. Mar. Sci. 2018, 5, 132. [Google Scholar] [CrossRef]
- Liu, Y.; Saitoh, S.-I.; Hirawake, T. Detection of squid and pacific saury fishing vessels around Japan using VIIRS Day/Night Band image. Proc. Asia-Pac. Adv. Netw. 2015, 39, 28–39. [Google Scholar] [CrossRef]
- Cabral, R.B.; Mayorga, J.; Clemence, M.; Lynham, J.; Koeshendrajana, S.; Muawanah, U.; Nugroho, D.; Anna, Z.; Mira; Ghofar, A.; et al. Rapid and lasting gains from solving illegal fishing. Nat. Ecol. Evol. 2018, 2, 650–658. [Google Scholar] [CrossRef] [PubMed]
- Elvidge, C.D.; Baugh, K.; Zhizhin, M.; Hsu, F.; Ghosh, T. Supporting international efforts for detecting illegal fishing and GAS flaring using viirs. In Proceedings of the 2017 IEEE International Geoscience and Remote Sensing Symposium (IGARSS), Fort Worth, TX, USA, 23–28 July 2017; pp. 2802–2805. [Google Scholar]
- Hsu, F.-C.; Elvidge, C.D.; Baugh, K.; Zhizhin, M.; Ghosh, T.; Kroodsma, D.; Susanto, A.; Budy, W.; Riyanto, M.; Nurzeha, R. Cross-Matching VIIRS Boat Detections with Vessel Monitoring System Tracks in Indonesia. Remote Sens. 2019, 11, 995. [Google Scholar] [CrossRef]
- Amaral, S.; Câmara, G.; Monteiro, A.M.V.; Quintanilha, J.A.; Elvidge, C.D. Estimating population and energy consumption in Brazilian Amazonia using DMSP night-time satellite data. Comput. Environ. Urban Syst. 2005, 29, 179–195. [Google Scholar] [CrossRef]
- Malte, M.; Nicolai, M.; William, H.; Raper, S.C.B.; Katja, F.; Reto, K.; Frame, D.J.; Allen, M.R. Greenhouse-gas emission targets for limiting global warming to 2 degrees C. Nature 2009, 458, 1158–1162. [Google Scholar]
- Ou, J.; Liu, X.; Li, X.; Chen, Y. Quantifying the relationship between urban forms and carbon emissions using panel data analysis. Landsc. Ecol. 2013, 28, 1889–1907. [Google Scholar] [CrossRef]
- Elvidge, C.D.; Baugh, K.E.; Kihn, E.A.; Kroehl, H.W.; Davis, E.R.; Davis, C.W. Relation between satellite observed visible-near infrared emissions, population, economic activity and electric power consumption. Int. J. Remote Sens. 1997, 18, 1373–1379. [Google Scholar] [CrossRef]
- Shi, K.; Yu, B.; Huang, Y.; Hu, Y.; Yin, B.; Chen, Z.; Chen, L.; Wu, J. Evaluating the Ability of NPP-VIIRS Nighttime Light Data to Estimate the Gross Domestic Product and the Electric Power Consumption of China at Multiple Scales: A Comparison with DMSP-OLS Data. Remote Sens. 2014, 6, 1705–1724. [Google Scholar] [CrossRef] [Green Version]
- Chand, T.R.K.; Badarinath, K.V.S.; Elvidge, C.D.; Tuttle, B.T. Spatial characterization of electrical power consumption patterns over India using temporal DMSP-OLS night-time satellite data. Int. J. Remote Sens. 2009, 30, 647–661. [Google Scholar] [CrossRef]
- Oda, T.; Maksyutov, S. A very high-resolution (1 km × 1 km) global fossil fuel CO2 emission inventory derived using a point source database and satellite observations of nighttime lights. Atmos. Chem. Phys. 2011, 11, 543–556. [Google Scholar] [CrossRef]
- Ghosh, T.; Elvidge, C.D.; Sutton, P.C.; Baugh, K.E.; Ziskin, D.; Tuttle, B.T. Creating a Global Grid of Distributed Fossil Fuel CO2 Emissions from Nighttime Satellite Imagery. Energies 2010, 3, 1895–1913. [Google Scholar] [CrossRef]
- Shi, K.; Chen, Y.; Li, L.; Huang, C. Spatiotemporal variations of urban CO2 emissions in China: A multiscale perspective. Appl. Energy 2018, 211, 218–229. [Google Scholar] [CrossRef]
- Townsend, A.C.; Bruce, D.A. The use of night-time lights satellite imagery as a measure of Australia’s regional electricity consumption and population distribution. Int. J. Remote Sens. 2010, 31, 4459–4480. [Google Scholar] [CrossRef]
- Xie, Y.; Weng, Q. World energy consumption pattern as revealed by DMSP-OLS nighttime light imagery. GISci. Remote Sens. 2015, 53, 265–282. [Google Scholar] [CrossRef]
- Zhizhin, M.N.; Elvidge, C.; Baugh, K.; Hsu, F.C. Five years of gas flaring by country, oil field or flare observed by the Suomi NPP satellite. In Proceedings of the AGU Fall Meeting, San Francisco, CA, USA, 12–16 December 2016. [Google Scholar]
- Shi, K.; Chen, Y.; Yu, B.; Xu, T.; Yang, C.; Li, L.; Huang, C.; Chen, Z.; Liu, R.; Wu, J. Detecting spatiotemporal dynamics of global electric power consumption using DMSP-OLS nighttime stable light data. Appl. Energy 2016, 184, 450–463. [Google Scholar] [CrossRef]
- Letu, H.; Hara, M.; Tana, G.; Nishio, F. A saturated light correction method for DMSP/OLS nighttime satellite imagery. IEEE Trans. Geosci. Remote Sens. 2012, 50, 389–396. [Google Scholar] [CrossRef]
- Entekhabi, D.; Letu, H.; Bao, Y.; Tana, G.; Hara, M.; Nishio, F.; Honda, Y.; Sawada, H.; Shi, J.; Oki, T. Relationship between DMSP/OLS nighttime light and CO2 emission from electric power plant. Land Surf. Remote Sens. 2012, 8524, 85242G. [Google Scholar]
- Ou, J.; Liu, X.; Li, X.; Shi, X. Mapping Global Fossil Fuel Combustion CO2 Emissions at High Resolution by Integrating Nightlight, Population Density, and Traffic Network Data. IEEE J. Sel. Top. Appl. Earth Obs. Remote Sens. 2016, 9, 1674–1684. [Google Scholar] [CrossRef]
- Zhao, N.; Samson, E.L.; Currit, N.A. Nighttime-Lights-Derived Fossil Fuel Carbon Dioxide Emission Maps and Their Limitations. Photogramm. Eng. Remote Sens. 2015, 81, 935–943. [Google Scholar] [CrossRef]
- Ou, J.; Liu, X.; Li, X.; Li, M.; Li, W. Evaluation of NPP-VIIRS Nighttime Light Data for Mapping Global Fossil Fuel Combustion CO2 Emissions: A Comparison with DMSP-OLS Nighttime Light Data. PLoS ONE 2015, 10, e0138310. [Google Scholar] [CrossRef]
- Lu, H.; Liu, G. Spatial effects of carbon dioxide emissions from residential energy consumption: A county-level study using enhanced nocturnal lighting. Appl. Energy 2014, 131, 297–306. [Google Scholar] [CrossRef]
- Lo, C.P. Urban Indicators of China from Radiance-Calibrated Digital DMSP-OLS Nighttime Images. Ann. Assoc. Am. Geogr. 2002, 92, 225–240. [Google Scholar] [CrossRef]
- Cao, X.; Wang, J.; Chen, J.; Shi, F. Spatialization of electricity consumption of China using saturation-corrected DMSP-OLS data. Int. J. Appl. Earth Obs. Geoinf. 2014, 28, 193–200. [Google Scholar] [CrossRef]
- Xie, Y.; Weng, Q. Detecting urban-scale dynamics of electricity consumption at Chinese cities using time-series DMSP-OLS (Defense Meteorological Satellite Program-Operational Linescan System) nighttime light imageries. Energy 2016, 100, 177–189. [Google Scholar] [CrossRef]
- He, C.; Ma, Q.; Li, T.; Yang, Y.; Liu, Z. Spatiotemporal dynamics of electric power consumption in Chinese Mainland from 1995 to 2008 modeled using DMSP/OLS stable nighttime lights data. J. Geogr. Sci. 2012, 22, 125–136. [Google Scholar] [CrossRef]
- He, C.; Ma, Q.; Liu, Z.; Zhang, Q. Modeling the spatiotemporal dynamics of electric power consumption in Mainland China using saturation-corrected DMSP/OLS nighttime stable light data. Int. J. Digit. Earth 2013, 7, 993–1014. [Google Scholar] [CrossRef]
- Shi, K.; Chen, Y.; Yu, B.; Xu, T.; Chen, Z.; Liu, R.; Li, L.; Wu, J. Modeling spatiotemporal CO2 (carbon dioxide) emission dynamics in China from DMSP-OLS nighttime stable light data using panel data analysis. Appl. Energy 2016, 168, 523–533. [Google Scholar] [CrossRef]
- Su, Y.; Chen, X.; Li, Y.; Liao, J.; Ye, Y.; Zhang, H.; Huang, N.; Kuang, Y. China’s 19-year city-level carbon emissions of energy consumptions, driving forces and regionalized mitigation guidelines. Renew. Sust. Energ. Rev. 2014, 35, 231–243. [Google Scholar] [CrossRef]
- Shi, K.; Yu, B.; Zhou, Y.; Chen, Y.; Yang, C.; Chen, Z.; Wu, J. Spatiotemporal variations of CO2 emissions and their impact factors in China: A comparative analysis between the provincial and prefectural levels. Appl. Energy 2019, 233–234, 170–181. [Google Scholar] [CrossRef]
- Shi, K.; Yu, B.; Huang, C.; Wu, J.; Sun, X. Exploring spatiotemporal patterns of electric power consumption in countries along the Belt and Road. Energy 2018, 150, 847–859. [Google Scholar] [CrossRef]
- Shi, K.; Yang, Q.; Fang, G.; Yu, B.; Chen, Z.; Yang, C.; Wu, J. Evaluating spatiotemporal patterns of urban electricity consumption within different spatial boundaries: A case study of Chongqing, China. Energy 2019, 167, 641–653. [Google Scholar] [CrossRef]
- Hara, M.; Okada, S.; Yagi, H.; Moriyama, T.; Shigehara, K.; Sugimori, Y. Progress for stable artificial lights distribution extraction accuracy and estimation of electric power consumption by means of DMSP/OLS nighttime imagery. Int. J. Remote Sens. Earth Sci. 2004, 1, 31–42. [Google Scholar]
- Letu, H.; Hara, M.; Yagi, H.; Naoki, K.; Tana, G.; Nishio, F.; Shuhei, O. Estimating energy consumption from night-time DMPS/OLS imagery after correcting for saturation effects. Int. J. Remote Sens. 2010, 31, 4443–4458. [Google Scholar] [CrossRef]
- Liu, X.; Ou, J.; Wang, S.; Li, X.; Yan, Y.; Jiao, L.; Liu, Y. Estimating spatiotemporal variations of city-level energy-related CO2 emissions: An improved disaggregating model based on vegetation adjusted nighttime light data. J. Clean Prod. 2018, 177, 101–114. [Google Scholar] [CrossRef]
- Meng, L.; Graus, W.; Worrell, E.; Huang, B. Estimating CO2 (carbon dioxide) emissions at urban scales by DMSP/OLS (Defense Meteorological Satellite Program’s Operational Linescan System) nighttime light imagery: Methodological challenges and a case study for China. Energy 2014, 71, 468–478. [Google Scholar] [CrossRef]
- Elvidge, C.; Ziskin, D.; Baugh, K.; Tuttle, B.; Ghosh, T.; Pack, D.; Erwin, E.; Zhizhin, M. A Fifteen Year Record of Global Natural Gas Flaring Derived from Satellite Data. Energies 2009, 2, 595–622. [Google Scholar] [CrossRef]
- Elvidge, C.; Zhizhin, M.; Baugh, K.; Hsu, F.-C.; Ghosh, T. Methods for Global Survey of Natural Gas Flaring from Visible Infrared Imaging Radiometer Suite Data. Energies 2016, 9, 14. [Google Scholar] [CrossRef]
- Blasing, T.J.; Hand, K. Monthly carbon emissions from natural-gas flaring and cement manufacture in the United States. Tellus 2010, 59, 15–21. [Google Scholar] [CrossRef]
- Longcore, T.; Rich, C. Ecological light pollution. Front. Ecol. Environ. 2004, 2, 191–198. [Google Scholar] [CrossRef]
- Katz, Y.; Levin, N. Quantifying urban light pollution—A comparison between field measurements and EROS-B imagery. Remote Sens. Environ. 2016, 177, 65–77. [Google Scholar] [CrossRef]
- Xiang, W.; Tan, M. Changes in Light Pollution and the Causing Factors in China’s Protected Areas, 1992–2012. Remote Sens. 2017, 9, 1026. [Google Scholar] [CrossRef]
- Estrada-García, R.; García-Gil, M.; Acosta, L.; Bará, S.; Sanchez-de-Miguel, A.; Zamorano, J. Statistical modelling and satellite monitoring of upward light from public lighting. Lighting Res. Technol. 2016, 48, 810–822. [Google Scholar] [CrossRef] [Green Version]
- Zamorano, J.; de Miguel, A.S.; Ocaña, F.; Pila-Diez, B.; Castaño, J.G.; Pascual, S.; Tapia, C.; Gallego, J.; Fernández, A.; Nievas, M. Testing sky brightness models against radial dependency: A dense two dimensional survey around the city of Madrid, Spain. J. Quant. Spectrosc. Radiat. Transf. 2016, 181, 52–66. [Google Scholar] [CrossRef] [Green Version]
- Kuechly, H.U.; Kyba, C.C.; Ruhtz, T.; Lindemann, C.; Wolter, C.; Fischer, J.; Hölker, F. Aerial survey and spatial analysis of sources of light pollution in Berlin, Germany. Remote Sens. Environ. 2012, 126, 39–50. [Google Scholar] [CrossRef]
- Han, P.; Huang, J.; Li, R.; Wang, L.; Hu, Y.; Wang, J.; Huang, W. Monitoring Trends in Light Pollution in China Based on Nighttime Satellite Imagery. Remote Sens. 2014, 6, 5541–5558. [Google Scholar] [CrossRef] [Green Version]
- Jiang, W.; He, G.; Long, T.; Wang, C.; Ni, Y.; Ma, R. Assessing Light Pollution in China Based on Nighttime Light Imagery. Remote Sens. 2017, 9, 135. [Google Scholar] [CrossRef]
- Butt, M.J. Estimation of Light Pollution Using Satellite Remote Sensing and Geographic Information System Techniques. GISci. Remote Sens. 2013, 49, 609–621. [Google Scholar] [CrossRef]
- Bennie, J.; Davies, T.W.; Duffy, J.P.; Inger, R.; Gaston, K.J. Contrasting trends in light pollution across Europe based on satellite observed night time lights. Sci. Rep. 2014, 4, 3789. [Google Scholar] [CrossRef] [PubMed] [Green Version]
- Cinzano, P.; Falchi, F.; Elvidge, C.D. The first world atlas of the artificial night sky brightness. Mon. Not. Roy. Astron. Soc. 2001, 328, 689–707. [Google Scholar] [CrossRef]
- Kyba, C.C.; Kuester, T.; De Miguel, A.S.; Baugh, K.; Jechow, A.; Hölker, F.; Bennie, J.; Elvidge, C.D.; Gaston, K.J.; Guanter, L. Artificially lit surface of Earth at night increasing in radiance and extent. Sci. Adv. 2017, 3, e1701528. [Google Scholar] [CrossRef] [PubMed] [Green Version]
- Hu, Z.; Hu, H.; Huang, Y. Association between nighttime artificial light pollution and sea turtle nest density along Florida coast: A geospatial study using VIIRS remote sensing data. Environ. Pollut. 2018, 239, 30–42. [Google Scholar] [CrossRef] [PubMed]
- Bennie, J.; Duffy, J.; Davies, T.; Correa-Cano, M.; Gaston, K. Global Trends in Exposure to Light Pollution in Natural Terrestrial Ecosystems. Remote Sens. 2015, 7, 2715–2730. [Google Scholar] [CrossRef] [Green Version]
- Freitas, J.R.; Bennie, J.; Mantovani, W.; Gaston, K.J. Exposure of tropical ecosystems to artificial light at night: Brazil as a case study. PLoS ONE 2017, 12, e0171655. [Google Scholar] [CrossRef] [PubMed]
- Koen, E.L.; Minnaar, C.; Roever, C.L.; Boyles, J.G. Emerging threat of the 21st century lightscape to global biodiversity. Glob. Chang. Biol. 2018, 24, 2315–2324. [Google Scholar] [CrossRef] [PubMed]
- Gaston, K.J.; Duffy, J.P.; Bennie, J. Quantifying the erosion of natural darkness in the global protected area system. Conserv. Biol. 2015, 29, 1132–1141. [Google Scholar] [CrossRef]
- Davies, T.W.; Duffy, J.P.; Bennie, J.; Gaston, K.J. Stemming the Tide of Light Pollution Encroaching into Marine Protected Areas. Conserv. Lett. 2016, 9, 164–171. [Google Scholar] [CrossRef]
- Kamrowski, R.L.; Limpus, C.; Moloney, J.; Hamann, M. Coastal light pollution and marine turtles: assessing the magnitude of the problem. Endanger. Species Res. 2012, 19, 85–98. [Google Scholar] [CrossRef] [Green Version]
- Cabrera-Cruz, S.A.; Smolinsky, J.A.; Buler, J.J. Light pollution is greatest within migration passage areas for nocturnally-migrating birds around the world. Sci. Rep. 2018, 8, 3261. [Google Scholar] [CrossRef] [PubMed]
- La Sorte, F.A.; Fink, D.; Buler, J.J.; Farnsworth, A.; Cabrera-Cruz, S.A. Seasonal associations with urban light pollution for nocturnally migrating bird populations. Glob. Chang. Biol. 2017, 23, 4609–4619. [Google Scholar] [CrossRef]
- Bauer, S.E.; Wagner, S.E.; Burch, J.; Bayakly, R.; Vena, J.E. A case-referent study: light at night and breast cancer risk in Georgia. Int. J. Health Geogr. 2013, 12, 23. [Google Scholar] [CrossRef]
- Kloog, I.; Haim, A.; Stevens, R.G.; Barchana, M.; Portnov, B.A. Light at night co-distributes with incident breast but not lung cancer in the female population of Israel. Chronobiol. Int. 2008, 25, 65–81. [Google Scholar] [CrossRef] [PubMed]
- James, P.; Bertrand, K.A.; Hart, J.E.; Schernhammer, E.S.; Tamimi, R.M.; Laden, F. Outdoor Light at Night and Breast Cancer Incidence in the Nurses’ Health Study II. Environ. Health Perspect. 2017, 125, 087010. [Google Scholar] [CrossRef]
- Rybnikova, N.; Stevens, R.G.; Gregorio, D.I.; Samociuk, H.; Portnov, B.A. Kernel density analysis reveals a halo pattern of breast cancer incidence in Connecticut. Spat. Spatio-Temporal Epidemiol. 2018, 26, 143–151. [Google Scholar] [CrossRef]
- Portnov, B.A.; Stevens, R.G.; Samociuk, H.; Wakefield, D.; Gregorio, D.I. Light at night and breast cancer incidence in Connecticut: An ecological study of age group effects. Sci. Total Environ. 2016, 572, 1020–1024. [Google Scholar] [CrossRef]
- Koo, Y.S.; Song, J.-Y.; Joo, E.-Y.; Lee, H.-J.; Lee, E.; Lee, S.-K.; Jung, K.-Y. Outdoor artificial light at night, obesity, and sleep health: Cross-sectional analysis in the KoGES study. Chronobiol. Int. 2016, 33, 301–314. [Google Scholar] [CrossRef] [PubMed]
- Rybnikova, N.A.; Portnov, B.A. Outdoor light and breast cancer incidence: A comparative analysis of DMSP and VIIRS-DNB satellite data. Int. J. Remote Sens. 2016, 38, 5952–5961. [Google Scholar] [CrossRef]
- Garcia-Saenz, A.; Sanchez de Miguel, A.; Espinosa, A.; Valentin, A.; Aragones, N.; Llorca, J.; Amiano, P.; Martin Sanchez, V.; Guevara, M.; Capelo, R.; et al. Evaluating the Association between Artificial Light-at-Night Exposure and Breast and Prostate Cancer Risk in Spain (MCC-Spain Study). Environ. Health Perspect. 2018, 126, 047011. [Google Scholar] [CrossRef] [PubMed]
- Rybnikova, N.; Portnov, B.A. Population-level study links short-wavelength nighttime illumination with breast cancer incidence in a major metropolitan area. Chronobiol. Int. 2018, 35, 1198–1208. [Google Scholar] [CrossRef]
- Huss, A.; van Wel, L.; Bogaards, L.; Vrijkotte, T.; Wolf, L.; Hoek, G.; Vermeulen, R. Shedding Some Light in the Dark—A Comparison of Personal Measurements with Satellite-Based Estimates of Exposure to Light at Night among Children in the Netherlands. Environ. Health Perspect. 2019, 127, 067001. [Google Scholar] [CrossRef] [PubMed]
- Zhang, Q.; Pandey, B.; Seto, K.C. A Robust Method to Generate a Consistent Time Series from DMSP/OLS Nighttime Light Data. IEEE Trans. Geosci. Remote Sens. 2016, 54, 5821–5831. [Google Scholar] [CrossRef]
- Wu, J.; He, S.; Peng, J.; Li, W.; Zhong, X. Intercalibration of DMSP-OLS night-time light data by the invariant region method. Int. J. Remote Sens. 2013, 34, 7356–7368. [Google Scholar] [CrossRef]
- Pandey, B.; Joshi, P.K.; Seto, K.C. Monitoring urbanization dynamics in India using DMSP/OLS night time lights and SPOT-VGT data. Int. J. Appl. Earth Obs. Geoinf. 2013, 23, 49–61. [Google Scholar] [CrossRef]
- Li, X.; Chen, X.; Zhao, Y.; Xu, J.; Chen, F.; Li, H. Automatic intercalibration of night-time light imagery using robust regression. Remote Sens. Lett. 2013, 4, 45–54. [Google Scholar] [CrossRef]
- Tuttle, B.; Anderson, S.; Elvidge, C.; Ghosh, T.; Baugh, K.; Sutton, P. Aladdin’s Magic Lamp: Active Target Calibration of the DMSP OLS. Remote Sens. 2014, 6, 12708–12722. [Google Scholar] [CrossRef]
- Pandey, B.; Zhang, Q.; Seto, K.C. Comparative evaluation of relative calibration methods for DMSP/OLS nighttime lights. Remote Sens. Environ. 2017, 195, 67–78. [Google Scholar] [CrossRef]
- Zhang, Q.; Schaaf, C.; Seto, K.C. The Vegetation Adjusted NTL Urban Index: A new approach to reduce saturation and increase variation in nighttime luminosity. Remote Sens. Environ. 2013, 129, 32–41. [Google Scholar] [CrossRef]
- Liu, X.; Hu, G.; Chen, Y.; Li, X.; Xu, X.; Li, S.; Pei, F.; Wang, S. High-resolution multi-temporal mapping of global urban land using Landsat images based on the Google Earth Engine Platform. Remote Sens. Environ. 2018, 209, 227–239. [Google Scholar] [CrossRef]
- Goodchild, M. Citizens as sensors: The world of volunteered geography. GeoJournal 2007, 69, 211–221. [Google Scholar] [CrossRef]
- Xie, Y.; Weng, Q. Spatiotemporally enhancing time-series DMSP/OLS nighttime light imagery for assessing large-scale urban dynamics. ISPRS-J. Photogramm. Remote Sens. 2017, 128, 1–15. [Google Scholar] [CrossRef]
- Small, C.; Elvidge, C.D.; Baugh, K. Mapping urban structure and spatial connectivity with VIIRS and OLS night light imagery. In Proceedings of the Urban Remote Sensing Event (JURSE), Sao Paulo, Brazil, 21–23 April 2013; pp. 230–233. [Google Scholar]
- Falchi, F.; Cinzano, P.; Duriscoe, D.; Kyba, C.C.; Elvidge, C.D.; Baugh, K.; Portnov, B.A.; Rybnikova, N.A.; Furgoni, R. The new world atlas of artificial night sky brightness. Sci. Adv. 2016, 2, e1600377. [Google Scholar] [CrossRef] [PubMed]
- Bará, S.; Rodríguez-Arós, Á.; Pérez, M.; Tosar, B.; Lima, R.C.; Sánchez de Miguel, A.; Zamorano, J. Estimating the relative contribution of streetlights, vehicles, and residential lighting to the urban night sky brightness. Lighting Res. Technol. 2017. [Google Scholar] [CrossRef]
- Xie, Y.; Weng, Q.; Weng, A. A comparative study of NPP-VIIRS and DMSP-OLS nighttime light imagery for derivation of urban demographic metrics. In Proceedings of the Earth Observation and Remote Sensing Applications (EORSA), Changsha, China, 11–14 June 2014; pp. 335–339. [Google Scholar]
- Jing, X.; Shao, X.; Cao, C.; Fu, X.; Yan, L. Comparison between the Suomi-NPP Day-Night Band and DMSP-OLS for Correlating Socio-Economic Variables at the Provincial Level in China. Remote Sens. 2015, 8, 17. [Google Scholar] [CrossRef]
- Zhang, X.; Wu, J.; Peng, J.; Cao, Q. The Uncertainty of Nighttime Light Data in Estimating Carbon Dioxide Emissions in China: A Comparison between DMSP-OLS and NPP-VIIRS. Remote Sens. 2017, 9, 797. [Google Scholar] [CrossRef]
- Elvidge, C.; Hsu, F.-C.; Baugh, K.; Ghosh, T. National Trends in Satellite-Observed Lighting: 1992–2012. In Global Urban Monitoring and Assessment through Earth Observation; CRC Press: Boca Raton, FL, USA, 2014; pp. 97–120. [Google Scholar]
- Shao, X.; Cao, C.; Zhang, B.; Qiu, S.; Elvidge, C.; Von Hendy, M. Radiometric calibration of DMSP-OLS sensor using VIIRS day/night band. In Proceedings of the Earth Observing Missions and Sensors: Development, Implementation, and Characterization III, Beijing, China, 13–16 October 2014; p. 92640A. [Google Scholar]
- Zheng, Q.; Weng, Q.; Wang, K. Developing a new cross-sensor calibration model for DMSP-OLS and Suomi-NPP VIIRS night-light imageries. ISPRS-J. Photogramm. Remote Sens. 2019, 153, 36–47. [Google Scholar] [CrossRef]
- Zhao, M.; Cheng, W.; Liu, Q.; Wang, N. Spatiotemporal measurement of urbanization levels based on multiscale units: A case study of the Bohai Rim Region in China. J. Geogr. Sci. 2016, 26, 531–548. [Google Scholar] [CrossRef] [Green Version]
- Small, C.; Pozzi, F.; Elvidge, C. Spatial analysis of global urban extent from DMSP-OLS night lights. Remote Sens. Environ. 2005, 96, 277–291. [Google Scholar] [CrossRef]
- He, C.; Liu, Z.; Tian, J.; Ma, Q. Urban expansion dynamics and natural habitat loss in China: A multiscale landscape perspective. Glob. Chang. Biol. 2014, 20, 2886–2902. [Google Scholar] [CrossRef] [PubMed]
- Liu, X.; Hu, G.; Ai, B.; Li, X.; Shi, Q. A Normalized Urban Areas Composite Index (NUACI) Based on Combination of DMSP-OLS and MODIS for Mapping Impervious Surface Area. Remote Sens. 2015, 7, 17168–17189. [Google Scholar] [CrossRef] [Green Version]
- Liu, Y.; Hu, C.; Zhan, W.; Sun, C.; Murch, B.; Ma, L. Identifying industrial heat sources using time-series of the VIIRS Nightfire product with an object-oriented approach. Remote Sens. Environ. 2018, 204, 347–365. [Google Scholar] [CrossRef]
- Ma, T.; Zhou, Y.; Zhou, C.; Haynie, S.; Pei, T.; Xu, T. Night-time light derived estimation of spatio-temporal characteristics of urbanization dynamics using DMSP/OLS satellite data. Remote Sens. Environ. 2015, 158, 453–464. [Google Scholar] [CrossRef]
- Small, C.; Elvidge, C.D. Night on Earth: Mapping decadal changes of anthropogenic night light in Asia. Int. J. Appl. Earth Obs. Geoinf. 2013, 22, 40–52. [Google Scholar] [CrossRef] [Green Version]
- Kyba, C.C.; Wagner, J.M.; Kuechly, H.U.; Walker, C.E.; Elvidge, C.D.; Falchi, F.; Ruhtz, T.; Fischer, J.; Holker, F. Citizen science provides valuable data for monitoring global night sky luminance. Sci. Rep. 2013, 3, 1835. [Google Scholar] [CrossRef]
- Sánchez de Miguel, A.; Zamorano, J.; Gómez Castaño, J.; Pascual, S. Evolution of the energy consumed by street lighting in Spain estimated with DMSP-OLS data. J. Quant. Spectrosc. Radiat. Transf. 2014, 139, 109–117. [Google Scholar] [CrossRef] [Green Version]
- Cao, C.; Bai, Y. Quantitative Analysis of VIIRS DNB Nightlight Point Source for Light Power Estimation and Stability Monitoring. Remote Sens. 2014, 6, 11915–11935. [Google Scholar] [CrossRef] [Green Version]
- Coesfeld, J.; Anderson, S.; Baugh, K.; Elvidge, C.; Schernthanner, H.; Kyba, C. Variation of Individual Location Radiance in VIIRS DNB Monthly Composite Images. Remote Sens. 2018, 10, 1964. [Google Scholar] [CrossRef]
- Aubé, M.; Roby, J.; Kocifaj, M. Evaluating potential spectral impacts of various artificial lights on melatonin suppression, photosynthesis, and star visibility. PLoS ONE 2013, 8, e67798. [Google Scholar] [CrossRef]
- Dobler, G.; Ghandehari, M.; Koonin, S.E.; Sharma, M.S. A Hyperspectral Survey of New York City Lighting Technology. Sensors 2016, 16, 2047. [Google Scholar] [CrossRef] [PubMed]
- Sánchez de Miguel, A.; Kyba, C.C.M.; Aubé, M.; Zamorano, J.; Cardiel, N.; Tapia, C.; Bennie, J.; Gaston, K.J. Colour remote sensing of the impact of artificial light at night (I): The potential of the International Space Station and other DSLR-based platforms. Remote Sens. Environ. 2019, 224, 92–103. [Google Scholar] [CrossRef]
- Rybnikova, N.A.; Portnov, B.A. Remote identification of research and educational activities using spectral properties of nighttime light. ISPRS-J. Photogramm. Remote Sens. 2017, 128, 212–222. [Google Scholar] [CrossRef]
- Xie, M.; Jean, N.; Burke, M.; Lobell, D.; Ermon, S. Transfer learning from deep features for remote sensing and poverty mapping. In Proceedings of the Thirtieth AAAI Conference on Artificial Intelligence, Phoenix, AZ, USA, 12–17 February 2016. [Google Scholar]
- Ju, Y.; Dronova, I.; Ma, Q.; Zhang, X. Analysis of urbanization dynamics in mainland China using pixel-based night-time light trajectories from 1992 to 2013. Int. J. Remote Sens. 2017, 38, 6047–6072. [Google Scholar] [CrossRef]


| Satellite/Sensor | Dataset Type | Accessibility | Available Period | Spatial Resolution | Spectral Bands | Radiometric Resolution |
|---|---|---|---|---|---|---|
| DMSP-OLS | Time series dataset | Free https://www.ngdc.noaa.gov/eog/download.html | 1992–2013 Annual | 30 arc-second | Panchromatic 400–1100 nm | 6 bit |
| Radiance calibrated dataset | 1996, 1999, 2000, 2003, 2004, 2006, 2010, 2011 Several years | |||||
| Daily and monthly dataset | Not free | Need specially ordered | ||||
| Suomi NPP-VIIRS | Monthly VIIRS/DNB composites | Free https://www.ngdc.noaa.gov/eog/download.html | 2012.04–present Monthly | 15 arc-second | Panchromatic 505–890 nm | 14 bit |
| Annual VIIRS/DNB composites | 2015, 2016 Several years | |||||
| Standard Black Marble product | Free (VNP46A1) https://ladsweb.modaps.eosdis.nasa.gov/ | 2012.01.19–present Daily | 500 m | |||
| Black Marble High Definition product | Under experiment | N/A | Expected <30 m | |||
| ISS | Astronaut photos onboard ISS | Uncalibrated images free http://eol.jsc.nasa.gov http://www.citiesatnight.org | 2003–present Photos taken irregularly | 5–200 m | Red, green, and blue (RGB) | 8–14 bit |
| EROS-B | High spatial resolution NTL imagery | Commercial | Mid-2013 | 0.7 m | Panchromatic | 16 bit |
| JL1-3B | Multi-spectral (red, green, and blue) NTL imagery | Commercial | Launched in 2017 | 0.92 m | 430–512 nm (blue), 489–585 nm (green), and 580–720 nm (red) | 8 bit |
| JL1-07/08 | Imagery with a panchromatic band and improved multispectral bands | Commercial | Launched in 2018 | / | Panchromatic and multi-spectral (blue, green, red, red edge, and near-infrared bands) | / |
| LJ1-01 | High spatial resolution imagery | Free http://59.175.109.173:8888/app/login.html | Launched in 2018 15-day revisit time | 130 m | Panchromatic 480–800 nm | Digital number (DN) values |
| Object | Scale | Nighttime Light Data | Ancillary Data | Time | Method | Reference |
|---|---|---|---|---|---|---|
| Urban area (built-up area) | Global | DMSP/OLS | 2000 | Cluster-based method + thresholds | (Zhou et al., 2014; 2015) | |
| VIIRS/NPP | MODIS multispectral data | 2014 | Enhanced urban built-up index | (Sharma et al., 2016) | ||
| VIIRS/NPP + DMSP/OLS | NDVI, LST | 1992–2016 | Fully convolutional network | (He et al., 2019) | ||
| DMSP/OLS | 1992–2013 | Quantile-based approach | (Zhou et al., 2018) | |||
| DMSP/OLS | MODIS NDVI MODIS LST | 2000–2012 | Support vector machine classifier and Markov random field model | (Chen et al., 2019) | ||
| National | DMSP/OLS | 1992–2008 | Iterative unsupervised classification method | (Zhang and Seto, 2011) | ||
| DMSP/OLS | 1992–2008 | Regional thresholds | (Liu et al., 2012) | |||
| DMSP/OLS | 1994–1995 | A global threshold | (Imhoff et al., 1997) | |||
| DMSP/OLS | 2005, 2010 | Object-based urban thresholding | (Xie and Weng, 2016) | |||
| VIIRS/NPP | 2015 | Multiple methods | (Dou et al., 2017) | |||
| Regional and city | DMSP/OLS | 1994–1995 1996–1997 | Threshold | (Henderson et al., 2003) | ||
| DMSP/OLS | SPOT NDVI | 2000 | Support vector machine-based region growing algorithm | (Cao et al., 2009) | ||
| DMSP/OLS | MODIS NDVI | 2001–2007 | Human settlement index | (Roychowdhury and Maithani, 2010) | ||
| VIIRS/NPP | 2012 | Regional thresholds | (Shi et al., 2014) | |||
| Impervious surfaces | National | DMSP/OLS | Population distribution | 2000–2001 | Multivariate linear regression | (Sutton et al., 2009) |
| DMSP/OLS | AVHRR NDVI | 1992–2009 | Vegetation adjusted nighttime light urban index and linear regression | (Ma et al., 2014). |
© 2019 by the authors. Licensee MDPI, Basel, Switzerland. This article is an open access article distributed under the terms and conditions of the Creative Commons Attribution (CC BY) license (http://creativecommons.org/licenses/by/4.0/).
Share and Cite
Zhao, M.; Zhou, Y.; Li, X.; Cao, W.; He, C.; Yu, B.; Li, X.; Elvidge, C.D.; Cheng, W.; Zhou, C. Applications of Satellite Remote Sensing of Nighttime Light Observations: Advances, Challenges, and Perspectives. Remote Sens. 2019, 11, 1971. https://doi.org/10.3390/rs11171971
Zhao M, Zhou Y, Li X, Cao W, He C, Yu B, Li X, Elvidge CD, Cheng W, Zhou C. Applications of Satellite Remote Sensing of Nighttime Light Observations: Advances, Challenges, and Perspectives. Remote Sensing. 2019; 11(17):1971. https://doi.org/10.3390/rs11171971
Chicago/Turabian StyleZhao, Min, Yuyu Zhou, Xuecao Li, Wenting Cao, Chunyang He, Bailang Yu, Xi Li, Christopher D. Elvidge, Weiming Cheng, and Chenghu Zhou. 2019. "Applications of Satellite Remote Sensing of Nighttime Light Observations: Advances, Challenges, and Perspectives" Remote Sensing 11, no. 17: 1971. https://doi.org/10.3390/rs11171971