Artificial Light at Night is Related to Broad-Scale Stopover Distributions of Nocturnally Migrating Landbirds along the Yucatan Peninsula, Mexico


Abstract
:
1. Introduction
2. Materials and Methods
2.1. Radar Data and Processing
2.2. Model Covariates
2.3. Model Analysis
3. Results
4. Discussion
5. Conclusions
Supplementary Materials
Author Contributions
Funding
Acknowledgments
Conflicts of Interest
References
- Smolinsky, J.A.; Diehl, R.H.; Radzio, T.A.; Delaney, D.K.; Moore, F.R. Factors influencing the movement biology of migrant songbirds confronted with an ecological barrier. Behav. Ecol. Sociobiol. 2013, 67, 2041–2051. [Google Scholar] [CrossRef]
- Alerstam, T. Detours in bird migration. J. Theor. Biol. 2001, 209, 319–331. [Google Scholar] [CrossRef] [PubMed]
- Becciu, P.; Menz, M.H.M.; Aurbach, A.; Cabrera-Cruz, S.A.; Wainwright, C.E.; Scacco, M.; Ciach, M.; Pettersson, L.B.; Maggini, I.; Arroyo, G.M.; et al. Environmental effects on flying migrants revealed by radar. Ecography 2019, 42, 942–955. [Google Scholar] [CrossRef] [Green Version]
- Larkin, R.P.; Frase, B.A. Circular paths of birds flying near a broadcasting tower in cloud. J. Comp. Psychol. 1988, 102, 90–93. [Google Scholar] [CrossRef]
- Bruderer, B.; Peter, D.; Steuri, T. Behaviour of migrating birds exposed to X-band radar and a bright light beam. J. Exp. Biol. 1999, 202, 1015–1022. [Google Scholar] [PubMed]
- Cabrera-Cruz, S.A.; Smolinsky, J.A.; McCarthy, K.P.; Buler, J.J. Urban areas affect flight altitudes of nocturnally migrating birds. J. Anim. Ecol. 2019, 88, 1873–1887. [Google Scholar] [CrossRef] [PubMed]
- Van Doren, B.M.; Horton, K.G.; Dokter, A.M.; Klinck, H.; Elbin, S.B.; Farnsworth, A. High-intensity urban light installation dramatically alters nocturnal bird migration. Proc. Natl. Acad. Sci. USA 2017, 114, 11175–11180. [Google Scholar] [CrossRef] [Green Version]
- Archibald, K.M.; Buler, J.J.; Smolinsky, J.A.; Smith, R.J. Migrating birds reorient toward land at dawn over the Great Lakes, USA. The Auk 2017, 134, 193–201. [Google Scholar] [CrossRef]
- Diehl, R.H.; Larkin, R.P.; Black, J.E. Radar observations of bird migration over the Great Lakes. The Auk 2003, 120, 278–290. [Google Scholar] [CrossRef]
- Buler, J.J.; Dawson, D.K. Radar analysis of fall bird migration stopover sites in the northeastern U.S. The Condor 2014, 116, 357–370. [Google Scholar] [CrossRef] [Green Version]
- MMcLaren, J.D.; Buler, J.J.; Schreckengost, T.; Smolinsky, J.A.; Boone, M.; Loon, E.E.; van Dawson, D.K.; Walters, E.L. Artificial light at night confounds broad-scale habitat use by migrating birds. Ecol. Lett. 2018, 21, 356–364. [Google Scholar] [CrossRef] [PubMed]
- LaFleur, J.M.; Buler, J.J.; Moore, F.R. Geographic position and landscape composition explain regional patterns of migrating landbird distributions during spring stopover along the northern coast of the Gulf of Mexico. Landsc. Ecol. 2016, 31, 1697–1709. [Google Scholar] [CrossRef]
- Martínez, M.L.; Intralawan, A.; Vázquez, G.; Pérez-Maqueo, O.; Sutton, P.; Landgrave, R. The coasts of our world: Ecological, economic and social importance. Ecol. Econ. 2007, 63, 254–272. [Google Scholar] [CrossRef]
- Imhoff, M.L.; Lawrence, W.T.; Elvidge, C.D.; Paul, T.; Levine, E.; Privalsky, M.V.; Brown, V. Using nighttime DMSP/OLS images of city lights to estimate the impact of urban land use on soil resources in the United States. Remote Sens. Environ. 1997, 59, 105–117. [Google Scholar] [CrossRef]
- Elvidge, C.D.; Tuttle, B.T.; Sutton, P.C.; Baugh, K.E.; Howard, A.T.; Milesi, C.; Bhaduri, B.; Nemani, R. Global distribution and density of constructed impervious surfaces. Sensors 2007, 7, 1962–1979. [Google Scholar] [CrossRef]
- Longcore, T.; Rich, C. Ecological light pollution. Front. Ecol. Environ. 2004, 2, 191–198. [Google Scholar] [CrossRef]
- Hölker, F.; Wolter, C.; Perkin, E.K.; Tockner, K. Light pollution as a biodiversity threat. Trends Ecol. Evol. 2010, 25, 681–682. [Google Scholar] [CrossRef]
- Schroer, S.; Hölker, F. Impact of lighting on flora and fauna. In Handbook of Advanced Lighting Technology; Karlicek, R., Sun, C.-C., Zissis, G., Ma, R., Eds.; Springer International Publishing: Cham, Switzerland, 2016; pp. 957–989. ISBN 978-3-319-00295-8. [Google Scholar]
- Dutcher, W. Bird Notes from Long Island, N. Y. The Auk 1884, 1, 174–179. [Google Scholar] [CrossRef]
- Gauthreaux, S.A.; Belser, C.G. Effects of artificial night lighting on migrating birds. In Ecological Consequences of Artificial Night Lighting; Rich, C., Longcore, T., Eds.; Island Press: Washington, DC, USA, 2006; pp. 67–93. ISBN 1-55963-128-7. [Google Scholar]
- Zuckerberg, B.; Fink, D.; La Sorte, F.A.; Hochachka, W.M.; Kelling, S. Novel seasonal land cover associations for eastern North American forest birds identified through dynamic species distribution modelling. Divers. Distrib. 2016, 22, 717–730. [Google Scholar] [CrossRef] [Green Version]
- La Sorte, F.A.; Fink, D.; Buler, J.J.; Farnsworth, A.; Cabrera-Cruz, S.A. Seasonal associations with urban light pollution for nocturnally migrating bird populations. Glob Chang. Biol. 2017, 23, 4609–4619. [Google Scholar] [CrossRef]
- Gauthreaux, S.A. Age-dependent orientation in migratory birds. In Avian Navigation. International Symposium on Avian Navigation (ISAN) Held at Tirrenia (Pisa), September 11-14, 1981; Papi, F., Wallraff, H.G., Eds.; Springer: Berlin, Germany, 1982; pp. 68–74. [Google Scholar]
- Cabrera-Cruz, S.A.; Smolinsky, J.A.; Buler, J.J. Light pollution is greatest within migration passage areas for nocturnally-migrating birds around the world. Sci. Rep. 2018, 8, 3261. [Google Scholar] [CrossRef] [PubMed]
- La Sorte, F.A.; Fink, D.; Hochachka, W.M.; Farnsworth, A.; Rodewald, A.D.; Rosenberg, K.V.; Sullivan, B.L.; Winkler, D.W.; Wood, C.; Kelling, S. The role of atmospheric conditions in the seasonal dynamics of North American migration flyways. J. Biogeogr. 2014, 41, 1685–1696. [Google Scholar] [CrossRef]
- Dokter, A.M.; Farnsworth, A.; Fink, D.; Ruiz-Gutierrez, V.; Hochachka, W.M.; Sorte, F.A.L.; Robinson, O.J.; Rosenberg, K.V.; Kelling, S. Seasonal abundance and survival of North America’s migratory avifauna determined by weather radar. Nat. Ecol. Evol. 2018, 2, 1603–1609. [Google Scholar] [CrossRef] [PubMed]
- Horton, K.G.; Doren, B.M.V.; Sorte, F.A.L.; Cohen, E.B.; Clipp, H.L.; Buler, J.J.; Fink, D.; Kelly, J.F.; Farnsworth, A. Holding steady: Little change in intensity or timing of bird migration over the Gulf of Mexico. Glob. Chang. Biol. 2019, 25, 1106–1118. [Google Scholar] [CrossRef] [PubMed]
- La Sorte, F.A.; Fink, D.; Hochachka, W.M.; Kelling, S. Convergence of broad-scale migration strategies in terrestrial birds. Proc. R. Soc. B 2016, 283. [Google Scholar] [CrossRef] [PubMed]
- Deppe, J.L.; Ward, M.P.; Bolus, R.T.; Diehl, R.H.; Celis-Murillo, A.; Zenzal, T.J.; Moore, F.R.; Benson, T.J.; Smolinsky, J.A.; Schofield, L.N.; et al. Fat, weather, and date affect migratory songbirds’ departure decisions, routes, and time it takes to cross the Gulf of Mexico. Proc. Natl. Acad. Sci. USA 2015, 112, E6331–E6338. [Google Scholar] [CrossRef] [Green Version]
- Buler, J.J.; Moore, F.R. Migrant–habitat relationships during stopover along an ecological barrier: extrinsic constraints and conservation implications. J. Ornithol. 2011, 152, S101–S112. [Google Scholar] [CrossRef]
- Loria, D.E.; Moore, F.R. Energy demands of migration on Red-eyed Vireos, Vireo olivaceus. Behav. Ecol. 1990, 1, 24–35. [Google Scholar] [CrossRef]
- Buler, J.J.; Moore, F.R.; Woltmann, S. A multi-scale examination of stopover habitat use by birds. Ecology 2007, 88, 1789–1802. [Google Scholar] [CrossRef] [Green Version]
- Seingier, G.; Espejel, I.; Fermán Almada, J.L. Cobertura vegetal y marginación en la costa mexicana. Investig. Ambiental. Cienc. Y Política Pública 2009, 1, 54–69. [Google Scholar]
- Martinez, M.L.; Lithgow, D.; Vázquez, G.; Garcia-Franco, J.G. Diagnóstico de las necesidades y probabilidades de restauración en las dunas costeras de Quintana Roo. In Experiencias Mexicanas en la Restauración de los Ecosistemas; Ceccon, E., Martinez, C., Eds.; UNAM; CRIM; UAEM; CONABIO: Mexico City, Mexico, 2016; pp. 409–431. ISBN 978-607-02-8157-0. [Google Scholar]
- Pérez-Villegas, G.; Carrascal, E. El desarrollo turístico en Cancún, Quintana Roo y sus consecuencias sobre la cubierta vegetal. Investig. Geográficas 2000, 43, 145–166. [Google Scholar]
- Ellis, E.A.; Romero-Montero, A.; Hernández-Gómez, I.U. Evaluación y Mapeo de los Determinantes de Deforestación en la Península Yucatán; United States Agency for International Development (USAID), The Nature Conservancy (TNC), Alianza México REDD+: Mexico City, Mexico, 2015. [Google Scholar]
- Lynch, J.F. Distribution of overwintering Nearctic migrants in the Yucatan Peninsula, I: General patterns of occurrence. The Condor 1989, 91, 515–544. [Google Scholar] [CrossRef]
- Lynch, J.F.; Whigham, D.F. The role of habitat disturbance in the ecology of overwintering migratory birds in the Yucatan Peninsula. In Proceedings of the Conservation of Neotropical Migratory Birds in Mexico; Maine Agricultural and Forest Experiment Station: Los Tuxtlas: Veracruz, Mexico, 1995; pp. 199–214. [Google Scholar]
- Smith, A.L.; Ortiz, J.S.; Robertson, R.J. Distribution patterns of migrant and resident birds in successional forests of the Yucatan Peninsula, Mexico. Biotropica 2001, 33, 153–170. [Google Scholar] [CrossRef]
- Amaya-Espinel, J.D.; Hostetler, M.E. The value of small forest fragments and urban tree canopy for Neotropical migrant birds during winter and migration seasons in Latin American countries: A systematic review. Landsc. Urban Plan. 2019, 190, 103592. [Google Scholar] [CrossRef]
- Archer, J.-M.J.; Hostetler, M.E.; Acomb, G.; Blair, R. A systematic review of forest bird occurrence in North American forest fragments and the built environment. Landsc. Urban Plan. 2019, 185, 1–23. [Google Scholar] [CrossRef]
- Cohen, E.B.; Barrow, W.C.; Buler, J.J.; Deppe, J.L.; Farnsworth, A.; Marra, P.P.; McWilliams, S.R.; Mehlman, D.W.; Wilson, R.R.; Woodrey, M.S.; et al. How do en route events around the Gulf of Mexico influence migratory landbird populations? The Condor 2017, 119, 327–343. [Google Scholar] [CrossRef]
- Buler, J.J.; Diehl, R.H. Quantifying bird density during migratory stopover using weather surveillance radar. IEEE Trans. Geosci. Remote Sens. 2009, 47, 2741–2751. [Google Scholar] [CrossRef]
- Larkin, R.P.; Diehl, R.H. Radar techniques for wildlife biology. In The Wildlife Techniques Manual: Volume 1: Research; Silvy, N.J., Ed.; Johns Hopkins University Press: Baltimore, MD, USA, 2012; Volume 1, pp. 319–335. [Google Scholar]
- Lakshmanan, V.; Smith, T.; Stumpf, G.; Hondl, K. The Warning Decision Support System–Integrated Information. Weather Forecast. 2007, 22, 596–612. [Google Scholar] [CrossRef]
- Åkesson, S.; Alerstam, T.; Hedenström, A. Flight initiation of nocturnal passerine migrants in relation to celestial orientation conditions at twilight. J. Avian Biol. 1996, 27, 95–102. [Google Scholar] [CrossRef] [Green Version]
- Buler, J.J.; Barrow, W.C.; Boone, M.E.; Dawson, D.K.; Diehl, R.H.; Moore, F.R.; Randall, L.A.; Schreckengost, T.D.; Smolinsky, J.A. Linking animals aloft with the terrestrial landscape. In Aeroecology; Chilson, P.B., Frick, W.F., Kelly, J.F., Liechti, F., Eds.; Springer International Publishing: Cham, Switzerland, 2017; pp. 347–378. ISBN 978-3-319-68576-2. [Google Scholar]
- UNIDATA. Integrated Data Viewer (IDV); UCAR/Unidata: Boulder, CO, USA, 2012. [Google Scholar]
- Richardson, J.W. Timing of bird migration in relation to weather: updated reivew. In Bird migration; Spring-Verlag: Berlin, Germany, 1990; pp. 78–101. [Google Scholar]
- Dokter, A.M.; Liechti, F.; Stark, H.; Delobbe, L.; Tabary, P.; Holleman, I. Bird migration flight altitudes studied by a network of operational weather radars. J. R. Soc. Interface 2011, 8, 30–43. [Google Scholar] [CrossRef] [Green Version]
- Stepanian, P.M.; Horton, K.G.; Melnikov, V.M.; Zrnić, D.S.; Gauthreaux, S.A. Dual-polarization radar products for biological applications. Ecosphere 2016, 7, e01539. [Google Scholar] [CrossRef]
- Jacobsen, E.; Lakshmanan, V. Inferring the state of the aerosphere from weather radar. In Aeroecology; Chilson, P.B., Frick, W.F., Kelly, J.F., Liechti, F., Eds.; Springer International Publishing: Cham, Switzerland, 2017; pp. 311–343. ISBN 978-3-319-68576-2. [Google Scholar]
- Chilson, P.B.; Frick, W.F.; Stepanian, P.M.; Shipley, J.R.; Kunz, T.H.; Kelly, J.F. Estimating animal densities in the aerosphere using weather radar: To Z or not to Z? Ecosphere 2012, 3, art72. [Google Scholar] [CrossRef]
- Njuguna, C. Rnightlights: Satellite Nightlight Data Extraction. 2018. Available online: https://cran.r-project.org/web/packages/Rnightlights/index.html (accessed on 10 September 2019).
- Levin, N. The impact of seasonal changes on observed nighttime brightness from 2014 to 2015 monthly VIIRS DNB composites. Remote Sens. Environ. 2017, 193, 150–164. [Google Scholar] [CrossRef]
- Falchi, F.; Cinzano, P.; Duriscoe, D.; Kyba, C.C.M.; Elvidge, C.D.; Baugh, K.; Portnov, B.A.; Rybnikova, N.A.; Furgoni, R. The new world atlas of artificial night sky brightness. Sci. Adv. 2016, 2, e1600377. [Google Scholar] [CrossRef] [PubMed] [Green Version]
- Canada Centre for Remote Sensing (CCRS); Canada Centre for Mapping and Earth Observation (CCMEO); Natural Resources Canada (NRCan); Comisión Nacional para el Conocimiento y Uso de la Biodiversidad (CONABIO); Comisión Nacional Forestal (CONAFOR); Insituto Nacional de Estadística y Geografía (INEGI). U.S. Geological Survey (USGS) North American Land Change Monitoring System (NALCMS) Collection. 2017. Available online: http://www.cec.org/tools-and-resources/map-files/land-cover-2010-landsat-30m (accessed on 25 October 2019).
- Ellis, E.A.; Gomez, U.H.; Romero-Montero, J.A. Los procesos y causas del cambio en la cobertura forestal de la Península Yucatán, México. Rev. Ecosistemas 2017, 26, 101–111. [Google Scholar] [CrossRef]
- Hansen, M.C.; Potapov, P.V.; Moore, R.; Hancher, M.; Turubanova, S.A.; Tyukavina, A.; Thau, D.; Stehman, S.V.; Goetz, S.J.; Loveland, T.R.; et al. High-Resolution Global Maps of 21st-century forest cover change. Science 2013, 342, 850–853. [Google Scholar] [CrossRef] [PubMed] [Green Version]
- Mattiuzzi, M.; Verbesselt, J.; Hengl, T.; Klisch, A.; Stevens, F.; Mosher, S.; Evans, B.; Lobo, A.; Hufkens, K.; Detsch, F. MODIS: Acquisition and Processing of MODIS Products. 2019. Available online: https://cran.r-project.org/web/packages/MODIS/index.html (accessed on 25 October 2019).
- Elith, J.; Leathwick, J.R.; Hastie, T. A working guide to boosted regression trees. J. Anim. Ecol. 2008, 77, 802–813. [Google Scholar] [CrossRef]
- De’Ath, G. Boosted trees for ecological modeling and prediction. Ecology 2007, 88, 243–251. [Google Scholar] [CrossRef]
- R Development Core Team. R: A Language and Environment for Statistical Computing; R Foundation for Statistical Computing: Vienna, Austria, 2017. [Google Scholar]
- Hijmans, R.J.; Phillips, S.; Leathwick, J.R.; Elith, J. Package “dismo”. Species distribution modeling. 2015. Available online: https://cran.r-project.org/web/packages/dismo/index.html (accessed on 25 October 2019).
- Dormann, C.F.; Elith, J.; Bacher, S.; Buchmann, C.; Carl, G.; Carré, G.; Marquéz, J.R.G.; Gruber, B.; Lafourcade, B.; Leitão, P.J.; et al. Collinearity: a review of methods to deal with it and a simulation study evaluating their performance. Ecography 2013, 36, 27–46. [Google Scholar] [CrossRef]
- Hutto, R.L. Habitat selection by nonbreeding, migratory land birds. In Habitat Selection in Birds; Cody, M.L., Ed.; Academic Press, Inc.: Orlando, FL, USA, 1985; pp. 455–476. [Google Scholar]
- Chernetsov, N. Habitat selection by nocturnal passerine migrants en route: mechanisms and results. J. Ornithol. 2006, 147, 185–191. [Google Scholar] [CrossRef]
- Deppe, J.L.; Rotenberry, J.T. Scale-dependent habitat use by fall migratory birds: vegetation structure, floristics, and geography. Ecol. Monogr. 2008, 78, 461–487. [Google Scholar] [CrossRef]
- Loss, S.R.; Will, T.; Marra, P.P. Direct mortality of birds from anthropogenic causes. Annu. Rev. Ecol. Evol. Syst. 2015, 46, 99–120. [Google Scholar] [CrossRef] [Green Version]
- Loss, S.R.; Lao, S.; Eckles, J.W.; Anderson, A.W.; Blair, R.B.; Turner, R.J. Factors influencing bird-building collisions in the downtown area of a major North American city. PLoS ONE 2019, 14, e0224164. [Google Scholar] [CrossRef] [Green Version]
- Gómez, C.; Bayly, N.J.; Norris, D.R.; Mackenzie, S.A.; Rosenberg, K.V.; Taylor, P.D.; Hobson, K.A.; Cadena, C.D. Fuel loads acquired at a stopover site influence the pace of intercontinental migration in a boreal songbird. Sci. Rep. 2017, 7, 1–11. [Google Scholar] [CrossRef] [Green Version]
- Ellis, E.A.; Romero Montero, J.A.; Hernández Gómez, I.U. Deforestation processes in the state of Quintana Roo, Mexico: The role of land use and community forestry. Trop. Conserv. Sci. 2017, 10, 1940082917697259. [Google Scholar] [CrossRef] [Green Version]
- Raymundo-Sanchez, A.A. Avian community structure and diversity in relation to coastal development in the Sian Ka’an Biosphere Reserve and Riviera Maya, Quintana Roo, Mexico. Master’s Thesis, University of Tennessee, Knoxville, TN, USA, 2010. [Google Scholar]
- CONANP. Programa de Conservación y Manejo Reserva de la Biosfera Los Petenes, Mexico, 1st ed.; Comisión Nacional de Áreas Naturales Protegidas: Mexico City, Mexico, 2006; ISBN 968-817-813-6.
- SEMARNAT. Programa de Manejo Reserva de la Biosfera Ria Celestun, Mexico; Secretaria de Medio Ambiente y Recursos Naturales: Mexico City, Mexico, 2000.
- Li, X.; Ma, R.; Zhang, Q.; Li, D.; Liu, S.; He, T.; Zhao, L. Anisotropic characteristic of artificial light at night—Systematic investigation with VIIRS DNB multi-temporal observations. Remote Sens. Environ. 2019, 233, 111357. [Google Scholar] [CrossRef]
- Levin, N.; Kyba, C.C.M.; Zhang, Q.; Sánchez de Miguel, A.; Román, M.O.; Li, X.; Portnov, B.A.; Molthan, A.L.; Jechow, A.; Miller, S.D.; et al. Remote sensing of night lights: A review and an outlook for the future. Remote Sens. Environ. 2020, 237, 111443. [Google Scholar] [CrossRef]
- Román, M.O.; Wang, Z.; Sun, Q.; Kalb, V.; Miller, S.D.; Molthan, A.; Schultz, L.; Bell, J.; Stokes, E.C.; Pandey, B.; et al. NASA’s Black Marble nighttime lights product suite. Remote Sens. Environ. 2018, 210, 113–143. [Google Scholar] [CrossRef]
- Elvidge, C.D.; Baugh, K.; Zhizhin, M.; Hsu, F.C.; Ghosh, T. VIIRS night-time lights. Int. J. Remote Sens. 2017, 38, 5860–5879. [Google Scholar] [CrossRef]
- Kocifaj, M.; Bará, S. Two-index model for characterizing site-specific night sky brightness patterns. Mon. Not. R. Astron. Soc. 2019, 490, 1953–1960. [Google Scholar] [CrossRef]
- Strmiska, I. Modernización del Servicio Meteorológico Nacional—Fortalecimiento y desarrollo estratégico de la Red Nacional de Radares Meteorológicos; Informe OMM/PREMIA; CONAGUA, OMM: Mexico City, Mexico, 2010; p. 45. [Google Scholar]
- Gauthreaux, S.A.; Belser, C.G. Displays of bird movements on the WSR-88D: Patterns and quantification. Wea. Forecast. 1998, 13, 453–464. [Google Scholar] [CrossRef]
- Gauthreaux, S.A.; Belser, C.G. Radar ornithology and biological conservation. The Auk 2003, 120, 266–277. [Google Scholar] [CrossRef]
- Ryzhkov, A.V.; Zrnic, D. Radar polarimetry at S, C, and X bands: Comparative analysis and operational implications. In Proceedings of the 32nd Conference on Radar Meteorology; American Meteorological Society: Albuquerque, NM, USA, 2005; p. 6. [Google Scholar]
- Johnson, B.C.; Brandes, E.A. Attenuation of a 5-Cm wavelength radar signal in the Lahoma-Orienta storms. J. Atmos. Ocean. Technol. 1987, 4, 512–517. [Google Scholar] [CrossRef]
- Lin, T.-Y.; Winner, K.; Bernstein, G.; Mittal, A.; Dokter, A.M.; Horton, K.G.; Nilsson, C.; Doren, B.M.V.; Farnsworth, A.; Sorte, F.A.L.; et al. MistNet: Measuring historical bird migration in the US using archived weather radar data and convolutional neural networks. Methods Ecol. Evol. 2019, 10, 1908–1922. [Google Scholar] [CrossRef]
- Dokter, A.M.; Desmet, P.; Spaaks, J.H.; Hoey, S.; van Veen, L.; Verlinden, L.; Nilsson, C.; Haase, G.; Leijnse, H.; Farnsworth, A.; et al. bioRad: biological analysis and visualization of weather radar data. Ecography 2019, 42, 852–860. [Google Scholar] [CrossRef] [Green Version]


| Name | Description (units) |
|---|---|
| Light pollution | |
| Distance to bright lights | Distance of radar sample volumes to areas with bright artificial lights at night (m) |
| Mean ALAN intensity | Average intensity of Artificial Lights at Night during migration months of year 2012 (log10 + 0.001 nW cm2 sr) |
| Coast | |
| Distance to coast | Distance of radar sample volumes to GOM coastline (m) |
| Land cover | |
| Evergreen forest | Proportion of evergreen forest within radar sample volumes |
| Deciduous forest | Proportion of deciduous forest within radar sample volumes |
| Mixed forest | Proportion of mixed forest within radar sample volumes |
| Shrubland | Proportion of shrubland forest within radar sample volumes |
| Grassland | Proportion of grassland within radar sample volumes |
| Barren | Proportion of barren lands within radar sample volumes |
| Wetland | Proportion of wetland within radar sample volumes |
| Cropland | Proportion of cropland forest within radar sample volumes |
| Urban | Proportion of urban forest within radar sample volumes |
| Water | Proportion of water cover within radar sample volumes |
| Unspecified non-forest | Proportion of unspecified land cover in areas of recent forest loss within radar sample volumes |
| Mean NDVI | Mean seasonal Normalized Difference Vegetation Index within radar sample volumes |
| Corrective | |
| Distance to radar | Distance of radar sample volumes to radar (m) |
| Relative elevation | Difference between radar antenna height and ground height (m) |
| Sabancuy | Cancun | |||
|---|---|---|---|---|
| Year | Spring | Autumn | Spring | Autumn |
| 2011 | 15 | |||
| 2012 | 17 | 8 | ||
| 2014 | 23 | 8 | ||
| 2015 | 18 | 8 | ||
| Total | 41 | 31 | 17 | 8 |
| Predictor | Sabancuy | Cancun | ||
|---|---|---|---|---|
| Spring | Autumn | Spring | Autumn | |
| Light pollution | ||||
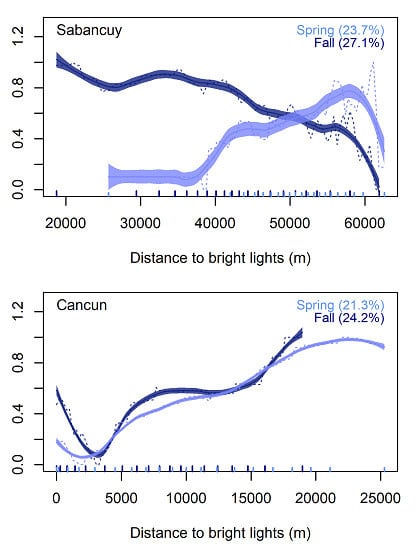
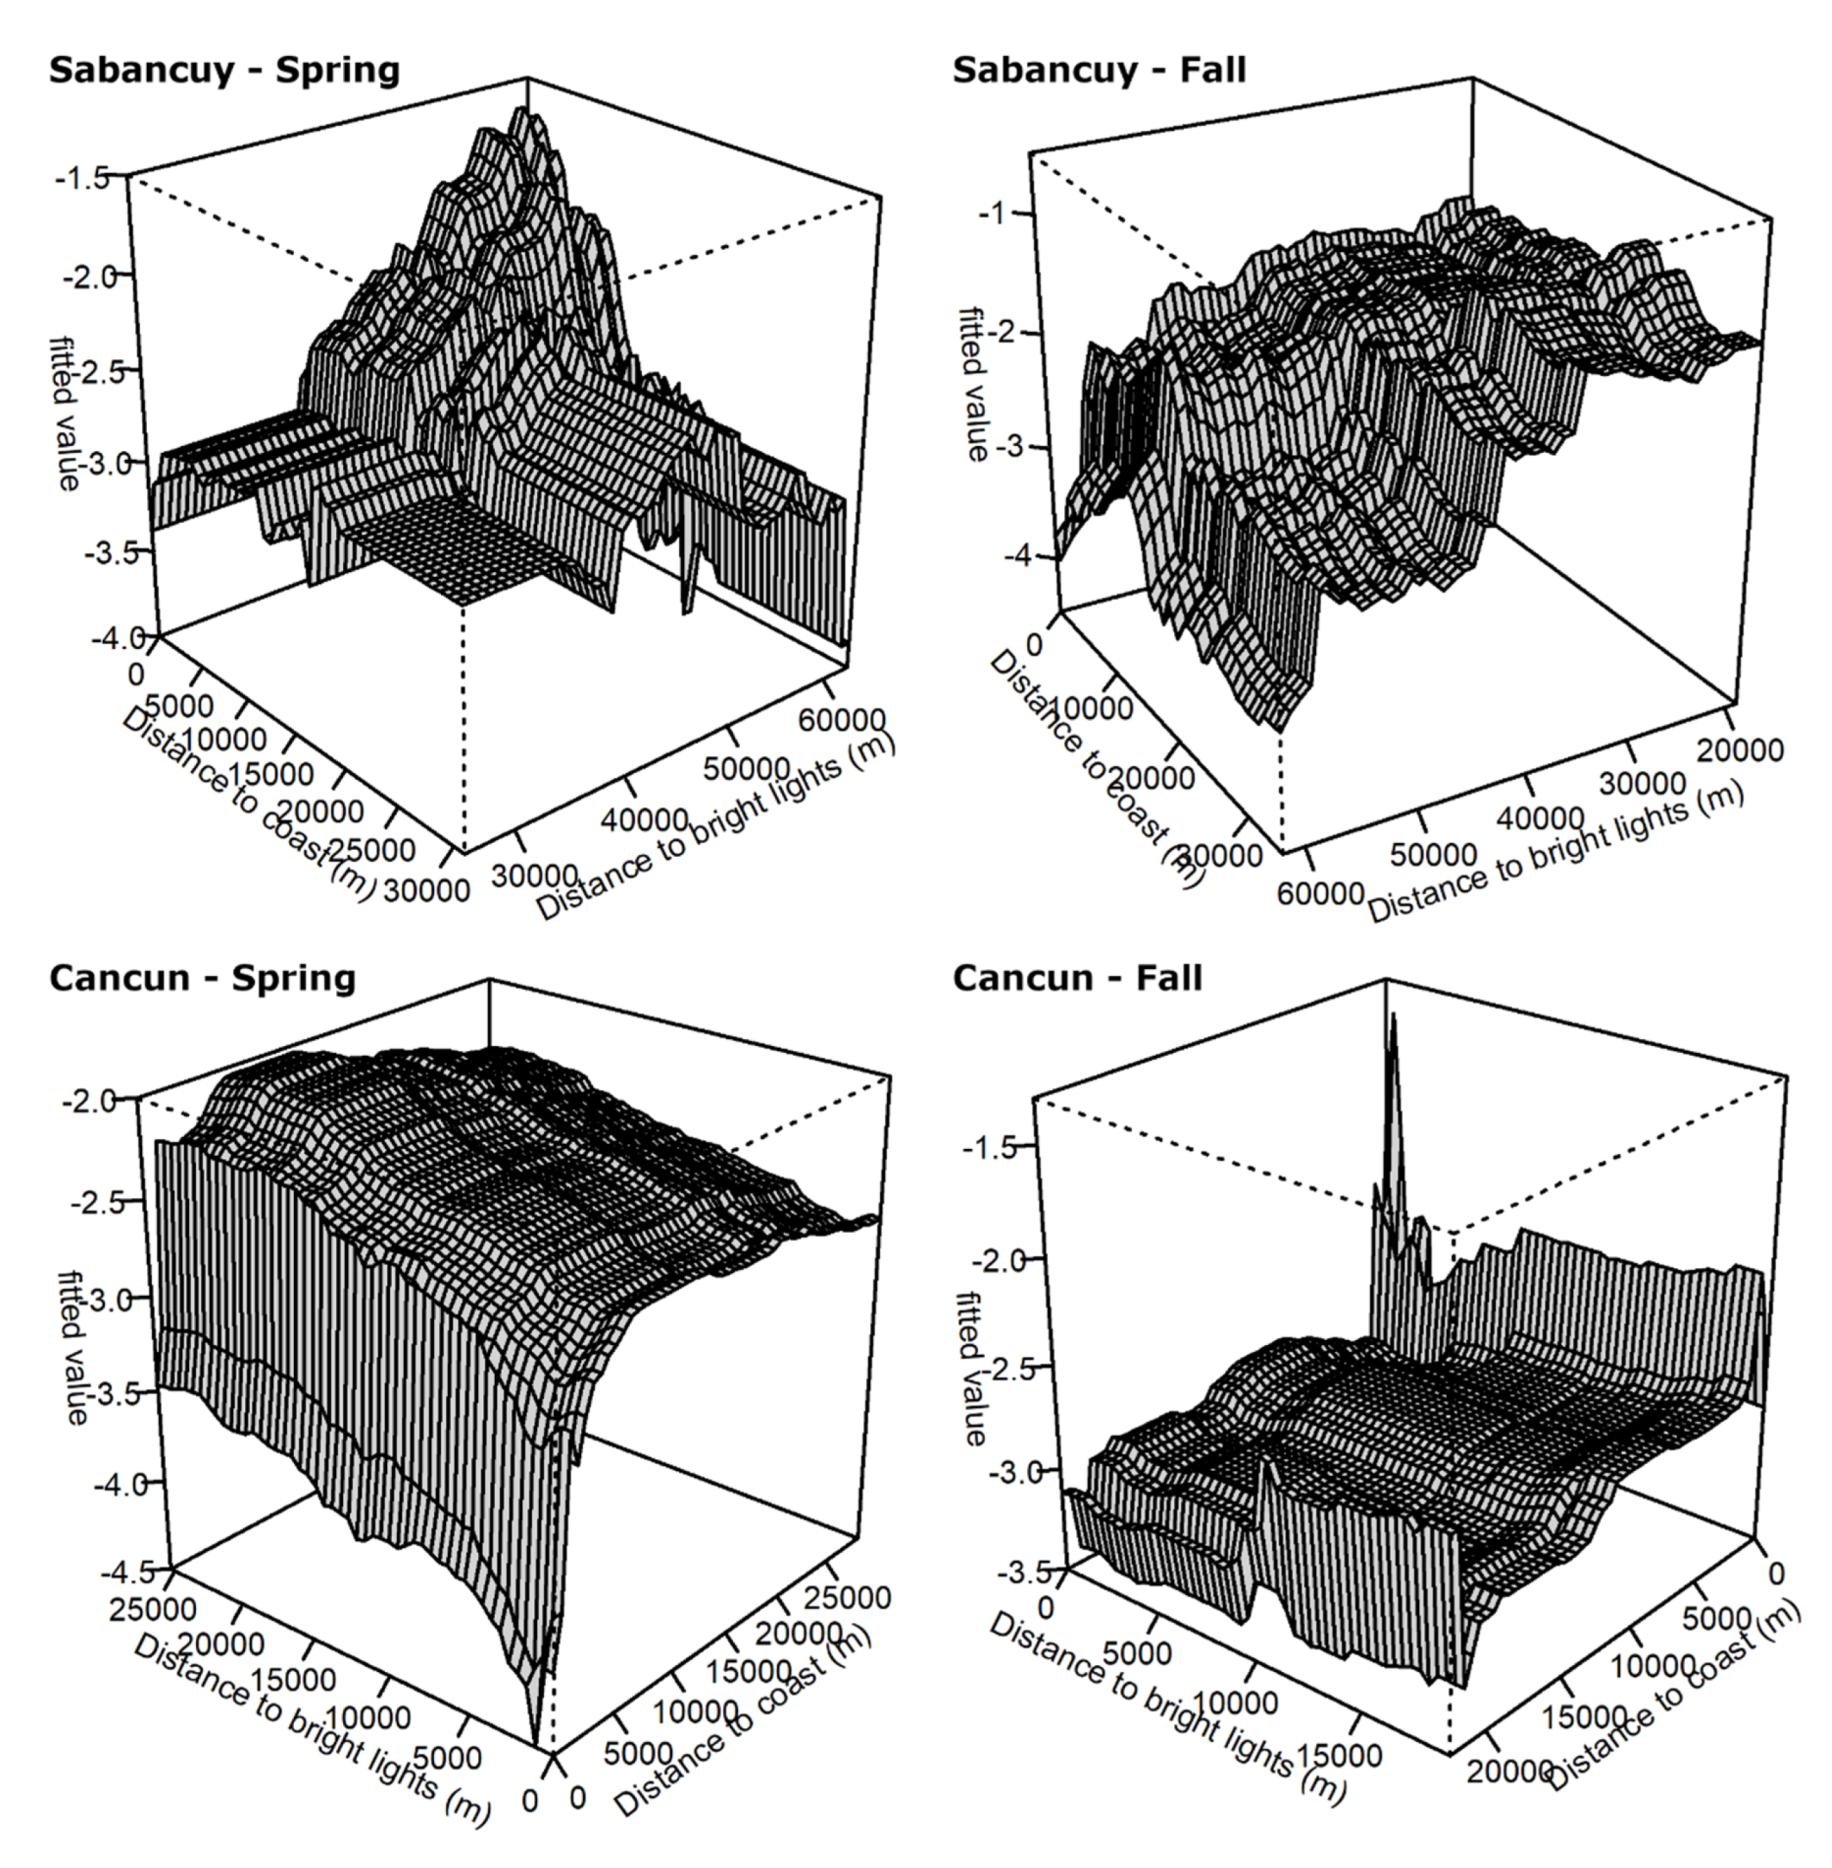
| Distance to bright lights | 23.73 | 27.15 | 21.34 | 24.18 |
| Mean ALAN intensity | 12.83 | 13.66 | 19.67 | 17.81 |
| Coast | ||||
| Distance to coast | 35.69 | 21.37 | 30.12 | 26.75 |
| Land cover | ||||
| Evergreen forest | 2.34 | 3.75 | 4.60 | 0.45 |
| Deciduous forest | - | 0.00 | 0.06 | 0.06 |
| Mixed forest | - | - | - | - |
| Shrubland | - | - | 0.00 | 0.00 |
| Grassland | - | 4.00 | 0.05 | 0.01 |
| Barren | 0.00 | 0.93 | 0.07 | 0.12 |
| Wetland | 5.20 | 9.50 | 4.76 | 3.51 |
| Cropland | 0.00 | 0.15 | - | - |
| Urban | 1.58 | 0.87 | 2.01 | 5.43 |
| Water | 0.55 | 0.83 | 12.70 | 12.44 |
| Unspecified non-forest | 5.32 | 2.93 | 0.49 | 1.55 |
| Mean NDVI | 12.76 | 14.87 | 4.12 | 7.70 |
| Sum | 90.33 | 86.54 | 88.59 | 88.87 |
| Mean ± SE of cross-validation correlation | 0.53 ± 0.00 | 0.56 ± 0.00 | 0.86 ± 0.01 | 0.47 ± 0.01 |
© 2020 by the authors. Licensee MDPI, Basel, Switzerland. This article is an open access article distributed under the terms and conditions of the Creative Commons Attribution (CC BY) license (http://creativecommons.org/licenses/by/4.0/).
Share and Cite
Cabrera-Cruz, S.A.; Cohen, E.B.; Smolinsky, J.A.; Buler, J.J. Artificial Light at Night is Related to Broad-Scale Stopover Distributions of Nocturnally Migrating Landbirds along the Yucatan Peninsula, Mexico. Remote Sens. 2020, 12, 395. https://doi.org/10.3390/rs12030395
Cabrera-Cruz SA, Cohen EB, Smolinsky JA, Buler JJ. Artificial Light at Night is Related to Broad-Scale Stopover Distributions of Nocturnally Migrating Landbirds along the Yucatan Peninsula, Mexico. Remote Sensing. 2020; 12(3):395. https://doi.org/10.3390/rs12030395
Chicago/Turabian StyleCabrera-Cruz, Sergio A., Emily B. Cohen, Jaclyn A. Smolinsky, and Jeffrey J. Buler. 2020. "Artificial Light at Night is Related to Broad-Scale Stopover Distributions of Nocturnally Migrating Landbirds along the Yucatan Peninsula, Mexico" Remote Sensing 12, no. 3: 395. https://doi.org/10.3390/rs12030395