Article

Constant Light in Critical Postnatal Days Affects Circadian Rhythms in Locomotion and Gene Expression in the Suprachiasmatic Nucleus, Retina, and Pineal Gland Later in Life

by
Aneta Kubištová
1,
Veronika Spišská
1,
Lucie Petrželková
1,
Leona Hrubcová
1,
Simona Moravcová
1,2,
Lenka Maierová
3 and
Zdeňka Bendová
1,2,*
1
Department of Physiology, Faculty of Science, Charles University, 128 43 Prague, Czech Republic
2
Department of Sleep Medicine and Chronobiology, National Institute of Mental Health, 250 67 Klecany, Czech Republic
3
University Center for Energy Efficient Buildings, Czech Technical University in Prague, 273 43 Buštěhrad, Czech Republic
*
Author to whom correspondence should be addressed.
Biomedicines 2020, 8(12), 579; https://doi.org/10.3390/biomedicines8120579
Submission received: 19 October 2020 / Revised: 3 December 2020 / Accepted: 4 December 2020 / Published: 7 December 2020
(This article belongs to the Section Molecular and Translational Medicine)

Abstract

:
The circadian clock regulates bodily rhythms by time cues that result from the integration of genetically encoded endogenous rhythms with external cycles, most potently with the light/dark cycle. Chronic exposure to constant light in adulthood disrupts circadian system function and can induce behavioral and physiological arrhythmicity with potential clinical consequences. Since the developing nervous system is particularly vulnerable to experiences during the critical period, we hypothesized that early-life circadian disruption would negatively impact the development of the circadian clock and its adult function. Newborn rats were subjected to a constant light of 16 lux from the day of birth through until postnatal day 20, and then they were housed in conditions of L12 h (16 lux): D12 h (darkness). The circadian period was measured by locomotor activity rhythm at postnatal day 60, and the rhythmic expressions of clock genes and tissue-specific genes were detected in the suprachiasmatic nuclei, retinas, and pineal glands at postnatal days 30 and 90. Our data show that early postnatal exposure to constant light leads to a prolonged endogenous period of locomotor activity rhythm and affects the rhythmic gene expression in all studied brain structures later in life.

1. Introduction

The light/dark cycle exerts a range of physiological responses in organisms, predominantly via synchronizing the circadian system. The mammalian circadian system is composed of a master circadian pacemaker in the suprachiasmatic nucleus (SCN) of the hypothalamus and peripheral oscillators in most tissues and organs. The SCN generates self-sustained rhythms in gene expression and electrical activity that oscillate with a circadian period of approximately 24 h and produce the humoral or electrical timing signals that are distributed throughout the body [1]. The molecular clockwork underlying this endogenous periodicity is based on the transcriptional/translational feedback loops of clock genes, such as Period 1, 2, Clock, Bmal1, Cryptochromes, Nr1d1 (encoding nuclear receptor Rev-erbα), and Rorα [2].
Although the circadian system generates circadian rhythms even in complete darkness, its precise 24 h periodicity requires perpetual resetting by the solar light/dark cycle. Light information for the SCN is formed by the intrinsic photosensitive retinal ganglion cells (ipRGCs) containing the photopigment melanopsin (Opn4), which has maximum sensitivity within short-wavelength light (peak absorption ~479 nm) [3]. The ipRGCs combine rod- and cone- with melanopsin-driven activities and transduce them into the glutamatergic signal that affects the SCN molecular clockwork predominantly via NMDA receptors [4]. In addition to melanopsin, another non-visual opsin, Opn5 (neuropsin), has been identified in the ganglion cell layer of rat retinas [5], which respond to UV light (peak absorption ~380 nm). It has been reported to drive the entrainment of retinal circadian oscillators to light/dark cycles independent of rods, cones, and Opn4 [6].
A prominent endocrine manifestation of the circadian clock is the daily cycle of the melatonin level. Melatonin is synthesized by the pineal gland at night and in darkness, upon signaling from the SCN, and its rhythmic release to the bloodstream serves as a timing signal to peripheral oscillators. Melatonin biosynthesis in animals includes four enzymatic steps: first tryptophan hydroxylase (TPH) hydroxylates tryptophan to 5-hydroxytryptophan, which is then decarboxylated by aromatic amino acid decarboxylase to form serotonin. The rate-limiting enzyme, arylalkylamine-N-acetyltransferase (AANAT), plays a key role in the conversion of serotonin into N-acetylserotonin, and the last enzyme, N-acetylserotonin O-methyltransferase, catalyzes N-acetylserotonin to produce melatonin [7]. Inducible cAMP early repressor (ICER) is induced at night by noradrenaline in the pineal gland, and it may participate in regulating the decline in Aanat transcriptional rhythm toward the end of the night [8,9,10,11].
Although the alignment of the endogenous circadian with the exogenous solar period is generally called “light entrainment”, the high contrast between day and night intensity and the spectral change around dawn and dusk are necessary for the proper entrainment of the clock in nocturnal and diurnal animals [12,13]. Continuous exposure to light (LL) or even dim light at night (LAN) causes the desynchronization of SCN neurons and subsequently of the peripheral clock in bodily tissues [1,14,15,16,17] (also see [18]). The disruption of temporal coordination throughout the body has been associated with an increased risk of cancer, immune deficiencies, metabolic syndrome, type 2 diabetes mellitus, cardiovascular disease, psychiatric diseases, and sleep diseases in human and laboratory animal models [19].
Most up-to-date data present severe indications that LL or LAN can disrupt circadian physiology and the subsequent regulatory processes in the body in adulthood, but the evidence on its disruptive effect in early postnatal development on neuronal and physiological maturation is less clear. During ontogeny, the SCN maturates gradually. The spontaneous expression of the clock genes is detectable already before birth [20,21], and the amplitude of their rhythms increases during the first two weeks of life [22,23,24]. The neonatal rat SCN responds to acute light even before eye opening, but the entrainment of its circadian phase occurs only during the first two postnatal weeks [22].
Using the locomotor activity rhythm as a behavioral correlate of circadian clock function, the critical developmental period for the effect of LL on the maturation of the circadian system has been defined for rats between postnatal day 0 (P0) and P21 [25,26,27]. Since then, several studies have suggested that the LL condition during this lactation period has long-lasting effects on circadian system maturation: this affects the strength of the circadian pacemaker and its sensitivity to light in adulthood [28,29], impairs the circadian regulation of the metabolism [30], affects the morphology of the SCN [31,32] and SCN-targeted brain structures [32,33], and decreases day/night differences in plasma corticosterone and melatonin plasma levels [34,35].
Using a similar protocol, we tested the effect of development in LL during the lactation period on locomotor activity and gene expression in three principal brain parts of the circadian system: the SCN, retina, and pineal gland. It has been shown that LL rearing had a significant damaging effect on the retinas of albino mice and rats [29,36]. Although we worked with light substantially lower than the damaging intensity, we used pigmented Long–Evans rats, which allowed a better association of the obtained laboratory data with more natural ecological or biomedical observations.
Our data show that early postnatal exposure to LL leads to a prolonged endogenous period of activity and affects rhythmic gene expression later in life. The most affected structure was the pineal gland, where the majority of tested genes showed lowered amplitudes in animals reared in LL, followed by the SCN. In the retina, Opn4, Opn5, and rhodopsin (Rho), but not the gene for short-wavelength-sensitive (S) cone (Opn1sw), showed altered expression profiles in adulthood in animals raised under LL.

2. Materials and Methods

2.1. Animals and Experimental Design

Twenty female and 10 male Long–Evans rats (Charles River Laboratories International, Inc., delivered by Velaz, Ltd., Prague, Czech Republic) were maintained under a 12/12 h light/dark (LD) regime at a temperature of 23 ± 2 °C with free access to food and water at least 2 weeks before mating. The light source used in the study was a customized linear daylight white LED source (CCT 5630 K, Spectrasol, Prague, Czech Republic) with a dominant wavelength at 459 nm, producing uniform ground irradiance of 65.9 ± 3.0 mW/m2 (mean + SEM), that is, photopic illuminance 16.6 ± 1 lx (measured on the cage position). The mean photon flux was 1.91 × 10¹³ photons/cm2/s, with a mean melanopic irradiance of 20.6 ± 1 mW/m2. Irradiance and spectral characteristics were measured using a calibrated radiospectrometer (GL Spectis 1.0 Touch, GL Optics, Puszczykowo, Poland).
One day before the expected delivery, the light was switched on, and litters with dams were left undisturbed in constant light conditions (LL; 16 lux) until postnatal day 20 (P20). On P21, animals were returned to LD conditions (12 h of 16 lux/12 h of complete darkness) and left undisturbed until P30 or P90. The control animals were left on the LD regime throughout life.
On the day of the experiment, at P30, 72 control and 72 LL-exposed animals (4 females and 4 males at each time point) were released into constant darkness (DD) and sacrificed by rapid decapitation under sodium pentobarbital anesthesia in 3 h intervals, and the remaining animals were weaned from their mothers. On P60, the locomotor activity of 12 animals from each group were measured for 12 days in DD, and then all animals were returned to LD conditions. On P90, 54 animals (11 males and 15 females in the control group and 11 males and 17 females in the LL group) were sacrificed by rapid decapitation under sodium pentobarbital anesthesia in one-day DD conditions at 4 time points. Time was expressed as circadian time (CT), where CT0 corresponds to the time with lights on, and CT12 with lights off.
This study was carried out in strict accordance with the recommendations in the Guide for the Care and Use of Laboratory Animals of the National Institutes of Health. The protocol was approved by the Animal Protection Law of the Czech Republic (protocol number: MSMT-31592/2019-4, 2 December 2019).

2.2. Locomotor Activity Measurement

The locomotor activity of 11 control and 11 LL-exposed male rats at P60 was monitored in DD via infrared motion detectors (Mini-Mitter VitalView data-acquisition system). The circadian parameters of locomotor activity were detected using ClockLab analysis (version 6, Actimetrics, Wilmette, IL, USA). A free-running period was determined by using a Χ2 periodogram with 3 min resolution between 10 and 36 hours for 12 days in DD. The relative amplitude (RA) of the free-running rhythm was determined from a fast Fourier transformation. Nonparametric interdaily stability (IS) values are expressed in arbitrary units, ranging from zero for Gaussian noise to 1 for maximal IS, and decreasing with a higher day-to-day variation of the activity pattern [37].

2.3. Quantitative Real-Time RT–PCR

Pineal glands and retinas were immediately dissected and homogenized in RNAzol RT (Molecular Research Center). Total RNA was extracted using Direct-zolTM RNA MiniPrep (Zymo Research), in accordance with the manufacturer’s instructions. Total RNA (1 µg) was converted to cDNA by using the one-step SuperScriptTM VILOTM cDNA Synthesis Kit (Invitrogen, Carlsbad, CA, USA) according to the manufacturer’s instructions. The blocks of tissue containing the hypothalamus were sectioned into a series of 20 μm-thick coronal slices throughout the rostral-caudal extent of the SCN. The slices were stained with ethanolic cresyl violet for 60 s, and SCN regions were isolated using laser microdissection (LMD 6000; Leica Microsystems, Wetzlar, Germany) and immediately homogenized in RLT buffer (RNeasy Plus Micro kit; Qiagen, Hilden, Germany). Total RNA was extracted with the Rneasy Plus Micro Kit (Qiagen) according to the manufacturer’s instructions. We converted 1 μg of total RNA to cDNA using 2-step Enhanced Avian Reverse Transcriptase eAMV RT (Sigma-Aldrich, St. Louis, MO, USA) according to the manufacturer’s instructions. TaqMan® PreAmp Master Mix (Life Technologies, Carlsbad, CA, USA) was used to pre-amplify small amounts of cDNA after reverse transcription.
Samples of cDNA (1 μL) were amplified in 20 μL of PCR reaction mixture containing 5× HOT FIREPol Probe qPCR Mix Plus (Baria, Prague, Czech Republic) and TaqMan probes (Life Technologies; Table 1). All qPCR reactions were performed in triplicate in a LightCycler 480 Instrument (Roche Life Science, Indianapolis, IN, USA), as described before [36]. The mean of the crossing point (Cp) obtained from qPCR was normalized to the level of the housekeeping gene Gapdh (retina and SCN) and Hprt (pineal glands) and used for the analysis of relative gene expression by the ΔΔCT method [38]. Due to a large number of samples, always two samples per time point were processed at once with a new set of housekeeping genes. Thus, the data are plotted as means of 6 to 8 values obtained from 4 ΔΔCT calculations.

2.4. Data Analysis and Statistical Procedures

The rhythmicity of gene expression was evaluated using one-way ANOVA for the effect of time and was further analyzed using cosinor analysis, as defined by the equation [Y = mesor + (amplitude* − cos(2*p*(X − acrophase)/wavelength], with a constant wavelength of 24 h, a horizontal line fit model (H0), and cosine curve as the alternative hypothesis. Rhythmicity was proved when both tests showed significant results. When rhythmicity was confirmed by both tests, the cosine curve parameters were calculated: mesor (the mid-value of the cosine curve representing a rhythm-adjusted mean), amplitude (the difference between the peak or trough and the mean value of the cosine curve), and acrophase (the time of the peak of fitted curve, representing the average time of high values in the data), which were compared by one-way ANOVA followed by Tukey’s multiple comparisons test. Two-way ANOVA was used with a post hoc pairwise comparison by the Sidak–Bonferroni method to compare the control and LL-exposed groups. Data are reported as the mean ± SEM of 6 to 8 animals. Two-tailed t-tests were performed to compare the trends in period length, amplitude, and interdaily stability of rhythm in a locomotor activity. The F test to compare the variances between groups was also considered. p < 0.05 was required for significance. All tests were performed in Graph Pad Prism 6 (GraphPad Software Inc., San Diego, CA, USA).

3. Results

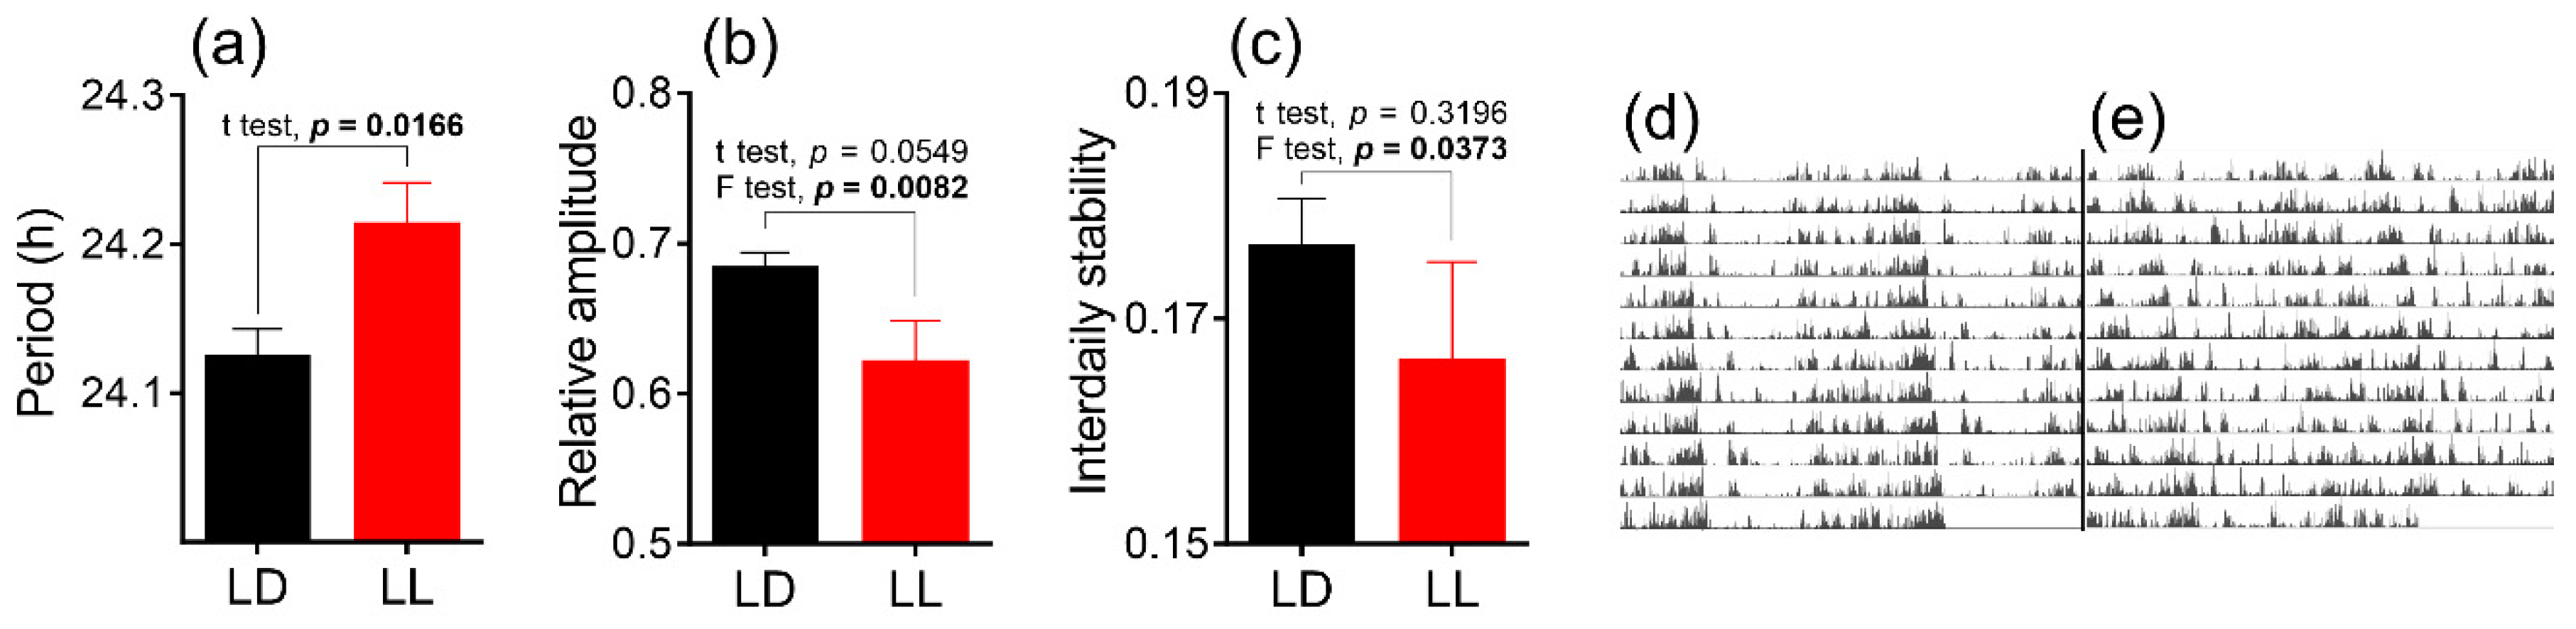
3.1. Effects of Postnatal LL Condition on Locomotor Activity of Adult Male Rats

Locomotor activity measurement at P60 showed a significantly longer endogenous period in LL-reared animals compared to the light/dark (LD) group (Figure 1a). We also calculated relative amplitude (RA; Figure 1b) and interdaily stability (IS; Figure 1c). RA values reflect the differences in activity levels between the most and least active periods of the day, ranging from 0 (low variability) to 1 (clear distinction). IS represents the stability of the rhythm from one day to the next. A lower IS value means higher inter-daily variation. Although the means of RA and IS factors do not show a significant difference between groups, the data show a significantly different factor of variances, suggesting less stable rhythmicity in the LL-reared group. The total daily activities were similar between the groups (mean LD group = 3073.19 ± 123, mean LL group = 3092.41 ± 145).

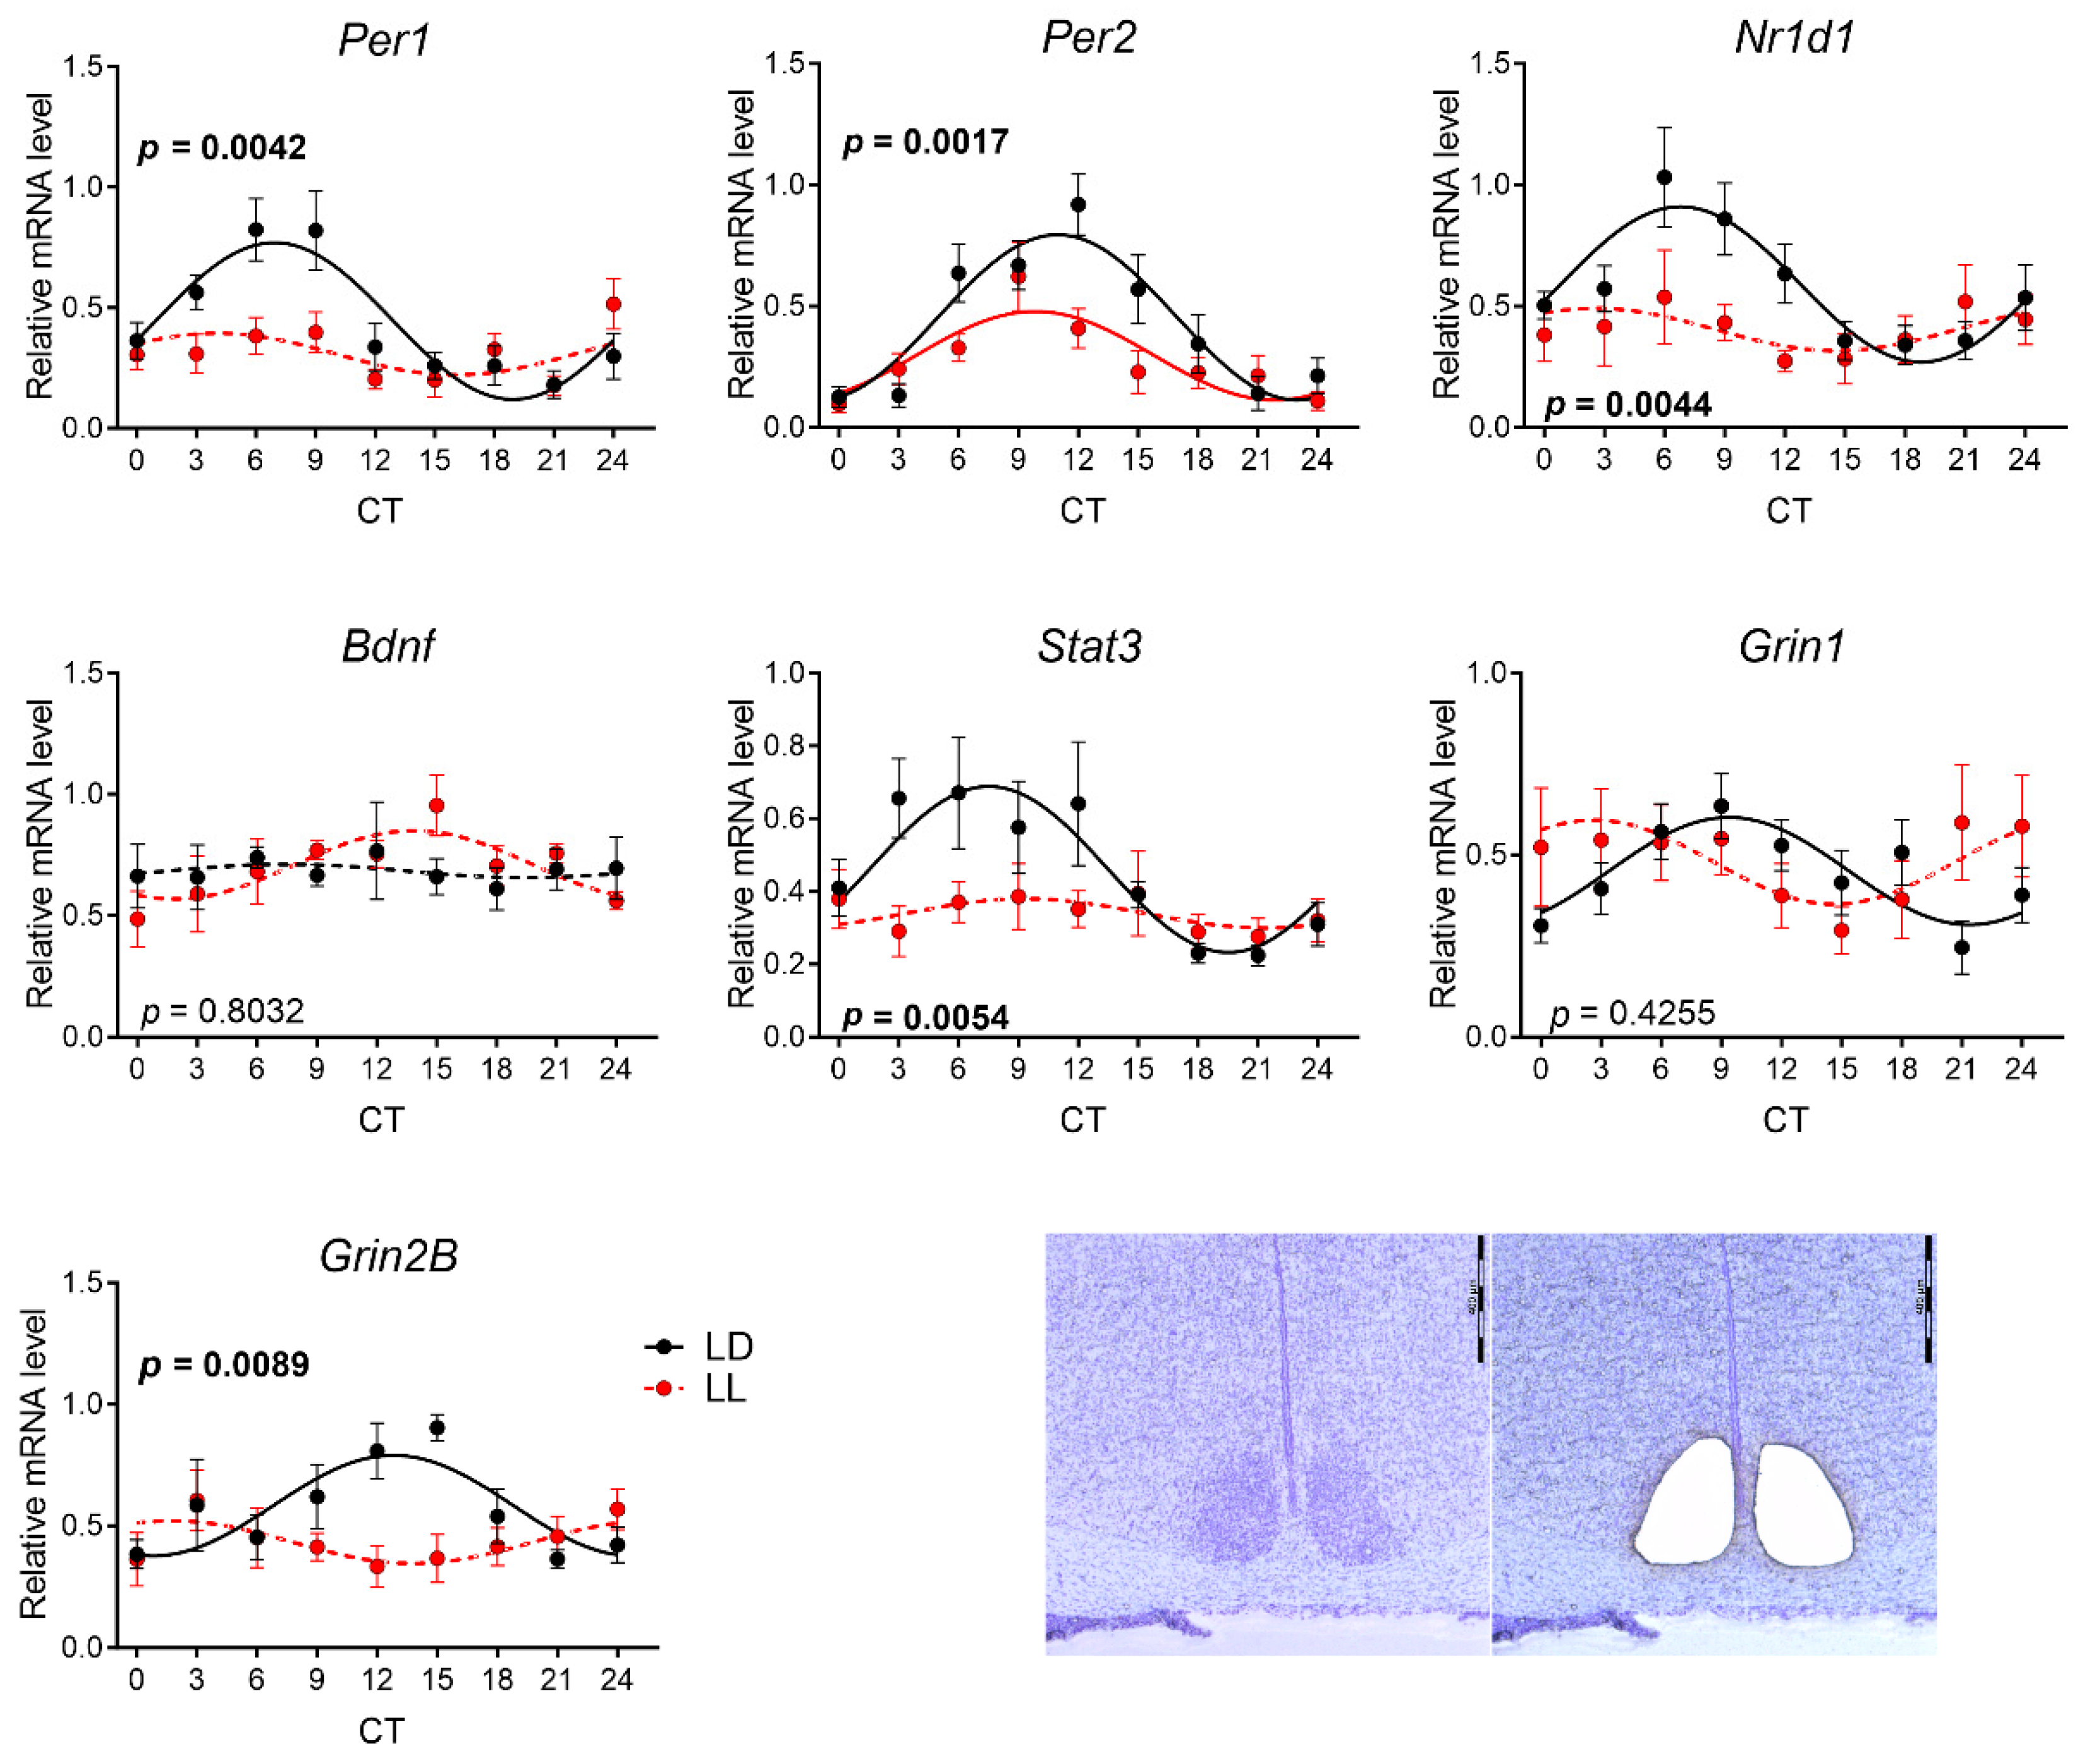
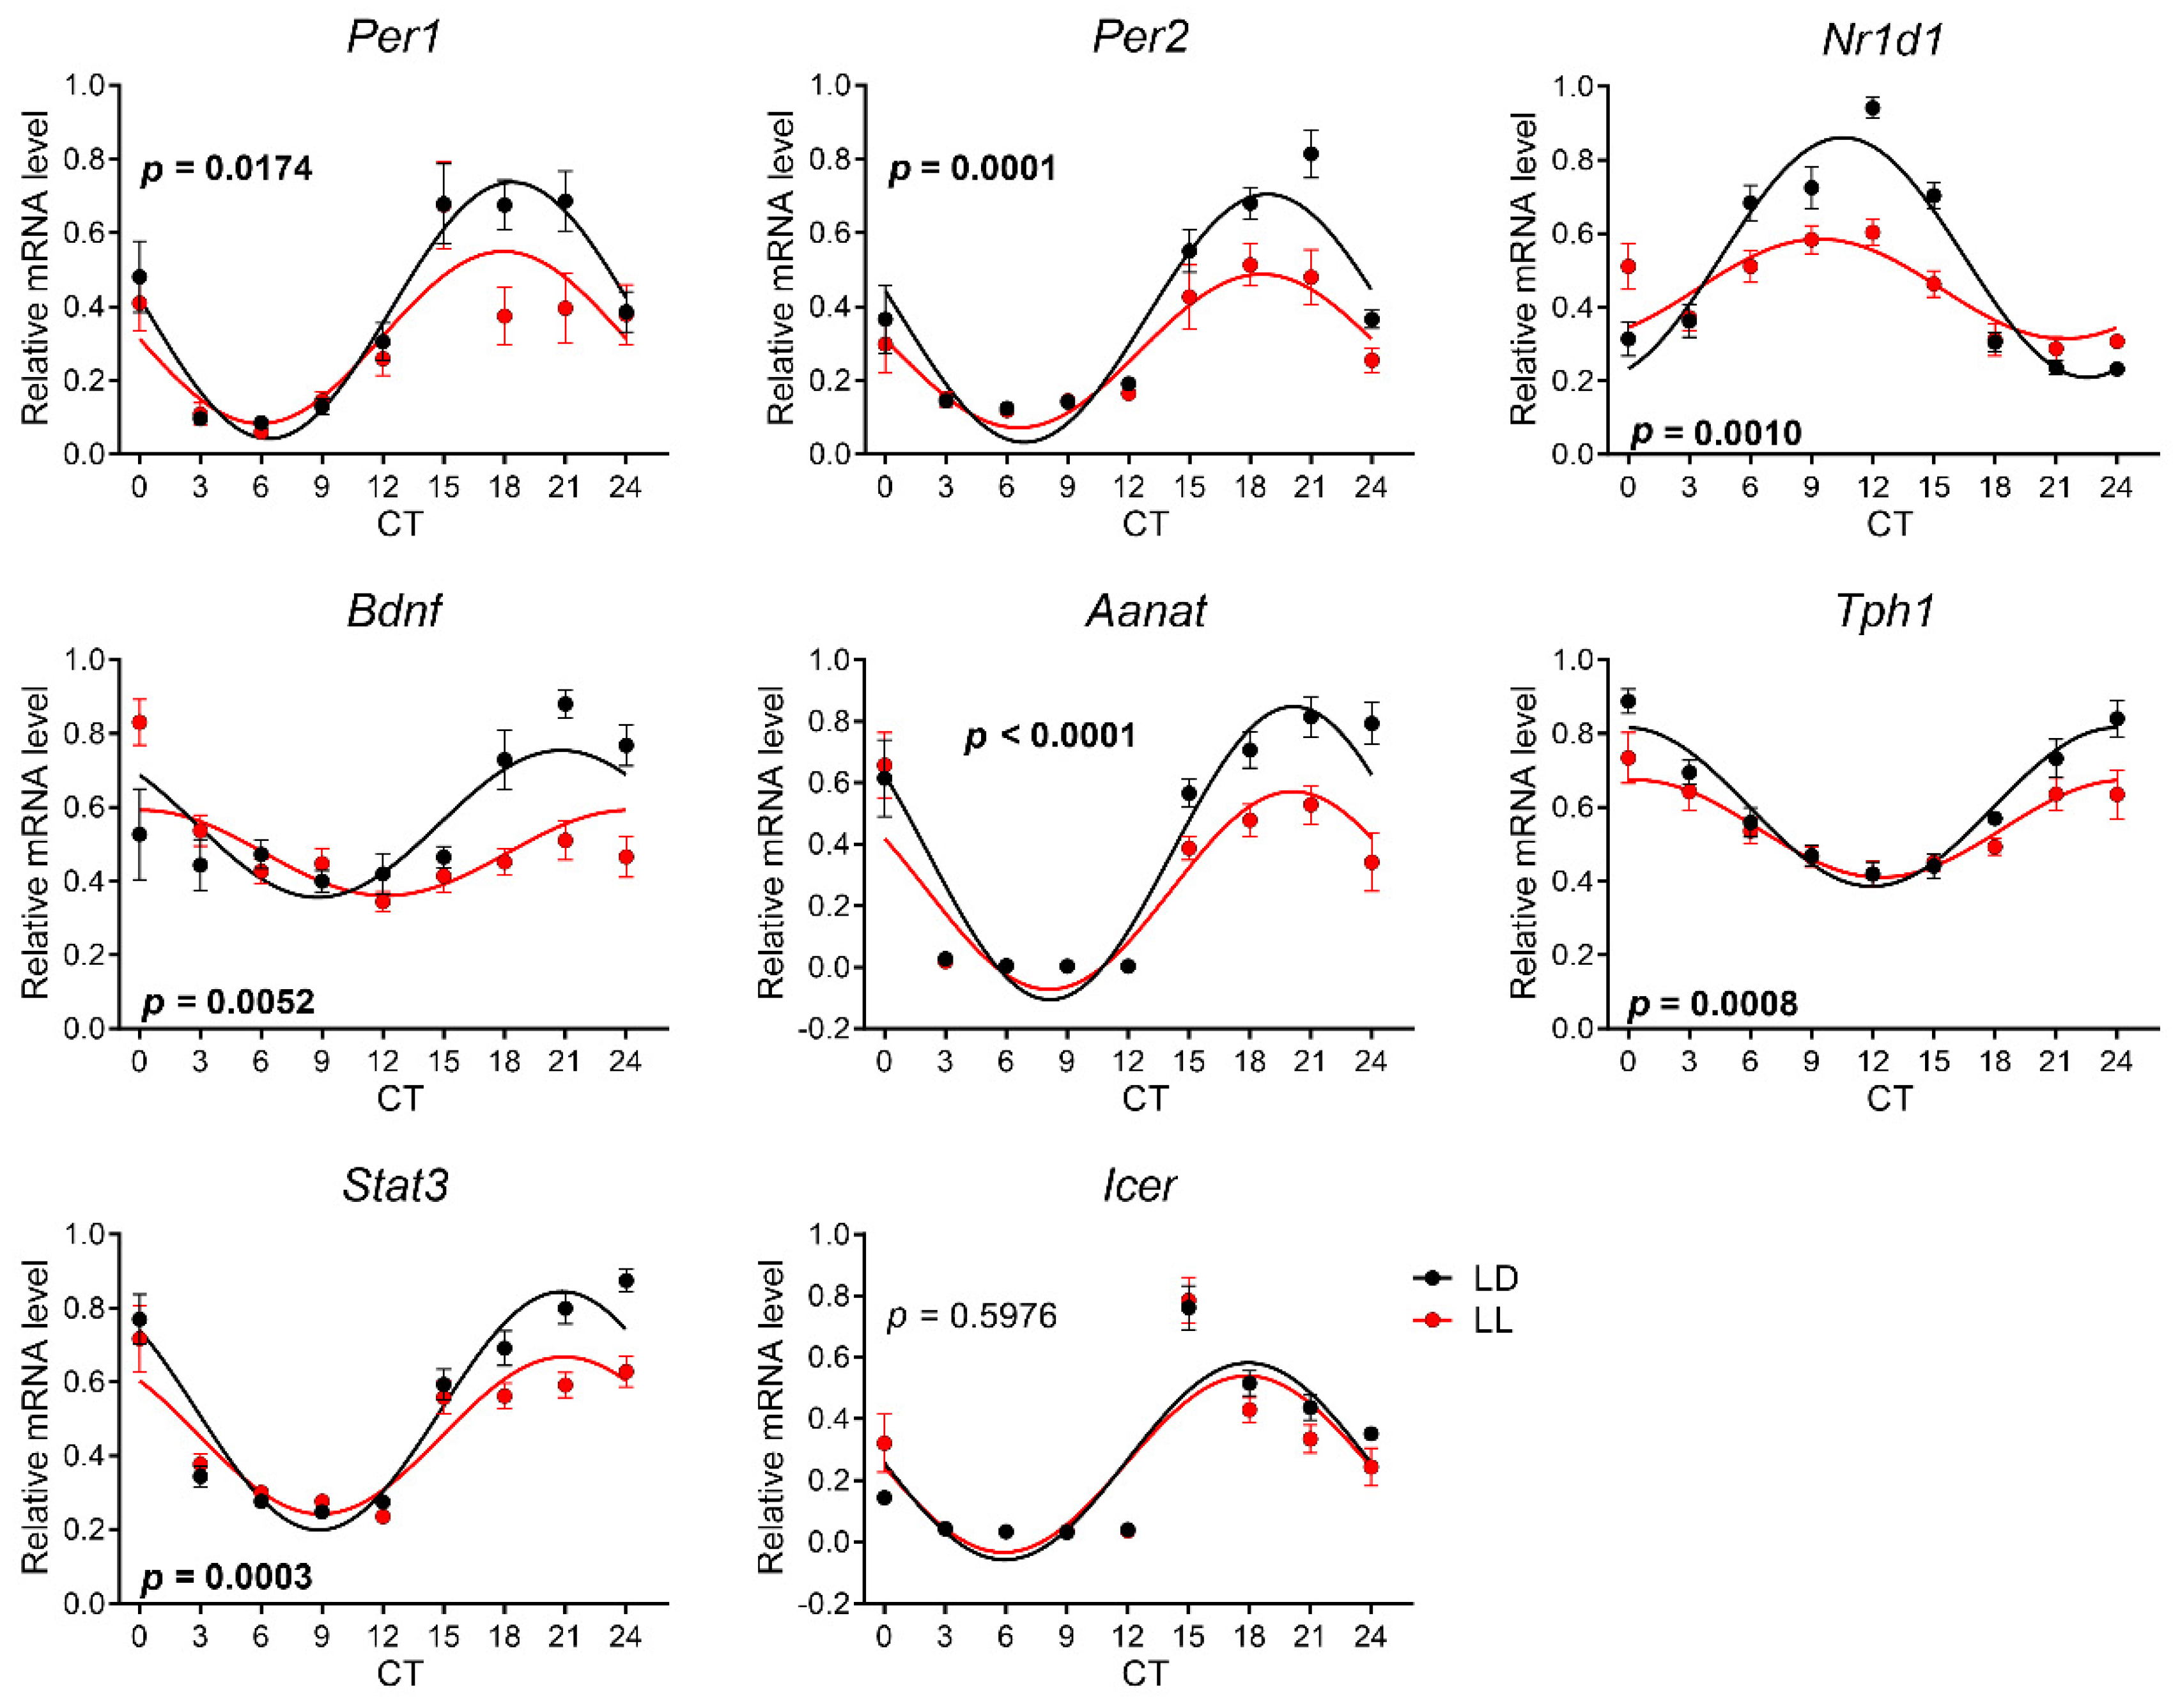
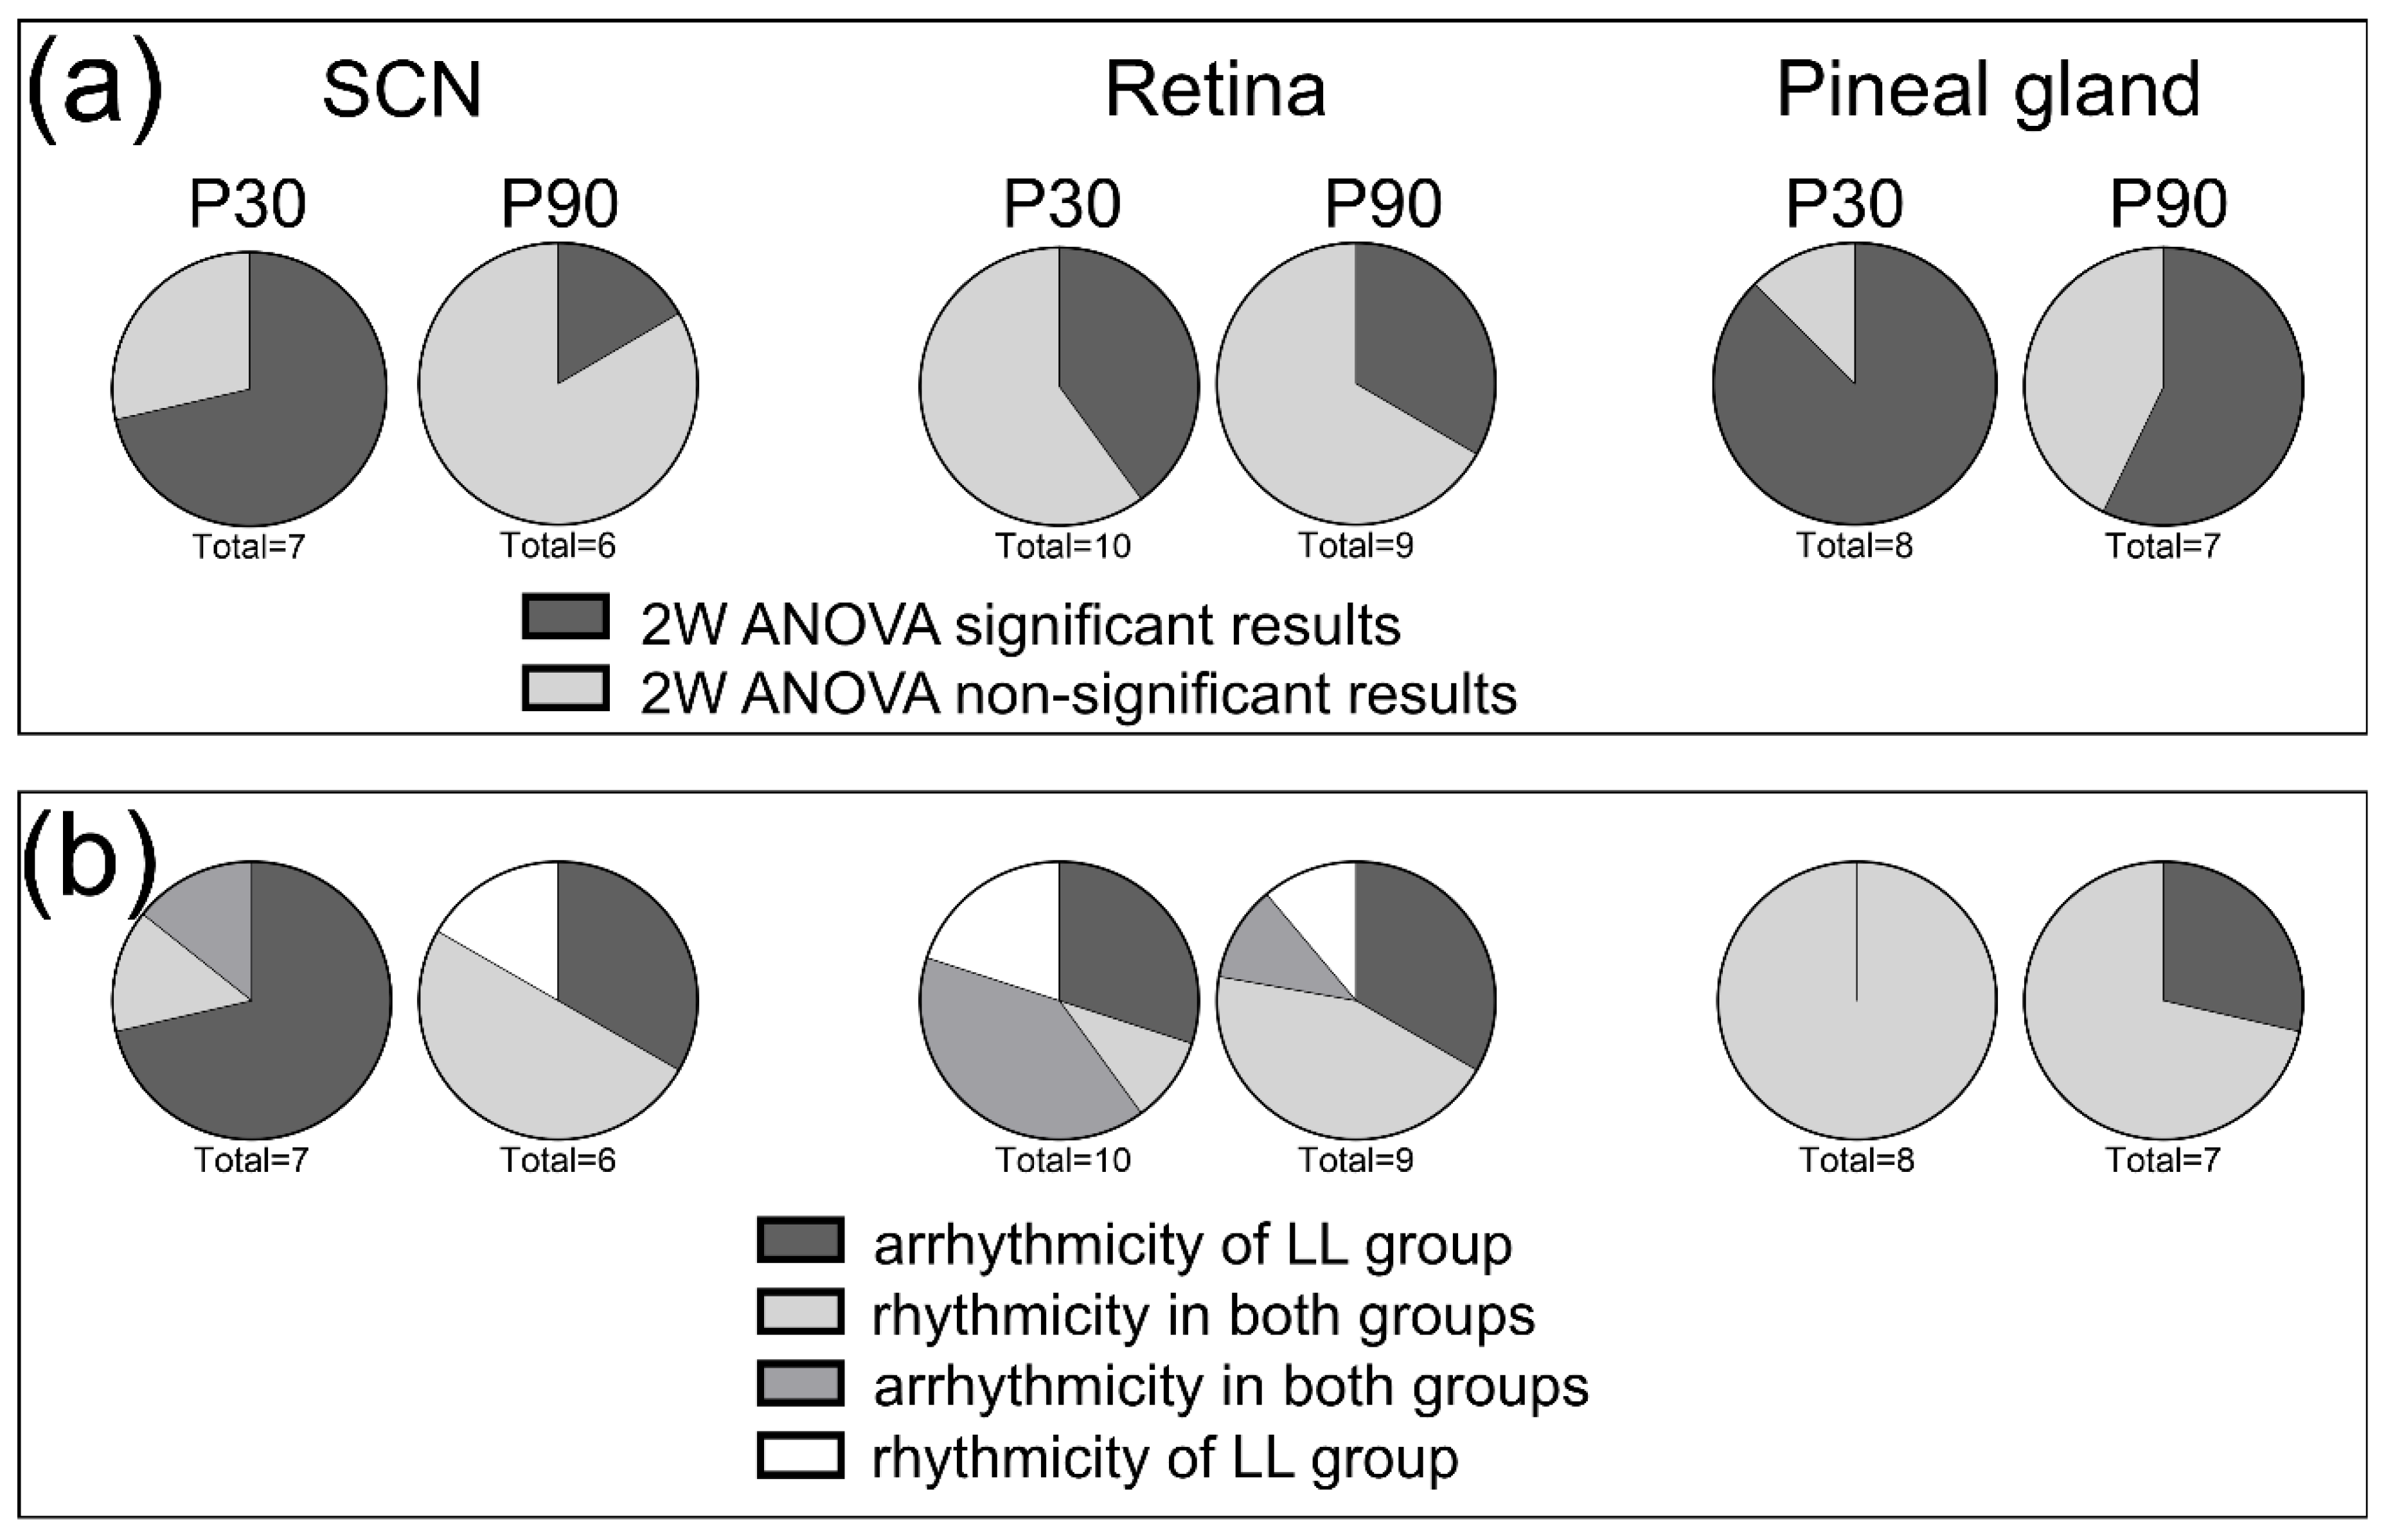
3.2. Effects of Postnatal LL Condition on Gene Expression in the SCN

To determine whether the LL condition during lactation affects the circadian rhythmicity of gene expression in the SCN, we performed qPCR on the SCN samples obtained by laser dissection (Figure 2). First, we evaluated the rhythms in P30 rats that were exposed to LL from P0 until P20, and then they experienced LD conditions for the next 9 days. The rhythmicity was proven when both one-way ANOVA (Supplemental Table S1) and the cosinor fit model analysis (Graph Pad Prism 6; Supplemental Table S2) showed significant results (see Materials and Methods). The analysis of our data confirmed the rhythmicity of all genes in the control LD group, with the exception of brain-derived neurotrophic factor (Bdnf) expression (Figure 2). In LL-reared animals, the rhythmicity of gene expression in the SCN was lost, with the exception of the Per2 gene, whose rhythm in the LL group displayed a significantly lower mesor (p = 0.0005) and amplitude (p = 0.0091) compared to the control LD group (Table 2). The two-way ANOVA comparison revealed that the postnatal LL condition changed the rhythmicity in the SCN in all genes except NMDA receptor subunit Grin1 (Figure 2, Supplemental Table S3).
The rhythmicity of gene expression in the SCN was evaluated at P90, when the animals experienced more than two months of the changing light/dark regime. Similar to the P30 control group, one-way ANOVA and the cosine fit model concurrently verify the significant rhythmicity, except for Bdnf expression. In LL-exposed animals, the arrhythmicity was confirmed for NMDA receptor subunits Grin1 and Grin2B (Figure 3, Supplemental Tables S1 and S2). The two-way ANOVA comparison confirmed the different expression of the Grin2B gene (Supplemental Table S3), and the comparison of cosinor parameters revealed the different acrophase in Stat3 expression (Table 2).

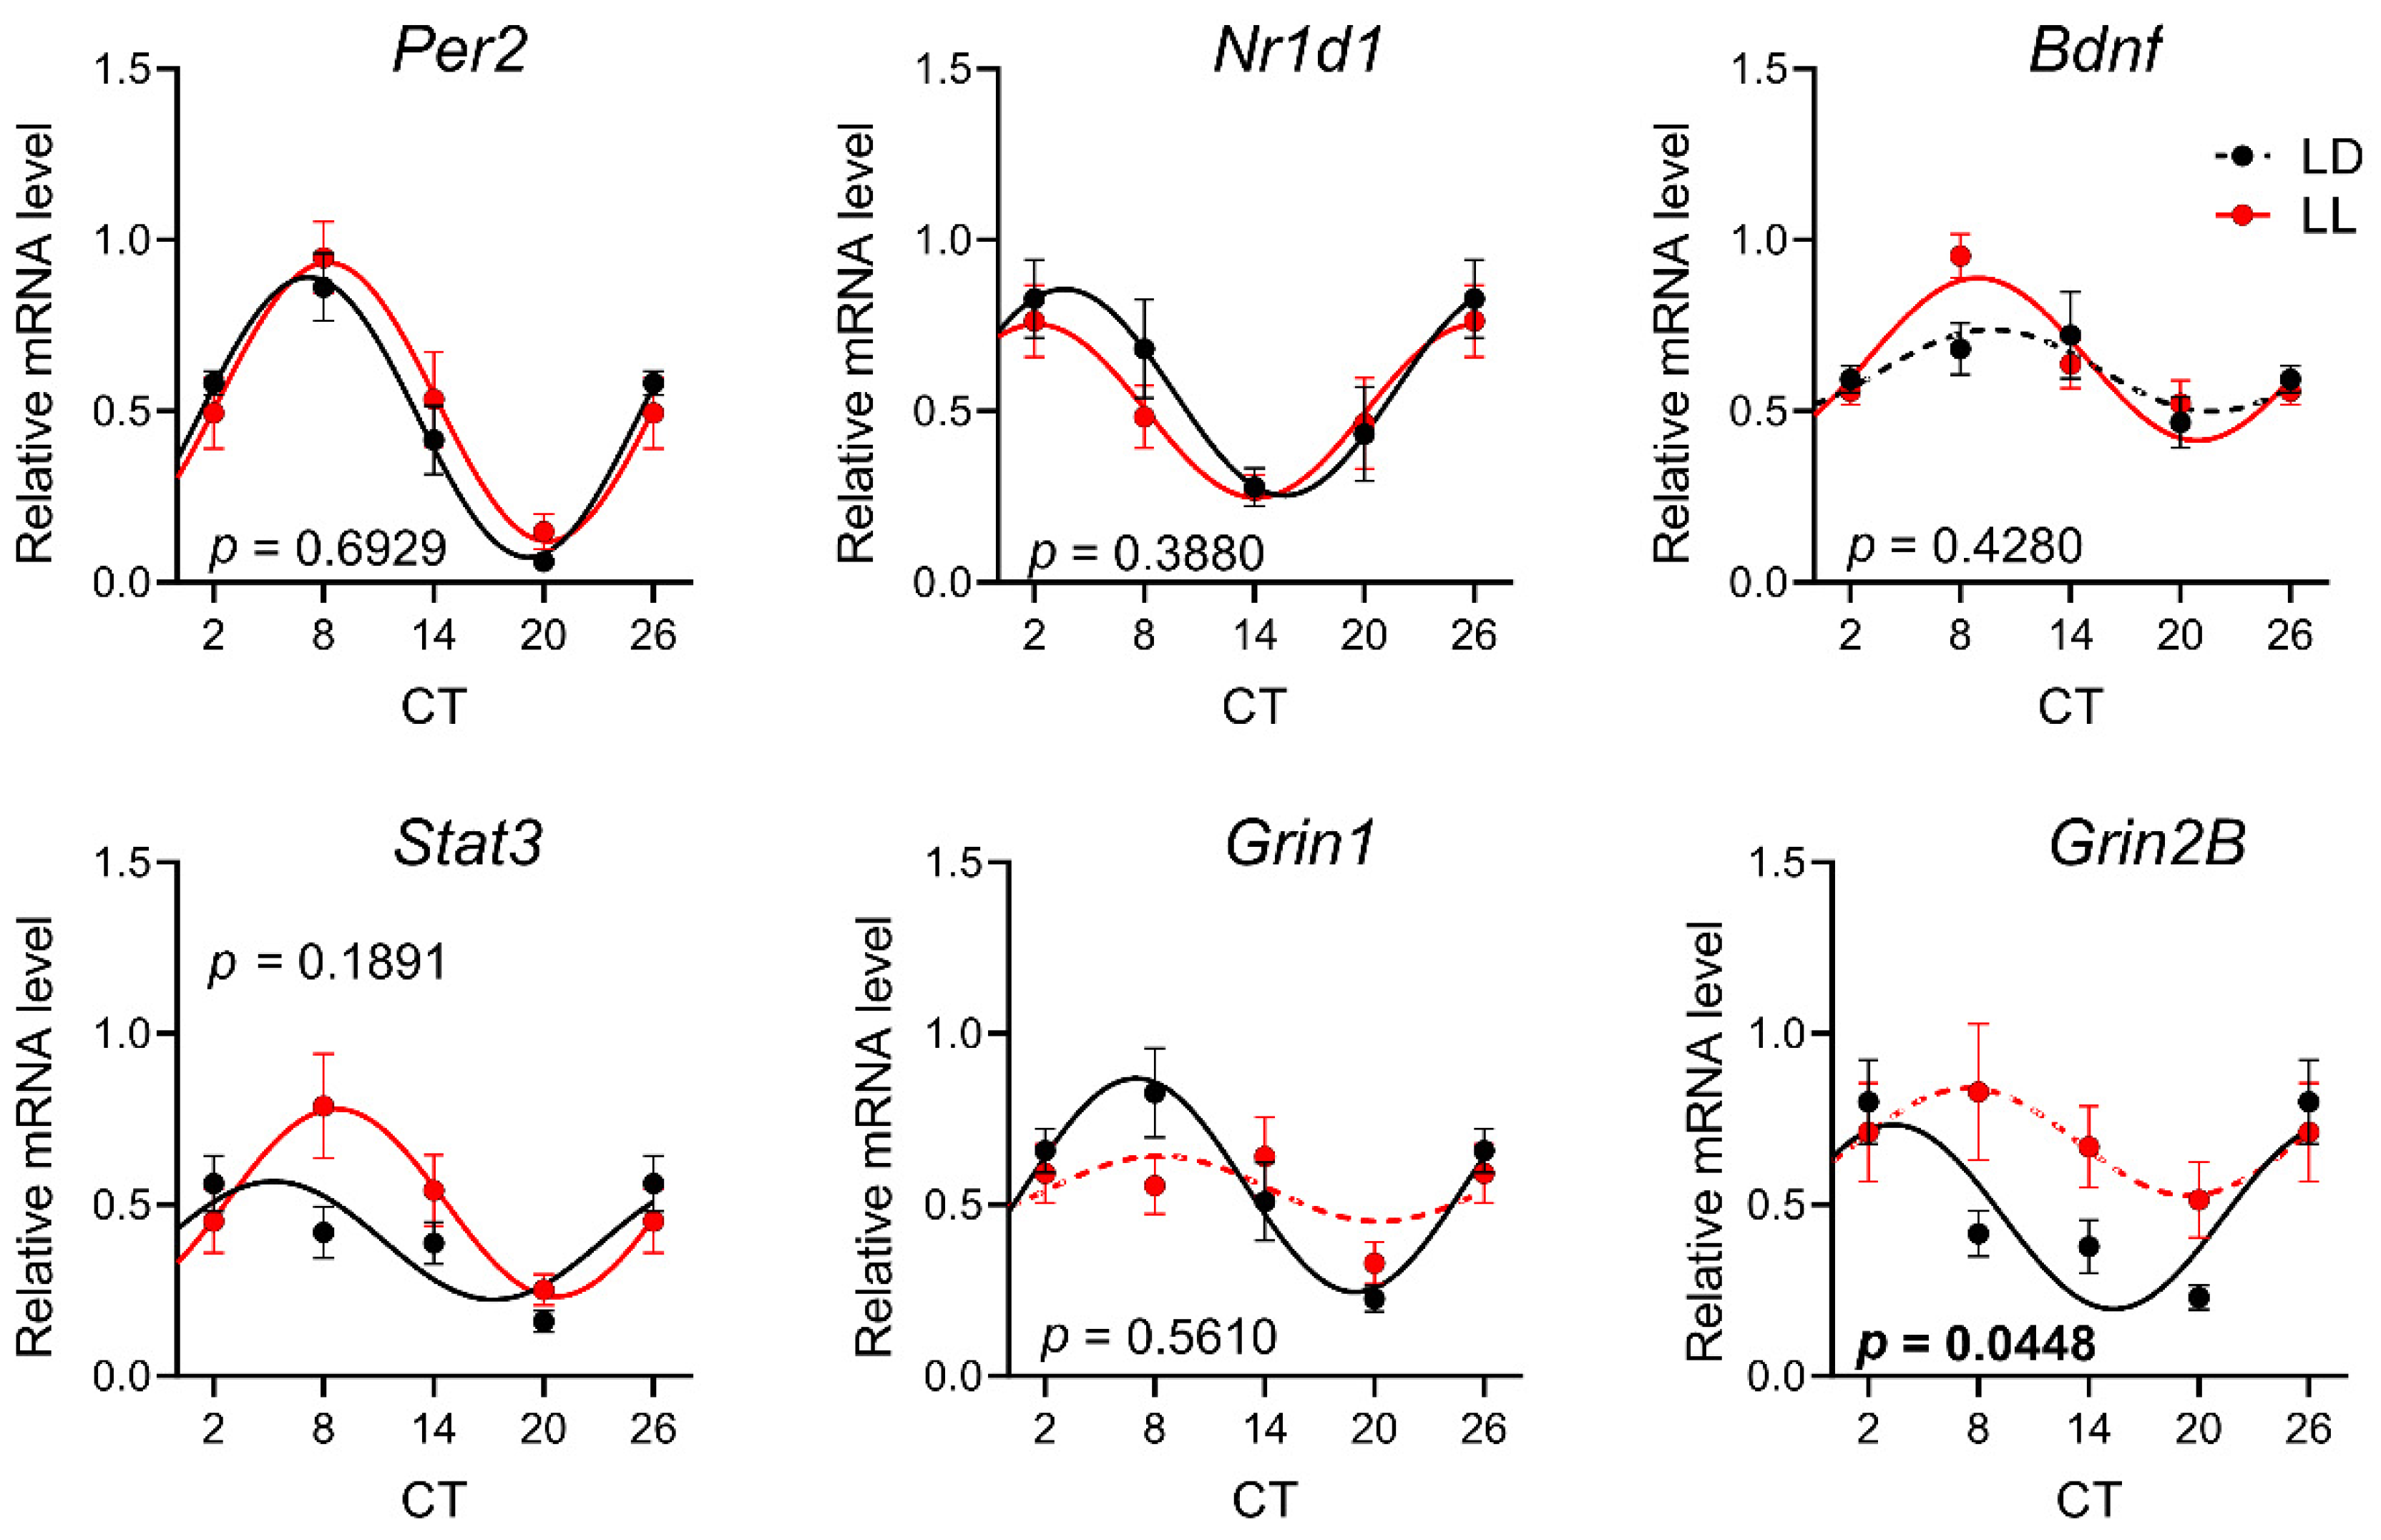
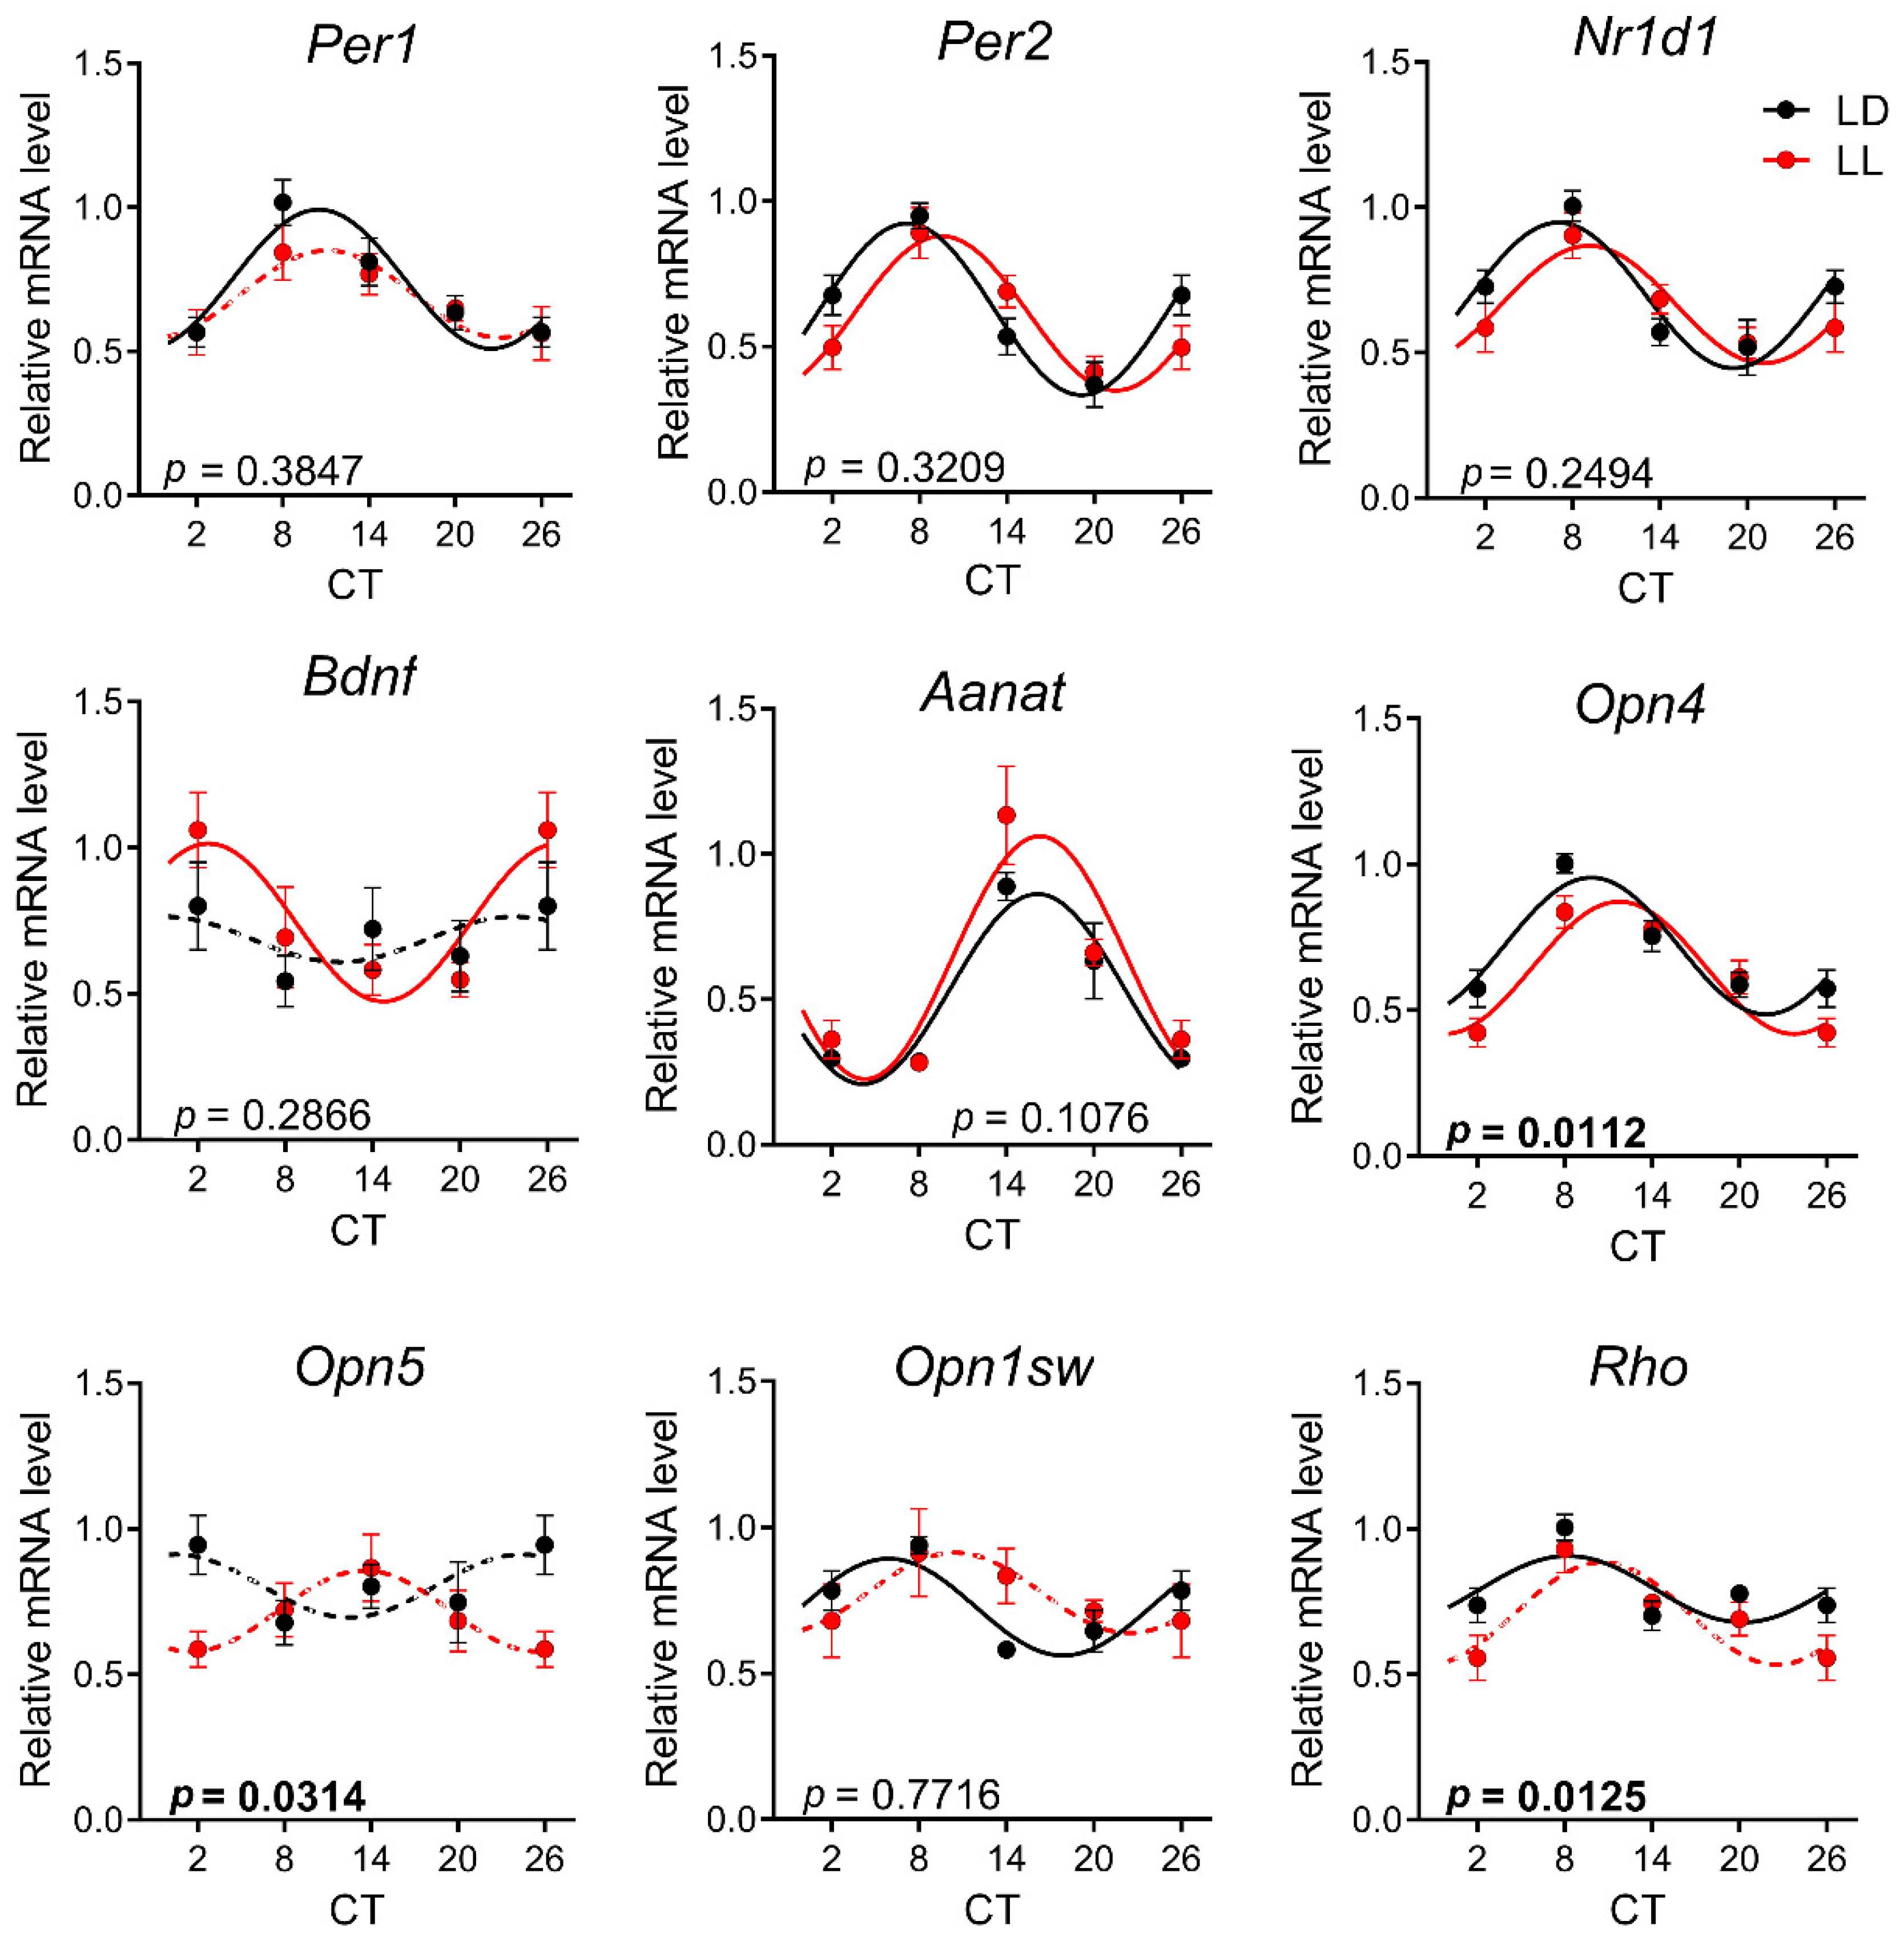
3.3. Effects of Postnatal LL Condition on Gene Expression in the Retina

In contrast to the SCN, principal clock genes Per1 and Per2, as well as Stat3, were not rhythmic in the control LD group of rats at P30 (Figure 4, Supplemental Tables S1 and S2). Similarly, Opn5 and Opn1sw did not show circadian rhythmicity in LD or LL animals. Nr1d1, Opn4, and Rho had rhythmic expression in LD animals but lost rhythmicity in LL-reared animals. On the contrary, Bdnf expression was rhythmic only in the LL group. The two-way ANOVA comparison revealed that a postnatal LL condition changed the rhythmicity in the retina in Aanat and opsins Opn4, Opn5, and Rho (Figure 4 and Supplemental Table S3). Although the two-way ANOVA confirmed the difference between groups for Aanat expression, cosinor analysis did not confirm the difference for mesor or for amplitude or acrophase between the two rhythms (Table 2).
At P90, the clock genes Aanat, Opn4, Opn1sw, and Rho showed circadian rhythmicity in control animals. LL rearing disrupted rhythms in Per1, Opn5, Opn1sw, and Rho, but similarly in P30, it induced rhythmicity in Bdnf expression (Figure 5, Supplemental Tables S1 and S2). The two-way ANOVA comparison confirmed the different expression for Opn4, Opn5, and Rho genes (Supplemental Table S3). A comparison of cosinor parameters (Table 2) between rhythms of Opn4 expression revealed significant differences in mesor (p = 0.0390) and acrophase (p = 0.0267).

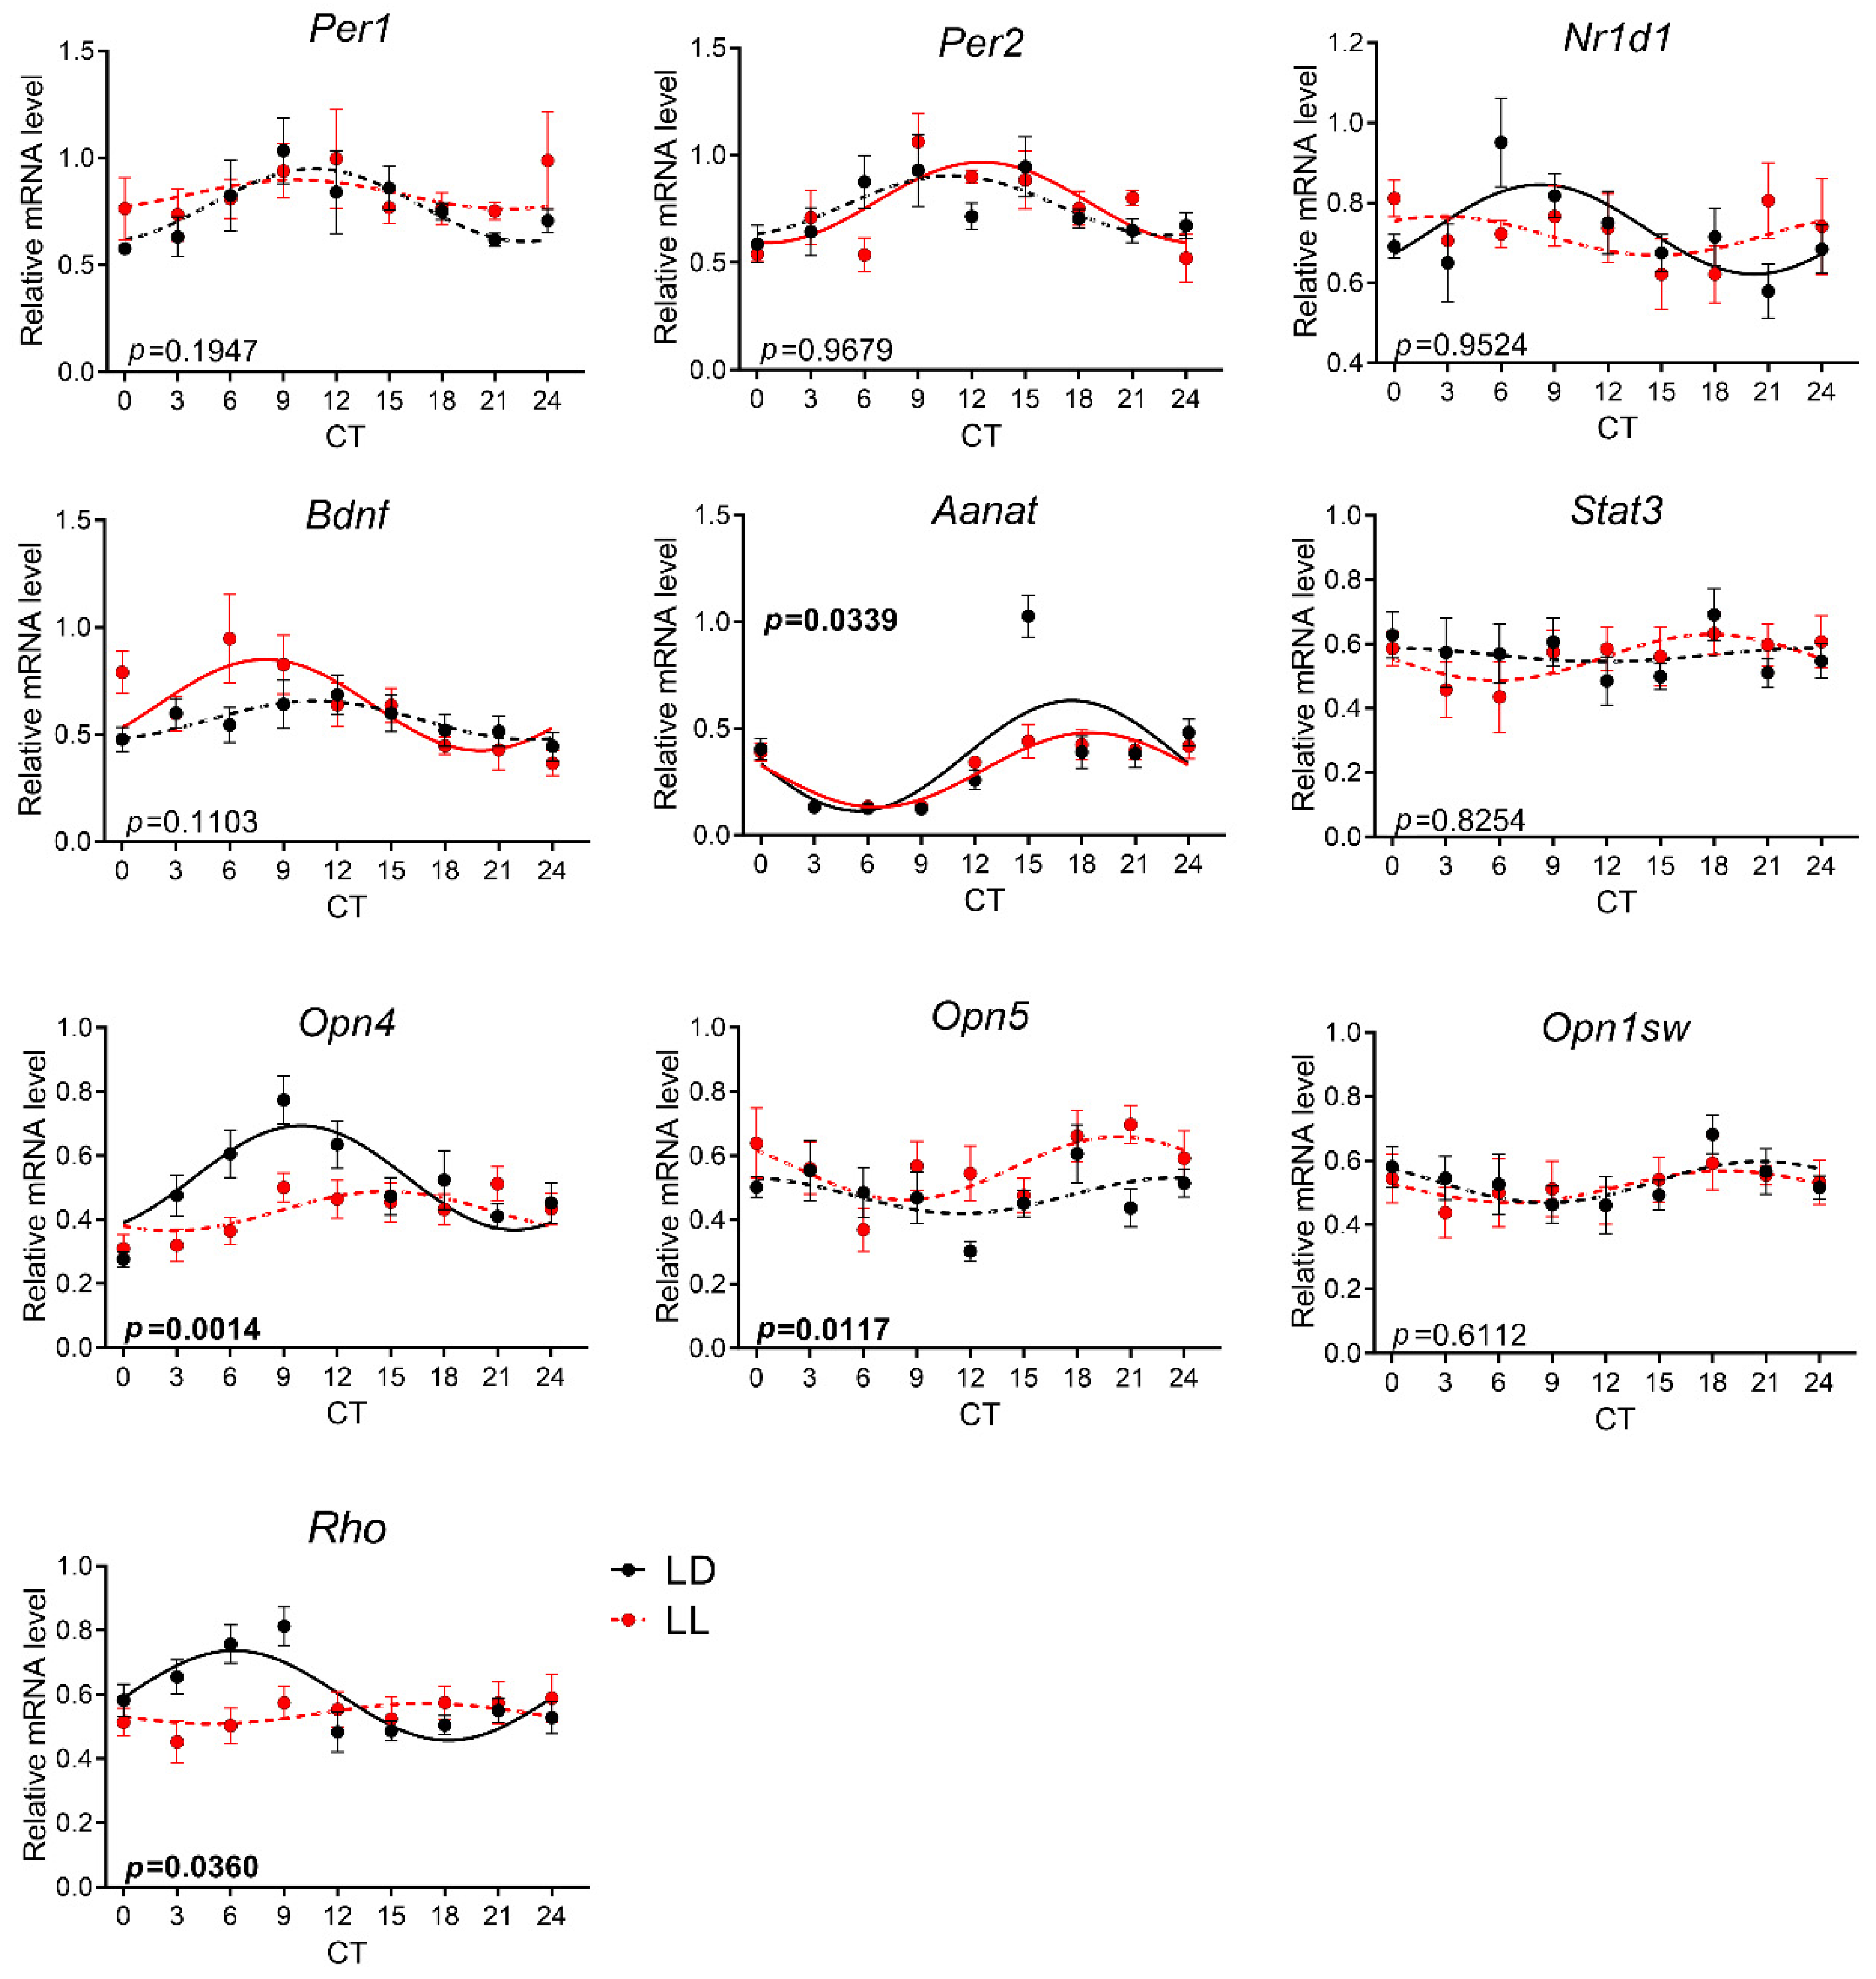
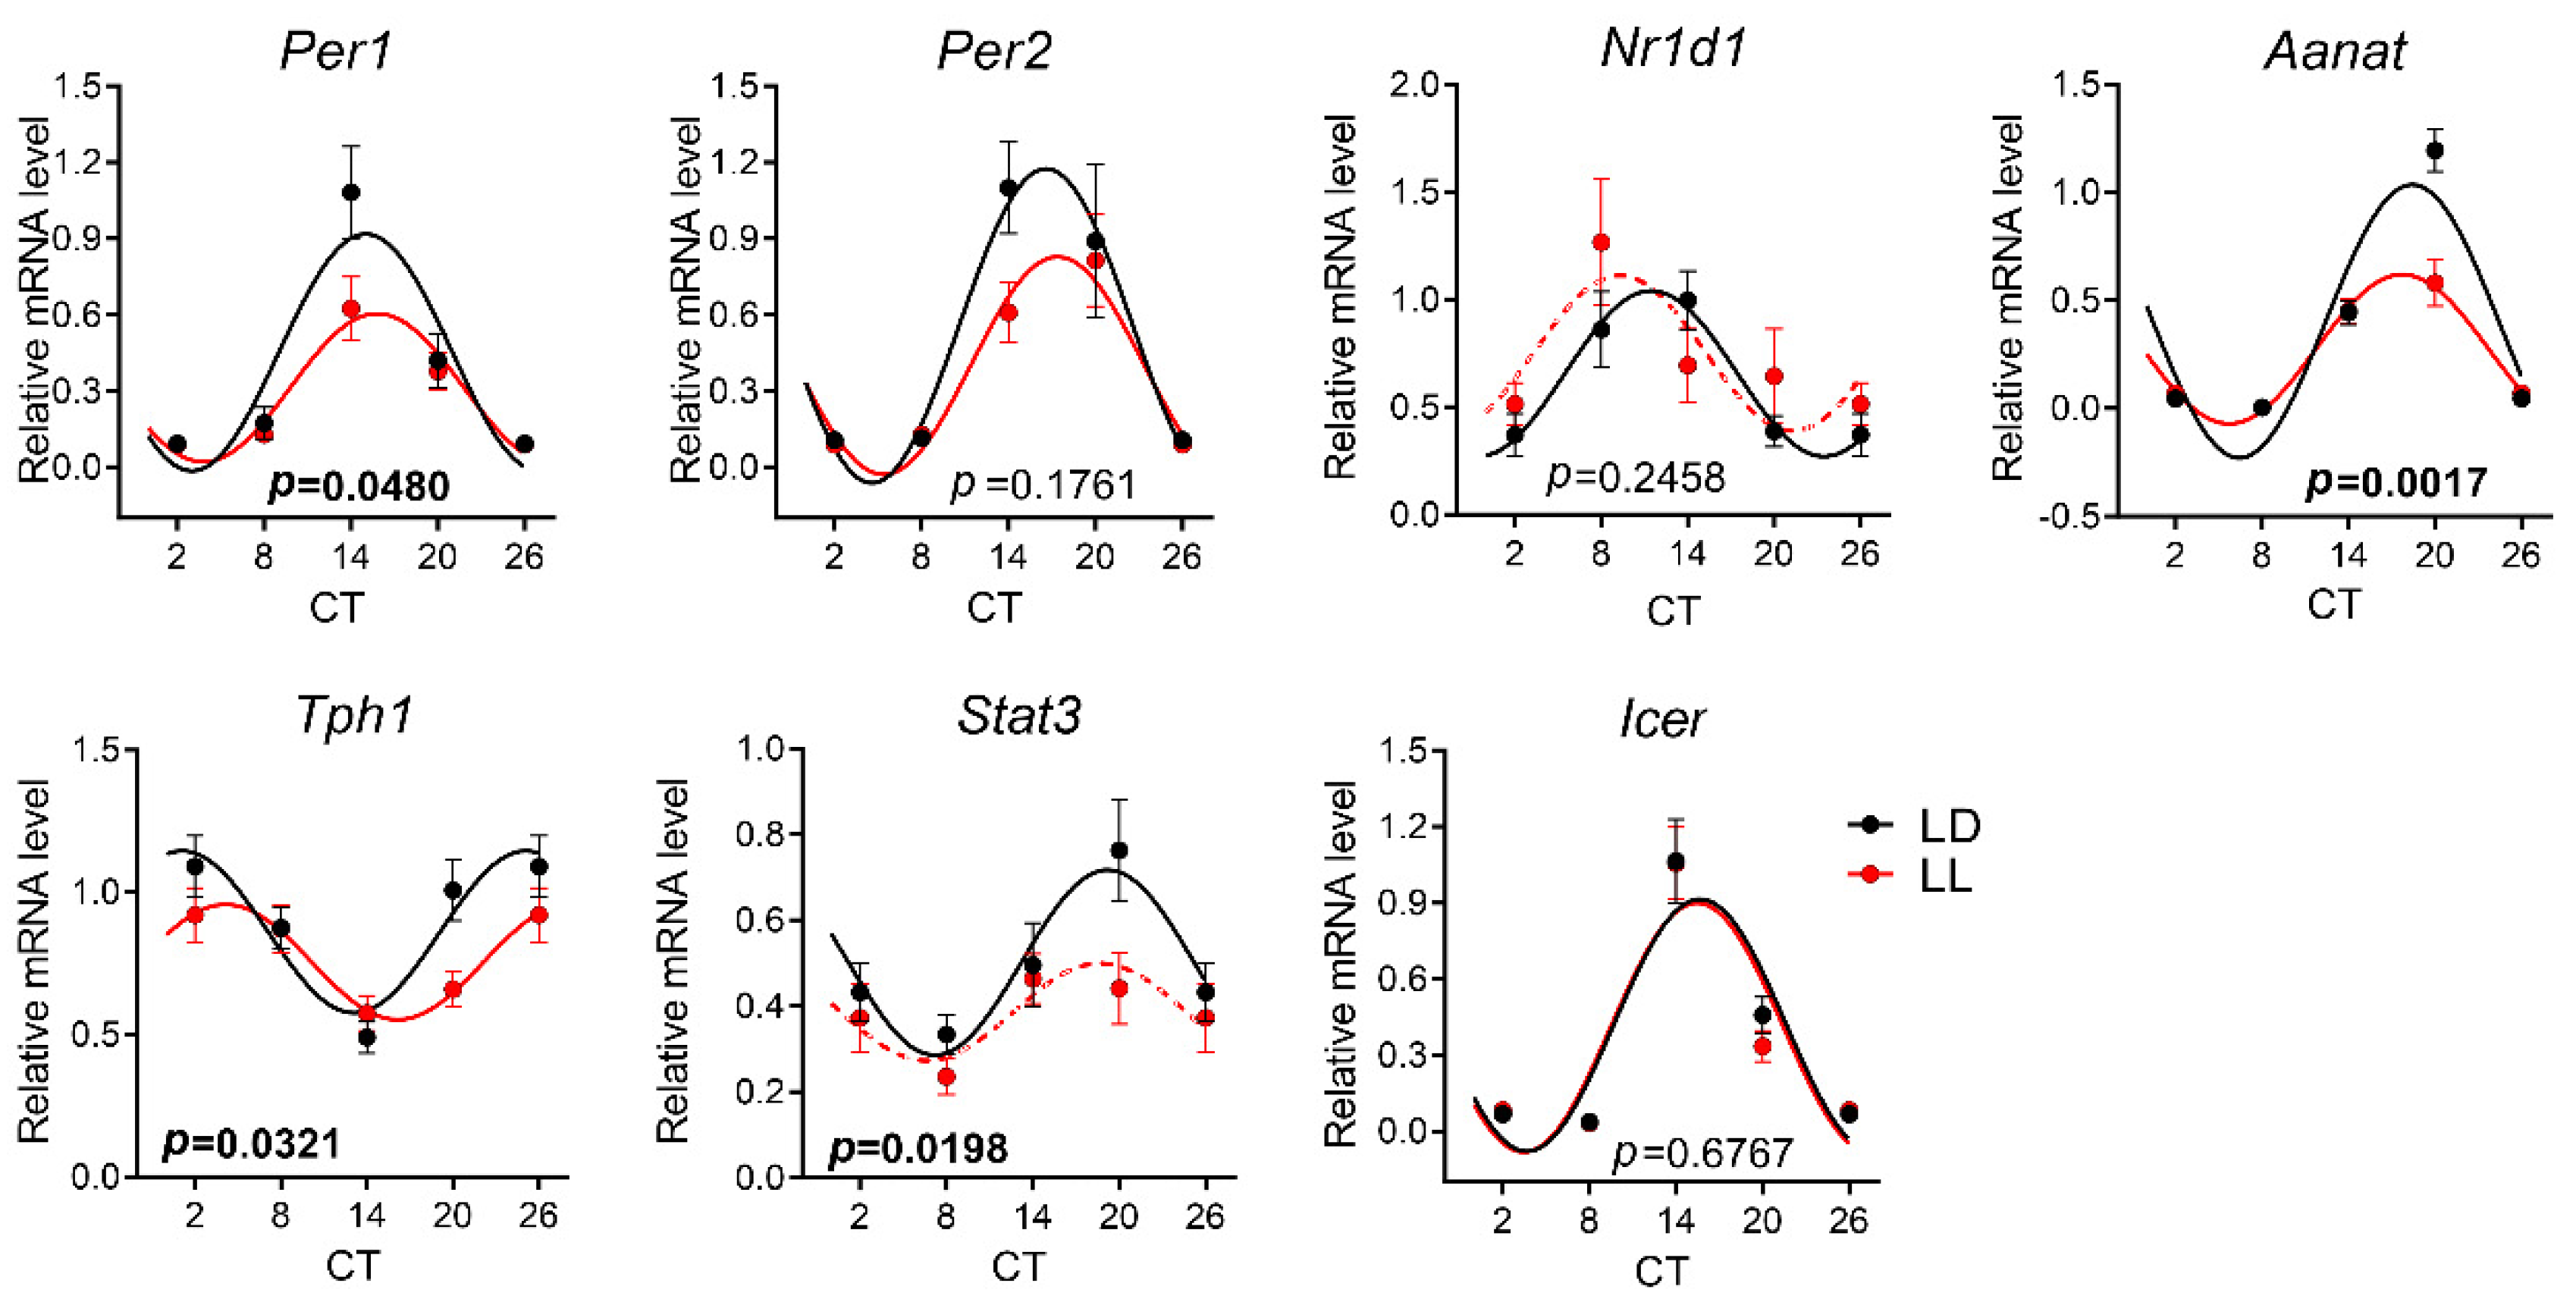
3.4. Effects of Postnatal LL Condition on Gene Expression in the Pineal Gland

In the pineal gland, all genes were expressed rhythmically in LL-reared and LD-reared groups of rats at P30 (Figure 6, Supplemental Tables S1 and S2). All rhythms except Icer were significantly different between both groups, as confirmed by two-way ANOVA (Supplemental Table S3). A comparison of the cosinor parameters between rhythms revealed significant differences in the mesor and amplitude in all tested genes, except Icer, and phase-delayed acrophase in Bdnf expression in the LL group (Table 2).
Similar to P30, all expression profiles in the pineal glands of control animals at P90 showed circadian rhythmicity (Figure 7). LL rearing disrupted the circadian rhythm in Nr1d1 and Stat3 and significantly changed the waveform of the rhythm in Per1, Aanat, and Tph1 (Supplemental Table S3). Table 2 demonstrates that the mesor values differ between rhythms in the expression of Per1, Stat3, and Aanat, and the amplitudes differ between the expression rhythms in Per1 and Aanat.
In general, all gene expression profiles were processed by three types of analysis. First, we compared the profiles between the LD and LL groups by 2W-ANOVA. Second, we assessed whether the LL conditions affected the result of combined 1W-ANOVA and cosinor analysis regarding the approval of circadian rhythmicity of each gene expression profile. Third, in case that gene expression was rhythmic in both groups, we tested whether prenatal LL conditions changed the cosinor parameters of the rhythm. Figure 8a depicts the relative ratio of significant and non-significant differences between the expression profiles obtained by two-way ANOVA, suggesting that the most affected structure was the pineal gland at P30. Figure 8b shows that the rhythmicity of all tested genes was preserved at P30 in the pineal gland, and only two genes became arrhythmic in the LL group at P90. Looking at the comparison of cosinor parameters in Table 2, however, we may notice that although all genes in the LL group show circadian rhythmicity, most of them differ from the LD group in mesor and amplitude. In the SCN, five of seven genes became arrhythmic in the LL group at P30, and Table 2 shows that Per2, which keeps the rhythmicity in both experimental groups, differs significantly in mesor and amplitude. The white part of the pie chart in Figure 8b indicates the rhythmicity that emerged only in the LL group. As mentioned above, this concerns the expression of Bdnf and, in the case of the retina at P30, also the Per2 gene.

4. Discussion

The exposure of adult nocturnal rodents to LL disrupts the circadian rhythms of locomotor activity, body temperature, and plasma melatonin level; attenuates circadian rhythms in the cardiovascular system [16,39,40,41,42]; alters insulin secretion [41,43]; compromises the immune system [44]; and leads to anxiety and depression [45]. In this study, we determined the long-term effects of early postnatal LL conditions on the development of circadian oscillations in principal clock brain structures and activity rhythm. We adopted a model of exposure to LL conditions between P0 and P20. This interval has been determined as a critical period in which LL affects the development of rhythms in locomotor activity [25,26]. After P20, our rats were kept under LD cycles to explore whether recovery from unnatural lighting conditions would occur later in life with exposure to synchronizing lighting conditions. All animals were released into DD only on the day of sacrifice to unmask the acute effect of light on the circadian clock.
Compared to previous studies, we used a relatively low level of light, which was set based on the average measurement of LED streetlights. The intensity of 16 lux also does not present a risk for immediate retinal damage and diminishes the light-induced stress responses that could modify the results.
Our data showed that LL-reared pigmented Long–Evans rats exhibited longer endogenous periods compared to LD-reared animals when tested around P60. It has been demonstrated previously that rats maintained under LL during lactation expressed a circadian rhythm in locomotor activity when placed into DD conditions later in life [46]. Changes in the endogenous period later in life have been demonstrated in LL-reared pigmented mice, which showed a shorter period of activity rhythm compared to the DD-reared mice [29,47]. Since the endogenous period in mice is naturally shorter than 24 h, the LL rearing may just accentuate their “morning” chronotype. The endogenous period in rats is naturally longer than 24 h, so its prolongation after LL during development suggests the underscoring of their “evening” chronotype. In general, exposing adult nocturnal rodents to LL conditions reduces the amplitude of locomotor activity rhythms and lengthens the endogenous period, i.e., causes aftereffects [48]. It is possible that rearing in LL conditions causes long-term alterations in the speed of free-running rhythms, even when the animals experience 40 days of LD conditions. Mildly lower RA (Figure 1b) and IS (Figure 1c) values with significantly higher inter-individual variances between LL and LD groups may mean higher day-to-day variation and indicate a weaker pacemaking activity of the circadian clock in the LL-reared group of adult animals.
In the next experiments, we tested the sensitivity to early-life LL conditions of the major circadian pacemaker in the SCN; the retina, which constitutes the light input pathway to the SCN; and the pineal gland, which is the important SCN output structure. It has been shown previously that a sex difference exists in the locomotor activity rhythm in LL occurring later in life in LL-reared rats [49]. We used four males and four females per time point in the P30 group and a combination of both sexes for the P90 group, with slightly more females. We compared the data between the sexes separately but did not find any difference between the males and females in any tissue or gene expression profile. Therefore, we present all the data together, and each time point represents males and females.
A major limitation of this study is the unequal temporal resolution between the P30 and P90 groups. While we collected the P30 tissue samples in 3 h intervals, we sampled only four time points at P90. This discrepancy does not allow for the precise comparison of cosinor parameters, such as phase, amplitude, and mesor between age groups. Therefore, we discuss the similarities and differences between the age groups only on the basis of two-way ANOVA comparison between LL and LD expression profiles and the assessment of rhythmicity loss or disclosure in the LL group.
In the SCN, all the examined genes displayed circadian rhythmicity in the control LD group, with the exception of Bdnf, which only emerged at P90 in the LL group. The enhancement of its rhythmicity in the LL group was also evident in the retina. Regarding its neuromodulatory role, such enhancement of its circadian amplitude suggests that Bdnf may potentially play a role in the mediating neuronal plasticity induced by non-physiological lighting conditions early in life.
Ten days after transitioning from LL to LD, at P30, the expression profiles of Per1, Per2, Nr1d1, Stat3, and Grin2B in the SCN were significantly different from those of the controls. Per1, Nr1d1, Stat3, and Grin2B became arrhythmic in the LL group, and rhythms in Per2 differed in mesor and amplitude. No change was measured by two-way ANOVA for Bdnf and Grin1, although their expression was also arrhythmic in the LL group. At P90, after 70 days of LD cycling, the rhythms of most of the genes were aligned with the controls, except the expression profile of Grin2B. Similar to P30, the expression profile of Grin1 was arrhythmic in the LL group, but two-way ANOVA did not confirm the difference, possibly due to larger standard deviations. Our data resemble the previous observations that LL during lactation abolished rhythmicity in the vasoactive intestinal peptide, arginine vasopressin, and PER1 in the SCN, which was not restored by subsequent LD cycles until P90, indicating the permanent impairment of the SCN by LL during lactation [30]. Both subunits of NMDA receptors Grin1 and Grin2B showed diurnal variations in the SCN also at the protein level, and Grin2B was involved in the light or glutamate-induced signaling cascades, leading to the clock gene expression in the SCN and subsequent phase shift of the clock [50,51,52]. We previously showed that Grin2B and Grin1 expression in the hippocampus and cortex can be affected neonatally by the manipulation with GABAergic neurotransmission, suggesting their sensitivity to changes in the ionic milieu, which also varies in the SCN according to external lighting conditions [53,54]. The LL-induced alteration in Grin2B expression in the SCN can be a form of plasticity that may lead to an altered response of the circadian clock to light, which was observed in adult animals reared under LL [47].
Mammalian retina was the first tissue, outside of the SCN, described as displaying the circadian clock properties [55]. Since then, it has been demonstrated that the retina harbors a network of clocks localized in each cell layer. Bioluminescence recordings, using the luciferase reporter coupled to Per1 and Per2 clock genes, reported rhythmicity in ganglion cells, inner and outer nuclear layers, and photoreceptors [56,57,58]. Our analysis, however, did not prove the rhythmicity of these two core-clock genes in whole retinas of the control LD group at P30. Similarly to our data, Kamphuis et al. [59] showed blunted rhythms in the clock gene expression, especially in Per1, for whole extracted retinas. Their and our results may be related to the presence of a complex network of circadian clocks in various retinal layers, with differences in the phase and period between cells/layers that may mask the rhythmicity at the whole-tissue level. Hypothetically, better synchronization among retinal layers, or the strengthening of the clock in some layers, allows the clock gene rhythmicity to emerge at P90. An exception from this concept is Nr1d1, which showed rhythmicity in the LD group with a peak during the daytime already at P30.
Blunted circadian rhythmicity was measured for three of four opsins in the retinas of P30 and P90 rats reared in LL. In rodent species, melanopsin mRNA rhythmic expression displays a peak in the transition between day and night [60,61,62,63], which corresponds with our results. The responsiveness of melanopsin to the LL condition has been tested in pigmented Brown Norwegian adult rats [63]. In contrast to our study, the prolonged LL conditions only changed the protein level but not the mRNA expression. However, the developmental aspects were not included in that study, and the ages of the animals and the light spectrum and intensity of constant light conditions were not specified.
As reported previously, Opn5 was observed in the rat retina [64], and in adult animals exposed to 8 days in LL, the levels of this opsin expression increased [65]. Our results show no circadian rhythmicity of Opn5 expression, but a significant difference between groups. Similar to adult animals, the mean value of its expression was elevated in the LL-reared group compared to the LD groups.
We also tested the changes in expression profiles of short-wavelength-sensitive cones. It is assumed that variations in visual opsins represent some adaptation to lighting habitat in various animal species and individuals [66]. However, our data show that Opn1sw did not change its expression in the P30 group or later in life. Concerning rhodopsin, its rhythmicity has been shown before [59]. We demonstrated its rhythmic expression in control animals at both ages, which was blunted by early development in LL.
Acute light at night suppresses melatonin secretion from the pineal gland, which mostly results from the fast inhibition of AANAT transcription and activation [67,68]. However, the long-term effects of LL in adulthood or during development and plastic changes in the pineal circadian oscillations throughout life are unclear. In rodents, the pineal gland displays marked daily variations in the Aanat gene and clock gene expression [68,69,70,71]. Our data show robust circadian rhythmicity in the expression of all clock genes and both enzymes involved in the melatonin synthetic pathway and transcription factors Stat3 and Icer. This rhythmicity was significantly blunted in animals that experienced LL conditions in early postnatal development. Although the rhythmicity persisted in the LL group, all profiles, except Icer, showed substantially lower mesor and amplitude at P30. This effect lasted until P90 for Per1 and Aanat, a lower mesor was found in Tph1, and Nr1d1 and Stat3 expression become arrhythmic in the LL group at P90.
Together, all the genes in the pineal gland responded significantly to early life LL conditions, with the exception of the transcription factor Icer, whose expression profile did not change in any parameter in either group. The reason why the amplitude of the rhythm in Icer expression did not change, as it did in other genes, is not clear. The mammalian pineal gland is under strict control by the SCN, which regulates nocturnal increases in sympathetic noradrenaline and the subsequent β-adrenergic elevation of cAMP levels [72]. This pathway induces a marked increase in Aanat gene expression and the expression of clock genes Per1, Per2, and Cry2, but not Bmal1 and Nr1d1 [68,71]. After 36–60 h of LL, which disrupts noradrenergic SCN input, Per1 and Cry2 expression showed no rhythmicity in the pineal gland. However, the circadian rhythms in Bmal1 and Nr1d1 gene expression were unchanged and not altered, even by a β-adrenergic antagonist [71]. Similarly, the response of pineal Per2 to light pulses at night was altered compared to Per1 and Aanat [68]. The data suggest the existence of alternative or synergistic pathways that regulate circadian gene expression in the pineal gland. However, our data did not separate the clock genes in the pineal gland into two groups according to the response to LL conditions, which could be explained by distinct sensitivity to β-adrenergic signaling. Thus, although Icer should be affected by noradrenergic input as other genes [8,9,10,11], some other mechanism may allow it to resist external disruption by LL early in life.
The exposure of pigmented rats to constant light from birth until P20 caused a decreased amplitude and mesor of seven of eight genes in the pineal gland at P30 and three of seven genes at P90, while Stat3 became arrhythmic. In the SCN, five of the seven genes were arrhythmic in the LL group at P30, and Grin2B was shown arrhythmicity even at P90. In the retina, Opn4 and Rho responded to postnatal LL conditions by the loss of rhythmicity and decreased amplitude in Opn4 at P90, and Opn5, although non-rhythmic, showed a significantly different expression between groups. Interestingly, the expression profile of three core-clock genes in the LL group was either restored by P90 (in the SCN and, with the exception of Per1, also in the pineal gland) or, in the retina, not affected at all. This observation indicates that the other gene expression patterns perturbed at P90 may not be a direct consequence of disrupted circadian clock in every tissue. Glutamatergic neurotransmission and NMDA receptor composition undergo striking changes in the SCN early in postnatal development [50], which can be affected by altered chemical neurotransmission independently of circadian clockwork development [53,54]. The altered expression of opsins in the retina may indicate some adaptive photoreceptor arrangement upon early life lighting experiences, and the induction of long-term changes in the pineal gland may reflect altered β-adrenergic secretion in LL [73].
Altogether, our results indicate that postnatal light experience may affect temporal patterns in behavior and gene expression and suggest implications for the control of retinal physiology and pineal gland function later in life.

Supplementary Materials

The following are available online at https://www.mdpi.com/2227-9059/8/12/579/s1.

Author Contributions

Conceptualization, Z.B. and A.K.; methodology, V.S. and S.M.; formal analysis, A.K.; investigation, A.K., L.P., and L.H.; resources, L.M.; data curation, Z.B. and A.K.; writing—original draft preparation, Z.B.; editing, A.K., V.S., and L.M.; project administration, Z.B.; funding acquisition, Z.B. All authors have read and agreed to the published version of the manuscript.

Funding

This work was supported by the Czech Science Foundation (grant no. 19-17037S) and the European Regional Development Fund-Projects “PharmaBrain” no. CZ.02.1.01/0.0/0.0/16_025/0007444.

Conflicts of Interest

The authors declare no conflict of interest.

References

  1. Dibner, C.; Schibler, U.; Albrecht, U. The mammalian circadian timing system: Organization and coordination of central and peripheral clocks. Annu. Rev. Physiol. 2010, 72, 517–549. [Google Scholar] [CrossRef] [PubMed] [Green Version]
  2. Takahashi, J.S. Molecular Architecture of the Circadian Clock in Mammals. In A Time for Metabolism and Hormones; Sassone-Corsi, P., Christen, Y., Eds.; Springer: Cham, Switzerland, 2016. [Google Scholar]
  3. Hattar, S.; Liao, H.W.; Takao, M.; Berson, D.M.; Yau, K.W. Melanopsin-containing retinal ganglion cells: Architecture, projections, and intrinsic photosensitivity. Science 2002, 295, 1065–1070. [Google Scholar] [CrossRef] [PubMed] [Green Version]
  4. Hughes, S.; Jagannath, A.; Hankins, M.W.; Foster, R.G.; Peirson, S.N. Photic regulation of clock systems. Methods Enzymol. 2015, 552, 125–143. [Google Scholar] [CrossRef] [PubMed]
  5. Nieto, P.S.; Valdez, D.J.; Acosta-Rodriguez, V.A.; Guido, M.E. Expression of novel opsins and intrinsic light responses in the mammalian retinal ganglion cell line RGC-5. Presence of OPN5 in the rat retina. PLoS ONE 2011, 6, e26417. [Google Scholar] [CrossRef] [PubMed]
  6. Hughes, S.; Rodgers, J.; Hickey, D.; Foster, R.G.; Peirson, S.N.; Hankins, M.W. Characterisation of light responses in the retina of mice lacking principle components of rod, cone and melanopsin phototransduction signalling pathways. Sci. Rep. 2016, 6, 28086. [Google Scholar] [CrossRef] [PubMed]
  7. Klein, D.C.; Moore, R.Y. Pineal N-acetyltransferase and hydroxyindole-O-methyltransferase: Control by the retinohypothalamic tract and the suprachiasmatic nucleus. Brain Res. 1979, 174, 245–262. [Google Scholar] [CrossRef]
  8. Stehle, J.H.; Foulkes, N.S.; Molina, C.A.; Simonneaux, V.; Pevet, P.; Sassone-Corsi, P. Adrenergic signals direct rhythmic expression of transcriptional re-pressor CREM in the pineal gland. Nature 1993, 365, 314–3204. [Google Scholar] [CrossRef]
  9. Foulkes, N.S.; Borjigin, J.; Snyder, S.H.; Sassone-Corsi, P. Transcriptionalcontrol of circadian hormone synthesis via the CREM feedback loop. Proc. Natl. Acad. Sci. USA 1996, 93, 14140–141455. [Google Scholar] [CrossRef] [Green Version]
  10. Maronde, E.; Pfeffer, M.; Olcese, J.; Molina, C.A.; Schlotter, F.; Dehghani, F.; Korf, H.W.; Stehle, J.H. Transcription factors in neuroendocrine regulation: Rhythmic changes in pCREB and ICER levels frame melatonin synthesis. J. Neurosci. 1999, 19, 3326–3336. [Google Scholar] [CrossRef] [Green Version]
  11. Ho, A.K.; Terriff, D.L.; Price, D.M.; Wloka, M.T.; Chik, C.L. The Role of Inducible Repressor Proteins in the Adrenergic Induction of Arylalkylamine-N-Acetyltransferase and Mitogen-Activated Protein Kinase Phosphatase-1 in Rat Pinealocytes. Endocrinology 2007, 148, 743–751. [Google Scholar] [CrossRef] [Green Version]
  12. Martinez-Nicolas, A.; Juan, A.M.; Rol, M.A. Day–night contrast as source of health for the human circadian system. Chronobiol. Int. 2014, 31, 382–393. [Google Scholar] [CrossRef] [PubMed]
  13. Patterson, S.S.; Kuchenbecker, J.A.; Anderson, J.R.; Neitz, M.; Neitz, J. A Color Vision Circuit for Non-Image-Forming Vision in the Primate Retina. Curr. Biol. 2020, 30, 1269–1274. [Google Scholar] [CrossRef] [PubMed]
  14. Ohta, H.; Yamazaki, S.; McMahon, D.G. Constant light desynchronizes mammalian clock neurons. Nat. Neurosci. 2005, 8, 267–926. [Google Scholar] [CrossRef] [PubMed]
  15. Coomans, C.P.; van den Berg, S.A.; Houben, T.; van Klinken, J.B.; van den Berg, R.; Pronk, A.C.; Havekes, L.M.; Romijn, J.A.; van Dijk, K.W.; Biermasz, N.R.; et al. Detrimental effects of constant light exposure and high-fat diet on circadian energy metabolism and insulin sensitivity. FASEB J. 2013, 27, 1721–1732. [Google Scholar] [CrossRef] [PubMed] [Green Version]
  16. Molcan, L.; Sutovska, H.; Okuliarova, M.; Senko, T.; Krskova, L.; Zeman, M. Dim light at night attenuates circadian rhythms in the cardiovascular system and suppresses melatonin in rats. Life Sci. 2019, 231, 116568. [Google Scholar] [CrossRef] [PubMed]
  17. Rumanova, V.S.; Okuliarova, M.; Zeman, M. Differential Effects of Constant Light and Dim Light at Night on the Circadian Control of Metabolism and Behavior. Int. J. Mol. Sci. 2020, 21, 5478. [Google Scholar] [CrossRef]
  18. Ono, D.; Honma, S.; Honma, K. Postnatal constant light compensates Cryptochrome1 and 2 double deficiency for disruption of circadian behavioral rhythms in mice under constant dark. PLoS ONE 2013, 8, e80615. [Google Scholar] [CrossRef] [PubMed] [Green Version]
  19. Sulli, G.; Manoogian, E.N.C.; Taub, P.R.; Panda, S. Training the Circadian Clock, Clocking the Drugs, and Drugging the Clock to Prevent, Manage, and Treat Chronic Diseases. Trends Pharmacol. Sci. 2018, 39, 812–827. [Google Scholar] [CrossRef]
  20. Sládek, M.; Sumová, A.; Kováčiková, Z.; Bendová, Z.; Laurinová, K.; Illnerová, H. Insight into molecular core clock mechanism of embryonic and early postnatal rat suprachiasmatic nucleus. Proc. Natl. Acad. Sci. USA 2004, 101, 6231–6236. [Google Scholar] [CrossRef] [Green Version]
  21. Carmona-Alcocer, V.; Abel, J.H.; Sun, T.C.; Petzold, L.R.; Doyle, F.J., 3rd; Simms, C.L.; Herzog, E.D. Ontogeny of Circadian Rhythms and Synchrony in the Suprachiasmatic Nucleus. J. Neurosci. 2018, 38, 1326–1334. [Google Scholar] [CrossRef]
  22. Bendová, Z.; Sumová, A.; Illnerová, H. Development of circadian rhythmicity and photoperiodic response in subdivisions of the rat suprachiasmatic nucleus. Brain Res. Dev. Brain Res. 2004, 148, 105–112. [Google Scholar] [CrossRef] [PubMed]
  23. Kováčiková, Z.; Sládek, M.; Bendová, Z.; Illnerová, H.; Sumová, A. Expression of clock and clock-driven genes in the rat suprachiasmatic nucleus during late fetal and early postnatal development. J. Biol. Rhythms 2006, 21, 140–148. [Google Scholar] [CrossRef] [PubMed]
  24. Hahnová, K.; Pačesová, D.; Volfová, B.; Červená, K.; Kašparová, D.; Žurmanová, J.; Bendová, Z. Circadian Dexras1 in rats: Development, location and responsiveness to light. Chronobiol. Int. 2016, 33, 141–150. [Google Scholar] [CrossRef] [PubMed]
  25. Canal-Corretger, M.M.; Cambras, T.; Vilaplana, J.; Díez-Noguera, A. Bright light during lactation alters the functioning of the circadian system of adult rats. Am. J. Physiol. Regul. Integr. Comp. Physiol. 2000, 278, R201–R208. [Google Scholar] [CrossRef] [PubMed] [Green Version]
  26. Canal-Corretger, M.M.; Vilaplana, J.; Cambras, T.; Díez-Noguera, A. Functioning of the rat circadian system is modified by light applied in critical postnatal days. Am. J. Physiol. Regul. Integr. Comp. Physiol. 2001, 280, R1023–R1030. [Google Scholar] [CrossRef] [PubMed] [Green Version]
  27. Brooks, E.; Canal, M.M. Development of circadian rhythms: Role of postnatal light environment. Neurosci. Biobehav. Rev. 2013, 37, 551–560. [Google Scholar] [CrossRef]
  28. Canal-Corretger, M.M.; Cambras, T.; Díez-Noguera, A. Effect of light during lactation on the phasic and tonic responses of the rat pacemaker. Chronobiol. Int. 2003, 20, 21–35. [Google Scholar] [CrossRef]
  29. Brooks, E.; Patel, D.; Canal, M.M. Programming of mice circadian photic responses by postnatal light environment. PLoS ONE 2014, 9, e97160. [Google Scholar] [CrossRef]
  30. Madahi, P.G.; Ivan, O.; Adriana, B.; Diana, O.; Carolina, E. Constant light during lactation programs circadian and metabolic systems. Chronobiol. Int. 2018, 35, 1153–1167. [Google Scholar] [CrossRef]
  31. Cambras, T.; López, L.; Arias, J.L.; Díez-Noguera, A. Quantitative changes in neuronal and glial cells in the suprachiasmatic nucleus as a function of the lighting conditions during weaning. Brain Res. Dev. Brain Res. 2005, 157, 27–33. [Google Scholar] [CrossRef]
  32. Canal, M.M.; Mohammed, N.M.; Rodríguez, J.J. Early programming of astrocyte organization in the mouse suprachiasmatic nuclei by light. Chronobiol. Int. 2009, 26, 1545–1558. [Google Scholar] [CrossRef] [PubMed]
  33. Brooks, E.; Waters, E.; Farrington, L.; Canal, M.M. Differential hypothalamic tyrosine hydroxylase distribution and activation by light in adult mice reared under different light conditions during the suckling period. Brain Struct. Funct. 2011, 216, 357–370. [Google Scholar] [CrossRef] [PubMed]
  34. Vilches, N.; Spichiger, C.; Mendez, N.; Abarzua-Catalan, L.; Galdames, H.A.; Hazlerigg, D.G.; Richter, H.G.; Torres-Farfan, C. Gestational chronodisruption impairs hippocampal expression of NMDA receptor subunits Grin1b/Grin3a and spatial memory in the adult offspring. PLoS ONE 2014, 9, e91313. [Google Scholar] [CrossRef] [PubMed] [Green Version]
  35. Coleman, G.; Gigg, J.; Canal, M.M. Postnatal light alters hypothalamic-pituitary-adrenal axis function and induces a depressive-like phenotype in adult mice. Eur. J. Neurosci. 2016, 44, 2807–2817. [Google Scholar] [CrossRef] [Green Version]
  36. Noell, W.K.; Walker, V.S.; Kang, B.S.; Berman, S. Retinal damage by light in rats. Investig. Ophthalmol. 1966, 5, 450–473. [Google Scholar]
  37. Luik, A.I.; Zuurbier, L.A.; Hofman, A.; Van Someren, E.J.; Tiemeier, H. Stability and fragmentation of the activity rhythm across the sleep-wake cycle: The importance of age, lifestyle, and mental health. Chronobiol. Int. 2013, 30, 1223–1230. [Google Scholar] [CrossRef]
  38. Livak, K.J.; Schmittgen, T.D. Analysis of relative gene expression data using real-time quantitative PCR and the 2(-Delta Delta C(T)) Method. Methods 2001, 25, 402–408. [Google Scholar] [CrossRef]
  39. Deprés-Brummer, P.; Lévi, F.; Metzger, G.; Touitou, Y. Light-induced suppression of the rat circadian system. Am. J. Physiol. 1995, 268 Pt 2, R1111–R1116. [Google Scholar] [CrossRef]
  40. Honma, S.; Kanematsu, N.; Katsuno, Y.; Honma, K. Persistence of circadian oscillation while locomotor activity and plasma melatonin levels became aperiodic under prolonged continuous light in the rat. Neurosci. Lett. 1996, 216, 49–52. [Google Scholar] [CrossRef]
  41. Wideman, C.H.; Murphy, H.M. Constant light induces alterations in melatonin levels, food intake, feed efficiency, visceral adiposity, and circadian rhythms in rats. Nutr. Neurosci. 2009, 12, 233–240. [Google Scholar] [CrossRef]
  42. Diatroptov, M.E.; Diatroptova, M.A.; Kosyreva, A.M.; Dzhalilova, D.S.; Mkhitarov, V.A.; Mikhailova, L.P.; Makarova, O.V. Ultradian Rhythms of Body Temperatures in Male Wistar Rats Maintained under Conditions of Constant Illumination. Bull. Exp. Biol. Med. 2019, 167, 735–739. [Google Scholar] [CrossRef] [PubMed]
  43. Qian, J.; Block, G.D.; Colwell, C.S.; Matveyenko, A.V. Consequences of exposure to light at night on the pancreatic islet circadian clock and function in rats. Diabetes 2013, 62, 3469–3478. [Google Scholar] [CrossRef] [PubMed] [Green Version]
  44. Guerrero-Vargas, N.N.; Navarro-Espíndola, R.; Guzmán-Ruíz, M.A.; Basualdo, M.D.C.; Espitia-Bautista, E.; López-Bago, A.; Lascurain, R.; Córdoba-Manilla, C.; Buijs, R.M.; Escobar, C. Circadian disruption promotes tumor growth by anabolic host metabolism; experimental evidence in a rat model. BMC Cancer 2017, 17, 625. [Google Scholar] [CrossRef] [PubMed] [Green Version]
  45. Tapia-Osorio, A.; Salgado-Delgado, R.; Angeles-Castellanos, M.; Escobar, C. Disruption of circadian rhythms due to chronic constant light leads to depressive and anxiety-like behaviors in the rat. Behav. Brain Res. 2013, 252, 1–9. [Google Scholar] [CrossRef]
  46. Cambras, T.; Canal, M.M.; Torres, A.; Vilaplana, J.; Díez-Noguera, A. Manifestation of circadian rhythm under constant light depends on lighting conditions during lactation. Am. J. Physiol. 1997, 272 Pt 2, R1039–R1046. [Google Scholar] [CrossRef]
  47. Canal-Corretger, M.M.; Vilaplana, J.; Cambras, T.; Díez-Noguera, A. Effect of light on the development of the circadian rhythm of motor activity in the mouse. Chronobiol. Int. 2001, 18, 683–696. [Google Scholar] [CrossRef]
  48. Aschoff, J. Circadian rhythms: Influences of internal and external factors on the period measured in constant conditions. Zeitschrift fur Tierpsychologie 1979, 49, 225–249. [Google Scholar] [CrossRef]
  49. Cambras, T.; Vilaplana, J.; Torres, A.; Canal, M.M.; Casamitjana, N.; Campuzano, A.; Díez-Noguera, A. Constant bright light (LL) during lactation in rats prevents arrhythmicity due to LL. Physiol. Behav. 1998, 63, 875–882. [Google Scholar] [CrossRef]
  50. Bendová, Z.; Sumová, A.; Mikkelsen, J.D. Circadian and developmental regulation of N-methyl-d-aspartate-receptor 1 mRNA splice variants and N-methyl-d-aspartate-receptor 3 subunit expression within the rat suprachiasmatic nucleus. Neuroscience 2009, 159, 599–609. [Google Scholar] [CrossRef]
  51. Bendová, Z.; Sládek, M.; Svobodová, I. The expression of NR2B subunit of NMDA receptor in the suprachiasmatic nucleus of Wistar rats and its role in glutamate-induced CREB and ERK1/2 phosphorylation. Neurochem. Int. 2012, 61, 43–47. [Google Scholar] [CrossRef]
  52. Wang, L.M.; Schroeder, A.; Loh, D.; Smith, D.; Lin, K.; Han, J.H.; Michel, S.; Hummer, D.L.; Ehlen, J.C.; Albers, H.E.; et al. Role for the NR2B subunit of the N-methyl-D-aspartate receptor in mediating light input to the circadian system. Eur. J. Neurosci. 2008, 27, 1771–1779. [Google Scholar] [CrossRef] [Green Version]
  53. Kubová, H.; Bendová, Z.; Moravcová, S.; Pačesová, D.; Rocha, L.L.; Mareš, P. Neonatal Clonazepam Administration Induces Long-Lasting Changes in Glutamate Receptors. Front. Mol. Neurosci. 2018, 11, 382. [Google Scholar] [CrossRef] [PubMed]
  54. Honma, S.; Katsuno, Y.; Shinohara, K.; Abe, H.; Honma, K. Circadian rhythm and response to light of extracellular glutamate and aspartate in rat suprachiasmatic nucleus. Am. J. Physiol. 1996, 271 Pt 2, R579–R585. [Google Scholar] [CrossRef]
  55. Tosini, G.; Menaker, M. Circadian rhythms in cultured mammalian retina. Science 1996, 272, 419–421. [Google Scholar] [CrossRef] [PubMed]
  56. Ruan, G.X.; Zhang, D.Q.; Zhou, T.; Yamazaki, S.; McMahon, D.G. Circadian organization of the mammalian retina. Proc. Natl. Acad. Sci. USA 2006, 103, 9703–9708. [Google Scholar] [CrossRef] [Green Version]
  57. Tosini, G.; Davidson, A.J.; Fukuhara, C.; Kasamatsu, M.; Castanon-Cervantes, O. Localization of a circadian clock in mammalian photoreceptors. FASEB J. 2007, 21, 3866–3871. [Google Scholar] [CrossRef] [PubMed]
  58. Jaeger, C.; Sandu, C.; Malan, A.; Mellac, K.; Hicks, D.; Felder-Schmittbuhl, M.P. Circadian organization of the rodent retina involves strongly coupled, layer-specific oscillators. FASEB J. 2015, 29, 1493–1504. [Google Scholar] [CrossRef] [PubMed] [Green Version]
  59. Kamphuis, W.; Cailotto, C.; Dijk, F.; Bergen, A.; Buijs, R.M. Circadian expression of clock genes and clock-controlled genes in the rat retina. Biochem. Biophys. Res. Commun. 2005, 330, 18–26. [Google Scholar] [CrossRef] [PubMed]
  60. González-Menéndez, I.; Contreras, F.; Cernuda-Cernuda, R.; García-Fernández, J.M. Daily rhythm of melanopsin-expressing cells in the mouse retina. Front. Cell Neurosci. 2009, 3, 3. [Google Scholar] [CrossRef] [Green Version]
  61. González-Menéndez, I.; Contreras, F.; Cernuda-Cernuda, R.; García-Fernández, J.M. No loss of melanopsin-expressing ganglion cells detected during postnatal development of the mouse retina. Histol. Histopathol. 2010, 25, 73–82. [Google Scholar] [CrossRef] [PubMed]
  62. Sakamoto, K.; Liu, C.; Tosini, G. Classical photoreceptors regulate melanopsin mRNA levels in the rat retina. J. Neurosci. 2004, 24, 9693–9697. [Google Scholar] [CrossRef] [PubMed] [Green Version]
  63. Hannibal, J.; Georg, B.; Fahrenkrug, J. Differential expression of melanopsin mRNA and protein in Brown Norwegian rats. Exp. Eye Res. 2013, 106, 55–63. [Google Scholar] [CrossRef] [PubMed]
  64. Nieto, P.S.; Acosta-Rodriguez, V.A.; Valdez, D.J.; Guido, M.E. Differential responses of the mammalian retinal ganglion cell line RGC-5 to physiological stimuli and trophic factors. Neurochem. Int. 2010, 57, 216–226. [Google Scholar] [CrossRef] [PubMed]
  65. Benedetto, M.M.; Guido, M.E.; Contin, M.A. Non-Visual Photopigments Effects of Constant Light-Emitting Diode Light Exposure on the Inner Retina of Wistar Rats. Front. Neurol. 2017, 8, 417. [Google Scholar] [CrossRef] [PubMed] [Green Version]
  66. Peichl, L. Diversity of mammalian photoreceptor properties: Adaptations to habitat and lifestyle? Anat. Rec. A Discov. Mol. Cell. Evol. Biol. 2005, 287, 1001–1012. [Google Scholar] [CrossRef] [PubMed]
  67. Gastel, J.A.; Roseboom, P.H.; Rinaldi, P.A.; Weller, J.L.; Klein, D.C. Melatonin production: Proteasomal proteolysisin serotoninN-acetyltransferase regulation. Science 1998, 279, 1358–1360. [Google Scholar] [CrossRef]
  68. Fukuhara, C.; Dirden, J.C.; Tosini, G. Circadian expression of period 1, period 2, and arylalkylamine N-acetyltransferase mRNA in the rat pineal gland under different light conditions. Neurosci. Lett. 2000, 286, 167–170. [Google Scholar] [CrossRef]
  69. Simonneaux, V.; Poirel, V.J.; Garidou, M.L.; Nguyen, D.; Diaz-Rodriguez, E.; Pévet, P. Daily rhythm and regulation of clock gene expression in the rat pineal gland. Brain Res. Mol. Brain Res. 2004, 120, 164–172. [Google Scholar] [CrossRef]
  70. Karolczak, M.; Burbach, G.J.; Sties, G.; Korf, H.W.; Stehle, J.H. Clock gene mRNA and protein rhythms in the pineal gland of mice. Eur. J. Neurosci. 2004, 19, 3382–3388. [Google Scholar] [CrossRef]
  71. Wongchitrat, P.; Felder-Schmittbuhl, M.P.; Phansuwan-Pujito, P.; Pévet, P.; Simonneaux, V. Endogenous rhythmicity of Bmal1 and Rev-erb alpha in the hamster pineal gland is not driven by norepinephrine. Eur. J. Neurosci. 2009, 29, 2009–2016. [Google Scholar] [CrossRef]
  72. Simonneaux, V.; Ribelayga, C. Generation of the melatonin endocrine message in mammals: A review of the complex regulation of melatonin synthesis by norepinephrine, peptides, and other pineal transmitters. Pharmacol. Rev. 2003, 55, 325–395. [Google Scholar] [CrossRef] [PubMed]
  73. Bellavía, S.L.; Gallará, R.V. Modification of the beta- and alpha2-adrenergic sensitivity of rat submandibular glands by environmental stimuli and stress. Arch. Oral Biol. 1998, 43, 933–939. [Google Scholar] [CrossRef]
Figure 1. Effect of development under constant light (LL, in red; controls in light/dark (LD) in black) on (a) the circadian period, (b) relative amplitude, and (c) interdaily stability of the rhythm in the locomotor activity of male rats. Animals were housed under LL (16 lux) from the postnatal day 0 (P0) until P20 and then released into LD conditions. At P60, the animals were released into constant darkness (DD) and circadian parameters were calculated from 12 days of locomotor recordings. Each column represents the mean of 11 values ± SEM. p=; two-tailed Student’s t-test and F test comparing variances between groups; (d,e) representative actograms of a control animal and LL-exposed animal, respectively.
Biomedicines 08 00579 g001
Figure 2. Effect of development under constant light (LL, in red; controls in LD in black) on the rhythmic gene expression in suprachiasmatic nucleus (SCN) at P30. Animals were housed under LL (16 lux) from P0 until P20 and then released into LD conditions. At P30, the animals were sacrificed in 3 h intervals in DD, and the SCNs were sampled by laser dissection and processed by qPCR with specific TaqMan probes. Rhythmicity was proved by cosinor analysis with the horizontal line as zero hypothesis and one-way ANOVA for differences between time groups. Full lines indicate rhythms confirmed by cosinor analysis and one-way ANOVA. Dashed lines indicate profiles not confirmed for rhythmicity by one or both methods. Each point represents the mean ± SEM from six to eight animals. p-values indicate group differences by two-way ANOVA, and significant values are in bold. Representative photomicrographs of coronal sections of SCN (right bottom) demonstrate an area of laser dissection. Scale bar = 400 μm.
Biomedicines 08 00579 g002
Figure 3. Effect of development under constant light (LL, in red; controls in LD in black) on rhythmic gene expression in SCN at P90. Animals were housed under LL (16 lux) from P0 until P20 and then released into LD conditions. At P90, the animals were sacrificed in 6 h intervals in DD, and SCNs were sampled by laser dissection and processed by qPCR with specific TaqMan probes. Rhythmicity was proved by cosinor analysis with a horizontal line as zero hypothesis and one-way ANOVA for differences between the time groups. Full lines indicate rhythms confirmed by cosinor analysis and one-way ANOVA. Dashed lines indicate profiles not confirmed for rhythmicity by one or both methods. Each point represents the mean ± SEM from five to seven animals. p-values indicate group difference by two-way ANOVA, and significant values are in bold.
Biomedicines 08 00579 g003
Figure 4. Effect of development under constant light (LL, in red; controls in LD in black) on rhythmic gene expression in retina at P30. Animals were housed under LL (16 lux) from P0 until P20 and then released into LD conditions. At P30, the animals were sacrificed in 3 h intervals in DD, and retinas were processed by qPCR with specific TaqMan probes. Rhythmicity was proved by cosinor analysis with a horizontal line as a zero hypothesis and one-way ANOVA for differences between the time groups. Full lines indicate rhythms confirmed by cosinor analysis and one-way ANOVA. Dashed lines indicate profiles not confirmed for rhythmicity by one or both methods. Each point represents the mean ± SEM from six to eight animals. p-values indicate group differences by two-way ANOVA, and significant values are in bold.
Biomedicines 08 00579 g004
Figure 5. Effect of development under constant light (LL, in red; controls in LD in black) on rhythmic gene expression in the retina at P90. Animals were housed under LL (16 lux) from P0 until P20 and then released into LD conditions. At P90, the animals were sacrificed in 6 h intervals in DD and retinas were processed by qPCR with specific TaqMan probes. Rhythmicity was proved by cosinor analysis with a horizontal line as zero hypothesis and one-way ANOVA for differences between the time groups. Full lines indicate rhythms confirmed by cosinor analysis and one-way ANOVA. Dashed lines indicate profiles not confirmed for rhythmicity by one or both methods. Each point represents the mean ± SEM from five to seven animals. p-values indicate group differences by two-way ANOVA, and significant values are in bold.
Biomedicines 08 00579 g005
Figure 6. Effect of development under constant light (LL, in red; controls in LD in black) on rhythmic gene expression in the pineal gland at P30. Animals were housed under LL (16 lux) from P0 until P20 and then released into LD conditions. At P30, the animals were sacrificed in 3 h intervals in DD, and pineal glands were processed by qPCR with specific TaqMan probes. Rhythmicity was proved by cosinor analysis with the horizontal line as zero hypothesis and one-way ANOVA for the differences between time groups. Full lines indicate the rhythms confirmed by cosinor analysis and one-way ANOVA. Each point represents the mean ± SEM from six to eight animals. p-values indicate the group differences by two-way ANOVA, and significant values are in bold.
Biomedicines 08 00579 g006
Figure 7. The effect of development under constant light (LL in red, controls on LD in black) on rhythmic gene expression in the pineal gland at P90. The animals were housed under LL (16 lux) from P0 until P20 and then released into LD conditions. At P90, the animals were sacrificed in 6 h intervals in DD, and pineal glands were processed by qPCR with specific TaqMan probes. The rhythmicity was proved by cosinor analysis with the horizontal line as a zero hypothesis and one-way ANOVA for the difference between time groups. Full lines indicate the rhythms that were confirmed by cosinor analysis and one-way ANOVA. The dashed lines indicate the profiles that were not confirmed for rhythmicity by one or both methods. Each point represents the mean ± SEM from five to seven animals. p-values indicate group difference by two-way ANOVA, and significant values are in bold.
Biomedicines 08 00579 g007
Figure 8. Pie charts showing (a) the relative distribution of statistically significant differences between LD and LL profiles of all gene expressions in brain structures obtained by two-way ANOVA; and (b) relative ratio of rhythmic and non-rhythmic expression profiles in both groups and all brain structures.
Biomedicines 08 00579 g008
Table 1. List of the TaqMan probes used in this study.
Gene SymbolRef. No.Gene Name
AanatRn01461110_m2arylalkylamine N-acetyltransferase
BdnfRn02531967_s1brain-derived neurotrophic factor
GapdhRn01775763_g1glyceraldehyde 3-phosphate dehydrogenase
Grin1Rn01436034_m1glutamate receptor, ionotropic N-methyl D-aspartate 1
Grin2bRn00680474_m1glutamate receptor, ionotropic N-methyl D-aspartate 2B
HprtRn01527840_m1hypoxanthine phosphoribosyltransferase 1
IcerRn04338541_m1inducible cAMP early repressor
Nr1d1Rn01460662_m1Rev-Erbα
Opn1swRn00578824_m1opsin 1, short wavelength Sensitive
Opn4Rn00593931_m1melanopsin
Opn5Rn00710997_m1opsin 5
Per1Rn01325256_m1period 1
Per2Rn01427704_m1period 2
RhoRn00583728_m1rhodopsin
Stat3Rn00680715_m1signal transducer and activator of transcription 3
Tph1Rn01476867_m1tryptophan hydroxylase 1
Table 2. Differences in cosinor parameters between control and LL-reared rats in SCN, retina, and the pineal gland, revealed by one-way ANOVA followed by Tukey’s multiple comparisons test. Significant values are in bold. Dashes indicate missing values. NA (not applicable) indicates that one or both profiles were not rhythmic and cosinor parameters could thus not be calculated (see Figure 2, Figure 3, Figure 4, Figure 5, Figure 6 and Figure 7 for details).
SCNP30P90RetinaP30P90Pineal GlandP30P90
F=p ValueF=p ValueF=p ValueF=p ValueF=p ValueF=p Value
Per1mesorNA--Per1mesor NANAPer1mesor 12.240=0.00065.230=0.0257
amplitude--amplitudeamplitude11.560=0.00094.521=0.0376
acrophase--acrophaseacrophase0.305=0.58160.656=0.4210
Per2mesor 12.840=0.00050.573=0.4522Per2mesorNA0.103=0.7495Per2mesor 4.526=0.03523.322=0.0733
amplitude7.028=0.00910.001=0.9825amplitude0.189=0.6655amplitude4.903=0.02852.427=0.1246
acrophase1.063=0.30472.187=0.1449acrophase9.218=0.0035acrophase0.450=0.50330.743=0.3921
Nr1d1mesorNA0.611=0.4375Nr1d1mesor NA0.486=0.4881Nr1d1mesor 16.250<0.00010.699=0.4066
amplitude0.282=0.5973amplitude0.476=0.4926amplitude42.960<0.00010.021=0.8846
acrophase1.007=0.3198acrophase4.370=0.0406acrophase2.807=0.09621.772=0.1881
BdnfmesorNANABdnfmesor NANABdnfmesor 6.881=0.0097--
amplitudeamplitudeamplitude4.087=0.0452--
acrophaseacrophaseacrophase7.194=0.0082--
Stat3mesor NA3.265=0.0762Stat3mesor NA--Stat3mesor 9.273=0.00285.793=0.0193
amplitude1.236=0.2710amplitude--amplitude12.770=0.00051.980=0.1648
acrophase4.795=0.0328acrophase--acrophase0.047=0.82860.112=0.7391
Grin1mesor NANAAanatmesor 3.344=0.06983.734=0.0580Tph1mesor 9.218=0.00293.562=0.0639
amplitudeamplitude2.554=0.11251.407=0.2402amplitude10.290=0.00171.157=0.2864
acrophaseacrophase1.214=0.27270.036=0.8507acrophase0.407=0.52444.460=0.0389
Grin2bmesor NANAOPN4mesor NA4.445=0.0390Aanatmesor 14.270=0.00027.947=0.0065
amplitudeamplitude0.025=0.8759amplitude11.190=0.001118.040<0.0001
acrophaseacrophase5.149=0.0267acrophase0.008=0.92991.662=0.2024
OPN5mesor NANAIcermesor 0.088=0.76720.016=0.8983
amplitudeamplitude0.506=0.47820.005=0.9461
acrophaseacrophase0.010=0.91840.075=0.7849
OPN1SWmesor NANA
amplitude
acrophase
Rhomesor NANA
amplitude
acrophase
Publisher’s Note: MDPI stays neutral with regard to jurisdictional claims in published maps and institutional affiliations.

