Constructing a New Inter-Calibration Method for DMSP-OLS and NPP-VIIRS Nighttime Light


1
School of Geography and Tourism, Anhui Normal University, Wuhu 241003, China
2
Engineering Technology Research Center of Resources Environment and GIS, Anhui Province, Wuhu 241003, China
3
State Environment Protection Key Laboratory of Satellite Remote Sensing, Institute of Remote Sensing and Digital Earth, Chinese Academy of Sciences, Beijing 100101, China
4
Key Laboratory of Optical Calibration and Characterization, Anhui Institute of Optics and Fine Mechanics, Chinese Academy of Sciences, Hefei 230031, China
*
Author to whom correspondence should be addressed.
Remote Sens. 2020, 12(6), 937; https://doi.org/10.3390/rs12060937
Submission received: 26 January 2020
/
Revised: 27 February 2020
/
Accepted: 11 March 2020
/
Published: 13 March 2020
(This article belongs to the Special Issue Remote Sensing of Nighttime Observations)
Abstract
:The anthropogenic nighttime light (NTL) data that are acquired by satellites can characterize the intensity of human activities on the ground. It has been widely used in urban development assessment, socioeconomic estimate, and other applications. However, currently, the two main sensors, Defense Meteorological Satellite Program’s Operational Linescan System (DMSP-OLS) and Suomi National Polar-orbiting Partnership Satellite’s Visible Infrared Imaging Radiometer Suite (NPP-VIIRS), provide inconsistent data. Hence, the application of NTL for long-term analysis is hampered. This study constructed a new inter-calibration method for DMSP-OLS and NPP-VIIRS nighttime light to solve this problem. First, NTL data were processed to obtain vicarious site across China. By comparing different candidate models, it is discovered the Biphasic Dose Response (BiDoseResp) model, which is a weighted combination of sigmoid functions, can best perform the regression between DMSP-OLS and logarithmically transformed NPP-VIIRS. The coefficient of determination of BiDoseResp model reaches 0.967. It’s residual sum of squares is , which is less than of Logistic function. After obtaining the BiDoseResp-calibrated VIIRS (BDRVIIRS), we smoothed it by a filter with optimal parameters to maximize the consistency. The result shows that the consistency of NTL data is greatly enhanced after calibration. In 2013, the correlation coefficient between DMSP-OLS and original NPP-VIIRS data in the China region is only 0.621, while that reaches to 0.949 after calibration. Finally, a consistent NTL dataset of China from 1992 to 2018 was produced. When compared with the existing methods, our method is applicable to the full dynamic range of DMSP-OLS. Besides, it is more suitable for country or larger scale areas. It is expected that this method can greatly facilitate the development of research that is based on the historical NTL archive.
1. Introduction
Human activities are gradually increasing, which have significantly affected the human environment. The nighttime light (NTL) retrieved by satellite provides a great opportunity to detect human activities on a wide scale and for a long period. Currently, the widely used NTL data is mainly obtained by Defense Meteorological Satellite Program’s Operational Linescan System (DMSP-OLS) and the National Polar-orbiting Partnership Satellite’s Visible Infrared Imaging Radiometer Suite (NPP-VIIRS). National Oceanic and Atmospheric Administration (NOAA) released the DMSP-OLS annual NTL mean product from 1992 to 2013, and the NPP-VIIRS monthly NTL mean product from April 2012 to the present. The NTL data that were retrieved through these two sensors have been widely used in multiple research areas, which characterize human activities from different perspectives. The Evaluation of socioeconomic indices based on NTL can cross administrative boundary and provide reference for the areas without census data [1,2,3]. Urban mapping and impervious surface identifying are boosted by NTL due to its nature of portrayal of urban structure [4,5,6,7]. In addition, NTL provides a new opportunity for estimating energy consumption and greenhouse gas emissions [8,9,10,11]. It also promotes research on the distribution of light pollution and its impact on human health and protected areas [12,13,14].
Despite the wide applications of NTL, only the data of single sensor are used in most existing studies. Few works connect the two sensors. The main barriers include 1) the lack of on-board calibration for DMSP-OLS, 2) the difference in overpass time, and 3) the significant overglow effect of DMSP-OLS [15,16,17]. However, the longer-term analysis and application of NTL can be deeply facilitated by connecting the two sensors. Accordingly, the inter-calibration between these two sensors is now one of the most eagerly awaited researches [18,19,20].
Until now, just a few studies have tried to make the inter-calibration between DMSP-OLS and VPP-VIIRS. In the earliest study, taking some NPP-VIIRS radiance values as reference, a power function was used to calibrate the DMSP-OLS data [21]. However, they used daily data and their method was not suitable for temporally average product. In the following researches, the calibration of temporally average NTL data has been focused on. Jeswani used a logarithm and linear function to perform the inter-calibration [22], yet the overglow effect of DMSP-OLS [23,24] was not considered in their work. In the study of the Syrian Civil War, a power function combined with Gaussian low pass filter was used to make an inter-calibration between monthly average NTL data [25], while the dynamic range after calibration is incomplete (0 to 50). Wu et al. [26] adopted a similar method to correct the annual NTL data of Beijing region, while their result has similar problems with that of Li et al. [25]. The city-scale NPP-VIIRS data were converted into DMSP-like data from 1996 to 2017 by a residuals-corrected geographically weighted regression model [27], while the time range of NTL was not completely expanded [20]. All of these works have promoted the applications of NTL, but these functions still have some limitations in different aspects. A more robust function is expected to achieve better calibration.
The objective of this study is to construct a better calibration function to improve the performances in terms of spatial scale, dynamic range, time range, and simplicity of application, etc. The study area (the whole region of China) and NTL data are introduced in Section 2. Subsequently, the methods of calibration, including a flexible function—BiDoseResp model and the way to find the optimal parameters for smoothing NPP-VIIRS are given in Section 3. Subsequently, Section 4 shows the results of calibration. Finally, in Section 5, calibration performance and the differences between existing methods are evaluated and discussed in detail.
2. Study Areas and Datasets
The whole region of China is taken as the research area. Since the 1980s, China has experienced rapid economic development and urban expansion every year. Studies have shown that NTL in China have significantly changed since 1992 [28,29,30]. Therefore, it is particularly important to establish a better calibration function for DMSP-OLS and NPP-VIIRS nighttime light of China region.
DMSP-OLS was originally designed to detect the presence of night clouds, so it is not equipped with on-board calibration. When the sky is cloudless, city illumination can be captured and recorded by the sensor. However, it keeps changing gain coefficients according to the dynamic scene luminosity. So, the gain coefficients are not recorded systematically [31]. Furthermore, due to its large footprint, there is an obvious overglow effect which causes the lit area in the data larger than actual light source area. The annual DMSP-OLS stable light product used in this study was downloaded from the website of Earth Observation Group (EOG) affiliated with NOAA (https://ngdc.noaa.gov/eog/dmsp/downloadV4composites.html). It is available from 1992 to 2013, with a spatial resolution of 30 arc seconds. The pixel values of DMSP-OLS are unitless Digital Number (DN). Its quantization ability is six bits. The overpass time of the satellite is between 19:30 and 21:30.
On the other hand, the NPP-VIIRS Day/Night Band (DNB) is dedicated to acquiring NTL data on the ground. It adopts a solar diffuser for on-board calibration. Three different gains stages are used to record the ground illumination under different bright conditions. In the processing phase, according to known coefficients, raw data are converted into radiance. In addition, the overglow effect in the NPP-VIIRS data is effectively reduced by aggregating and deleting stretched pixels [32]. The NPP-VIIRS monthly product from April 2012 to the present is also available on the website of EOG (https://ngdc.noaa.gov/eog/viirs/download_dnb_composites.html). It records the radiance of ground illumination. Its unit is nanoWatts//Sr. The spatial resolution is 15 arc seconds, the quantization ability is 14 bits for high gain stage (HGS) and 13 bits for medium/low gain stage (MGS/LGS). The overpass time is 1:30 [33]. In this study, the NTL data of these two sensors in the overlapping year of 2013 were used to construct the calibration function. Table 1 shows the properties of DMSP-OLS and NPP-VIIRS.
3. Methodology
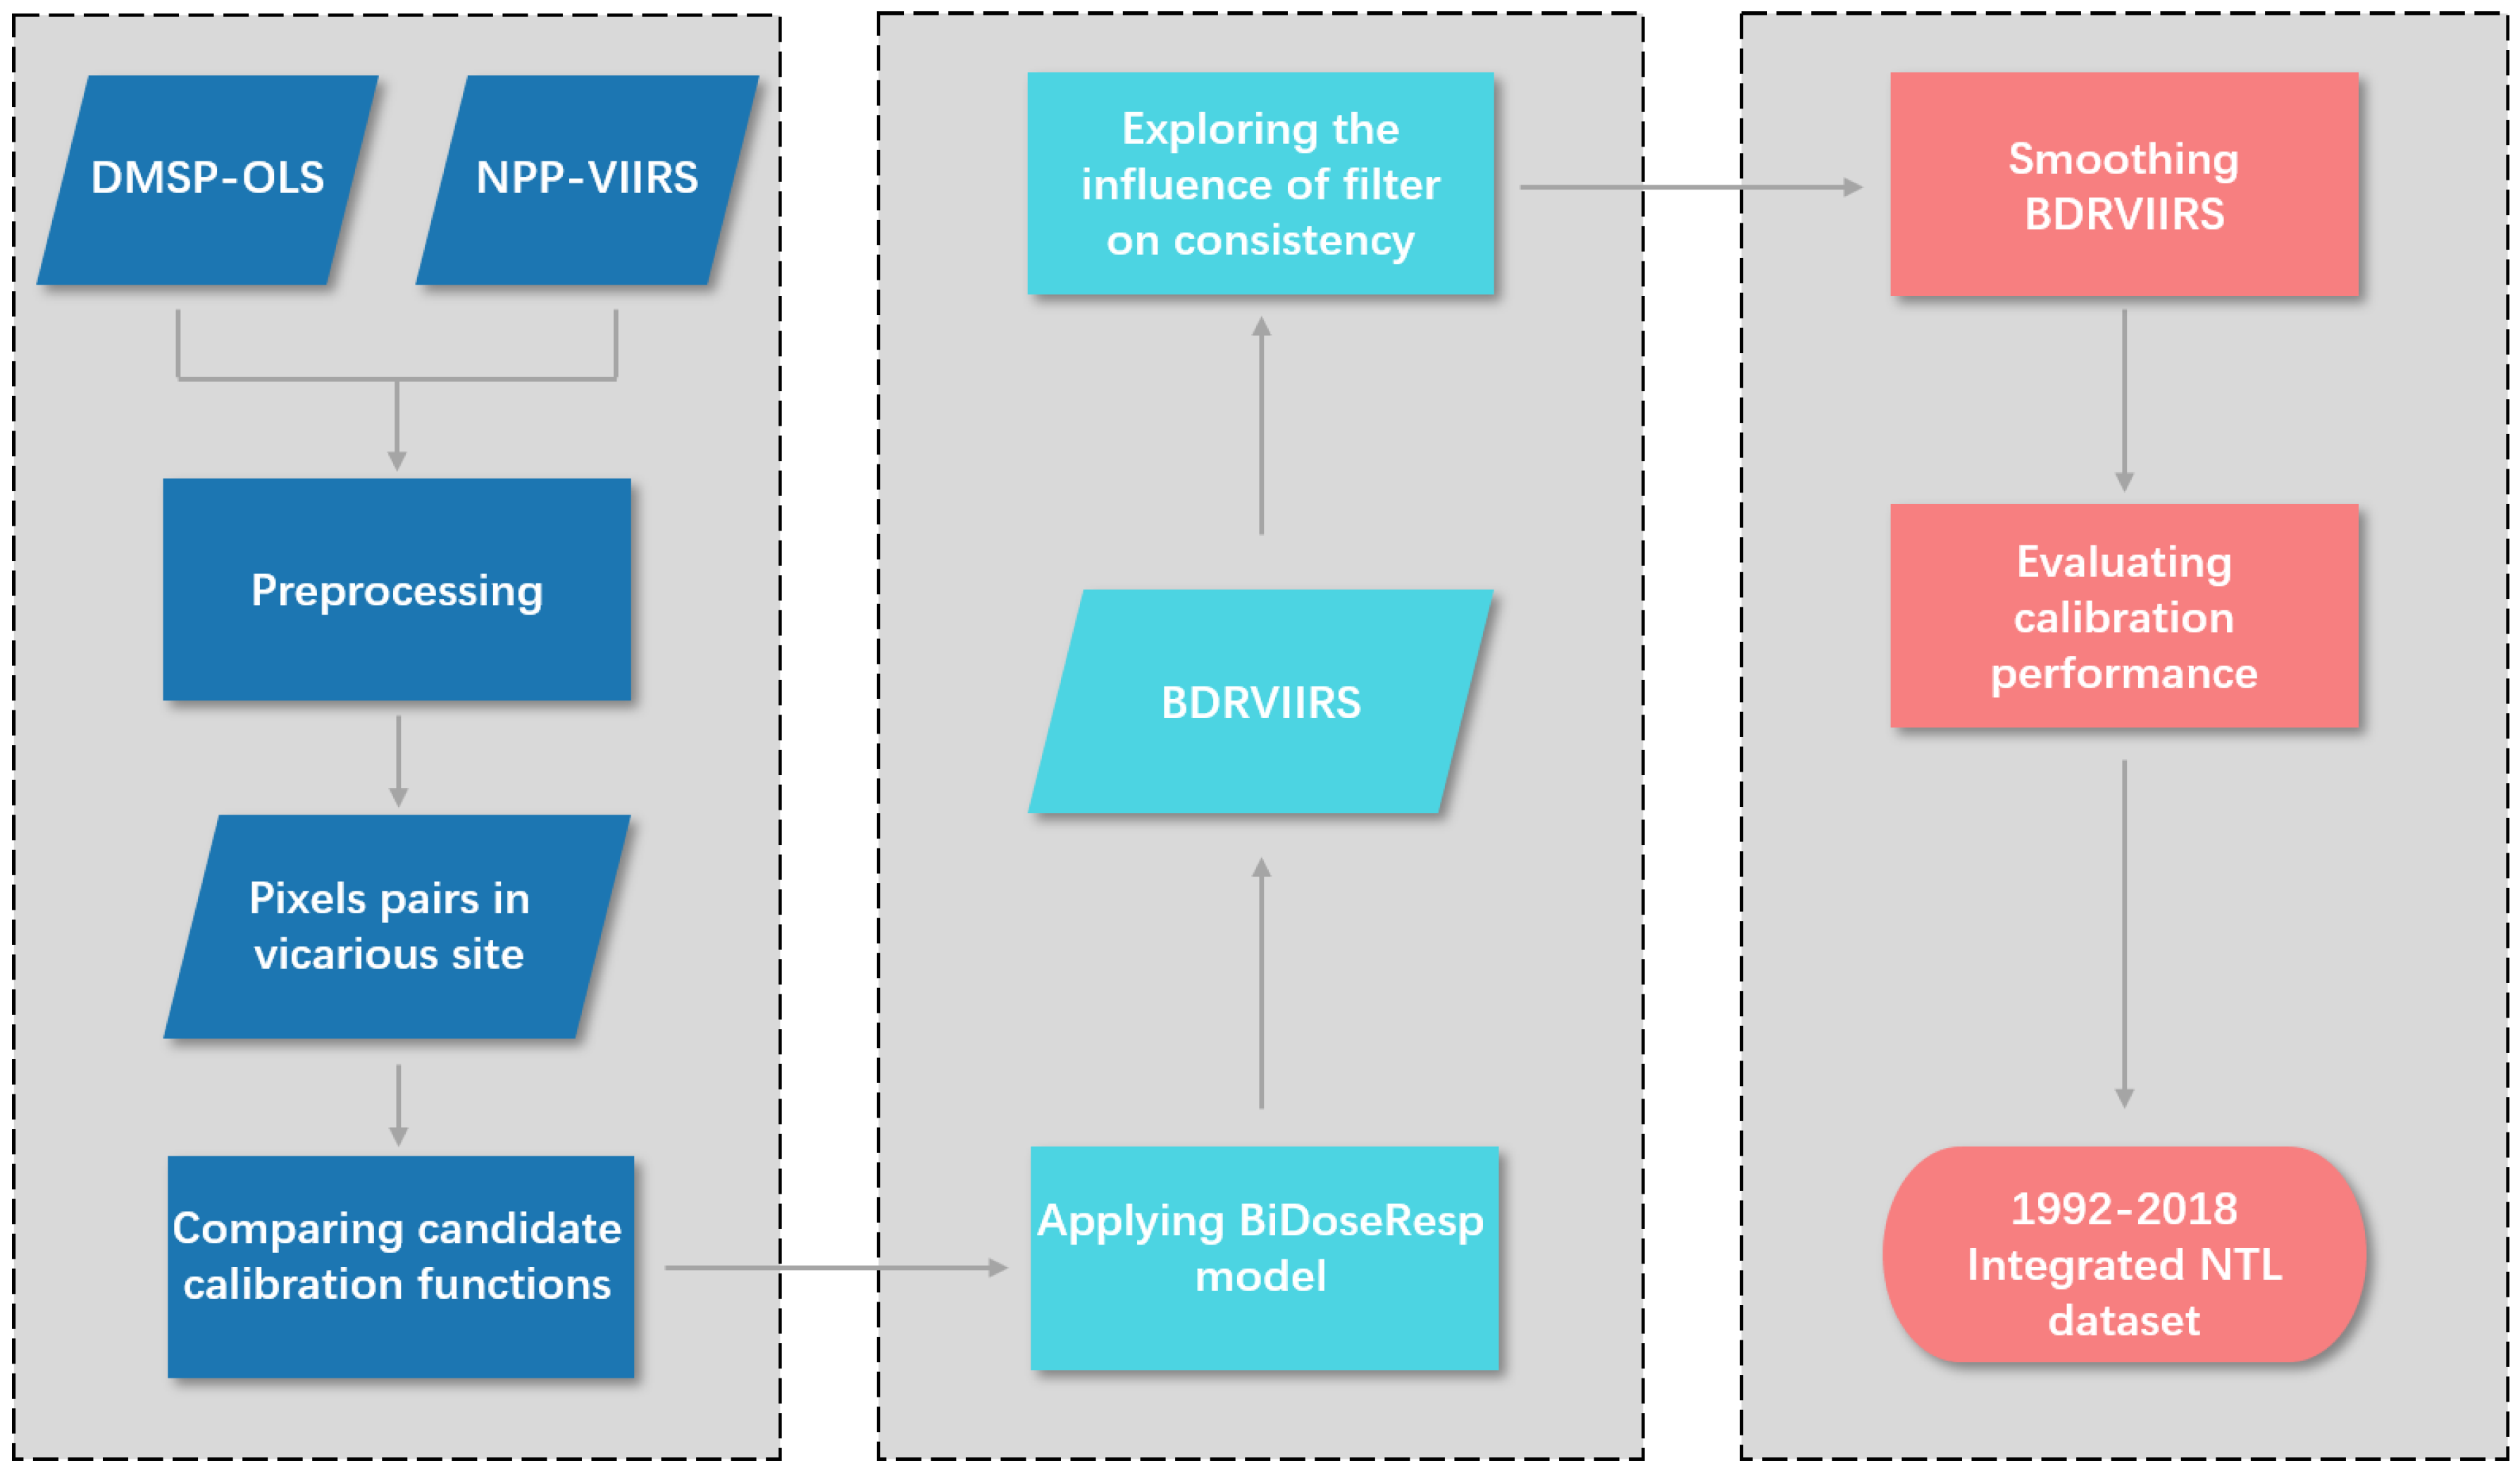
It is assumed that NPP-VIIRS data are the record of actual ground radiation. The variation of gain coefficient and the overglow effect are regarded as DMSP satellite’s non-linear transformation to actual ground radiation. Reconstructing the non-linear transformation can be divided into two parts: (1) constructing a robust calibration function from NPP-VIIRS to DMSP-OLS, and (2) smoothing the calibrated VIIRS to adapt to the overglow effect of DMSP-OLS. Figure 1 shows the flowchart of this study.
3.1. Preprocessing
The NTL data of both sensors were re-projected to the Albers Equal Area Conic Projection. An annual synthesis of NPP-VIIRS data was carried out since NPP-VIIRS data are monthly mean product, while DMSP-OLS data are annual mean product. Subsequently, it was resampled to to match the DMSP-OLS data. In addition, there are temporary illumination and background noise in the NPP-VIIRS data; instead, only long-term and stable light exists in DMSP-OLS data. A simple method that was proposed by Li et al. [34] was adopted to eliminate the temporary illumination and background noise. After that, a small number of negative pixels were set to 0. Finally, the method that was proposed by Elvidge et al. [35] was used to improve the continuity of the DMSP-OLS data from 1992 to 2013.
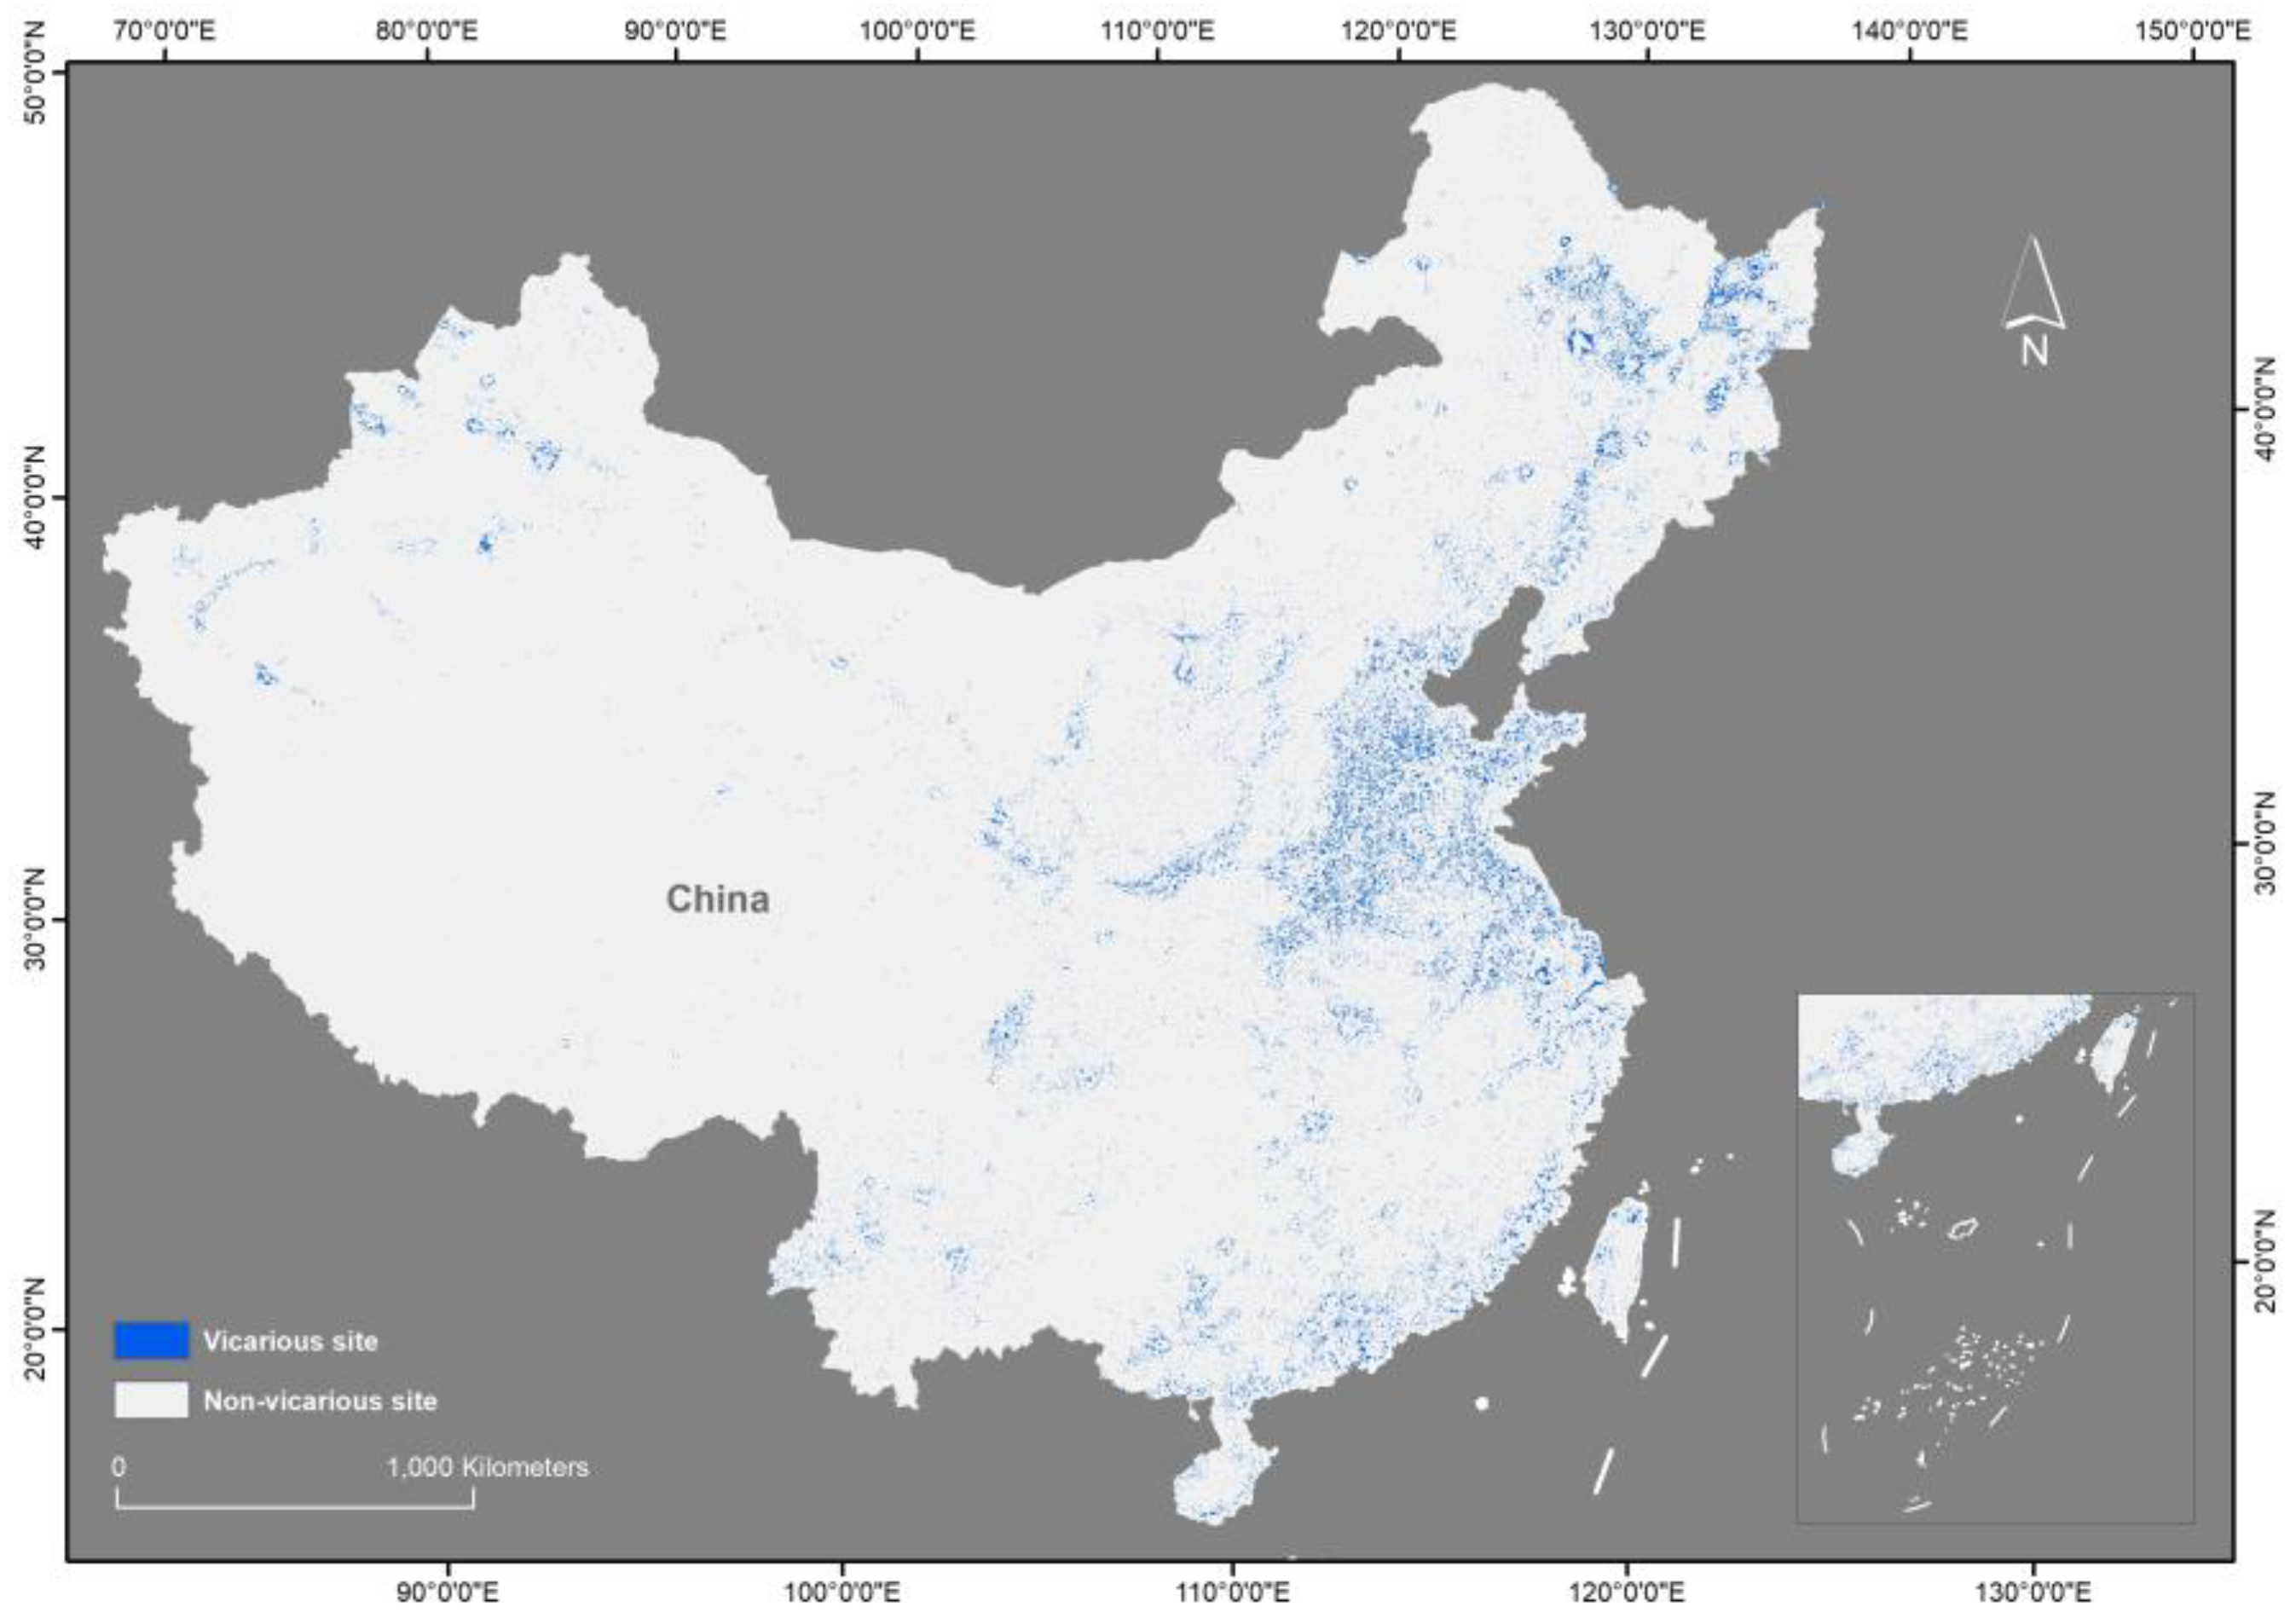
A vicarious site is required in inter-calibration to provide samples [36,37,38]. However, there is no special calibration site designed for NTL in the world. This study used the coefficient of variation (CV) to select the calibration site to deal with this problem, referring to Jeswani [22]. It is assumed that the small CV stands for the stable NTL radiation. First, the CVs of 3 × 3 windows of all pixels in DMSP-OLS data and NPP-VIIRS data were computed, respectively. Subsequently, the pixels with values less than 20 were extracted, which represented the radiation-stable areas in the two datasets. Since there are several hours’ difference between the overpass time of the two sensors, some of NTL on the ground is changed during this period. An intersection operation was made between the radiation-stable areas of DMSP-OLS and NPP-VIIRS to obtain the stable pixels both spatially and temporally. Finally, the pixels in the intersection constituted the vicarious site. Figure 2 shows the distribution of the vicarious site across China.
3.2. Constructing Inter-calibration Function
As the dynamic range and the luminance distribution of DMSP-OLS and NPP-VIIRS are different, it is necessary to narrow those differences before constructing a calibration function. Accordingly, the NPP-VIIRS data underwent a logarithmic transformation, which cannot only compress its dynamic range, but also made its luminance distribution more similar to that of the DMSP-OLS data [39].
A calibration function is the key to improve the consistency between DMSP-OLS and NPP-VIIRS. First, the logarithmically transformed VIIRS and DMSP-OLS pixels within the vicarious site were extracted. Afterwards, according to the characteristics of these pixel pairs in scatter plot, Sigmoid functions were used to build the relationship. A Logistic model and a BiDoseResp model were used as the candidate functions in order to find a mathematical expression that can achieve the best regression. Although both can show S-shaped growth trends, the two are different in details. The Logistic model is subject to the characteristic of strict central symmetry, which might lead to its lack of flexibility in regression. However, the BiDoseResp model is a weighted combination of two Logistic models (c1 and c2). The combination can make it free of central symmetry [40]. Therefore, the BiDoseRsep model has greater flexibility. The Logistic model is described as in Equation (1):
where Y denotes the calibrated value from NPP-VIIRS to DMSP-OLS; the Bottom denotes value of Y for minimal curve asymptote; the Top denotes value of Y for maximal curve asymptote; independent variable is the logarithm of the NPP-VIIRS value; denotes the mean of independent variable; h is the slop of the curve. The BiDoseResp model is defined as in Equation (2):
where is the weight of one of the Logistic curves; and denote the mean of independent variables of c1 and c2, respectively; h1 and h2 are the slops of c1 and c2 respectively. The coefficient of determination () and the residual sum of square (RSS) were taken as the evaluation indicators. After comparing the regression results, the model with better performance was used to process the NPP-VIIRS across China. In this way, the calibrated NPP-VIIRS was generated.
3.3. Mitigating Spatial Variability
There is still a gap between DMSP-OLS and the calibrated NPP-VIIRS due to the obvious overglow effect of DMSP-OLS. It is necessary to smooth the calibrated NPP-VIIRS to adapt to the overglow effect in order to maximize the consistency between the two. Some studies have adopted Gaussian low pass filter to smooth NPP-VIIRS, so that it can get similar to the DMSP-OLS [25]. However, how the different parameters (σ, w) of the filter affect the consistency has not been clearly revealed. σ was changed by iteration from 0.20 to 5.00 in steps of 0.01 and w was changed from 3 to 29 in steps of 2 to generate 6734 parameter pairs to generate a better understanding of this. Each parameter pair was taken as the input of Gaussian low pass filter to smooth the calibrated NPP-VIIRS. RSS was taken to characterize the gap between DMSP-OLS and the calibrated NPP-VIIRS. The larger the RSS, the greater the gap, and vice versa. With σ, w, and RSS as the axes of coordinates, the computing results were plotted in a 3D space to clearly reveal the effect of different parameters on the consistency. After that, the parameters corresponding to the lowest point were used as the input of the filter to smooth the calibrated NPP-VIIRS, so that it can be consistent with the DMSP-OLS data to the greatest extent.
4. Results
4.1. Constructing Inter-Calibration Function
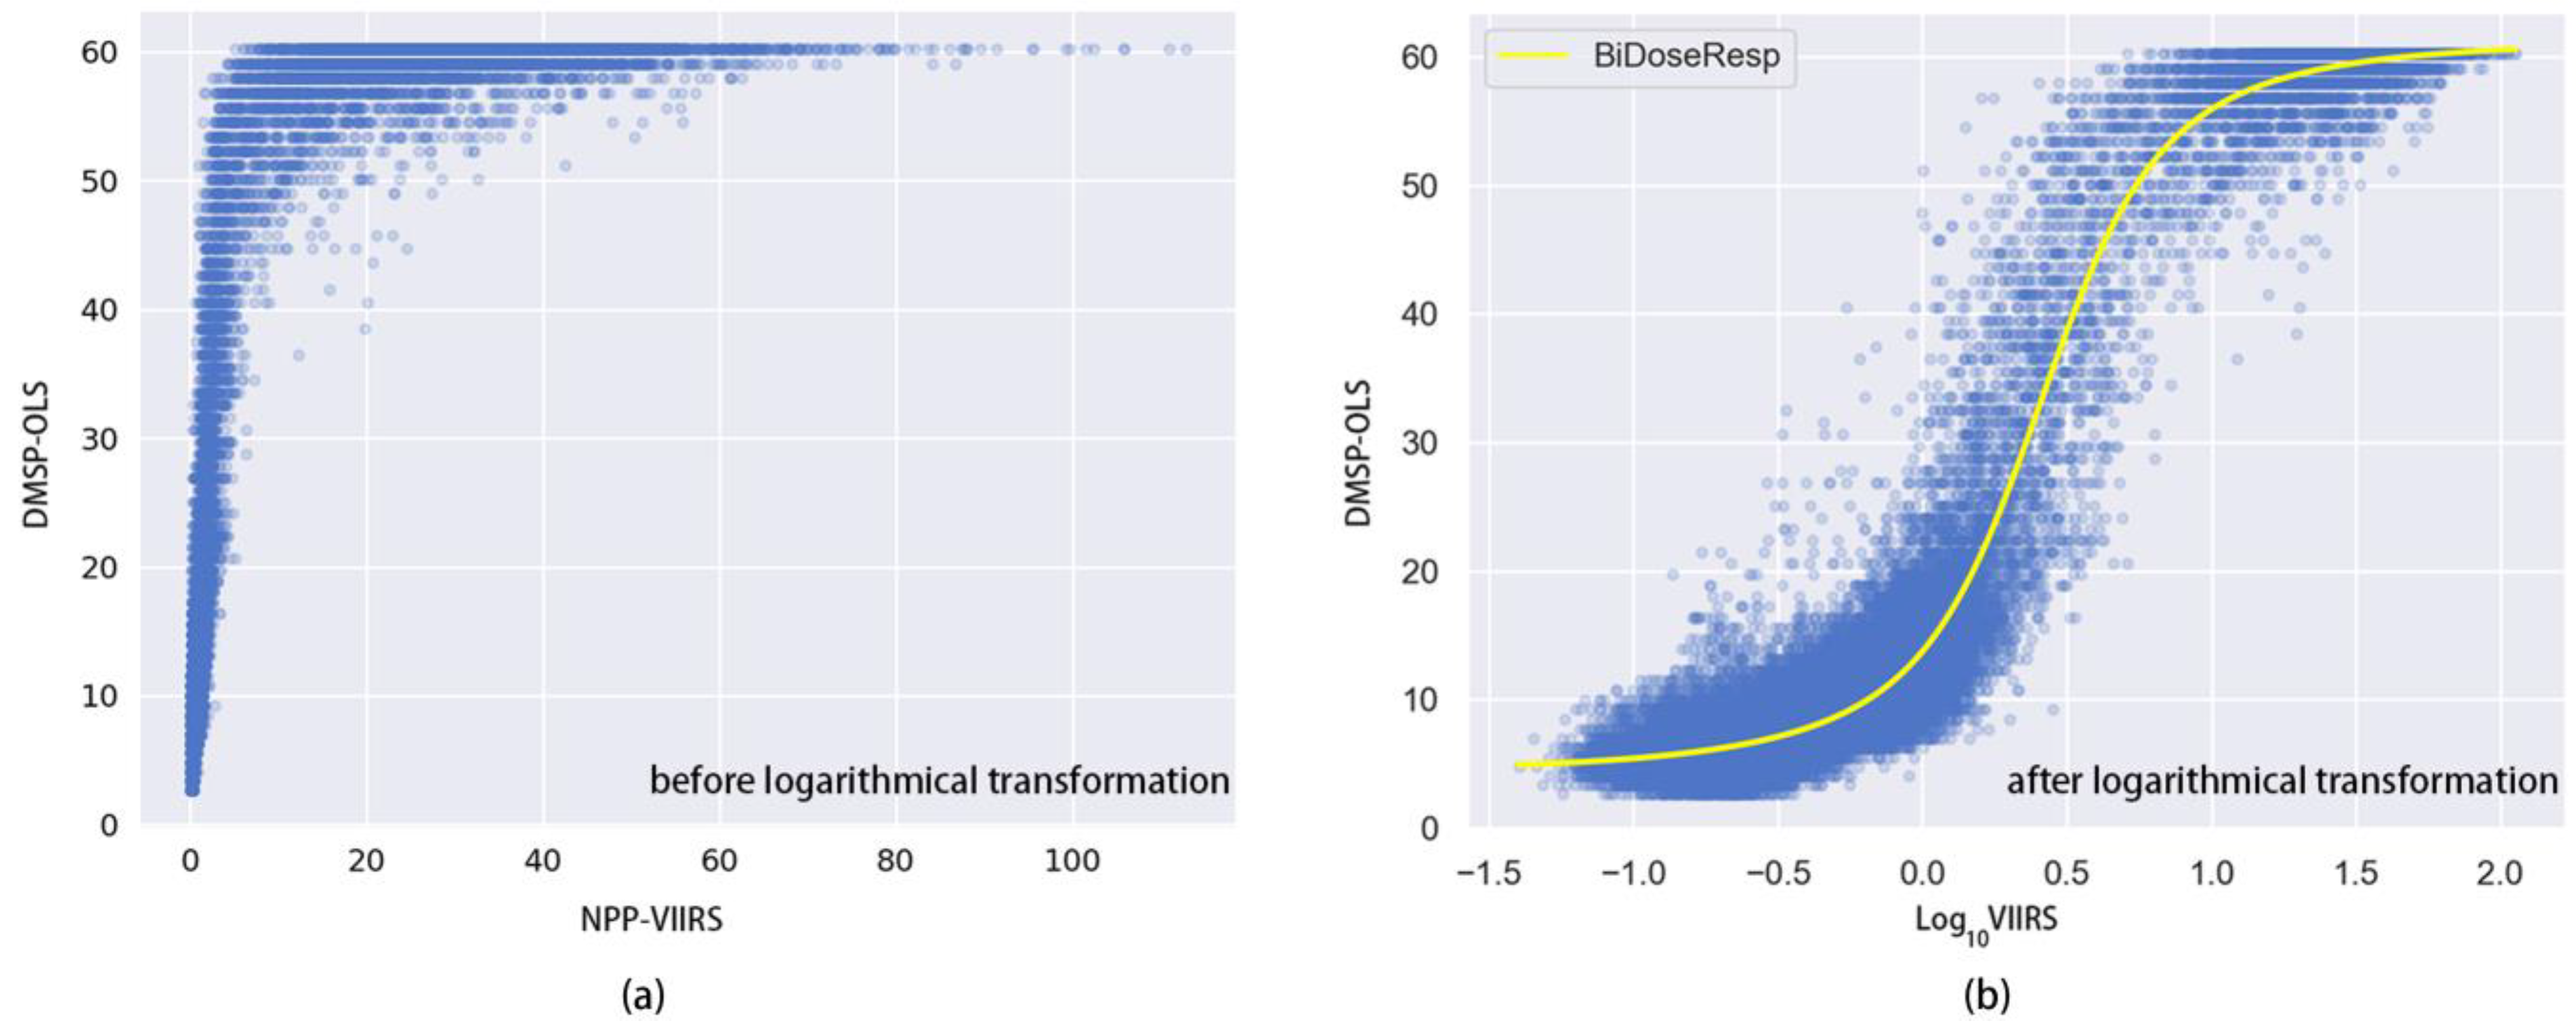
Figure 3a shows the original NPP-VIIRS and DMSP-OLS pixel pairs in the vicarious site. All of the pixel pairs are concentrated along the y-axis; therefore, it is impossible to directly make a good regression. However, after the logarithmic transformation of NPP-VIIRS, it is discovered that these pixel pairs present a significant S-shaped distribution in the scatter plot of Figure 3b. Different from the previous one, the S-shaped distribution shows the potential relationship between DMSP-OLS and NPP-VIIRS, and allows for constructing a mathematical expression to achieve the inter-calibration. Both the BiDoseResp model and the Logistic model achieve good regressions, with reaching 0.967, as shown in Table 2. However, the RSS () of the BiDoseResp model is significantly less than that () of the Logistic model. It indicates that the BiDoseResp model can bring less residuals and higher calibration accuracy. This is due to the weighted combination, which gives the BiDoseResp model more flexibility. In addition, the power and linear functions that are proposed in the previous methods were also used to perform regression. It turns out that the power function cannot converge, and the fitting of the linear function is not as good as the BiDoseResp model. Hence, when compared with other models, the BiDoseResp model can achieve the best regression. The yellow curve in Figure 3b stands for the regression curve of the BiDoseRsep model, and its parameters are shown in Table 3. Finally, the BiDoseResp-calibrated VIIRS (BDRVIIRS) was obtained by applying the model on the NPP-VIIRS data across China.
4.2. Mitigating Spatial Variability
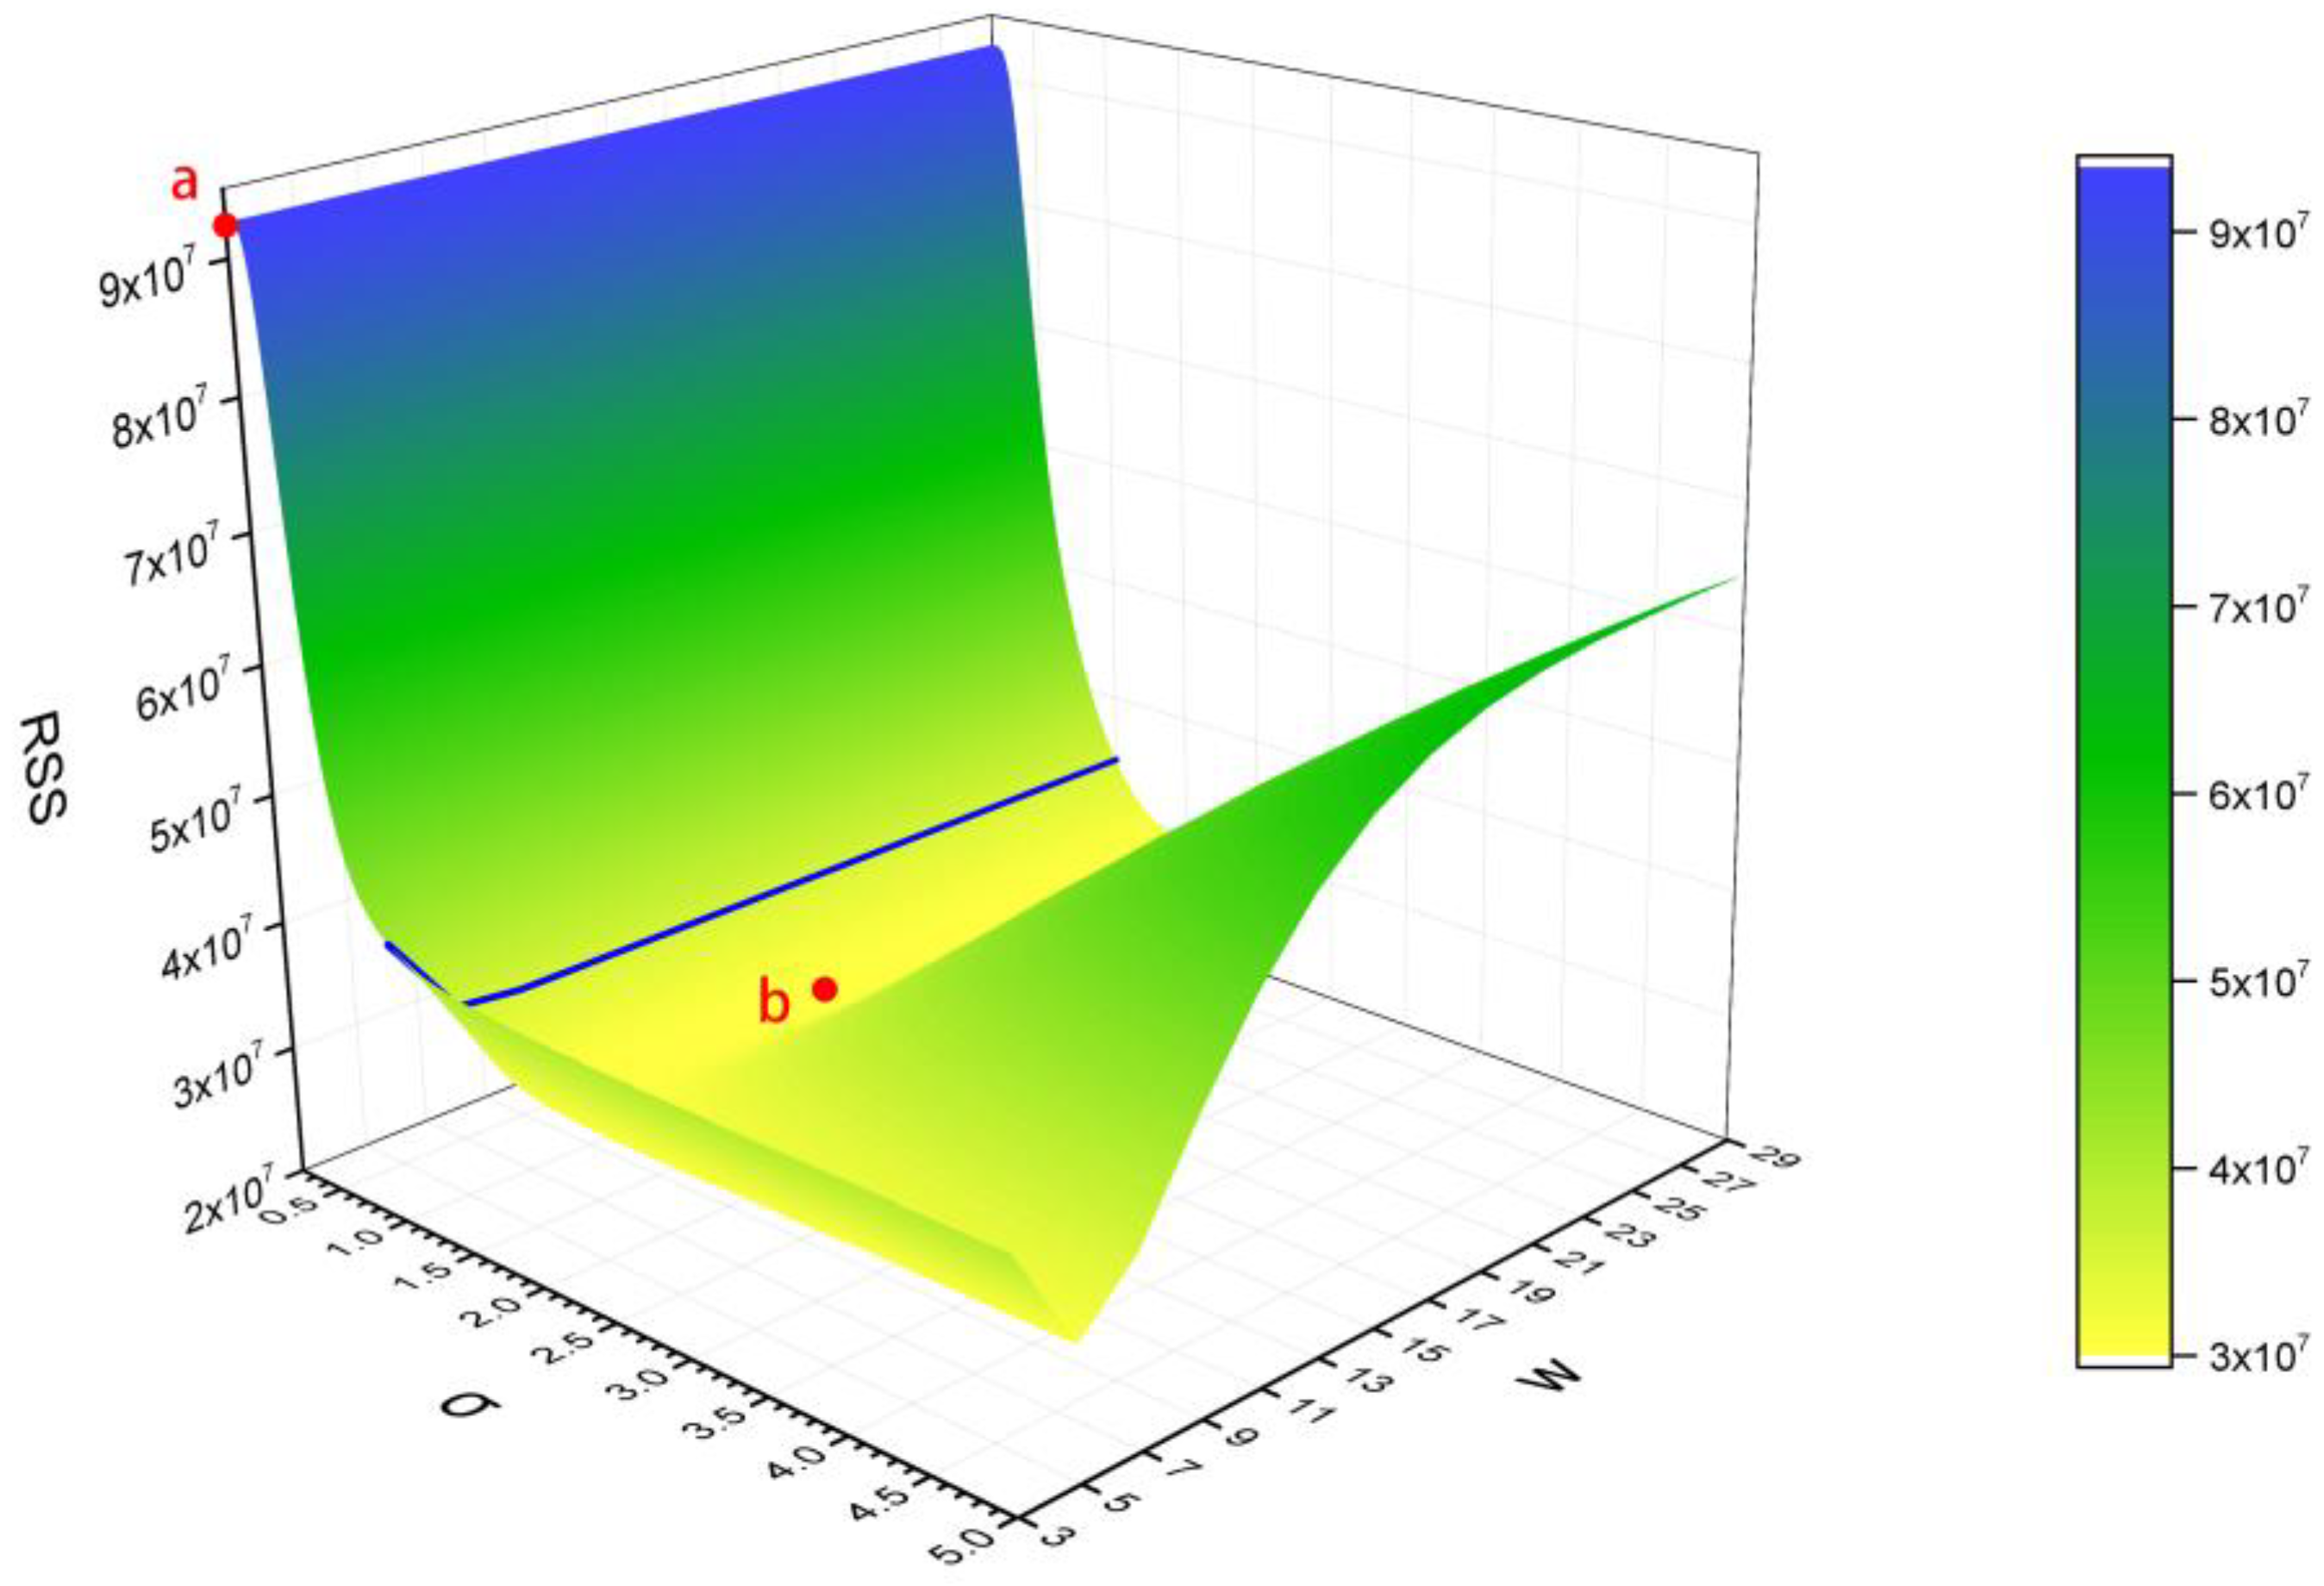
After the different Gaussian low pass filters processed BDRVIIRS, the RSS values between BDRVIIRS and DMSP-OLS were obtained. Cast into a 3D space, these 6734 RSS values construct such a surface, as shown in the Figure 4. For the first time, the surface makes it possible for us to clearly understand how the different parameters of the filter affect the consistency. In the beginning, the RSS is (as indicated by Point a). After the filter is performed, the RSS begins to change. As σ increases, RSS dramatically decreases. When σ gets to 1.00, the filter becomes normally distributional at this time, which significantly improves the consistency (as indicated by the blue line). However, the current consistency has not reached its best. When σ becomes 1.51 and w becomes 15, the lowest point of the surface is eventually reached (as indicated by Point b). The minimum RSS is and the corresponding root mean squared error (RMSE) is 3.976. As parameters continue to change, RSS turns to increase, and the consistency starts to decrease. This is because BDRVIIRS is over-smoothed at this time. Finally, the parameters corresponding to the lowest Point b was selected as the input of the filter to process BDRVIIRS. In this way, it was smoothed to be consistent with DMSP-OLS to the greatest extent.
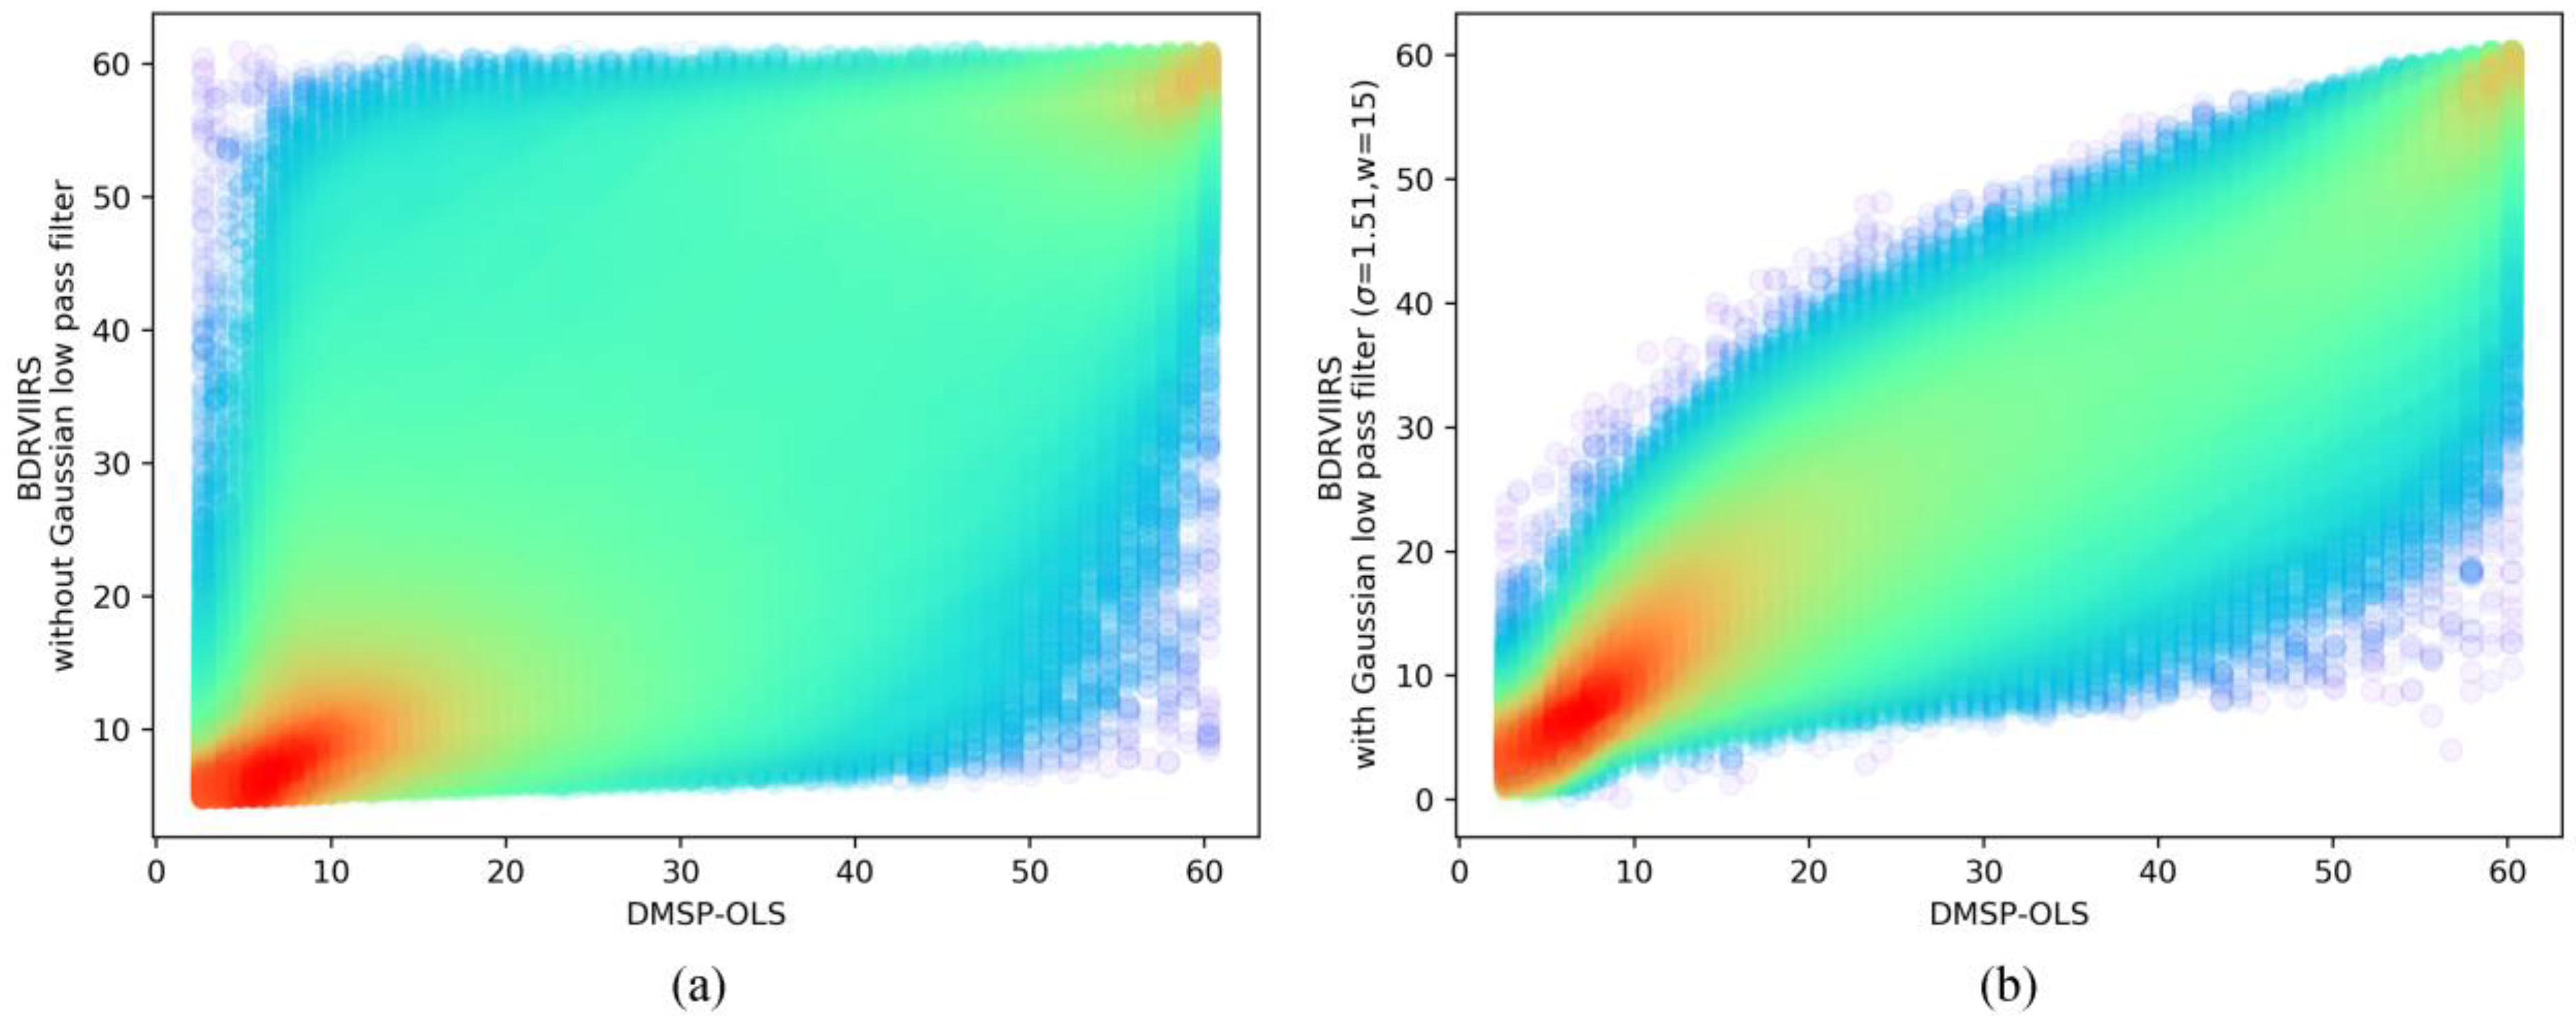
Figure 5a shows the scatter density plot of BDRVIIRS and DMSP-OLS of the whole China region without a Gaussian low pass filter, which corresponds to Point a in Figure 4. The scatter distribution is very discrete. This is due to the conflict between the overglow effect of DMSP-OLS and the high-precision of unsmoothed BDRVIIRS. The Gaussian low pass filter (σ = 1.51, w = 15) can make BDRVIIRS adapt to DMSP-OLS as much as possible. The smoothed BDRVIIRS reduces the scatter dispersion significantly, which corresponds to Point b in Figure 4, as Figure 5b shows. At this time, it shows a significant positive correlation with DMSP-OLS where the correlation coefficient (r) reaches 0.949.
4.3. Trend of Calibrated NTL of China
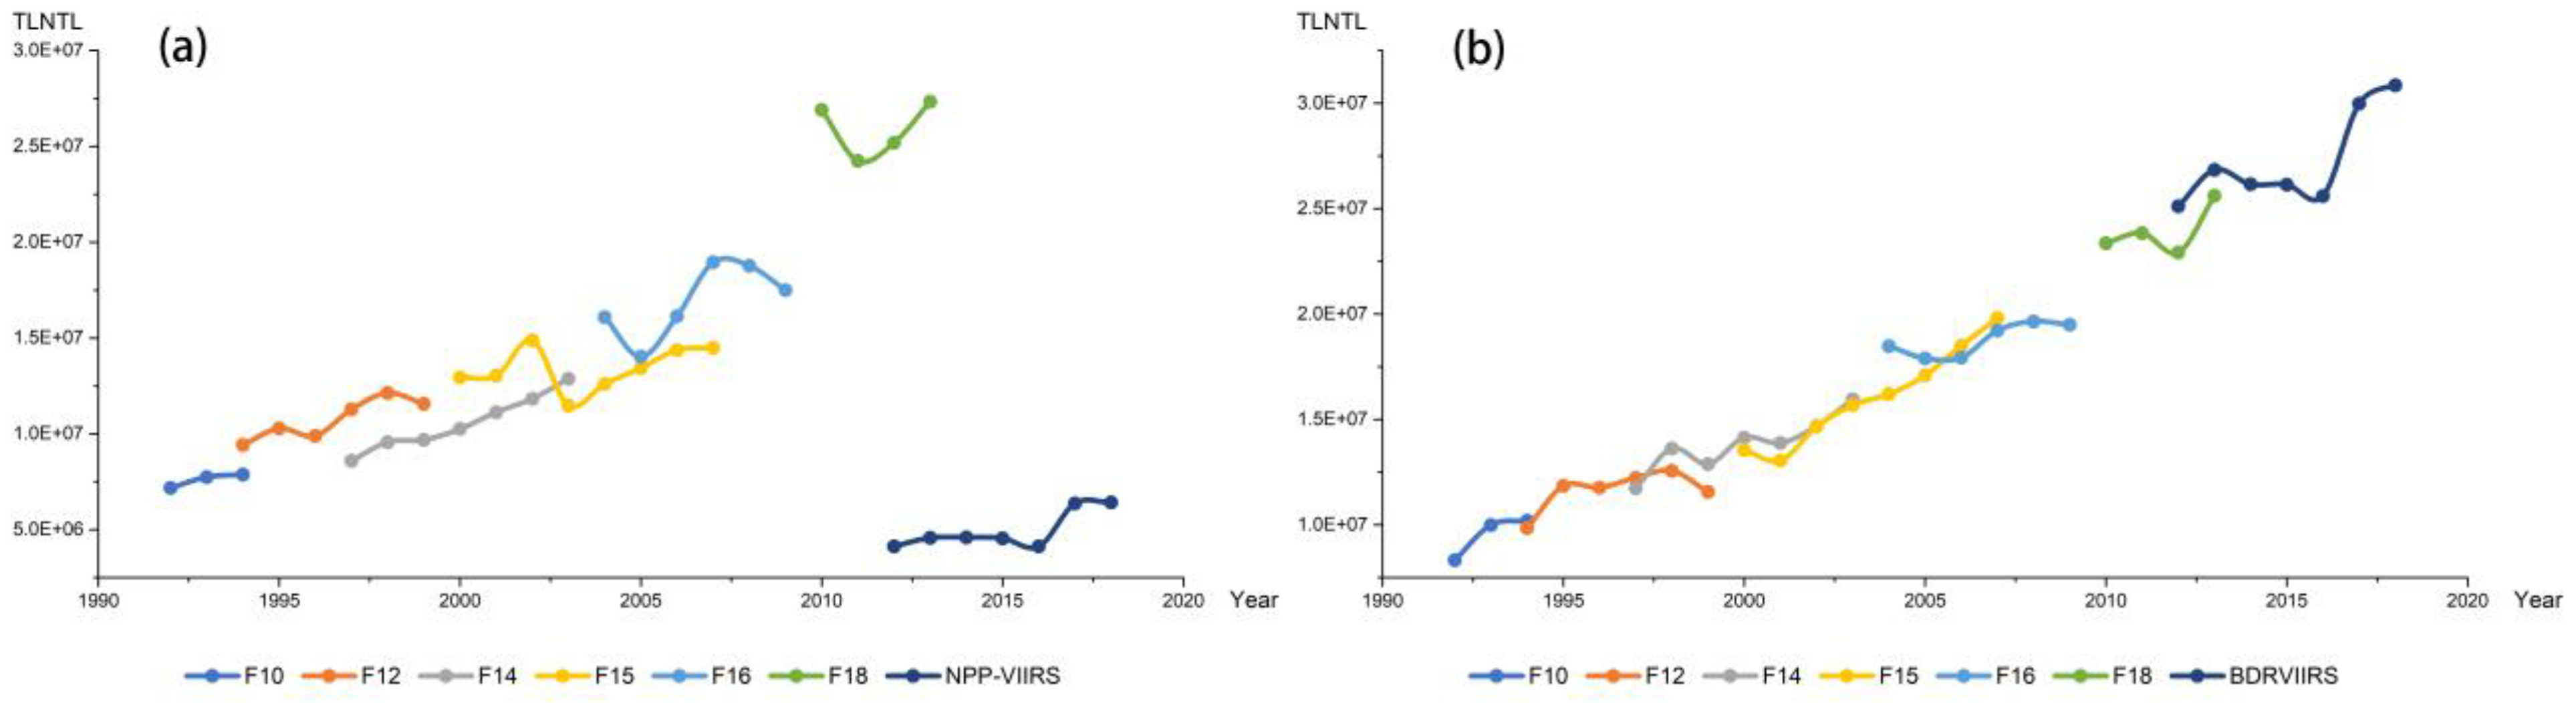
Due to the lack of on-board calibration for DMSP-OLS sensors, there is the lack of continuity between the original DMSP-OLS data from 1992 to 2013, so the total light value (TLV) between different years and different satellites fluctuates severely, as shown in Figure 6a. A quadratic polynomial method proposed by Elvidge et al. [35] was used to make an inter-calibration between the DMSP-OLS data of different years and different satellites to solve these problems. As a result, the continuity of DMSP-OLS data was enhanced after inter-calibration, and the fluctuation of TLV between different years and different satellites was significantly alleviated. On the other hand, since the non-calibrated NPP-VIIRS data is inconsistent with DMSP-OLS data, there is a big gap between the TLV of the two kinds of sensors. Therefore, the annual NPP-VIIRS data from 2012 to 2018 was calibrated by the method that was proposed in this paper. Eventually, as presented in Figure 6b, the TLV of the DMSP-OLS data and that of the BDRVIIRS data show a good continuity. The TLV of China has been increasing from 1992 to 2018, which is consistent with the economic development of China during this period.
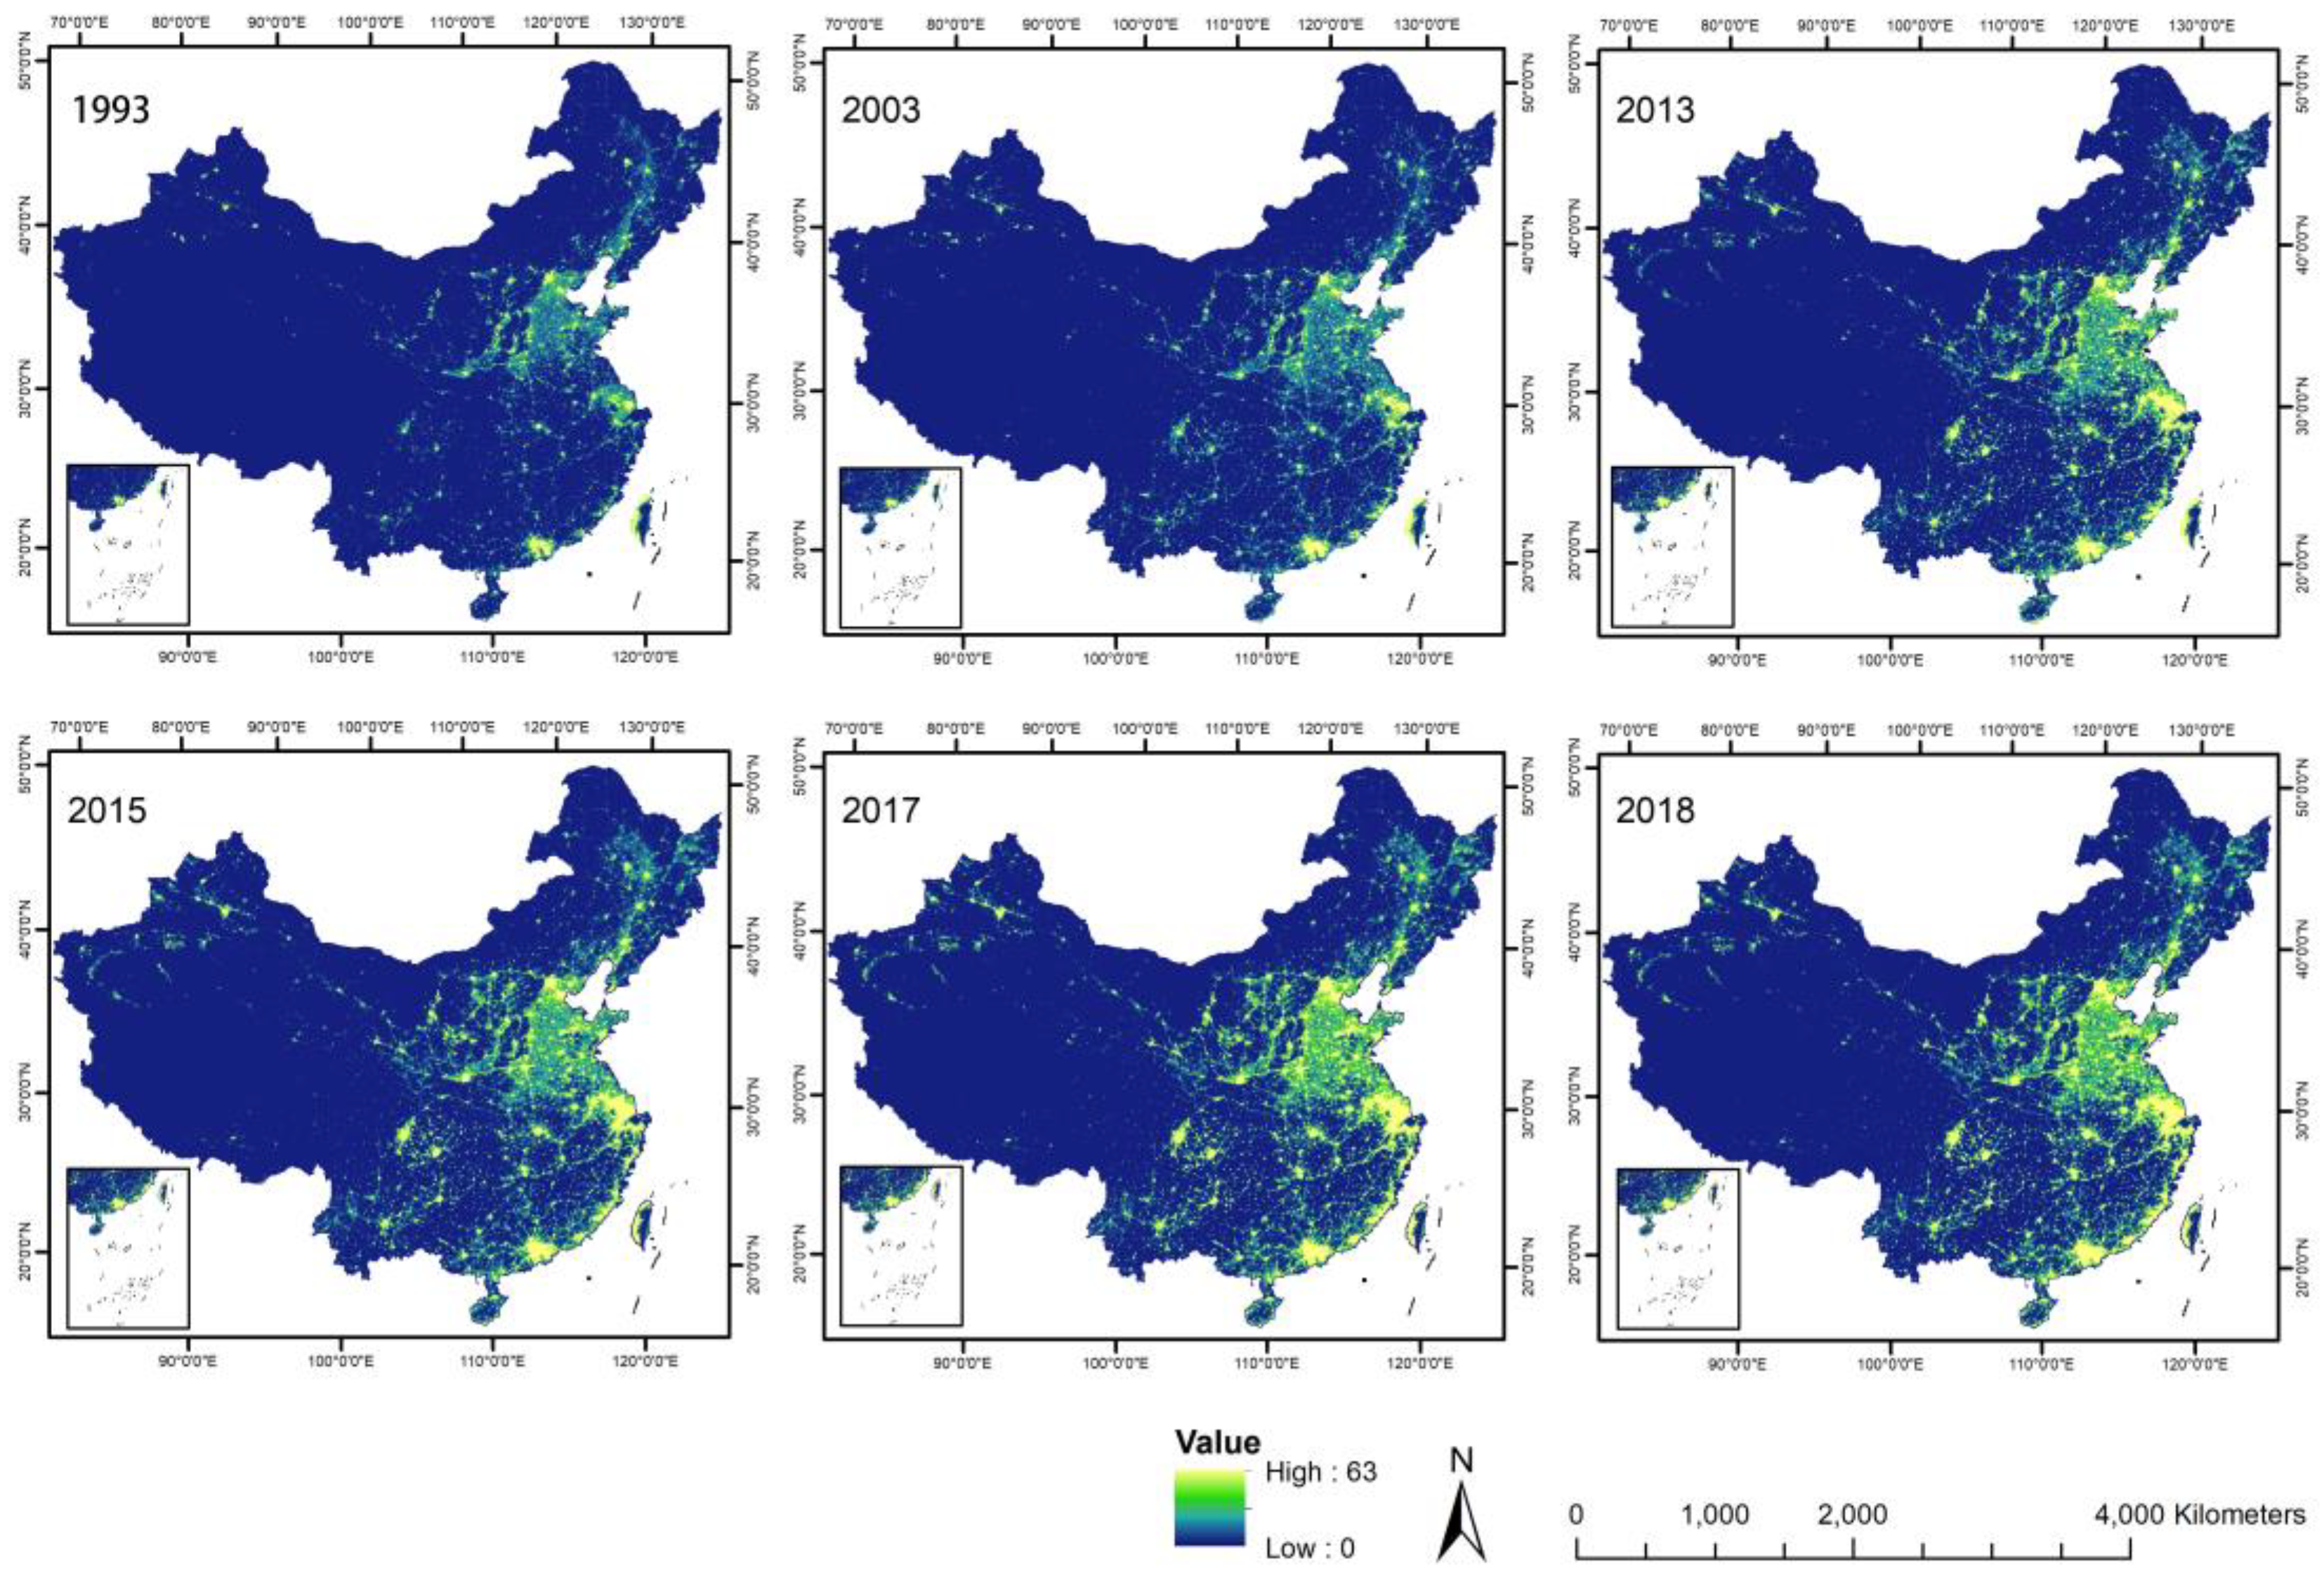
Figure 7 shows the calibrated NTL images of China in some years from 1992 to 2018. Overall, with the passage of time, the scope and the brightness of NTL increased significantly. In addition, the light generally radiates outward from the metropolis. The area with the biggest increase of NTL is eastern China.
5. Discussion
5.1. Evaluating Image Texture
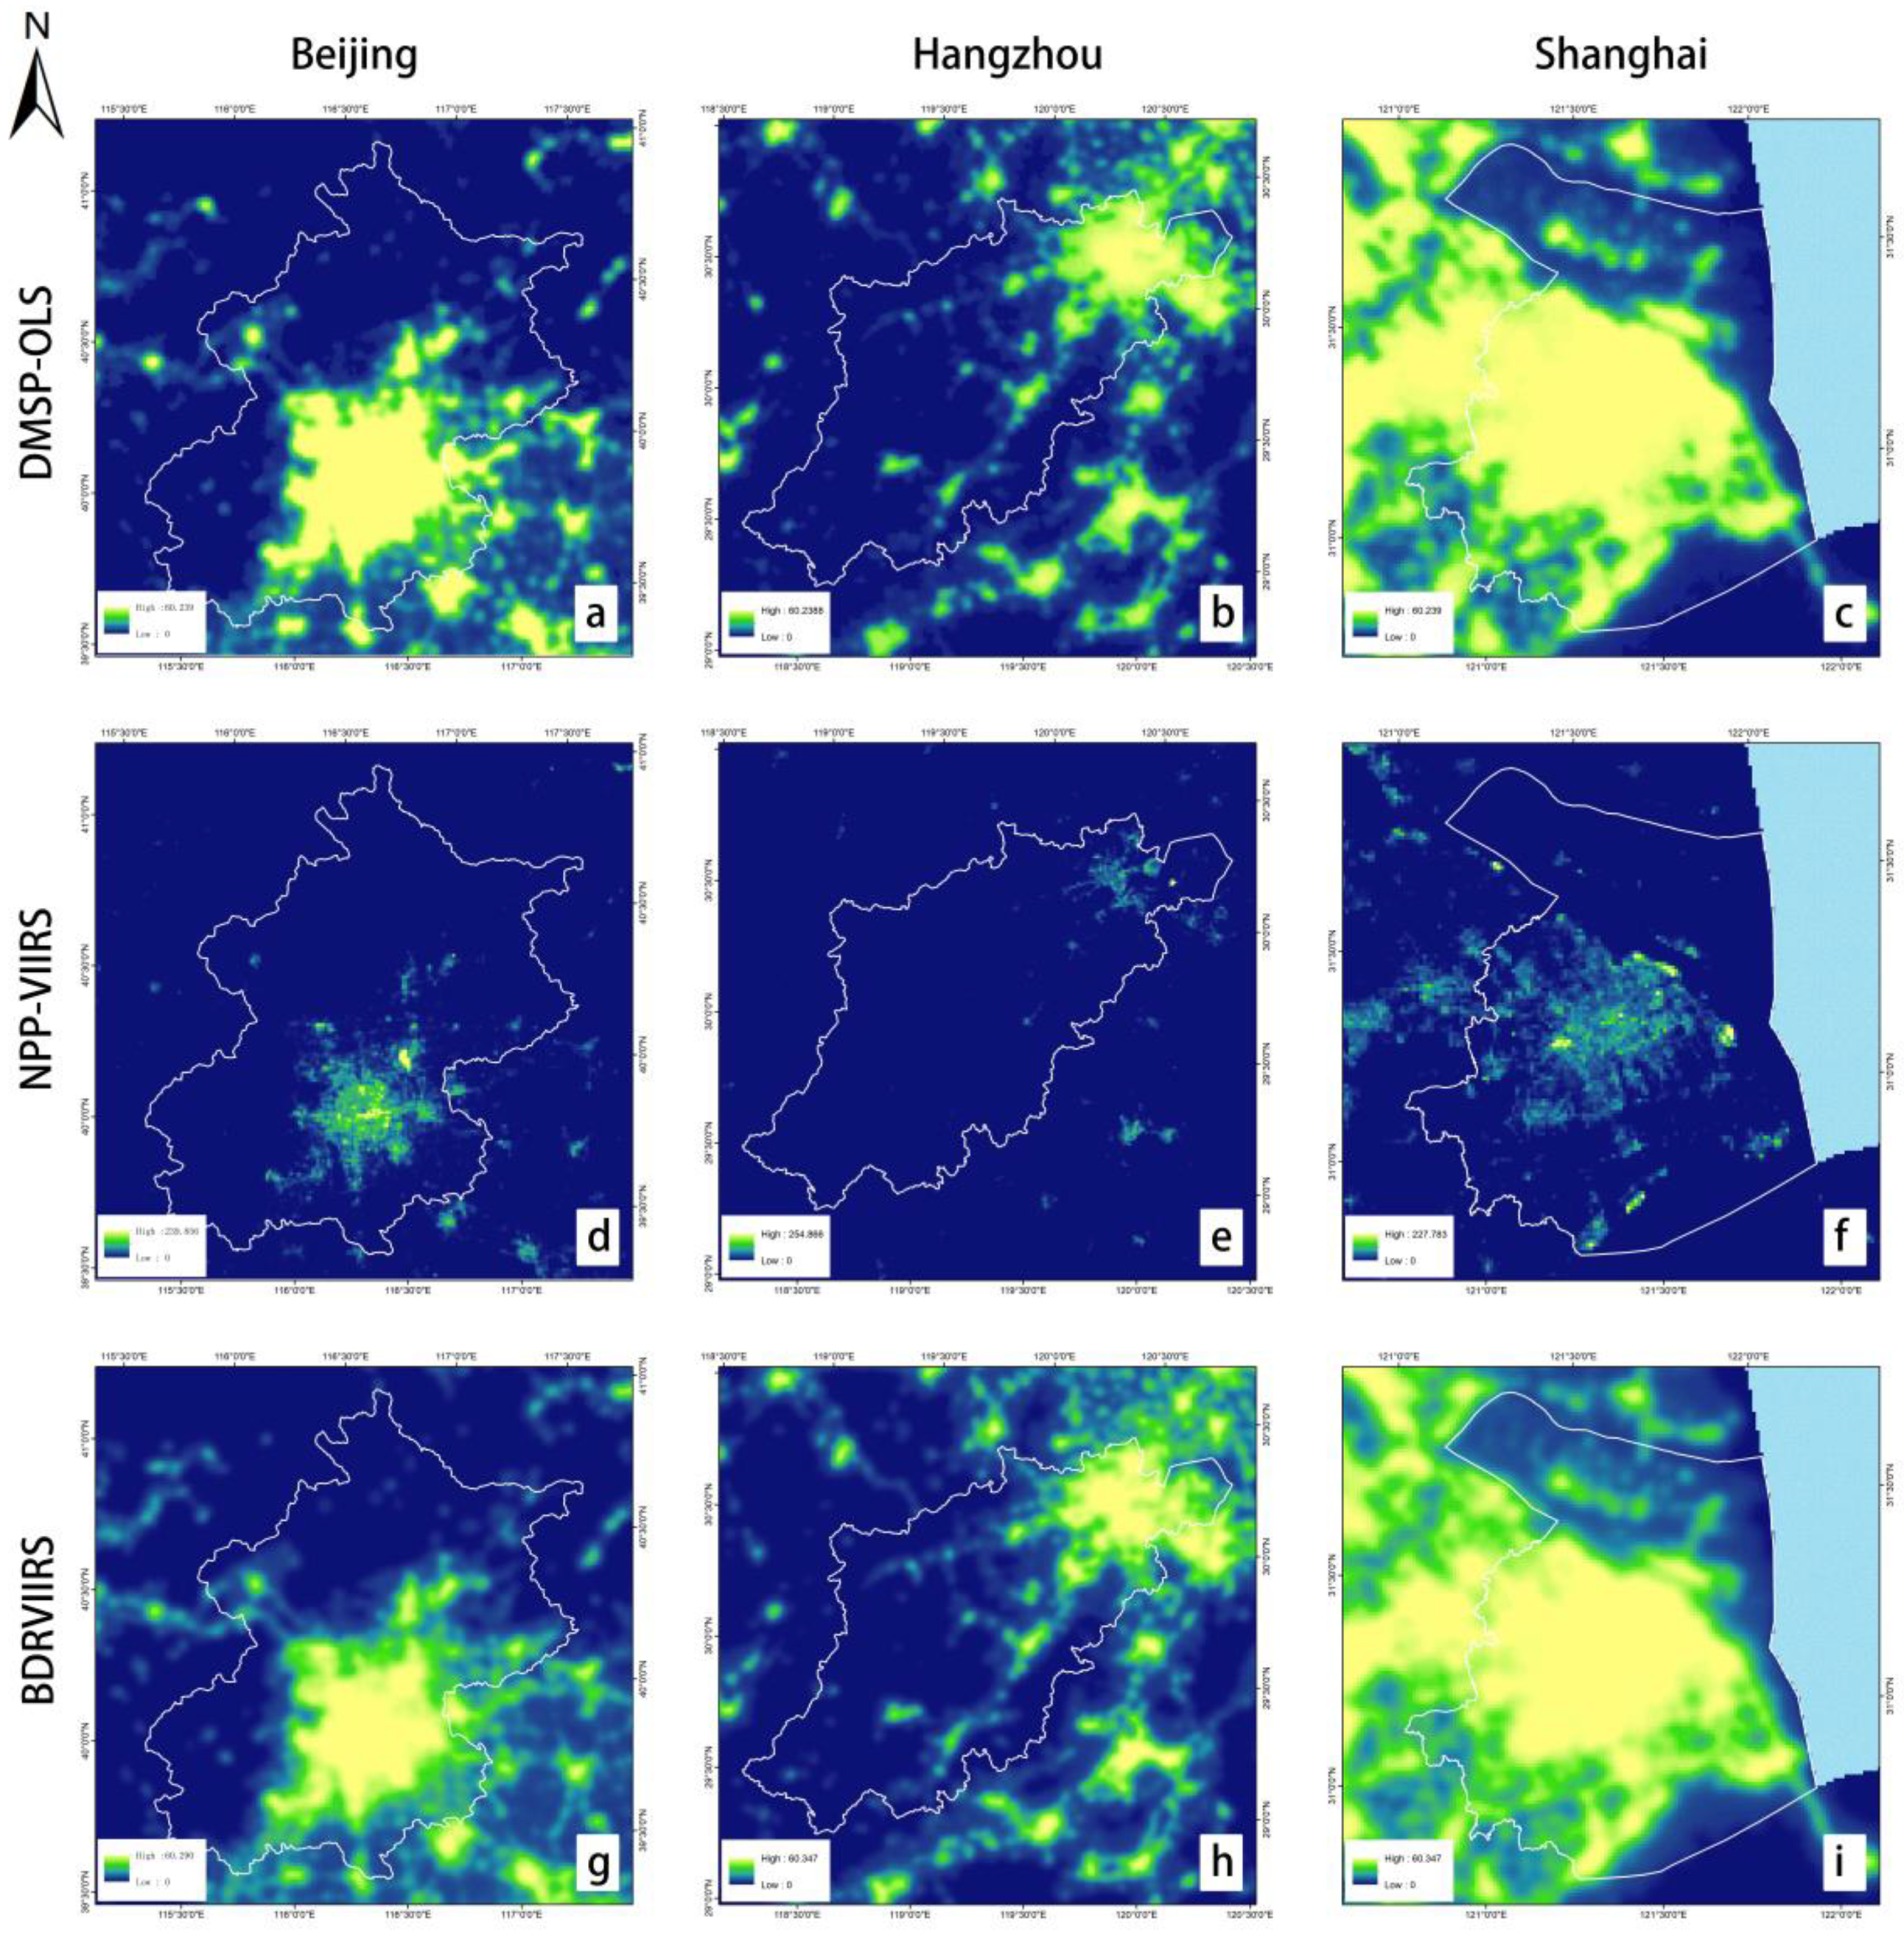
After the nationwide calibration, Beijing, Shanghai, and Hangzhou were selected to conduct a detailed evaluation. Figure 8 presents images of DMSP-OLS, NPP-VIIRS, and BDRVIIRS in the three cities. DMSP-OLS images show urban centers, intercity roads, and suburbs simultaneously. However, the original NPP-VIIRS images only show urban centers, different from DMSP-OLS. Through the inter-calibration, BDRVIIRS images can show urban centers, intercity roads and suburbs simultaneously just like DMSP-OLS images. Therefore, it is concluded that the inter-calibration makes image textures of BDRVIIRS data more similar to that of DMSP-OLS data.
5.2. Evaluating Transect
Figure 9 shows the transects of NTL data of the three cities. It is obvious that all of the transects in the areas far away from urban centers are low and elevated toward urban centers. When the transects pass through water body, the brightness suddenly decreases. By comparing NPP-VIIRS transects with DMSP-OLS transects, it can be found that there is a significant difference between the two, although both are based on the same spatial resolution. There are many dramatic variations in NPP-VIIRS transects, parts of which are towering peaks of brightness, while some other parts are narrow valleys. Furthermore, the variations from peaks to valleys are almost vertical. However, in DMSP-OLS data, the transects are much smoother due to the overglow effect. Similarly, the BDRVIIRS transects are also smoother than the original NPP-VIIRS transects due to the Gaussian low pass filter. Overall, BDRVIIRS transects and the DMSP-OLS transects are similar to each other.
Besides, there are some other details worth noting. The changes in human activities during this period lead to the variations in brightness in some areas because of the difference in overpass time. Therefore, the transects of DMSP-OLS and BDRVIIRS are not exactly coincident. In addition, a saturation effect exists in DMSP-OLS data, while there is no saturation effect in the BDRVIIRS data. Accordingly, BDRVIIRS transects show more details than DMSP-OLS transects in the urban centers. Meanwhile, this also indicates that the underestimation of BDRVIIRS exists in areas where DMSP-OLS data are saturated.
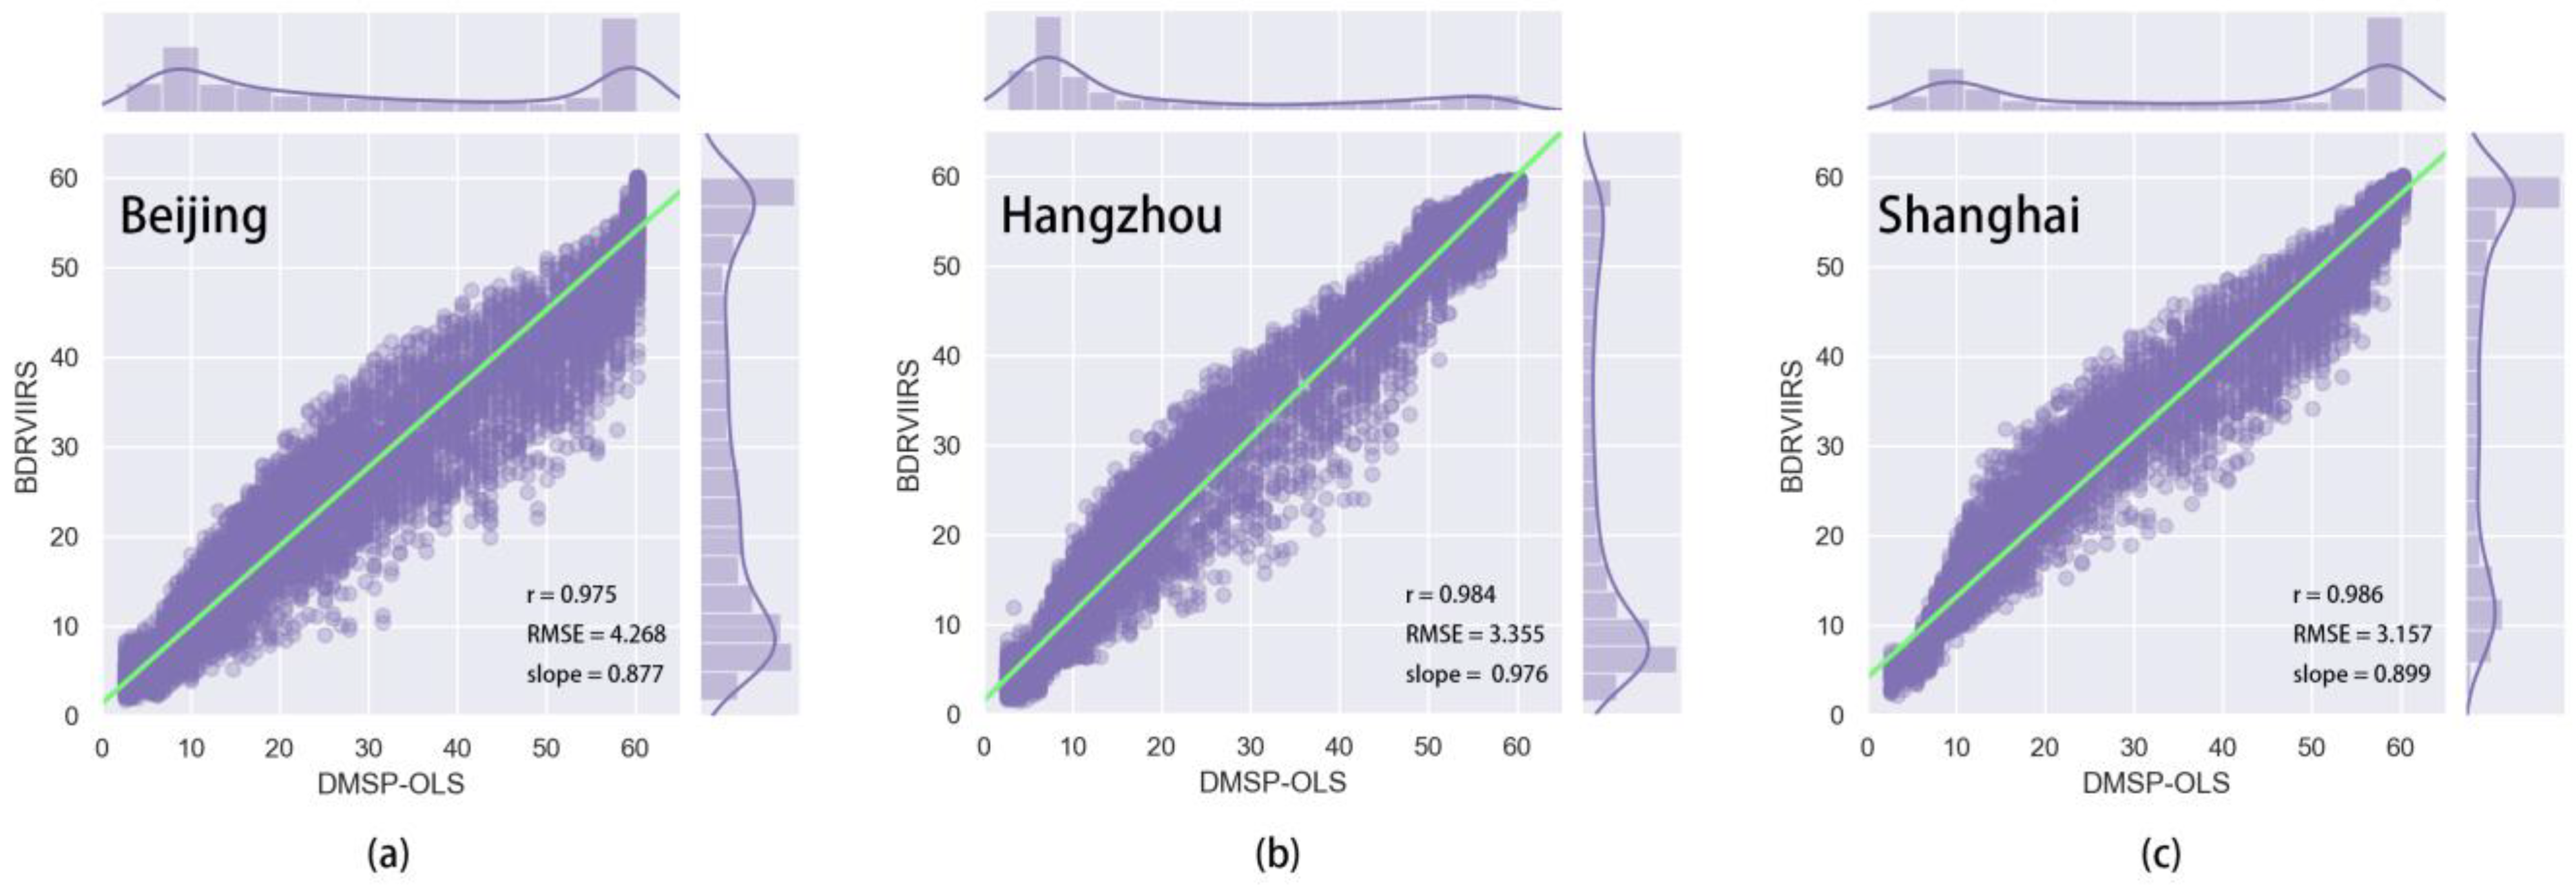
5.3. Evaluating Pixel Relationship
Figure 10 shows the scatter plots and the histograms of DMSP-OLS and BDRVIIRS of the three cities. These scatter plots indicate a strong correlation between DMSP-OLS and BDRVIIRS. The regression analysis illustrates that the correlation coefficients of these scatter plots are greater than 0.97, RMSE are less than 4.30, and the slopes of the regression lines are close to 1. In addition, the histograms of BDRVIIRS and DMSP-OLS are consistent. This means that the distribution of the brightness of BDRVIIRS and DMSP-OLS in the dynamic range is consistent. All of these indicate that the consistency between BDRVIIRS and DMSP-OLS is strong.
5.4. Comparison with Related Works
Several studies have attempted to make the inter-calibration between DMSP-OLS and NPP-VIIRS. Table 4 shows the comparison with previous works. The differences of these studies are mainly reflected in the data characteristics and calibration functions. In terms of data characteristics, early researches used daily and monthly data [21,25], but those methods cannot be applied on annual data, so the subsequent studies focused on annual data. In terms of calibration function, according to available information, the BiDoseResp function in this study performs best, whose is 0.967 and RMSE is 1.75. In addition, the method that is proposed in this study has significant advantages in applicable scope, accuracy, and efficiency.
One of the major advantages is applicable scope, including spatial area, dynamic range, and time range. First, in spatial area, most of the studies are based on administrative units as research areas. Li et al. [25] and Jeswani [22] selected Syria and India as research areas, respectively, while recent studies narrow the research areas and focus on cities for better performance. However, the research area of this study is larger than that of previous researches. Accordingly, this method is more suitable for promotion in larger areas. Secondly, the dynamic range of these studies is incomplete [21,25,26]. In contrast, this study’s dynamic range is 0–63. Third, previous studies have not fully exploited the potential of historical NTL archiving, as described in the recent review [20]. Instead, our method, combined with Elvidge’s one [35], can maximize the time range of the annual NTL sequence. Finally, the annual NTL sequence of China was produced from 1992 to 2018. Hence, this study is excellent in spatial area, dynamic range, and time range.
Another advantage lies in accuracy. To make a comparison with Wu et al. [26] and Zheng et al. [27], the calibrated NTL in the same areas was extracted. With the help of available information, it is found that the and RMSE in this study are both superior to the studies of Li et al. [25] and Wu et al. [26]. In addition, values of Zheng et al. [27] in Hangzhou and Beijing (0.993 and 0.995) are slightly higher than the values (0.983 and 0.975) of this study in the corresponding regions. While their value in Shanghai (0.966) is lower than 0.986 of this study. Therefore, the accuracy of this study is superior to Li et al. [25] and Wu et al. [26], and close to Zheng et al. [27].
This study is better not only in applicable scope and accuracy, but also in efficiency. First, the method that was proposed by Zheng et al. [27] requires input data to undergo a complex preprocessing, while the preprocessing of this study is much simpler. Secondly, the functions used in Zheng’s [27] and Wu’s [26] methods are just suitable for city-level applications. What is more, these functions need to be reconstructed when they are shifted to other areas. On the contrary, this method can achieve one-time calibration at the country level or even global, and then, the comparison between multiple cities can be carried out directly. Therefore, the method of this study is simpler and more efficient.
When compared with the existing studies, this one has produced the calibrated NTL sequence with the vastest research area, longest time range, and complete dynamic range. In addition, the evaluation indicators show that the calibration has high accuracy. Therefore, this method is efficient and worth promoting. The products can be used as extended DMSP-OLS data.
6. Conclusions
In this study, a new inter-calibration method was designed to improve the consistency between NPP-VIIRS and DMSP-OLS. The core of this method is the BiDoseResp model. Its coefficient of determination reaches 0.967, and residual sum of squares is , less than of Logistic function. Subsequently, the Gaussian low pass filter with the optimal parameters promoted the consistency further. After that, the correlation coefficient between DMSP-OLS and BDRVIIRS of the whole China region reaches 0.949. Taking the results of Beijing, Hangzhou, and Shanghai for a detailed analysis, it is found that the results perform well in image feature, transect, and pixel relationship. Finally, the consistent NTL sequence of China from 1992 to 2018 is generated. The result shows that the NTL in China have increased continuously and significantly during this period.
Although the method that is proposed in this study is better in many ways, there are also some limitations. First, the NPP-VIIRS data were aggregated temporally and spatially according to the DMSP-OLS data, which caused the NPP-VIIRS data to lose their finer temporal and spatial resolution. Secondly, the overglow effect of NTL data makes the areas around the light sources also recorded as bright pixels, which makes it larger than the actual light source area. However, as compared with the NTL data of single sensor, the integrated NTL sequence can promote the mining of richer and deeper information about human settlement.
It is expected that this method can facilitate the development of researches on NTL and that more novel information can be mined out. For example, the BDRVIIRS data would not be completely consistent with the DMSP-OLS data due to the difference in overpass time. The inconsistency indicates the changes in NTL on the ground (enhancement or dimming). Therefore, the way forward could be analyzing the changes in NTL during this period to reveal human activities further. In addition, future directions also include the development of a calibration method from DMSP-OLS to NPP-VIIRS, which is expected to generate a consistent NTL dataset that is characterized by higher quality.
Author Contributions
Conceptualization, J.M.; methodology, J.M. and J.G.; software, J.G.; validation, Z.L. and J.H.; formal analysis, J.G.; investigation, J.G.; resources, J.M.; data curation, J.G.; writing—original draft preparation, J.G.; writing—review and editing, S.A. and J.M.; visualization, J.G.; supervision, J.M. All authors have read and agreed to the published version of the manuscript.
Funding
This study is supported by the National Natural Science Foundation of China (Grant No. 41671352), the top-notch university academically funded projects (gxbjZD06) and the K. C. Wong Education Foundation (GJTD-2018-15).
Acknowledgments
The authors are really grateful to the editor and the anonymous reviewers for their profound insights and helpful comments. The authors are also grateful to Earth Observation Group of NOAA which provides NTL data.
Conflicts of Interest
The authors declare no conflict of interest.
References
- Chen, X.; Nordhaus, W.D. Using luminosity data as a proxy for economic statistics. Proc. Natl. Acad. Sci. USA 2011, 108, 8589. [Google Scholar] [CrossRef] [PubMed] [Green Version]
- Yu, B.; Deng, S.; Liu, G.; Yang, C.; Chen, Z.; Hill, C.J.; Wu, J. Nighttime Light Images Reveal Spatial-Temporal Dynamics of Global Anthropogenic Resources Accumulation above Ground. Environ. Sci. Technol. 2018, 52, 11520–11527. [Google Scholar] [CrossRef] [PubMed] [Green Version]
- Zhuo, L.; Ichinose, T.; Zheng, J.; Chen, J.; Shi, P.J.; Li, X. Modelling the population density of China at the pixel level based on DMSP/OLS non-radiance-calibrated night-time light images. Int. J. Remote Sens. 2009, 30, 1003–1018. [Google Scholar] [CrossRef]
- Chen, Z.; Yu, B.; Song, W.; Liu, H.; Wu, Q.; Shi, K.; Wu, J. A New Approach for Detecting Urban Centers and Their Spatial Structure with Nighttime Light Remote Sensing. IEEE Trans. Geosci. Remote Sens. 2017, 55, 6305–6319. [Google Scholar] [CrossRef]
- Chen, X.; Jia, X.; Pickering, M. A Nighttime Lights Adjusted Impervious Surface Index (NAISI) with Integration of Landsat Imagery and Nighttime Lights Data from International Space Station. Int. J. Appl. Earth Obs. Geoinf. 2019, 83, 101889. [Google Scholar] [CrossRef]
- Ou, J.; Liu, X.; Liu, P.; Liu, X. Evaluation of Luojia 1-01 nighttime light imagery for impervious surface detection: A comparison with NPP-VIIRS nighttime light data. Int. J. Appl. Earth Obs. Geoinf. 2019, 81, 1–12. [Google Scholar] [CrossRef]
- Zheng, Q.; Jiang, R.; Wang, K.; Huang, L.; Ye, Z.; Gan, M.; Ji, B. Monitoring the trajectory of urban nighttime light hotspots using a Gaussian volume model. Int. J. Appl. Earth Obs. Geoinf. 2018, 65, 24–34. [Google Scholar] [CrossRef]
- Amaral, S.; Câmara, G.; Monteiro, A.M.V.; Quintanilha, J.A.; Elvidge, C.D. Estimating population and energy consumption in Brazilian Amazonia using DMSP night-time satellite data. Comput. Environ. Urban Syst. 2005, 29, 179–195. [Google Scholar] [CrossRef]
- Cao, X.; Wang, J.; Chen, J.; Shi, F. Spatialization of electricity consumption of China using saturation-corrected DMSP-OLS data. Int. J. Appl. Earth Obs. Geoinf. 2014, 28, 193–200. [Google Scholar] [CrossRef]
- Liu, X.; Ou, J.; Wang, S.; Li, X.; Yan, Y.; Jiao, L.; Liu, Y. Estimating spatiotemporal variations of city-level energy-related CO2 emissions: An improved disaggregating model based on vegetation adjusted nighttime light data. J. Clean. Prod. 2018, 177, 101–114. [Google Scholar] [CrossRef]
- Shi, K.; Yu, B.; Zhou, Y.; Chen, Y.; Yang, C.; Chen, Z.; Wu, J. Spatiotemporal variations of CO2 emissions and their impact factors in China: A comparative analysis between the provincial and prefectural levels. Appl. Energy 2019, 233–234, 170–181. [Google Scholar] [CrossRef]
- Katz, Y.; Levin, N. Quantifying urban light pollution—A comparison between field measurements and EROS-B imagery. Remote Sens. Environ. 2016, 177, 65–77. [Google Scholar] [CrossRef]
- Xiang, W.; Tan, M. Changes in Light Pollution and the Causing Factors in China’s Protected Areas, 1992–2012. Remote Sens. 2017, 9, 1026. [Google Scholar] [CrossRef] [Green Version]
- Xu, P.; Wang, Q.; Jin, J.; Jin, P. An increase in nighttime light detected for protected areas in mainland China based on VIIRS DNB data. Ecol. Indic. 2019, 107, 105615. [Google Scholar] [CrossRef]
- Abrahams, A.; Oram, C.; Lozano-Gracia, N. Deblurring DMSP nighttime lights: A new method using Gaussian filters and frequencies of illumination. Remote Sens. Environ. 2018, 210, 242–258. [Google Scholar] [CrossRef]
- Hao, R.; Yu, D.; Sun, Y.; Cao, Q.; Liu, Y.; Liu, Y. Integrating Multiple Source Data to Enhance Variation and Weaken the Blooming Effect of DMSP-OLS Light. Remote Sens. 2015, 7, 1422–1440. [Google Scholar] [CrossRef] [Green Version]
- Zhou, Y.; Smith, S.J.; Elvidge, C.D.; Zhao, K.; Thomson, A.; Imhoff, M. A cluster-based method to map urban area from DMSP/OLS nightlights. Remote Sens. Environ. 2014, 147, 173–185. [Google Scholar] [CrossRef]
- Bennett, M.M.; Smith, L.C. Advances in using multitemporal night-time lights satellite imagery to detect, estimate, and monitor socioeconomic dynamics. Remote Sens. Environ. 2017, 192, 176–197. [Google Scholar] [CrossRef]
- Li, X.; Elvidge, C.; Zhou, Y.; Cao, C.; Warner, T. Remote sensing of night-time light. Int. J. Remote Sens. 2017, 38, 5855–5859. [Google Scholar] [CrossRef] [Green Version]
- Zhao, M.; Zhou, Y.; Li, X.; Cao, W.; He, C.; Yu, B.; Li, X.; Elvidge, D.C.; Cheng, W.; Zhou, C. Applications of Satellite Remote Sensing of Nighttime Light Observations: Advances, Challenges, and Perspectives. Remote Sens. 2019, 11, 1971. [Google Scholar] [CrossRef] [Green Version]
- Shao, X.; Cao, C.; Zhang, B.; Qiu, S.; Elvidge, C.; Von Hendy, M. Radiometric calibration of DMSP-OLS sensor using VIIRS day/night band. SPIE 2014, 9264, 92640A. [Google Scholar]
- Jeswani, R. Evaluation of the consistency of DMSP-OLS and SNPP-VIIRS Night-time Light Datasets. J. Geomat. 2019, 13, 98–105. [Google Scholar]
- Imhoff, M.L.; Lawrence, W.T.; Stutzer, D.C.; Elvidge, C.D. A technique for using composite DMSP/OLS “City Lights” satellite data to map urban area. Remote Sens. Environ. 1997, 61, 361–370. [Google Scholar] [CrossRef]
- Small, C.; Pozzi, F.; Elvidge, C.D. Spatial analysis of global urban extent from DMSP-OLS night lights. Remote Sens. Environ. 2005, 96, 277–291. [Google Scholar] [CrossRef]
- Li, X.; Li, D.; Xu, H.; Wu, C. Intercalibration between DMSP/OLS and VIIRS night-time light images to evaluate city light dynamics of Syria’s major human settlement during Syrian Civil War. Int. J. Remote Sens. 2017, 38, 5934–5951. [Google Scholar] [CrossRef]
- Wu, K.; Wang, X. Aligning Pixel Values of DMSP and VIIRS Nighttime Light Images to Evaluate Urban Dynamics. Remote Sens. 2019, 11, 1463. [Google Scholar] [CrossRef] [Green Version]
- Zheng, Q.; Weng, Q.; Wang, K. Developing a new cross-sensor calibration model for DMSP-OLS and Suomi-NPP VIIRS night-light imageries. ISPRS J. Photogramm. Remote Sens. 2019, 153, 36–47. [Google Scholar] [CrossRef]
- Liu, L.; Leung, Y. A study of urban expansion of prefectural-level cities in South China using night-time light images. Int. J. Remote Sens. 2015, 36, 5557–5575. [Google Scholar] [CrossRef]
- Zhou, Y.; Li, X.; Asrar, G.R.; Smith, S.J.; Imhoff, M. A global record of annual urban dynamics (1992–2013) from nighttime lights. Remote Sens. Environ. 2018, 219, 206–220. [Google Scholar] [CrossRef]
- Xiao, P.; Wang, X.; Feng, X.; Zhang, X.; Yang, Y. Detecting China’s Urban Expansion over the Past Three Decades Using Nighttime Light Data. IEEE J. Sel. Top. Appl. Earth Obs. Remote Sens. 2014, 7, 4095–4106. [Google Scholar] [CrossRef]
- Elvidge, D.C.; E Baugh, K.; Zhizhin, M.; Hsu, F.C. Why VIIRS data are superior to DMSP for mapping nighttime lights. Asia Pac. Adv. Netw. 2013, 35, 62–69. [Google Scholar] [CrossRef] [Green Version]
- Seaman, C. Beginner’s Guide to VIIRS Imagery Data. Available online: http://129.82.109.125/projects/npp/Beginner_Guide_to_VIIRS_Imagery_Data.pdf (accessed on 26 January 2020).
- Miller, D.S.; Straka, W.; Mills, P.S.; Elvidge, D.C.; Lee, F.T.; Solbrig, J.; Walther, A.; Heidinger, K.A.; Weiss, C.S. Illuminating the Capabilities of the Suomi National Polar-Orbiting Partnership (NPP) Visible Infrared Imaging Radiometer Suite (VIIRS) Day/Night Band. Remote Sens. 2013, 5, 6717–6766. [Google Scholar] [CrossRef] [Green Version]
- Li, X.; Xu, H.; Chen, X.; Li, C. Potential of NPP-VIIRS Nighttime Light Imagery for Modeling the Regional Economy of China. Remote Sens. 2013, 5, 3057–3081. [Google Scholar] [CrossRef] [Green Version]
- Elvidge, D.C.; Ziskin, D.; Baugh, E.K.; Tuttle, T.B.; Ghosh, T.; Pack, W.D.; Erwin, H.E.; Zhizhin, M. A Fifteen Year Record of Global Natural Gas Flaring Derived from Satellite Data. Energies 2009, 2, 595–622. [Google Scholar] [CrossRef]
- Cao, C.; Uprety, S.; Xiong, J.; Wu, A.; Jing, P.; Smith, D.; Chander, G.; Fox, N.; Ungar, S. Establishing the Antarctic Dome C community reference standard site towards consistent measurements from Earth observation satellites. Can. J. Remote Sens. 2010, 36, 498–513. [Google Scholar] [CrossRef]
- Datla, R.; Shao, X.; Cao, C.; Wu, X. Comparison of the Calibration Algorithms and SI Traceability of MODIS, VIIRS, GOES, and GOES-R ABI Sensors. Remote Sens. 2016, 8, 126. [Google Scholar] [CrossRef] [Green Version]
- Wu, X.; Weinreb, M.; Chang, I.; Crosby, D.; Dean, C.; Sun, F.; Han, D. Calibration of GOES Imager Visible Channels. In Proceedings of the 2005 IEEE International Geoscience and Remote Sensing Symposium. IGARSS, Seoul, Korea, 25–29 July 2005; pp. 3432–3435. [Google Scholar]
- Small, C.; Elvidge, C.D.; Baugh, K. Mapping Urban Structsure and Spatial Connectivity with VIIRS and OLS Night Light Imagery. In Proceedings of the Joint Urban Remote Sensing Event, Sao Paulo, Brazil, 21–23 April 2013; pp. 230–233. [Google Scholar]
- Motulsky, H.; Christopoulos, A. Fitting Models to Biological Data Using Linear and Nonlinear Regression: A Practical Guide to Curve Fitting; Oxford University Press: New York, NY, USA, 2004. [Google Scholar]
Figure 1.
Flowchart of the study.

Figure 2.
Distribution of the vicarious site.

Figure 3.
Scatter plot of the original NPP-VIIRS and DMSP-OLS pixel pairs in the vicarious site (a); scatter plot of the logarithmically transformed VIIRS and DMSP-OLS pixel pairs in the vicarious site (b); and, yellow curve denotes the fitted BiDoseResp model.
Figure 3.
Scatter plot of the original NPP-VIIRS and DMSP-OLS pixel pairs in the vicarious site (a); scatter plot of the logarithmically transformed VIIRS and DMSP-OLS pixel pairs in the vicarious site (b); and, yellow curve denotes the fitted BiDoseResp model.

Figure 4.
Surface represents the different residual sum of square (RSS) between BiDoseResp-calibrated VIIRS (BDRVIIRS) and DMSP-OLS. Blue line represents the RSS with a normal-distributional filter (σ = 1). Point a represents the RSS without a filter. Point b represents the lowest point of the surface, where σ is 1.51 and w is 15.

Figure 5.
Scatter density plot of DMSP-OLS and unsmoothed BDRVIIRS in the whole China region (a), which corresponds to Point a in Figure 4. Scatter density plot of DMSP-OLS and smoothed BDRVIIRS undergoing a Gaussian low pass filter (σ = 1.51, w=15) (b), which corresponds to Point b in Figure 4.

Figure 6.
Total light value (TLV) of non-calibrated nighttime light (NTL) data across China (a) and that of calibrated NTL data (b).
Figure 6.
Total light value (TLV) of non-calibrated nighttime light (NTL) data across China (a) and that of calibrated NTL data (b).

Figure 7.
NTL images of China in some of years.

Figure 8.
DMSP-OLS images in the cities of Beijing, Hangzhou and Shanghai (a, b, and c); NPP-VIIRS images in the three cities (d, e, and f); BDRVIIRS images of the three cities (g, h, and i).
Figure 8.
DMSP-OLS images in the cities of Beijing, Hangzhou and Shanghai (a, b, and c); NPP-VIIRS images in the three cities (d, e, and f); BDRVIIRS images of the three cities (g, h, and i).

Figure 9.
Google Earth images and transects in Beijing (a), Hangzhou (b), Shanghai (c). Yellow curves represent the transects of BDRVIIRS data, green ones represent the transects of NPP-VIIRS data, and blue ones are representing the transects of DMSP-OLS data.
Figure 9.
Google Earth images and transects in Beijing (a), Hangzhou (b), Shanghai (c). Yellow curves represent the transects of BDRVIIRS data, green ones represent the transects of NPP-VIIRS data, and blue ones are representing the transects of DMSP-OLS data.

Figure 10.
Histogram, scatterplots and linear fit lines of DMSP-OLS data and BDRVIIRS data of the three cities in 2013 (a, b and c).
Figure 10.
Histogram, scatterplots and linear fit lines of DMSP-OLS data and BDRVIIRS data of the three cities in 2013 (a, b and c).


Table 1.
Properties of Defense Meteorological Satellite Program’s Operational Linescan System (DMSP-OLS) and National Polar-orbiting Partnership Satellite’s Visible Infrared Imaging Radiometer Suite (NPP-VIIRS).
Table 1.
Properties of Defense Meteorological Satellite Program’s Operational Linescan System (DMSP-OLS) and National Polar-orbiting Partnership Satellite’s Visible Infrared Imaging Radiometer Suite (NPP-VIIRS).
| Sensors of NTL | DMSP-OLS | NPP-VIIRS DNB |
|---|---|---|
| Data Spatial Resolution | 30 arc second | 15 arc second |
| Data Temporary Resolution | Annual | Monthly |
| Available Time Interval | 1992–2013 | April 2012–Present |
| Overpass time | Between 19:30 and 21:30 | 1:30 |
| Quantization ability in A/D | 6bit | 14 bits for HGS; 13 bits for MGS and LGS |
| Unit | Unitless DN | |
| On-board Calibration | Unequipped | Equipped |
Table 2.
Candidate models.
| Model | RSS | |
|---|---|---|
| BiDoseResp | 0.967 | |
| Logistic | 0.967 | |
| Linear | 0.847 | |
| Power | - | - |
Table 3.
The parameters of BiDoseResp function.
| 4.56804 | 61.02992 | 0.37684 | 0.40853 | 0.93649 | 2.3558 | 0.30823 |
Table 4.
Available information about the related works.
| Related Works | |||||||||||||
|---|---|---|---|---|---|---|---|---|---|---|---|---|---|
| Shao et al. (2014) | Li et al. (2017) | JESWANI (2017) | Wu et al. (2019) | Zheng et al. (2019) | This Work | ||||||||
| Data characteristics | Daily, not free | Monthly, not free | Annual, free | Annual, free | annual, free | annual, free | |||||||
| Calibration function | Function name | Linear function | Power function & Convolution | Logarithm & linear function | Power function & Convolution | GWRc | BiDoseResp & Convolution | ||||||
| - | - | 0.775 | - | - | - | - | - | 0.967 | |||||
| RMSE | 4.05 | - | - | - | - | 6.36 | - | - | 1.75 | ||||
| Research area | Name | Dome C | Syrian | India | Beijing | Yiwu | Hangzhou | Beijing | Shanghai | China | |||
| Level | Point | Country | Country | City | City | City | City | City | Country | ||||
| Dynamic range | 10–31 | 0–50 | 0–63 | 0–50 | no upper limit | 0–63 | |||||||
| Evaluation index of result | r | - | 0.9158 | - | 0.945 | 0.963 | 0.993 | 0.995 | 0.966 | Beijing | Yiwu | Hangzhou | Shanghai |
| 0.975 | 0.98 | 0.983 | 0.986 | ||||||||||
| RMSE | - | 4.9967 | - | 9.387 | 7.687 | - | - | - | Beijing | Yiwu | Hangzhou | Shanghai | |
| 4.268 | 3.649 | 3.356 | 3.157 | ||||||||||
| Simplicity of algorithm | Simple | Simple | Simple | Simple | Complex | Simple | |||||||
| Product | Limited application range | The calibrated monthly NTL of Syrian from March 2011 to January 2017 | The calibrated NTL of India in 2013 | The calibrated annual NTL of Beijing and Yiwu from 1992 to 2018 | The calibrated annual NTL of Hangzhou, Beijing and Shanghai from 1996 to 2017 | The calibrated annual NTL of China from 1992 to 2018 | |||||||
© 2020 by the authors. Licensee MDPI, Basel, Switzerland. This article is an open access article distributed under the terms and conditions of the Creative Commons Attribution (CC BY) license (http://creativecommons.org/licenses/by/4.0/).
Share and Cite
MDPI and ACS Style
Ma, J.; Guo, J.; Ahmad, S.; Li, Z.; Hong, J. Constructing a New Inter-Calibration Method for DMSP-OLS and NPP-VIIRS Nighttime Light. Remote Sens. 2020, 12, 937. https://doi.org/10.3390/rs12060937
AMA Style
Ma J, Guo J, Ahmad S, Li Z, Hong J. Constructing a New Inter-Calibration Method for DMSP-OLS and NPP-VIIRS Nighttime Light. Remote Sensing. 2020; 12(6):937. https://doi.org/10.3390/rs12060937
Chicago/Turabian StyleMa, Jinji, Jinyu Guo, Safura Ahmad, Zhengqiang Li, and Jin Hong. 2020. "Constructing a New Inter-Calibration Method for DMSP-OLS and NPP-VIIRS Nighttime Light" Remote Sensing 12, no. 6: 937. https://doi.org/10.3390/rs12060937
Note that from the first issue of 2016, this journal uses article numbers instead of page numbers. See further details here.