Article

Estimating Artificial Impervious Surface Percentage in Asia by Fusing Multi-Temporal MODIS and VIIRS Nighttime Light Data

1
School of Geography, Geomatics and Planning, Jiangsu Normal University, Xuzhou 221116, China
2
Lancaster Environment Centre, Lancaster University, Lancaster LA1 4YQ, UK
3
UK Centre for Ecology & Hydrology, Library Avenue, Lancaster LA1 4AP, UK
4
State Key Laboratory of Desert and Oasis Ecology, Xinjiang Institute of Ecology and Geography, Chinese Academy of Sciences, Urumqi 830011, China
*
Author to whom correspondence should be addressed.
These authors contributed equally to this work.
Remote Sens. 2021, 13(2), 212; https://doi.org/10.3390/rs13020212
Submission received: 16 November 2020 / Revised: 6 January 2021 / Accepted: 7 January 2021 / Published: 9 January 2021

Abstract

:
Impervious surfaces have important effects on the natural environment, including promoting hydrological run-off and impeding evapotranspiration, as well as increasing the urban heat island effect. Obtaining accurate and timely information on the spatial distribution and dynamics of urban surfaces is, thus, of paramount importance for socio-economic analysis, urban planning, and environmental modeling and management. Previous studies have indicated that the fusion of multi-source remotely sensed imagery can increase the accuracy of prediction for impervious surface information across large areas. However, the majority of them are limited to the use of specific data sources to construct a few features with which it can be challenging to characterize adequately the variation in impervious surfaces over large areas. Thus, impervious surface maps are often presented with high uncertainty. In response to this problem, we proposed the use of multi-temporal MODIS and Visible Infrared Imaging Radiometer Suite (VIIRS) nighttime light data to construct a more general and robust feature set for large-area artificial impervious surface percentage (AISP) prediction. Three fusion methods were proposed for application to multi-temporal MODIS surface reflectance product (MOD09A1) and Visible Infrared Imaging Radiometer Suite (NPP-VIIRS) Day/Night Band (DNB) data to construct three different types of features: spectral features, index features (band calculations), and fusion features. These features were then used as variables in a random-forest-based AISP prediction model. The model was fitted to China and then applied to predict AISP across Asia. Fifteen typical cities from different regions of Asia were selected to assess the accuracy of the prediction model. The use of multi-temporal MODIS and VIIRS DNB data was found to significantly increase the accuracy of prediction for large-area AISP. The feature set constructed in this research was demonstrated to be suitable for large-area AISP prediction, and the random forest model based on optimization of the selected features achieved the highest accuracy, amongst benchmarks, with testing R2 of 0.690, and testing RMSE of 0.044 in 2018, respectively. In addition, to further test the performance of the proposed method, three existing impervious products (GAIA, HBASE, and NUACI) were used to compare quantitatively. The results showed that the predicted AISP achieved superior performance in comparison with others in some areas (e.g., arid areas and cloudy areas).

Graphical Abstract

1. Introduction

Urbanization and urban sprawl are commonly associated with the transition from natural vegetation, forest, bare soil, and agricultural land into urban land, which is characterized by artificial construction materials and impervious surfaces (e.g., concrete buildings, asphalt roads, and parking lots) [1]. The artificial impervious surface percentage (AISP) is an important indicator to quantify the level of urbanization and also a key factor that influences the socio-ecological environment [2,3]. However, the expansion of impervious surfaces can increase urban surface runoff and blocks evapotranspiration from vegetation and the soil, thus causing a wide range of ecological and environmental issues [4]. An increase in AISP can also lead to a change in the regional climate, decline in the quality of the watershed, and exacerbation of the urban heat island effect [5,6,7]. Therefore, accurately knowing the spatial distribution and dynamics of the AISP is crucial to solving these issues in urban-related research, such as urban planning, ecological and environmental conservation, and the assessment of human settlements [8,9,10]. Remote sensing technology provides an effective data source for timely acquisition of large-area impervious surface information. However, quickly and accurately extracting large-area impervious surface information based on remote sensing images is still a challenge.
Remote sensing-based inversion methods for predicting impervious surfaces have developed significantly over the past few decades. Early studies focused mostly on extracting impervious surface information at local or regional scales, using medium or fine spatial resolution images [11,12]. For instance, Landsat time-series data are often used to map the impervious surface change for analyzing the impacts of urbanization or urban expansion [13,14,15]. Moreover, these small-area data were used as an evidence base to support urban planning, socio-economic, and environmental management in specific cities or local administrations [16]. However, methods for large-area impervious surface extraction have not been well developed, partly due to data quality issues and the general utility of the impervious surface extraction methods [17]. Thus, accurate extraction of large-area AISP is urgent and necessary. The general approaches used for impervious surface extraction can be divided into four major categories: spectral mixture analysis, image classification, index thresholding, and regression models. Amongst them, the spectral mixture analysis method is a spectral decomposition method, which is applied widely for medium- or coarse-spatial-resolution satellite sensor images [18,19]. For a given urban scene, pixels are considered as a combination of various end element (member) features, and the impervious surface information can be obtained by unmixing the ratio of the different components within each pixel. Spectral mixture analysis can reduce the impact of mixed pixels effectively in impervious surface information extraction [20]. However, due to uncertainties in endmember selection [21] and the complexity of the urban environment, it is challenging to apply to the extraction of impervious surfaces over large areas [22,23]. Image classification methods can integrate multi-source and multi-platform remotely sensed data for decision fusion applied to impervious surfaces mapping [24], as adopted in the recent years [25]. However, the majority of image classification methods rely on supervised machine learning using training samples, which are difficult to obtain in sufficient quantities and effectively, especially for large-area applications [26]. The index threshold is used widely to map regional impervious surfaces due to its simplicity in operation [27]. However, there is no uniform criterion to choose a suitable segmentation threshold to extract the impervious surface from the background, and the method often involves trial-and-error procedures that are subject to user expertise [28]. Compared with the above methods, the regression model obtains the density distribution of the impervious surface by fitting a model to the relationship between the real AISP and the variables that can characterize the impervious surface information. It has the advantages of fast modeling, convenient operation and presenting high accuracy in model prediction [29]. Such regression-based models have been shown to be effective for extracting impervious surfaces on a regional or global scale [30,31]. The key is to select suitable variables from coarse-spatial-resolution images and high-quality impervious surface reference data from high or medium spatial resolution images [32]. The selection of a robust feature set that describes the characteristics of impervious surfaces and is not influenced by regional and seasonal changes is fundamental for extracting large-area impervious surface information [33]. Moreover, it is also crucial for the performance of model prediction and generalization to set strategies for model training appropriately [34,35].
In terms of data sources, medium- and coarse-spatial-resolution satellite sensor images (e.g., Landsat, MODIS) are currently used to extract large-area impervious surface information. For example, Landsat data with a spatial resolution of 30 m and Sentinel-2 data with a spatial resolution of 10 m [36,37] were used to extract land cover or impervious surface information. Gong et al. used Landsat time-series satellite sensor images and proposed the “Exclusion/Inclusion” algorithm to obtain information on impervious surface changes in China in the past 40 years [38]. Based on Landsat and night light data, Liu et al. constructed the normalized urban areas composite index (NUACI) for extracting impervious surface information globally. The results showed that the index can effectively extract impervious surface information [39]. Sun et al. used Sentinel-1 and Sentinel-2 data and a threshold-based method to extract national-scale impervious surface information effectively [40]. The medium-resolution data offer details of the artificial impervious surface but also suffer from data quality issues, such as cloud cover and image mosaic issues [41]. Moreover, spectral confusion exists commonly in medium-resolution images due to similarities in the spectral characteristics of different land cover types (bare soil and impervious surface). Therefore, it is challenging to extract large-area impervious surfaces that are continuous in space and time using medium-resolution images. MODIS products are considered as an important data source for large-area land surface information extraction including impervious surfaces. Yang et al. used the time-series MODIS NDVI product (MOD13Q1) to extract impervious surface information in Japan based on time-mixed analysis technology [42]. Recently, Nighttime light (NTL) data were applied widely for impervious surface information extraction since they are related closely to human activities and socioeconomic factors. Zhang et al. used multi-temporal DMSP/OLS nighttime light data for extracting urbanization dynamics over large areas [43]. NTL data provide a new perspective for discovering the distribution of impervious surface information, but they suffer from problems due to light saturation and overflow. In addition, it is difficult to represent the real situation in rural or poor areas, which can have a huge impact on the quality of large-area information extraction, particularly in developing countries. To overcome such drawbacks, some studies have attempted to reduce the effects of light saturation and overflow by fusing vegetation or heat-related information, such as fusing MODIS NDVI and Nighttime light data (DMSP/OLS). Zhang et al. constructed the vegetation-adjusted NTL urban index (VANUI) to extract impervious surface information [44]. Guo et al. used MODIS NDVI and DMSP-OLS data to develop normalized impervious surface index (NISI) for extracting impervious surface over China [45]. Zhou et al. used MODIS EVI and DMSP-OLS data to build an enhanced vegetation index (EVI)-adjusted NTL index (EANTLI) for extracting impervious surface areas [46]. Liu et al. developed LST and EVI regulated NTL city index (LERNCI) based on Visible Infrared Imaging Radiometer Suite (VIIRS) DNB, MODIS LST, and EVI for extracting impervious surface over large areas [47]. Hao et al. used MODIS vegetation, temperature product, and DMSP/OLS data to build a vegetation temperature light index for extracting impervious surface areas [48]. Recently, Small et al. found that multi-season spectral characteristics from Sentinel-2 with night light brightness from VIIRS show better spatial agreement, and the combination of them can quantify urban morphology. It provides an alternative idea for the integration of multi-season images and night lights [49,50]. These studies have demonstrated the effectiveness of using multi-source remotely sensed data, but the fusion method deserves further investigation. In addition, such methods are sensitive to the choice of threshold, and different empirical threshold settings can lead to various issues, such as the omission of small urban areas or incomplete removal of background noise.
As mentioned earlier, due to their familiarity, simple operation, and high accuracy, regression-based models are used widely for large-area impervious surface percentage prediction [51]. For example, Guo et al. designed a linear regression method to establish a large-area impervious surface prediction model based on Landsat, nighttime light, and MODIS NDVI data [52]. However, the simple linear model cannot effectively reflect the relationship between remote sensing information and impervious surface percentage. One effective way to solve this problem is to seek non-parametric machine learning methods with strong discriminative capability. The random forest algorithm has been applied widely in fitting classification and regression models thanks to its superior performance [53,54]. Compared with other parametric regression methods, the random forest model does not require normality and independence assumptions and does not need to consider the commonality of multiple variables [55]. At the same time, the random forest model can provide the importance score of the input feature variables, which is important for extracting and identifying robust features to represent the characteristics of impervious surfaces. In addition, it is also critical for modeling prediction by using appropriate methods to obtain a robust feature set. Anees et al. developed a robust non-parametric algorithm by using Landsat images for detecting land/forest cover changes [56]. Furthermore, the triply modulated cosine model and FIR (finite impulse response) were applied for detecting change by using MODIS time series data [57,58].
So far, most of the methods for large-area impervious surface extraction focused mainly on using single remote sensing data or combining multi-source data to construct a limited number of features. These specific features, however, cannot describe the impervious surface information fully and accurately in a large-area application [59,60]. This research, therefore, aims to close the gap in large-area impervious surface extraction by constructing the most representative and discriminative features by considering fully the complementarity of information within multi-source and multi-temporal data. Such a full set of features consists of spectral, index, and fusion features derived from multi-temporal MODIS and VIIRS DNB data. For this purpose, we used a minimum combination method to fuse multi-temporal MODIS data and then proposed a method to construct normalized index features using all spectral features of MODIS data. Finally, a fusion method was proposed to construct multi-resource fusion features. In this study, on the basis of lower spatial resolution data, we excavated feature variables that are suitable for large-area AISP prediction and developed a set of simple and general algorithms that can realize large-area AISP prediction quickly and accurately.

2. Materials and Methods
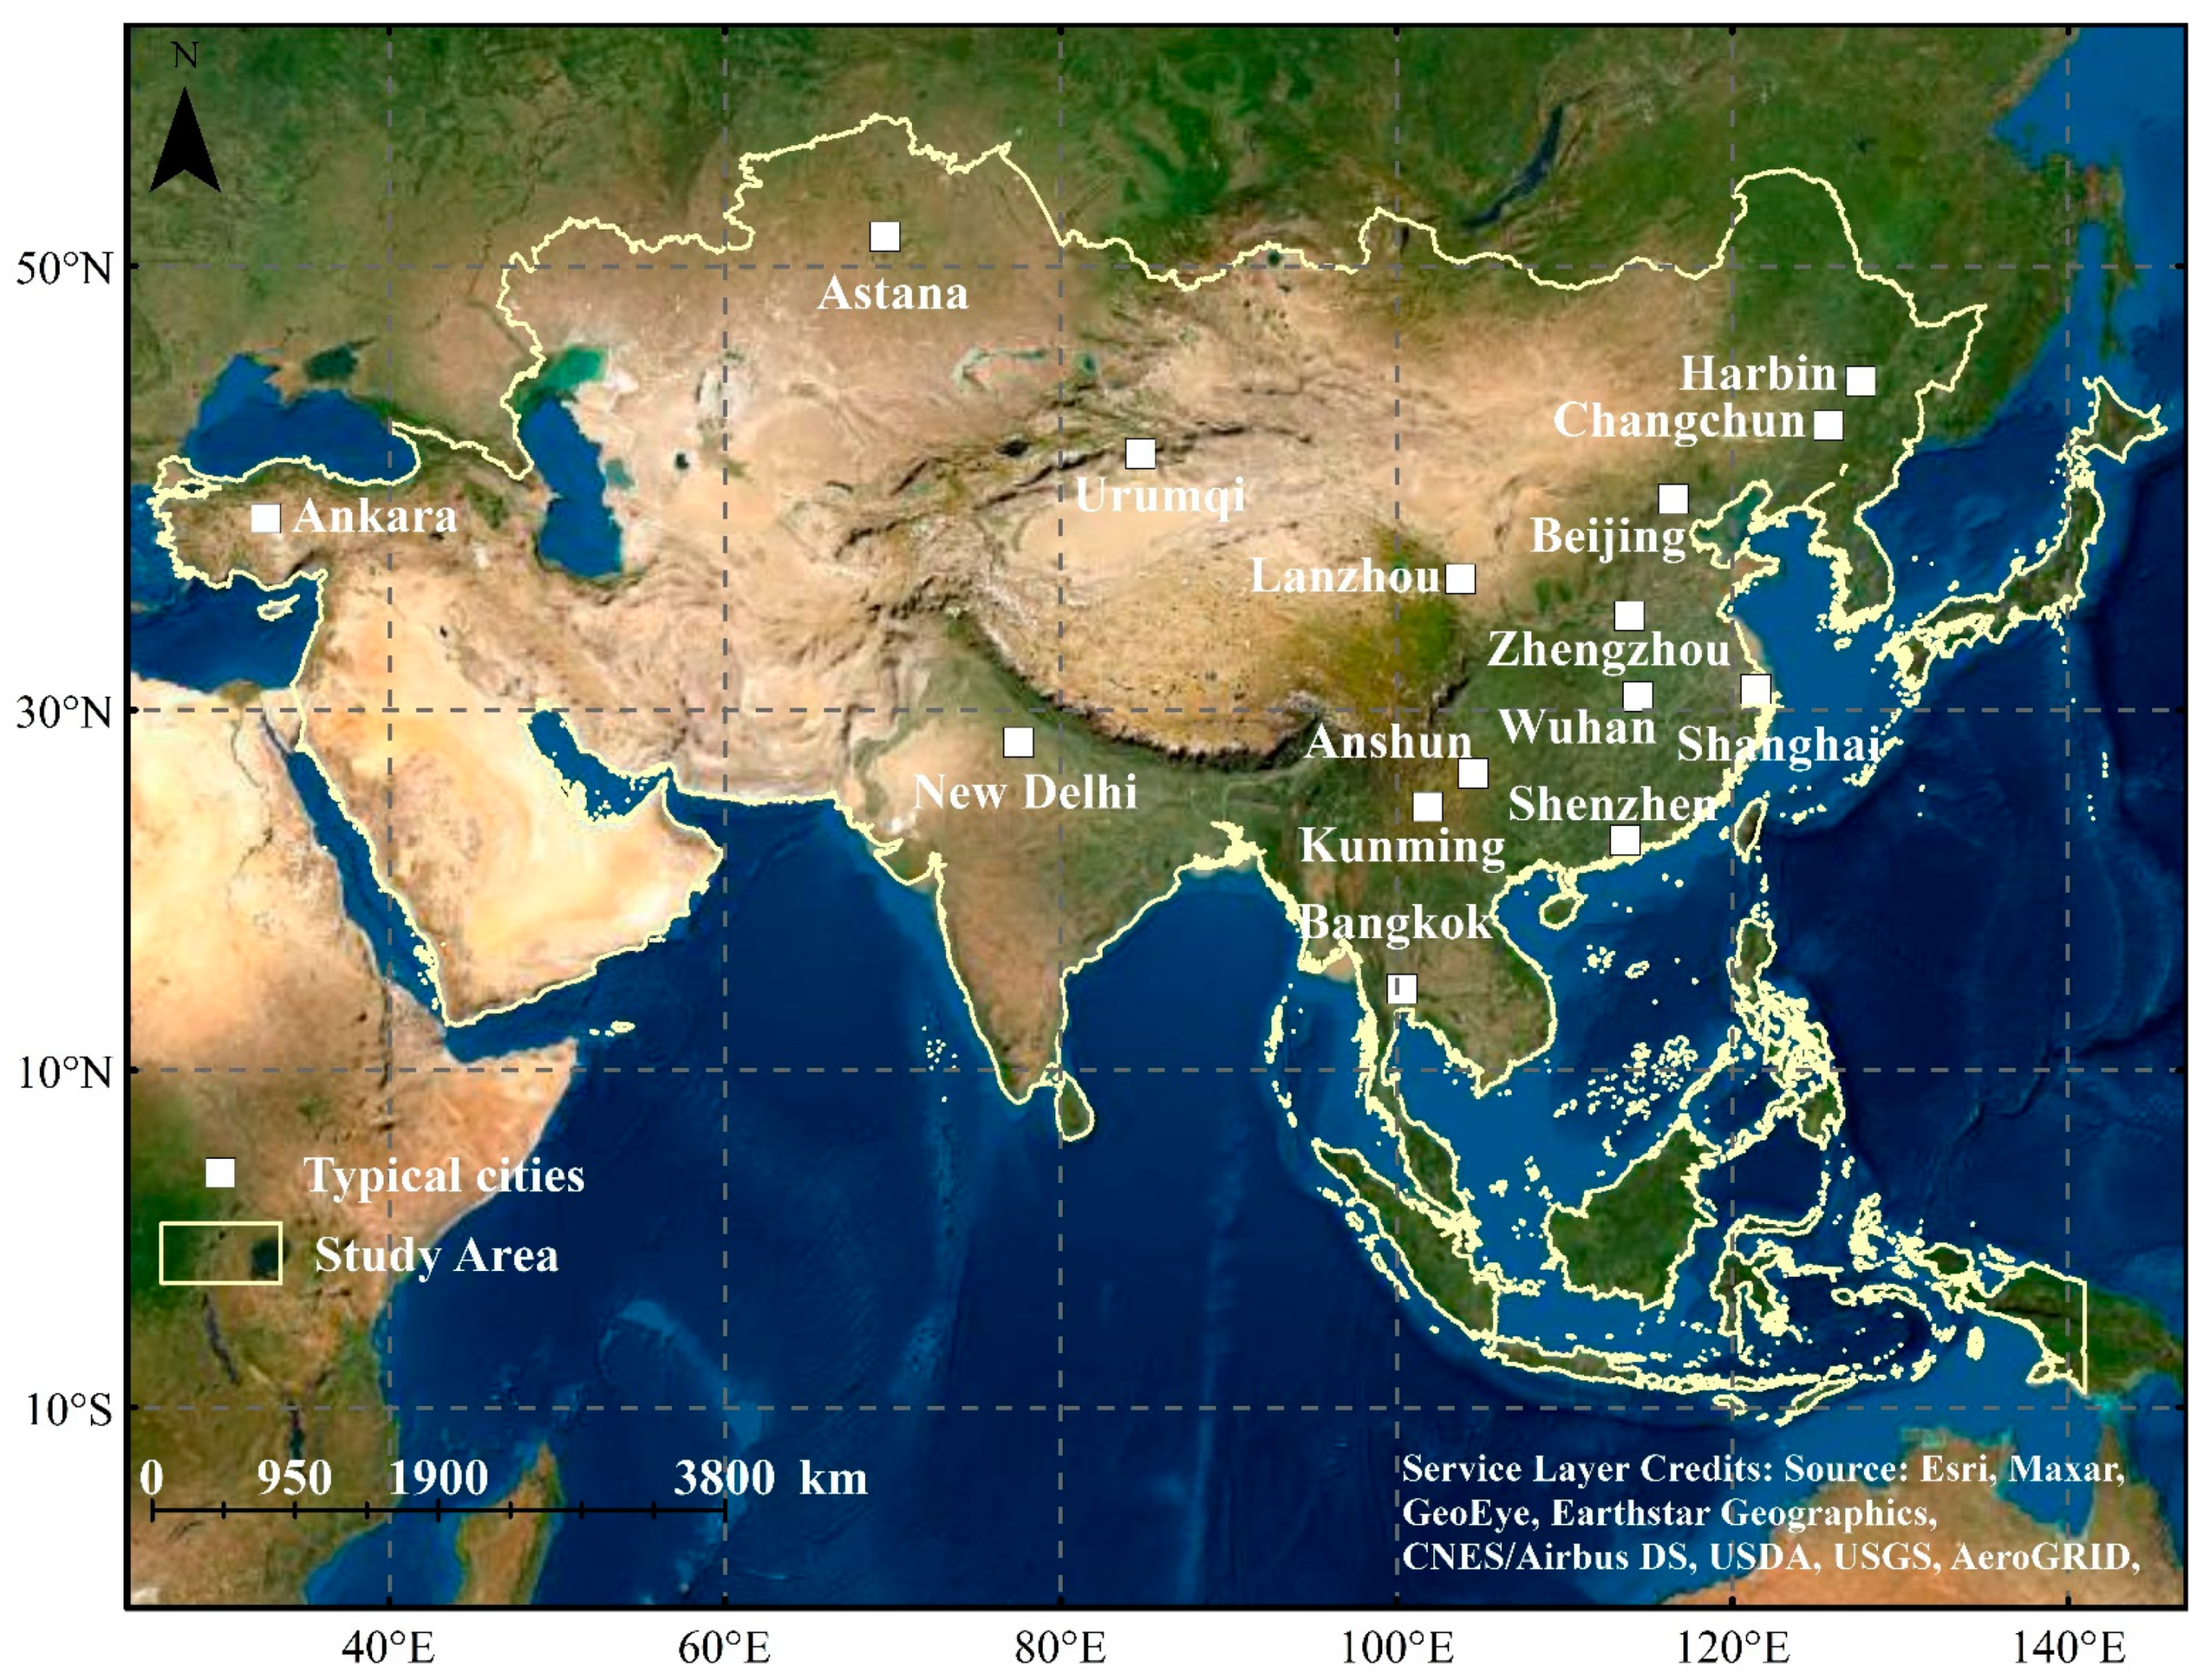
2.1. Study Area

Along with rapid economic development, Asia has seen unprecedented growth in artificial impervious areas over the last few decades. The Asian continent has the largest area and the largest population across the globe, covering latitudes from 10° S to 80° N and longitudes from 170° W to 25° E. Asia spans a wide range of biogeographic regions and climates, including complex and diverse ecosystems and types of terrain (Figure 1). Therefore, Asia represents a highly suitable study area with which to explore the most effective approach to characterize the spatial distribution and the dynamics of AISP. Typical cities in different regions of Asia were selected to test the prediction model and evaluate the robustness of the random forest regression model.

2.2. Data and Preprocessing

In this research, three kinds of remotely sensed imagery were used; multi-temporal MODIS surface reflectance products (MOD09A1), nighttime light data (VIIRS DNB), and Landsat-8 Operational Land Imager (OLI). Detailed information on data acquisition is shown in Table 1.
VIIRS DNB data are produced in 15 arc-second geographic grids (approximately 500-m spatial resolution). In order to facilitate the subsequent integration of these data, all satellite sensor data need to be preprocessed initially. The process included: (1) data were geometrically corrected and re-projected to the Albers Conical Equal Area projection and the WGS84 coordinate system; (2) VIIRS DNB data were resampled to the same spatial resolution as the MODIS data using the nearest neighbor method; (3) MOD09A1 time-series products were used with the minimal composite algorithm to produce high-quality images presenting spectral features. Regarding the Landsat-8 OLI imagery, radiometric calibration and atmospheric correction were conducted as a preprocessing step. The preprocessing of VIIRS DNB data includes the following: a threshold k 0.5 DN was used to remove the effects of background noise (e.g., stray light and transient light sources), while a threshold k 99 DN was used to remove the extremely bright pixel values. The mean DN values of the selected time-series DNB data were calculated and then normalized to 0–99 [32].
High-quality reference data are essential for the assessment of the accuracy of predicting impervious surfaces and feature extraction, and typical and representative pixels need to be collected as ground reference. In this research, the Landsat-8 OLI data were preprocessed first, and the Biophysical Composition Index (BCI) was derived for use as reference data on the impervious surface [61]. The production process includes water body removal, tasseled cap transformation, and threshold segmentation. The first three components derived from tasseled cap transformation were used to calculate the BCI. The first component (TC1) is the brightness, the second (TC2) is the greenness, and the third (TC3) is the wetness [62]. Finally, the extracted impervious surface data are coupled with a small amount of manual rectification to achieve high-quality reference data at a spatial resolution of 30 m. The reference data are divided into training data and testing data for fitting the prediction model and evaluating accuracy, respectively. BCI is calculated according to the following equations:
H   =   TC 1 TC 1 min TC 1 max TC 1 min
V   =   TC 2 TC 2 min TC 2 max TC 2 min
L   =   TC 3 TC 3 min TC 3 max TC 3 min
BCI   =   ( H + L ) 2 V ( H + L ) 2 + V
where TCi (i = 1, 2, and 3) are the first three TC components calculated by TC transformation; TCi min and TCi max are the minimum and maximum values of the corresponding TC component, respectively.

2.3. Methodology

2.3.1. Feature Construction

To construct a robust feature set by making full use of multi-temporal MODIS and VIIRS DNB data, multi-temporal MODIS spectral features, index features based on band math, and the fusion of VIIRS DNB data were considered. These feature sets and their expressions are shown in Table 2.
To achieve stable spectral features, MODIS spectral reflectance time-series data in 2018 were selected with 46 periods. The minimum value composite algorithm was developed to integrate multi-temporal surface reflectance data. The minimum value of each pixel was calculated based on the selected multi-temporal data to remove the impact of clouds, resulting in a high-quality spectral image. The formal equation is expressed as follows,
B i = Min [ B i 1 ,   B i 2 ,   ,   B i n ]
where B i is the result derived from multi-temporal bands, i is the number of bands, and n is the number of imaging periods.
According to the literature, NDBI and NDVI are used commonly to extract built-up and vegetation information with high accuracy [63,64]. In general, NDVI is used to extract vegetation information by setting an empirical threshold. Moreover, due to the inverse correlation between vegetation indices and impervious surfaces, MODIS NDVI has also been employed to extract impervious surfaces over large areas [65]. Although these indices have certain advantages for extracting impervious surfaces, they are too simple to represent heterogeneous impervious surfaces at large scales. In this research, a set of newly derived indices, i.e., the normalized difference spectral index with several spectral features, was designed, similar to the NDBI and NDVI, where spectral features are captured comprehensively as
N D S I i   j   =   ( B i B j ) / ( B i   +   B j )
N D S I i   j is the normalized difference spectral index derived from the band i and the band j, i is natural numbers between 1 and 6, and j is natural numbers between i + 1 and 7.
Nighttime light data have become an important data source for the extraction of large-area impervious surfaces [66]. However, the coarse spatial resolution and blooming effects in the nighttime light data make it difficult to map impervious surfaces accurately over large areas using nighttime light data alone [67]. Therefore, many studies have combined nighttime light and vegetation indices for extracting impervious surface, where the effectiveness has been demonstrated over urban landscapes [68]. However, the prediction results of the above indices are still uncertain when mapping impervious surfaces due to insufficient feature variables and lack of robustness. Therefore, a novel method of fusing multi-temporal nighttime light data and spectral index features is proposed here to consider both nighttime light and spectral indices comprehensively. For VIIRS DNB data, it is important to reduce the impact of high-digit pixels as extreme values on impervious surface estimation [52]. Logarithm was proposed to mitigate such impact [32]. The formal equation is expressed as
N L F I i   j   =   N D S I i   j ×   log ( D N B   +   1 )
where N L F I i   j is the night light fusion index derived from fusing N D S I i   j and VIIRS DNB, and DNB is the DN value of nighttime lights data after the preprocessing step, with the data range of 0–99.

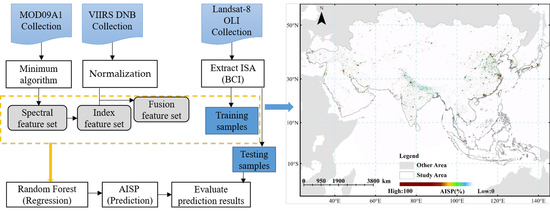
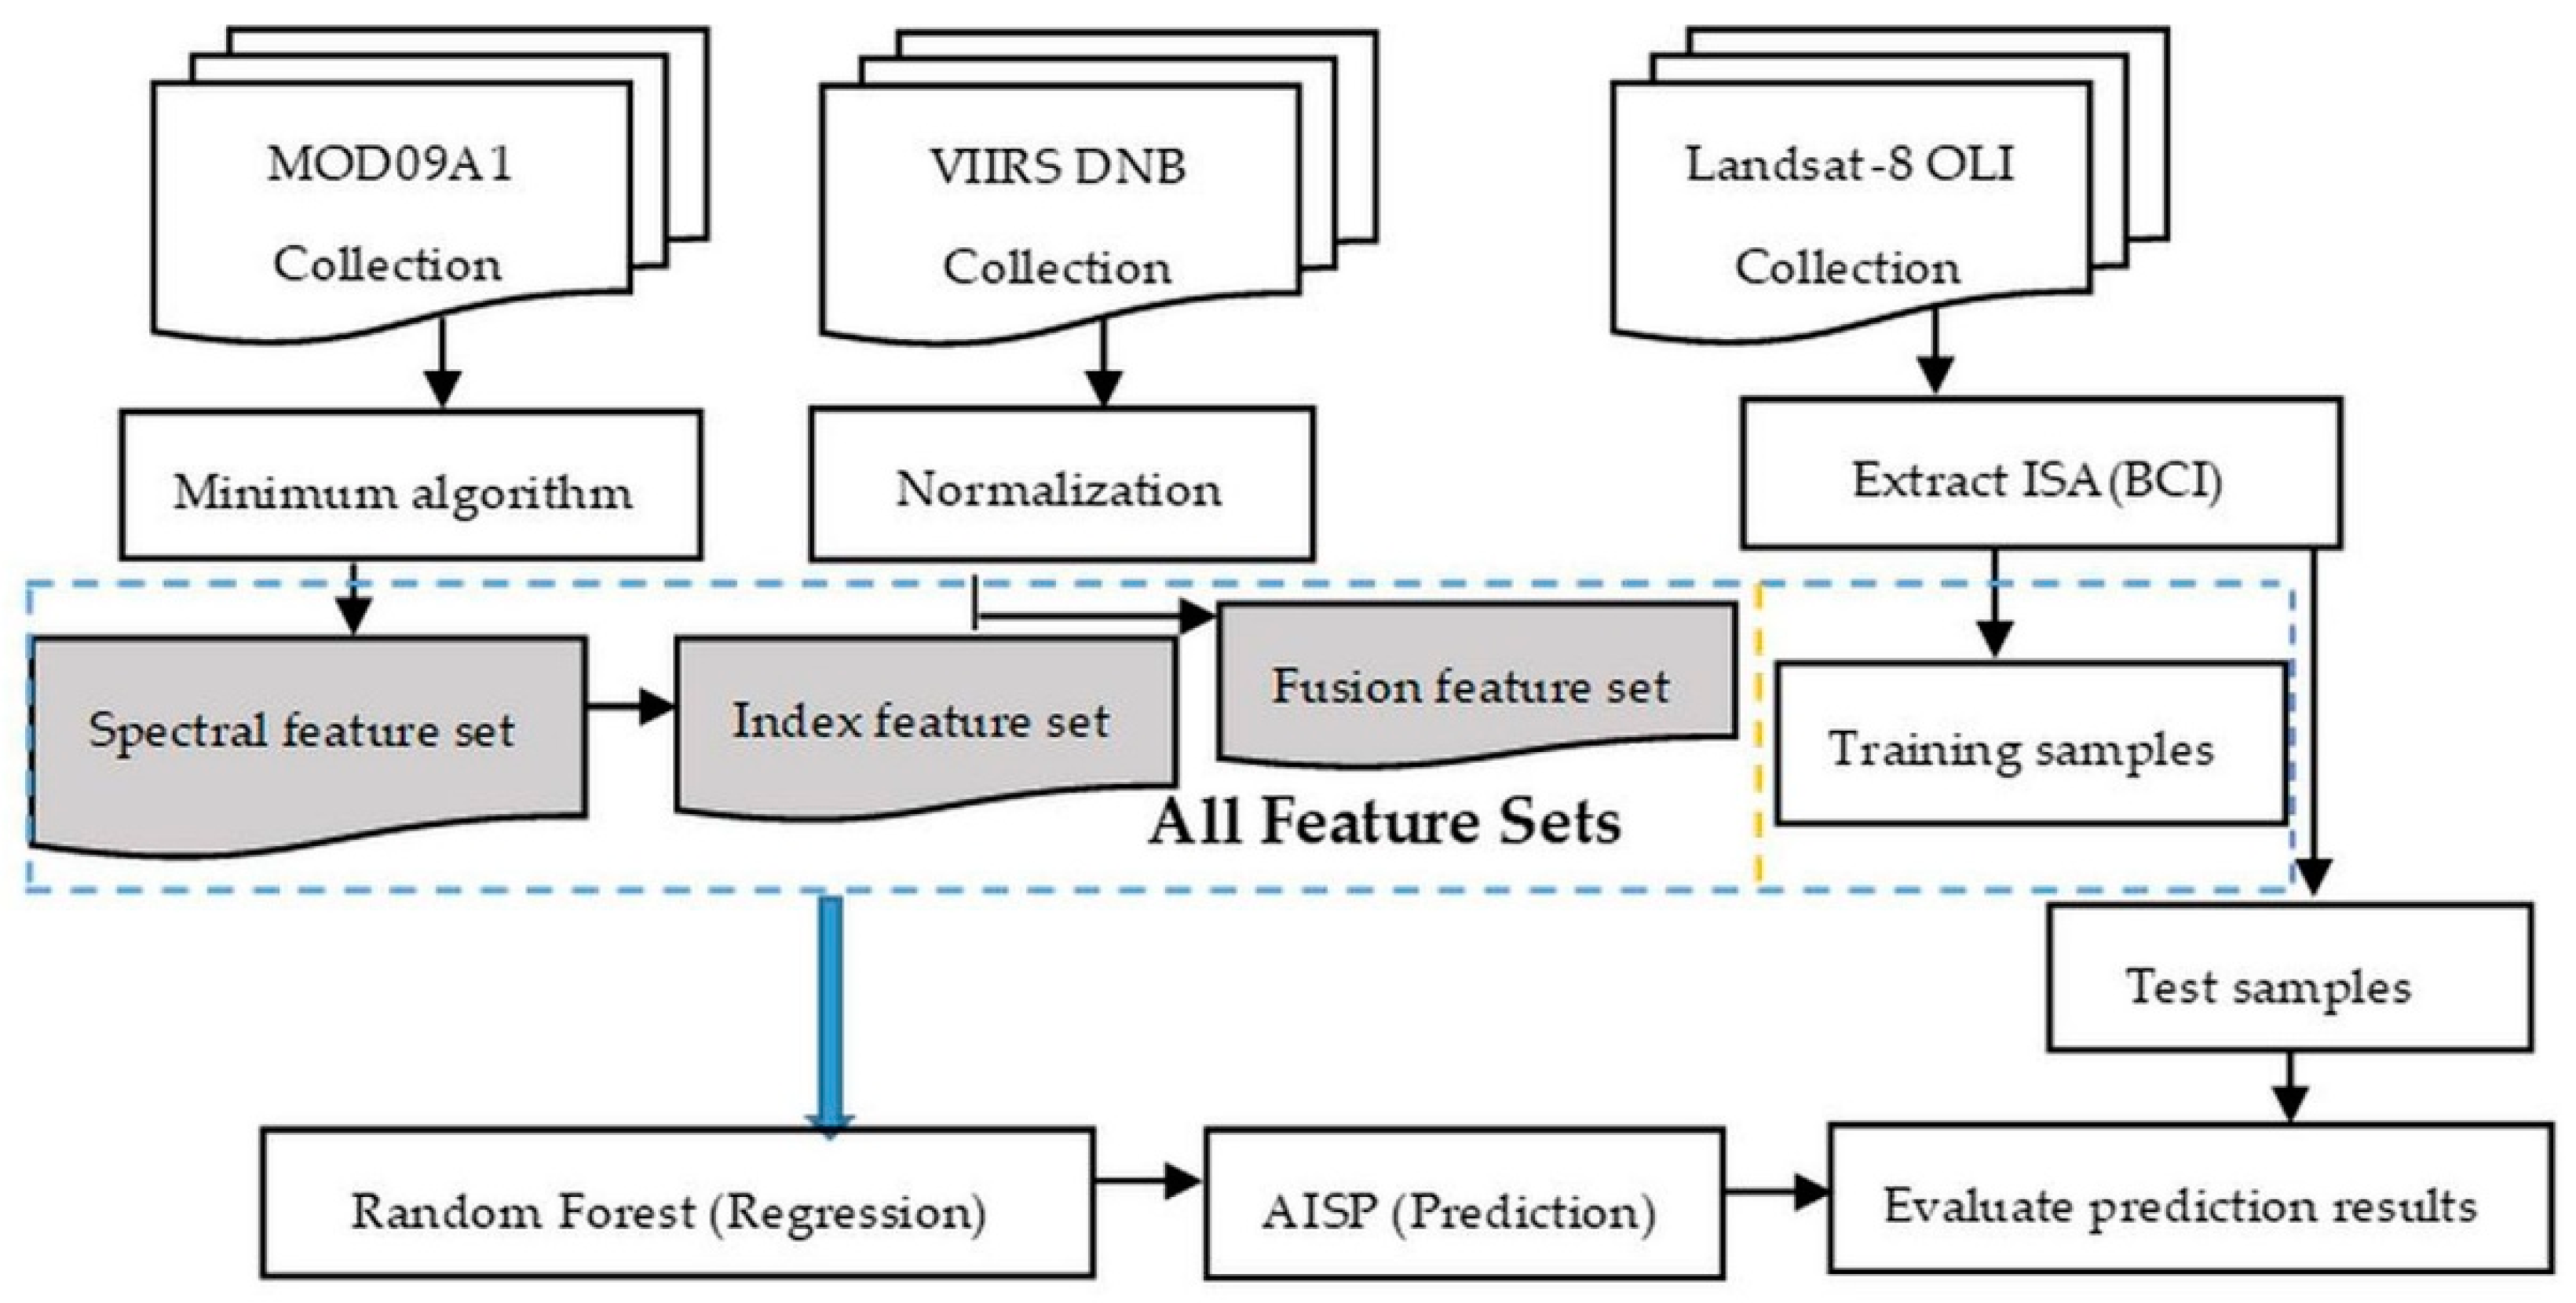
2.3.2. Framework of the Proposed Method

Figure 2 illustrates the framework for the prediction of impervious surface percentage based on multi-source remotely sensed data. There are five steps in the framework: (1) using the BCI index to extract impervious surface information from the preprocessed Landsat-8 OLI imagery with manual rectification at a spatial resolution of 30 m; (2) construction of feature sets based on MODIS spectral data and VIIRS DNB data; (3) random forest regression to establish an impervious surface percentage prediction model; (4) generalizing the model to Asian regions other than China to predict the impervious surface percentage; (5) accuracy assessment of the prediction.

2.3.3. Development of AISP Prediction Models and Evaluation

The random forest regression model was employed for AISP prediction. First, 30,000 samples at pixel level were selected randomly in different regions of China. However, a small part of these samples comes from the selected typical cities. Eighty percent of these samples were used for training, and 20% were left for testing predictive performance. In addition, in order to test the impact of different proportions of training samples on prediction accuracy of the proposed method, another experiment was performed using 60% of the samples as training samples, and the remaining samples were used for testing. Therefore, two sets of prediction models were established in 2013 and 2018, respectively. There are two important parameters in random forest model, which are the number of decision trees in the forest (N) and the number of features extracted for each tree split (m). By default, we selected one-third of the features in the TreeBagger package in Matlab as the number of extracted features for different schemes of regression (m = 17). Based on the extracted feature m, we identified that while the number of decision trees N ≥ 100, the out-of-bag error of all schemes converged gradually and became stable. Therefore, we used N = 100 as the number of generated decision trees. The prediction outcome was the impervious surface percentage. The variable importance was also tested to show the influence of feature variables upon dependent variables [69]. The accuracy assessment for the AISP predictions was applied based on the coefficient of determination (R2) and root mean squared error (RMSE). Moreover, the methods LISI (Large-scale Impervious Surface Index) and MISI (Modified Impervious Surface Index) based on a single feature were employed for comparative analysis. LISI and MISI are large-area impervious surface indices based on MODIS NDVI and nighttime light data. They have achieved encouraging performance in the estimation of impervious surfaces in a large area [32,52].
To further analyze the predictive capability of the proposed model, typical cities in different regions of Asia were selected to evaluate the prediction model. These cities are regional center cities of China and Asia. Between 2000 and 3000 sample points were generated randomly from each typical city for accuracy assessment again. Using Landsat-8 OLI as the reference data, the predicted value was analyzed at each sample point. RMSE and R2 (coefficient of determination) were used as indicators for evaluating the accuracy of the AISP prediction in typical cities.

2.3.4. Experimental Scheme Description

Four different schemes were designed for benchmark comparison, including (1) spectral feature, (2) spectral and index features, (3) spectral and fusion features, and (4) preferred combination of all features as listed in Table 3. The purpose was to (1) study the influence of different feature variables on the extraction of impervious surface information while determining the variable importance, and (2) explore the best way to increase the accuracy of impervious surface information extraction in different schemes.

3. Results

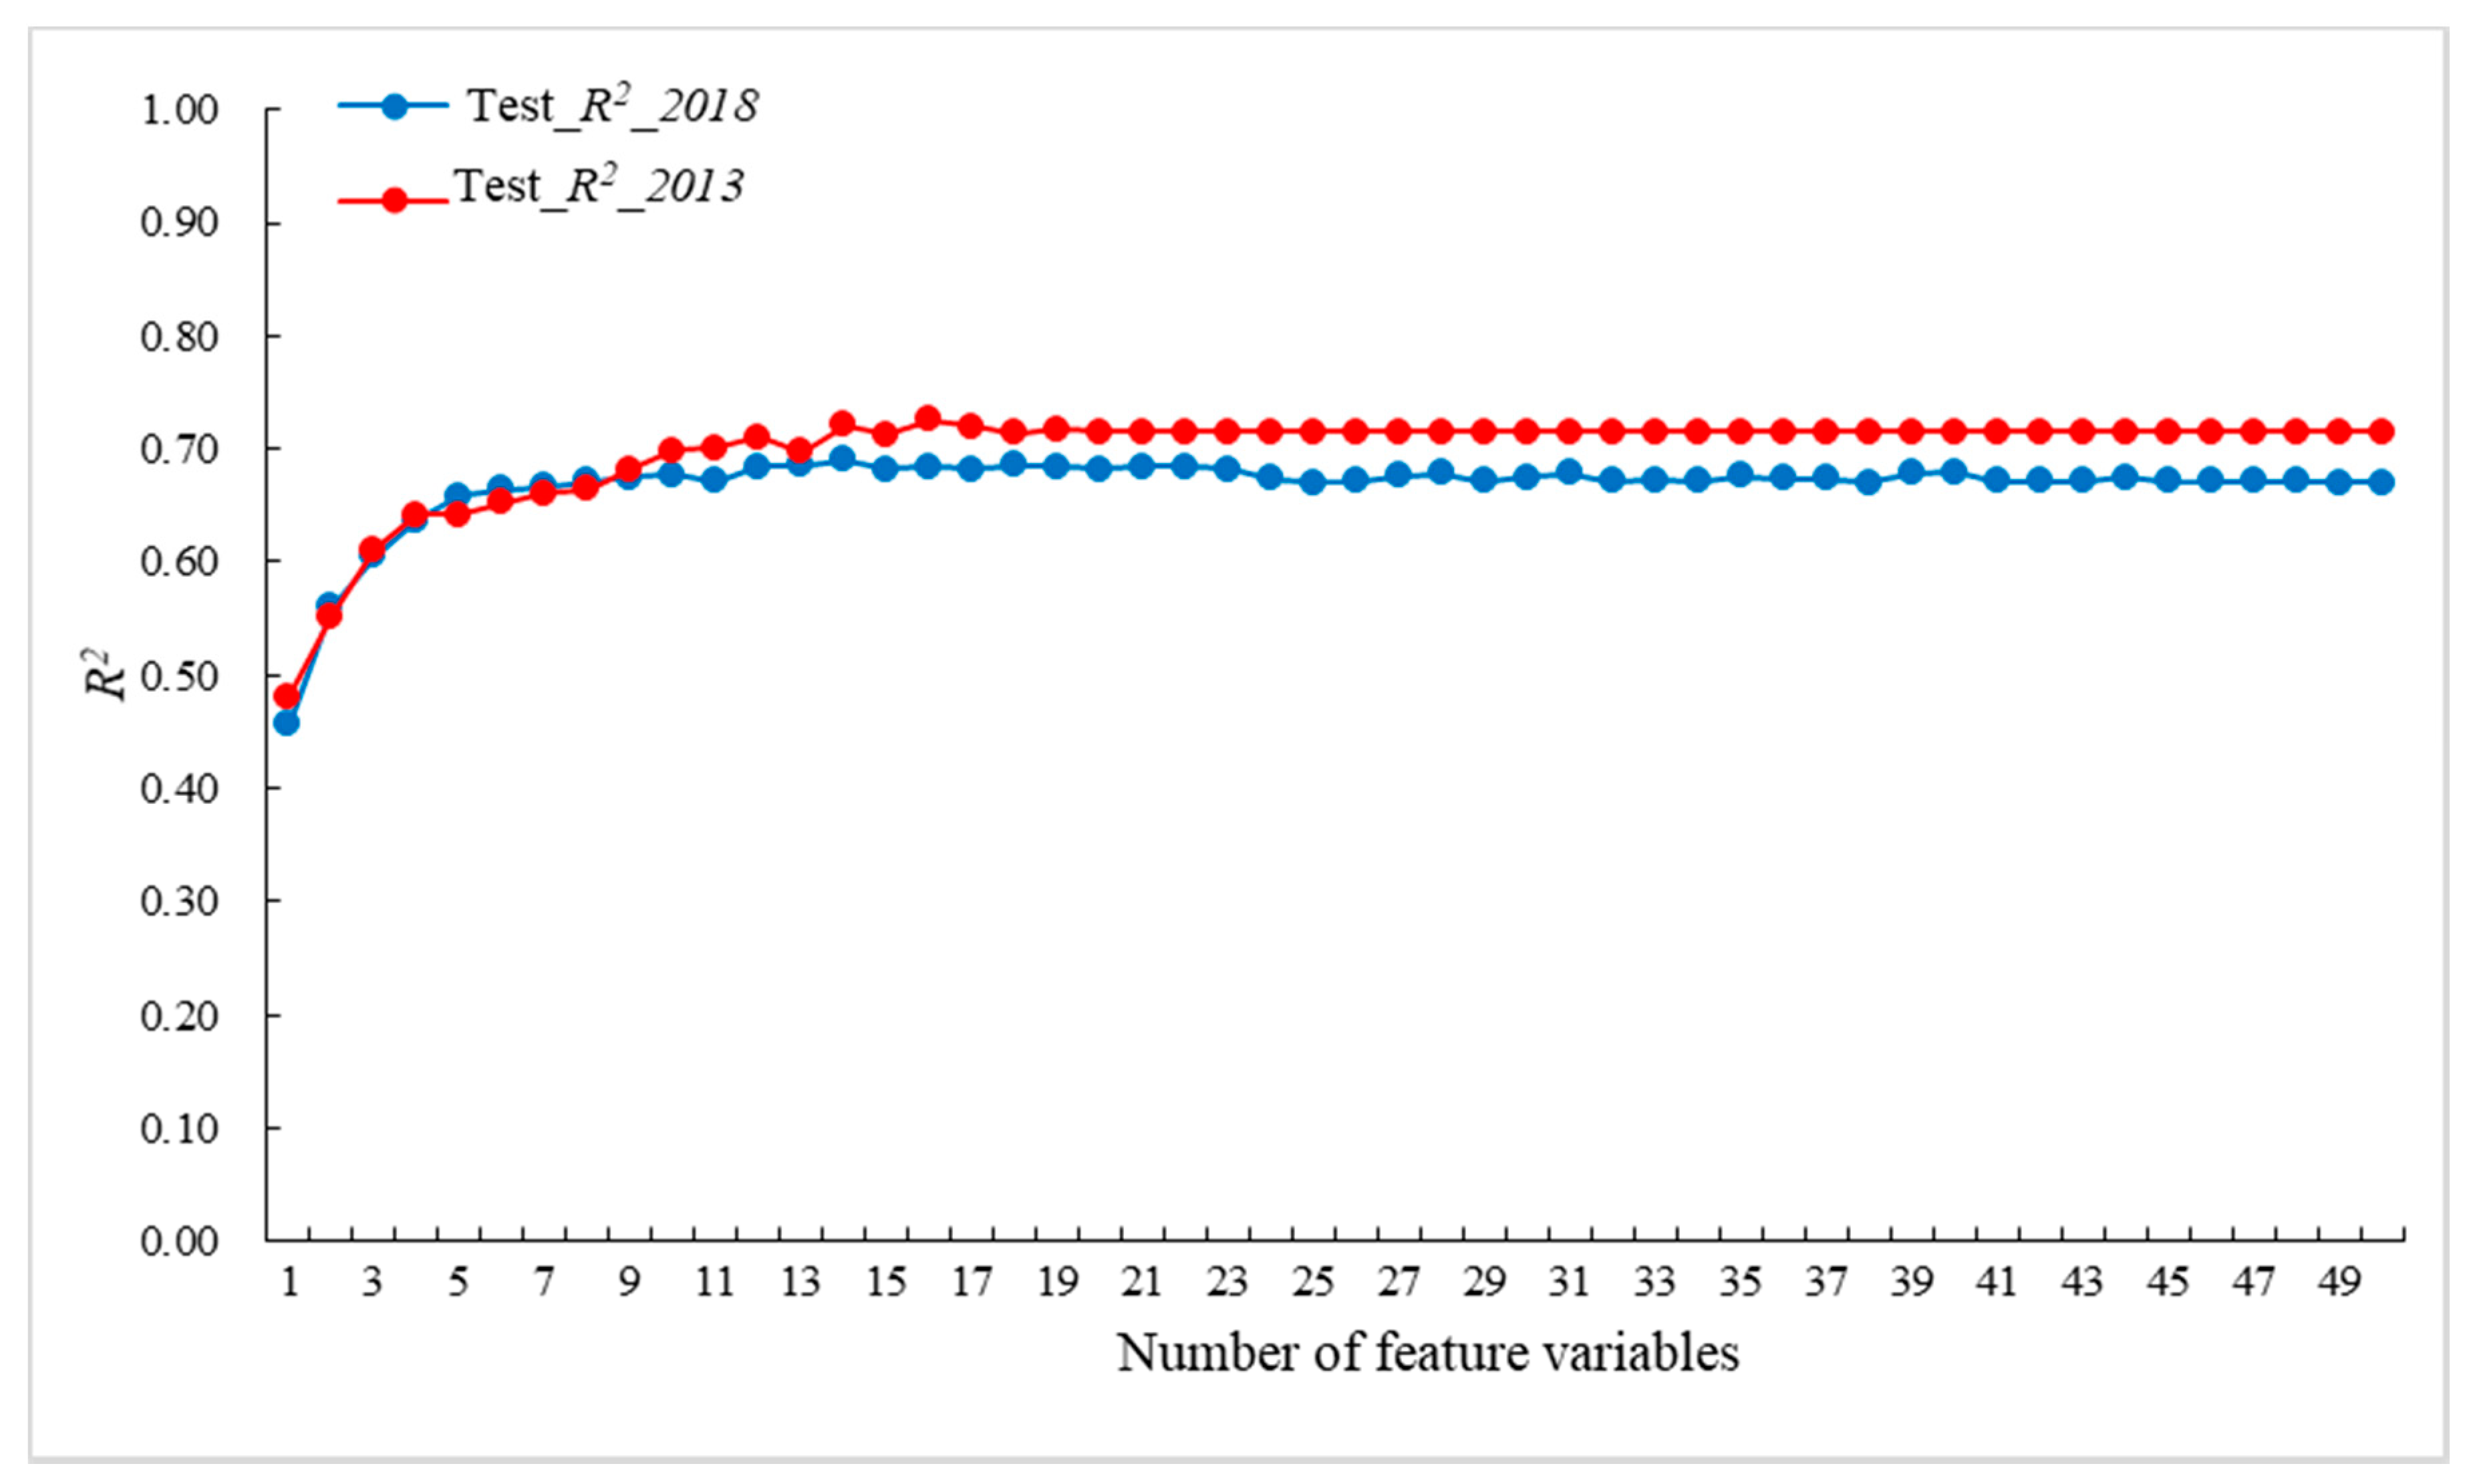
3.1. The Results of Different Schemes

The random forest algorithm was used to test the importance of all features, and the combination of feature variables with high scores was chosen to form scheme 4. All selected feature variables were ranked based on variable importance as shown in Figure 3, and the test R2 values were used to determine the selected features quantitatively (Figure 4).
The importance varied across variables in 2018. Amongst all features, D N B n o r scored the highest followed by B7, with scores of 3.05 and 2.12, respectively (Figure 3), and NLFI_36 produced the lowest score with the least influence on the prediction results. The prediction accuracy of the previous surface model (top seven features) showed a rapid upward trend with an increase in the input variables; the test R2 of a single feature rises from 0.45 to 0.67 when 80% of samples are used for training (Figure 4). This is mainly because the importance score of the feature variables is high at the early stage, and the correlation between the features is small, enhancing the performance of the algorithm. When the number of feature variables is between 7 and 15, the accuracy of the model shows a steady upward trend along with the addition of characteristic variables. With the continuous addition of variables, however, the accuracy of the model decreases slightly. This is due to the inclusion of irrelevant variables and potential collinearity, which leads to a decline in prediction accuracy. Figure 4 also shows that when the number of feature variables is 15, the model accuracy is a maximum, and the test R2 is 0.69 in 2018. In addition, the importance of the first 15 input features is similar in 2013 and 2018. Therefore, the first 15 feature variables were chosen as scheme 4 to estimate the AISP.
In order to obtain a robust estimation model, we developed two sets of prediction models by using different proportions (60% and 80%) of training samples in 2013 and 2018, respectively. From Table 4, compared with LISI and MISI methods, our proposed methods show better performances using different proportions of training samples. Furthermore, with the increased number of training samples, the estimation accuracy also increases, but the increase is not significant. Moreover, as displayed in Table 4, our proposed method can achieve more stable results compared with LISI and MISI. Within scheme 1, different feature variables were added to estimate their effect on predicting impervious surface percentage. When the spectral indices of each band were added, the accuracy of the model increased slightly (test R2 is from 0.59 to 0.61 in 2018). When the fusion features were included, the accuracy of the model increased significantly (test R2 is from 0.59 to 0.67 in 2018). This shows that the fusion features have a large contribution to the accuracy of impervious surface percentage prediction. Compared with other methods, our proposed scheme 4 is significantly better than models derived from LISI and MISI using different proportions of training samples in 2013 and 2018, respectively (see in Table 4). Therefore, our proposed method based on multi-temporal and multi-source features is more suitable for estimating the impervious surface percentage in a large area.

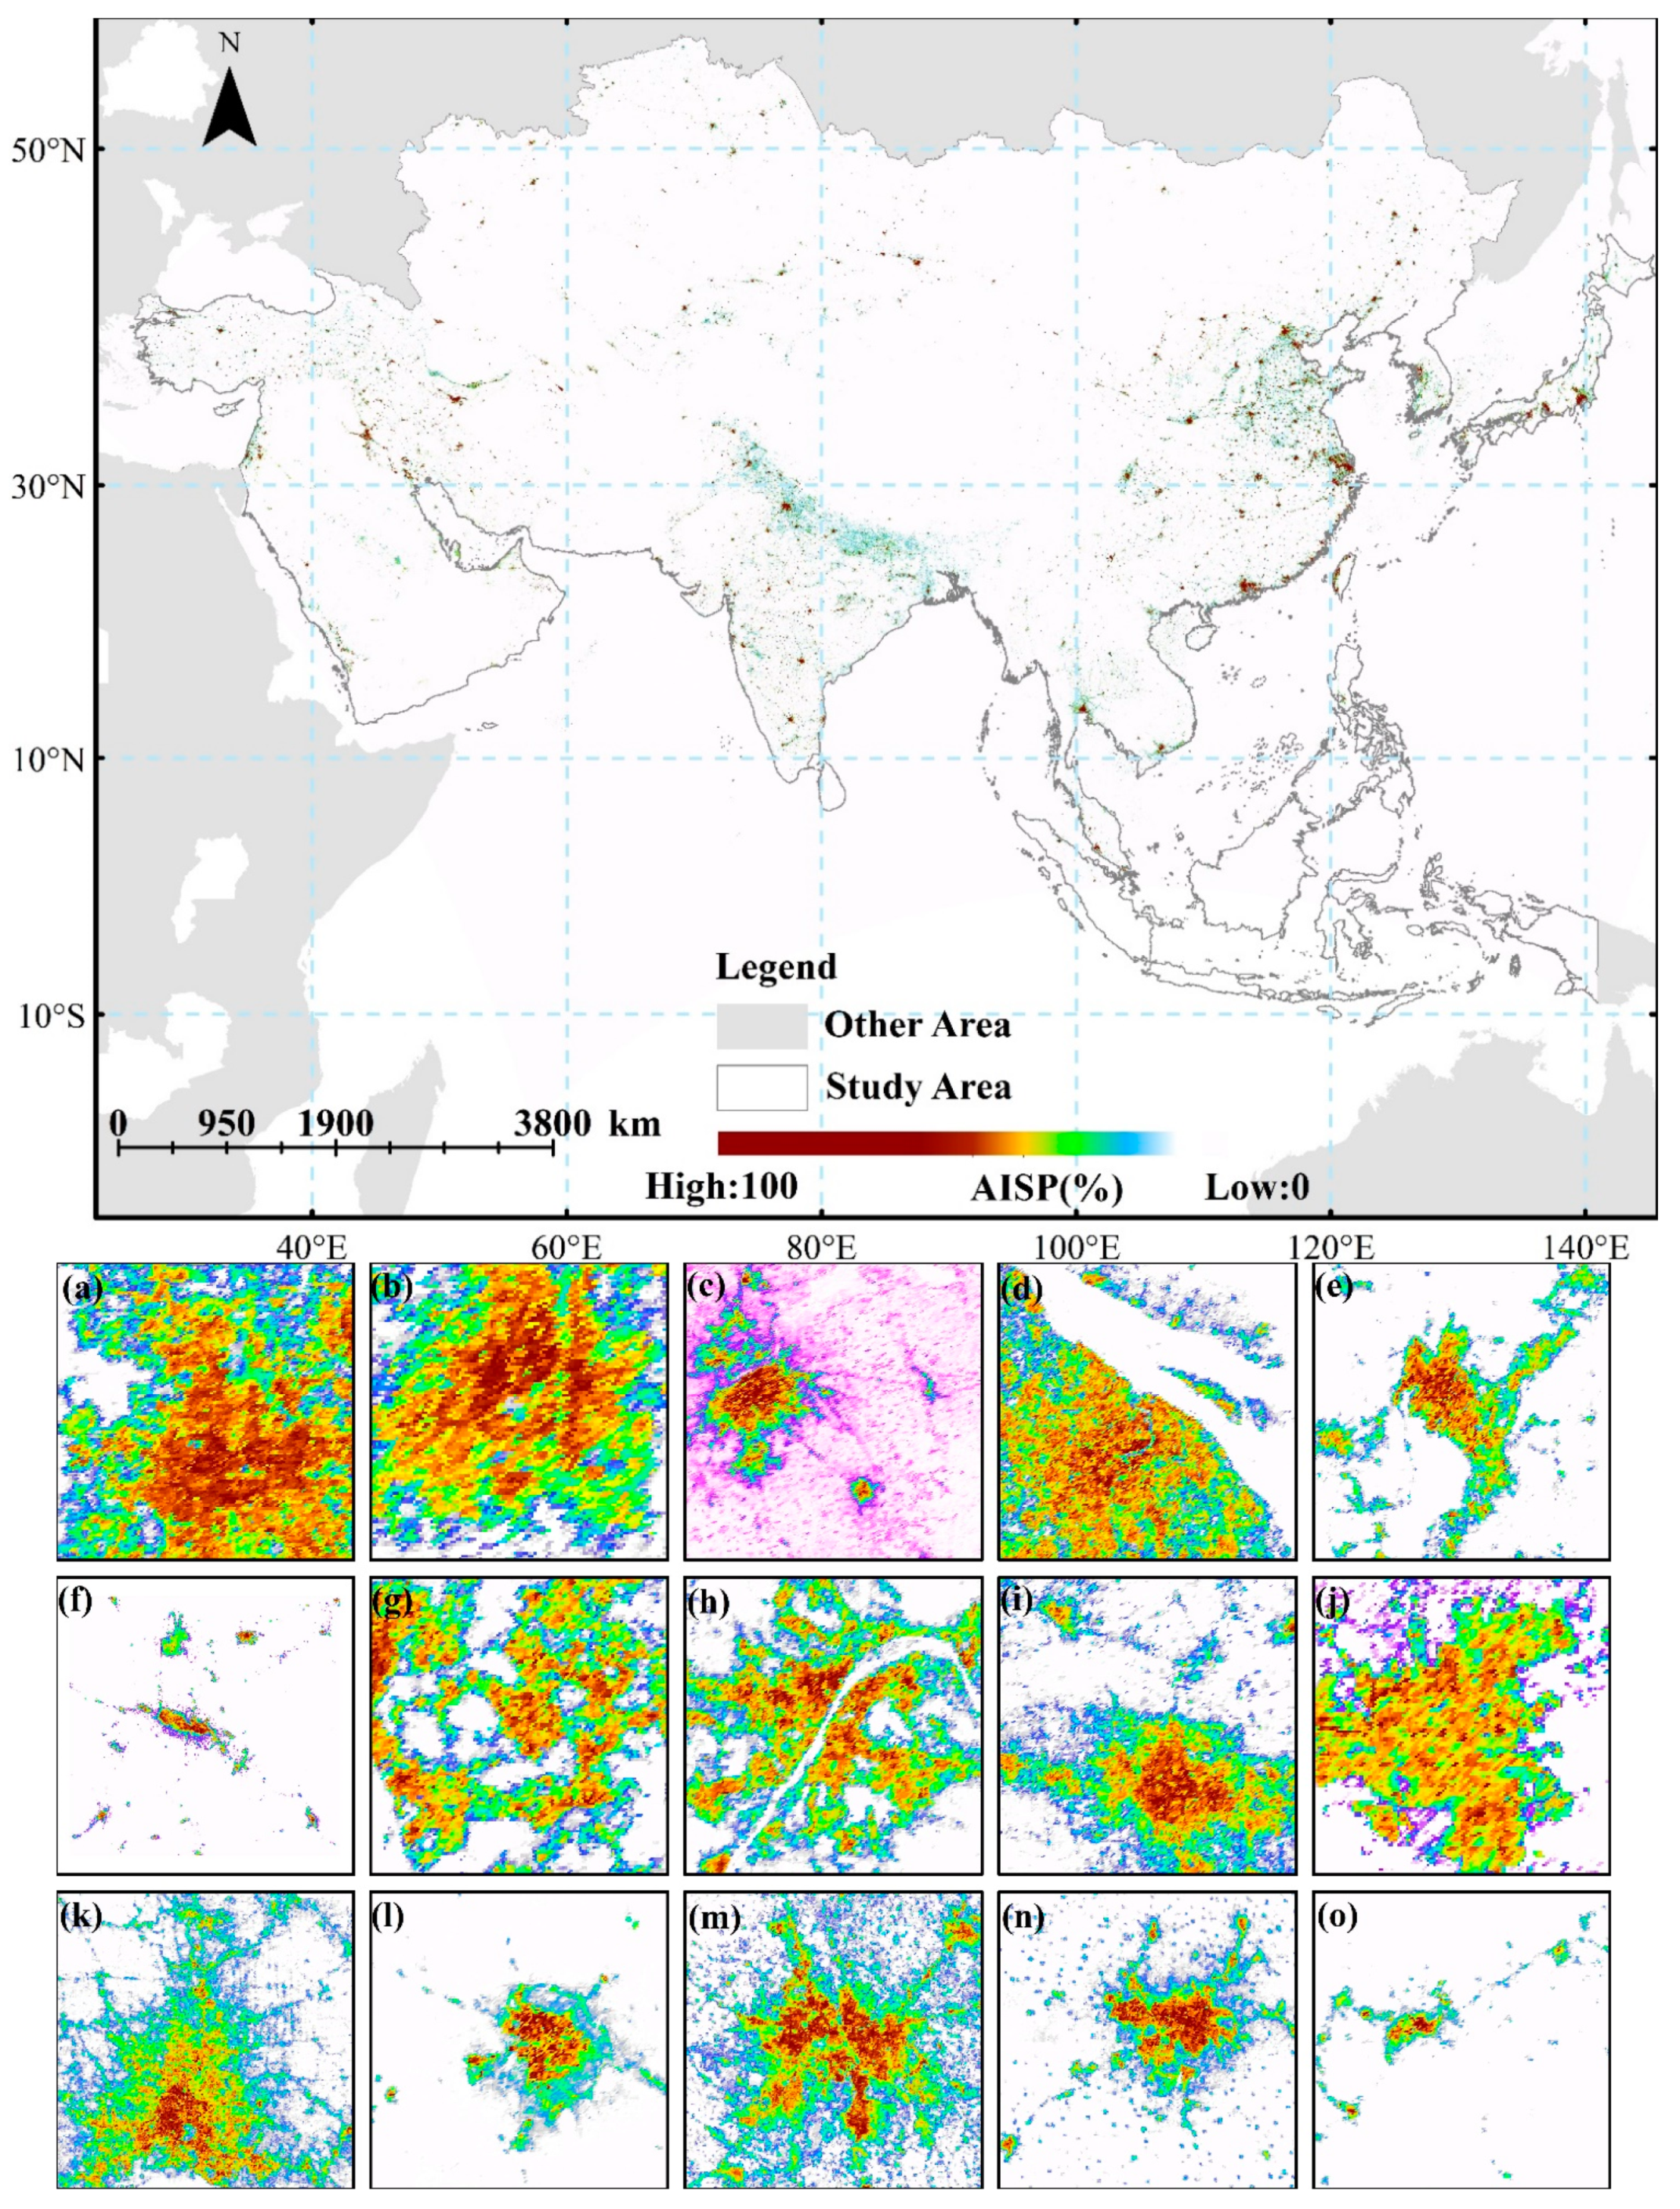
3.2. Prediction of AISP in Asia

The total estimated area of artificial impervious surface in Asia was 352,490 km2 and 29,1280 km2 in 2018 and 2013, respectively, which accounted for 0.79% and 0.65% of the land surface area in Asia, respectively. We also calculated the area of artificial impervious surface in Asia using the existing global impervious surface products for the past two years. The impervious surface area of Asia calculated by Gong’s product (GAIA) was 340,625 km2 and 280,325 km2 in 2018 and 2013, respectively [70]. Thus, in general, the results obtained in this paper are consistent with Gong’s results, but the predicted area using the present approach is slightly larger. The possible reason for this is that GAIA uses night lights data as a mask to obtain potential impervious surface information and may have omitted some rural settlements that do not have night lights.
The spatial distribution of the artificial impervious surface in Asia is illustrated in Figure 5. The impervious surface in Asia presents three gradients from east to west. The first gradient includes Japan, South Korea, and coastal cities in eastern China. The impervious surface here is characterized mainly by a high density and concentrated distribution. In addition, China has the most impervious surfaces in Asia, located mainly in the coastal cities in the east. The second gradient includes countries in Central Asia, mainly five countries including India. The impervious surface of this area is scattered from the city center to the periphery. The third gradient encompasses the western part of Asia, mainly the countries of the Arabian Peninsula. The impervious surface percentage of this gradient is low, mainly because of the effects of topography and climate in the area.

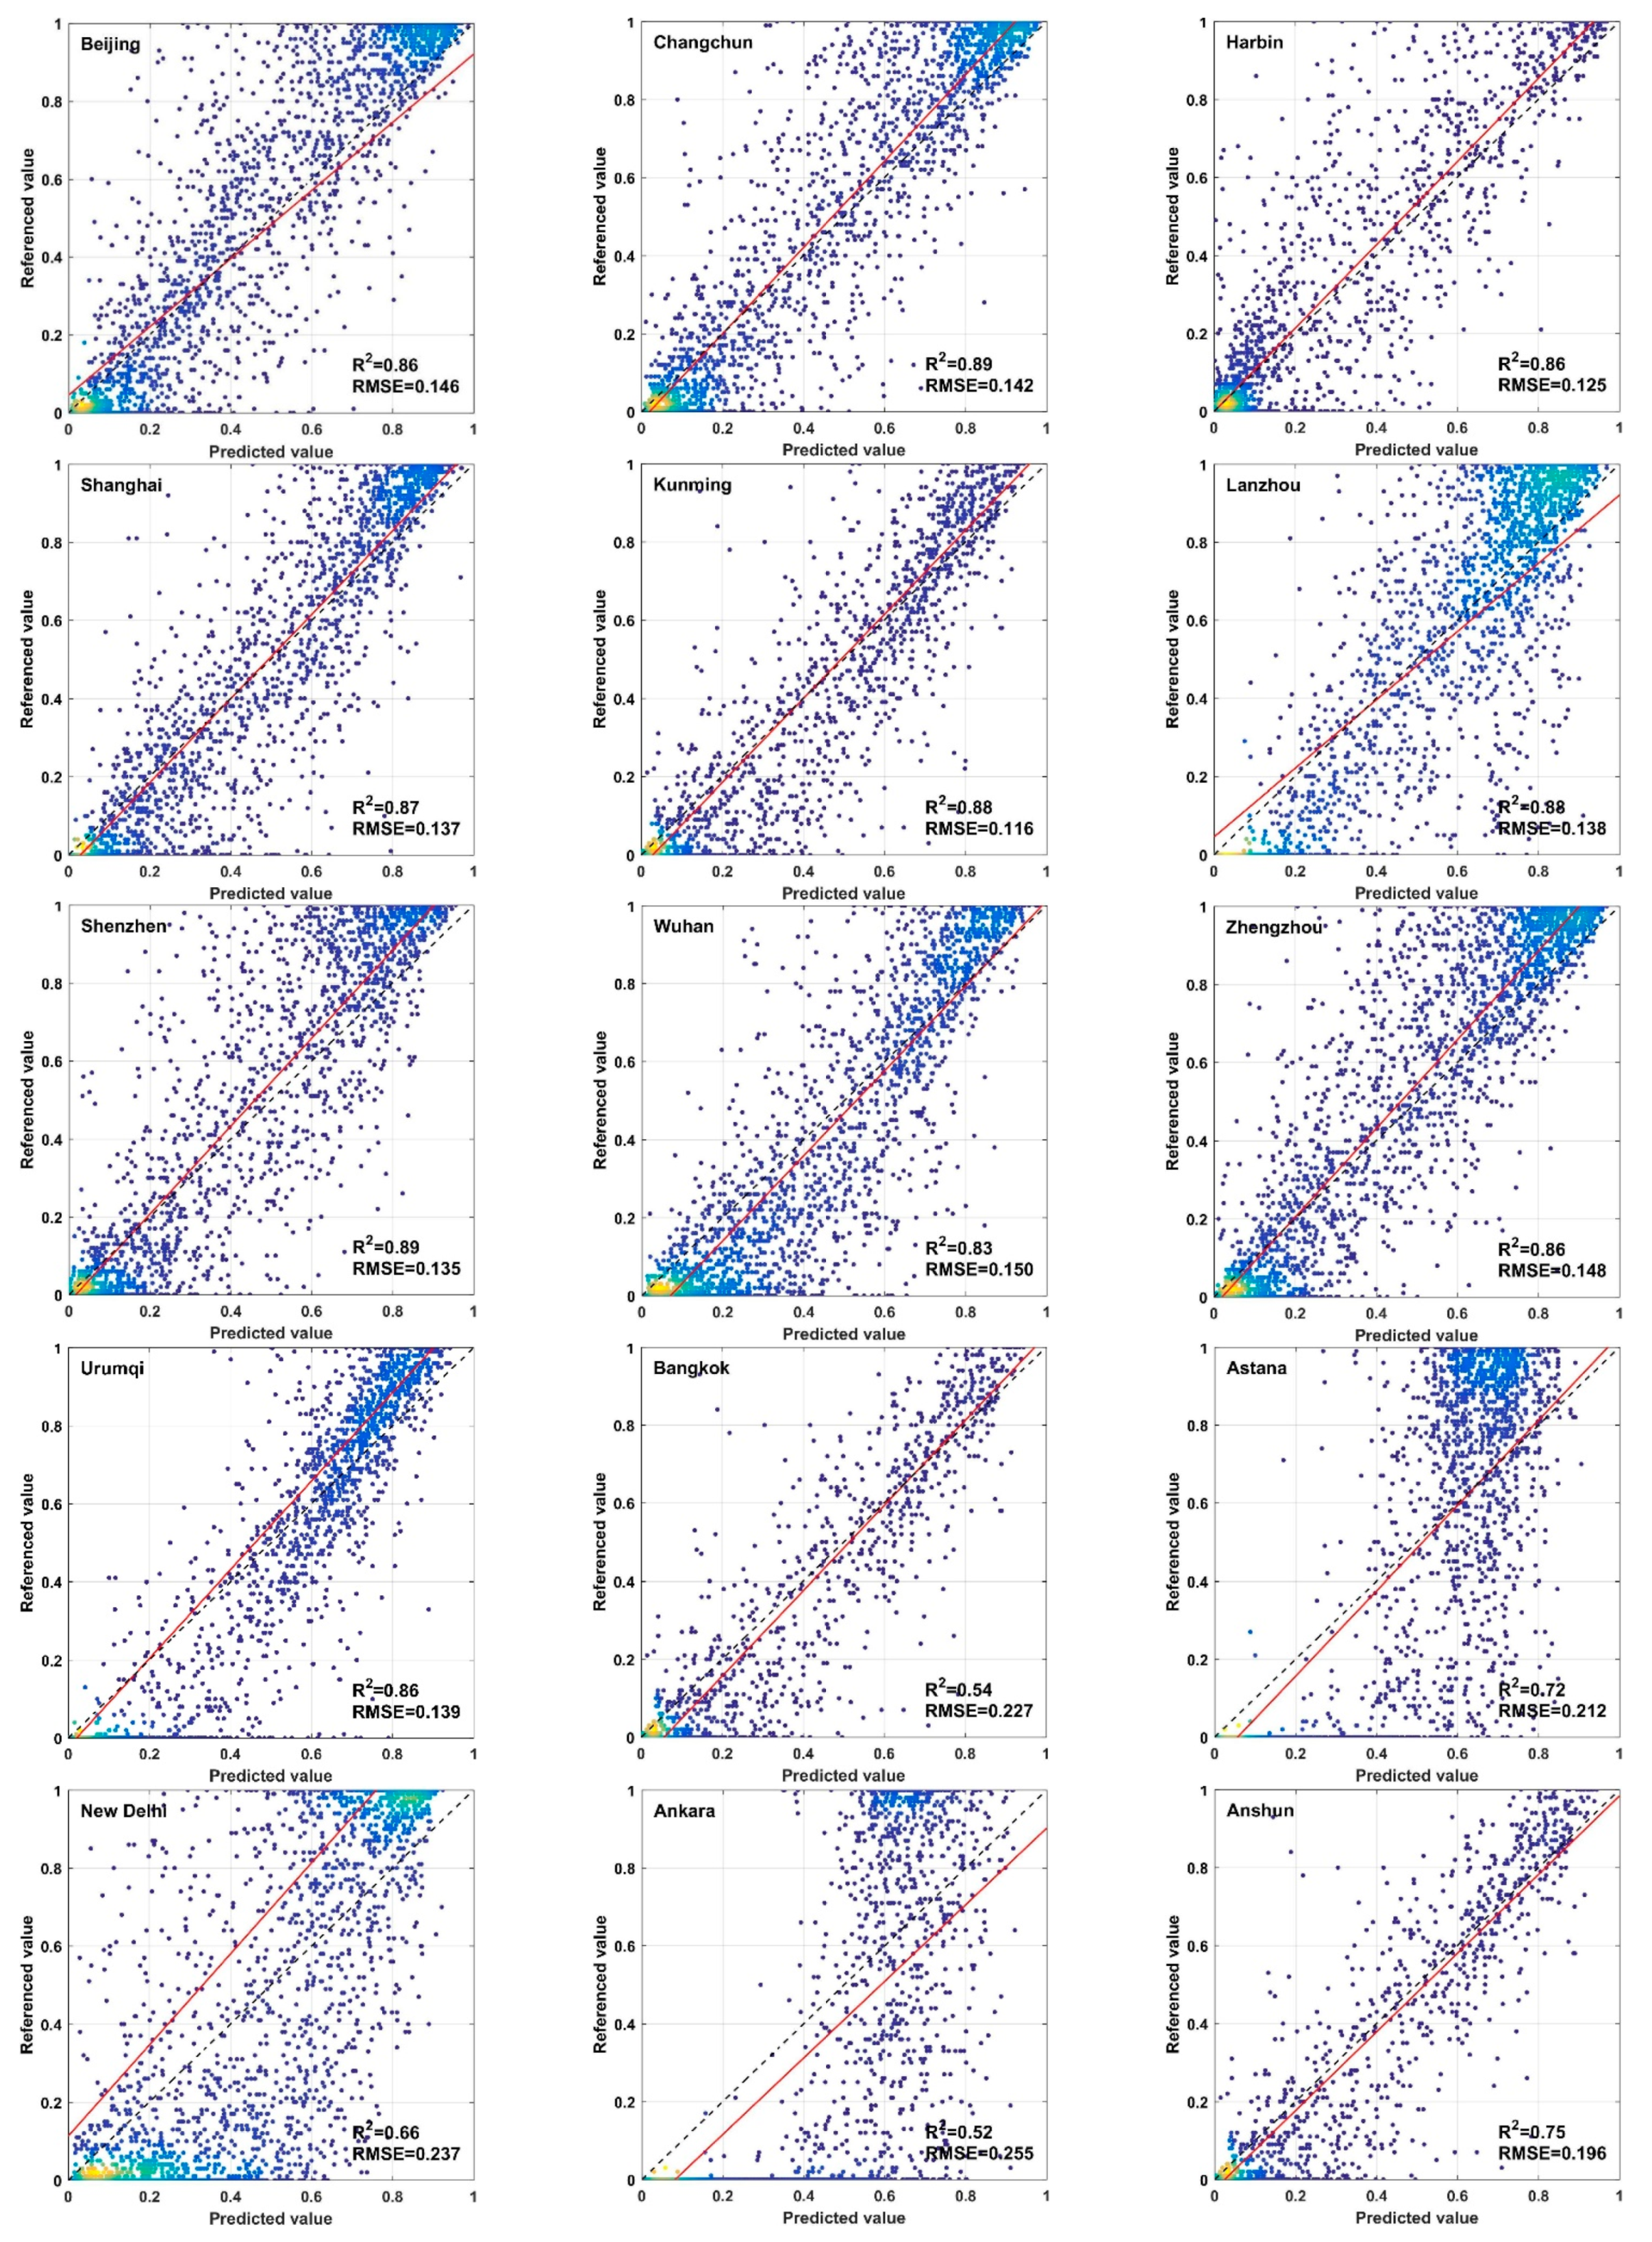
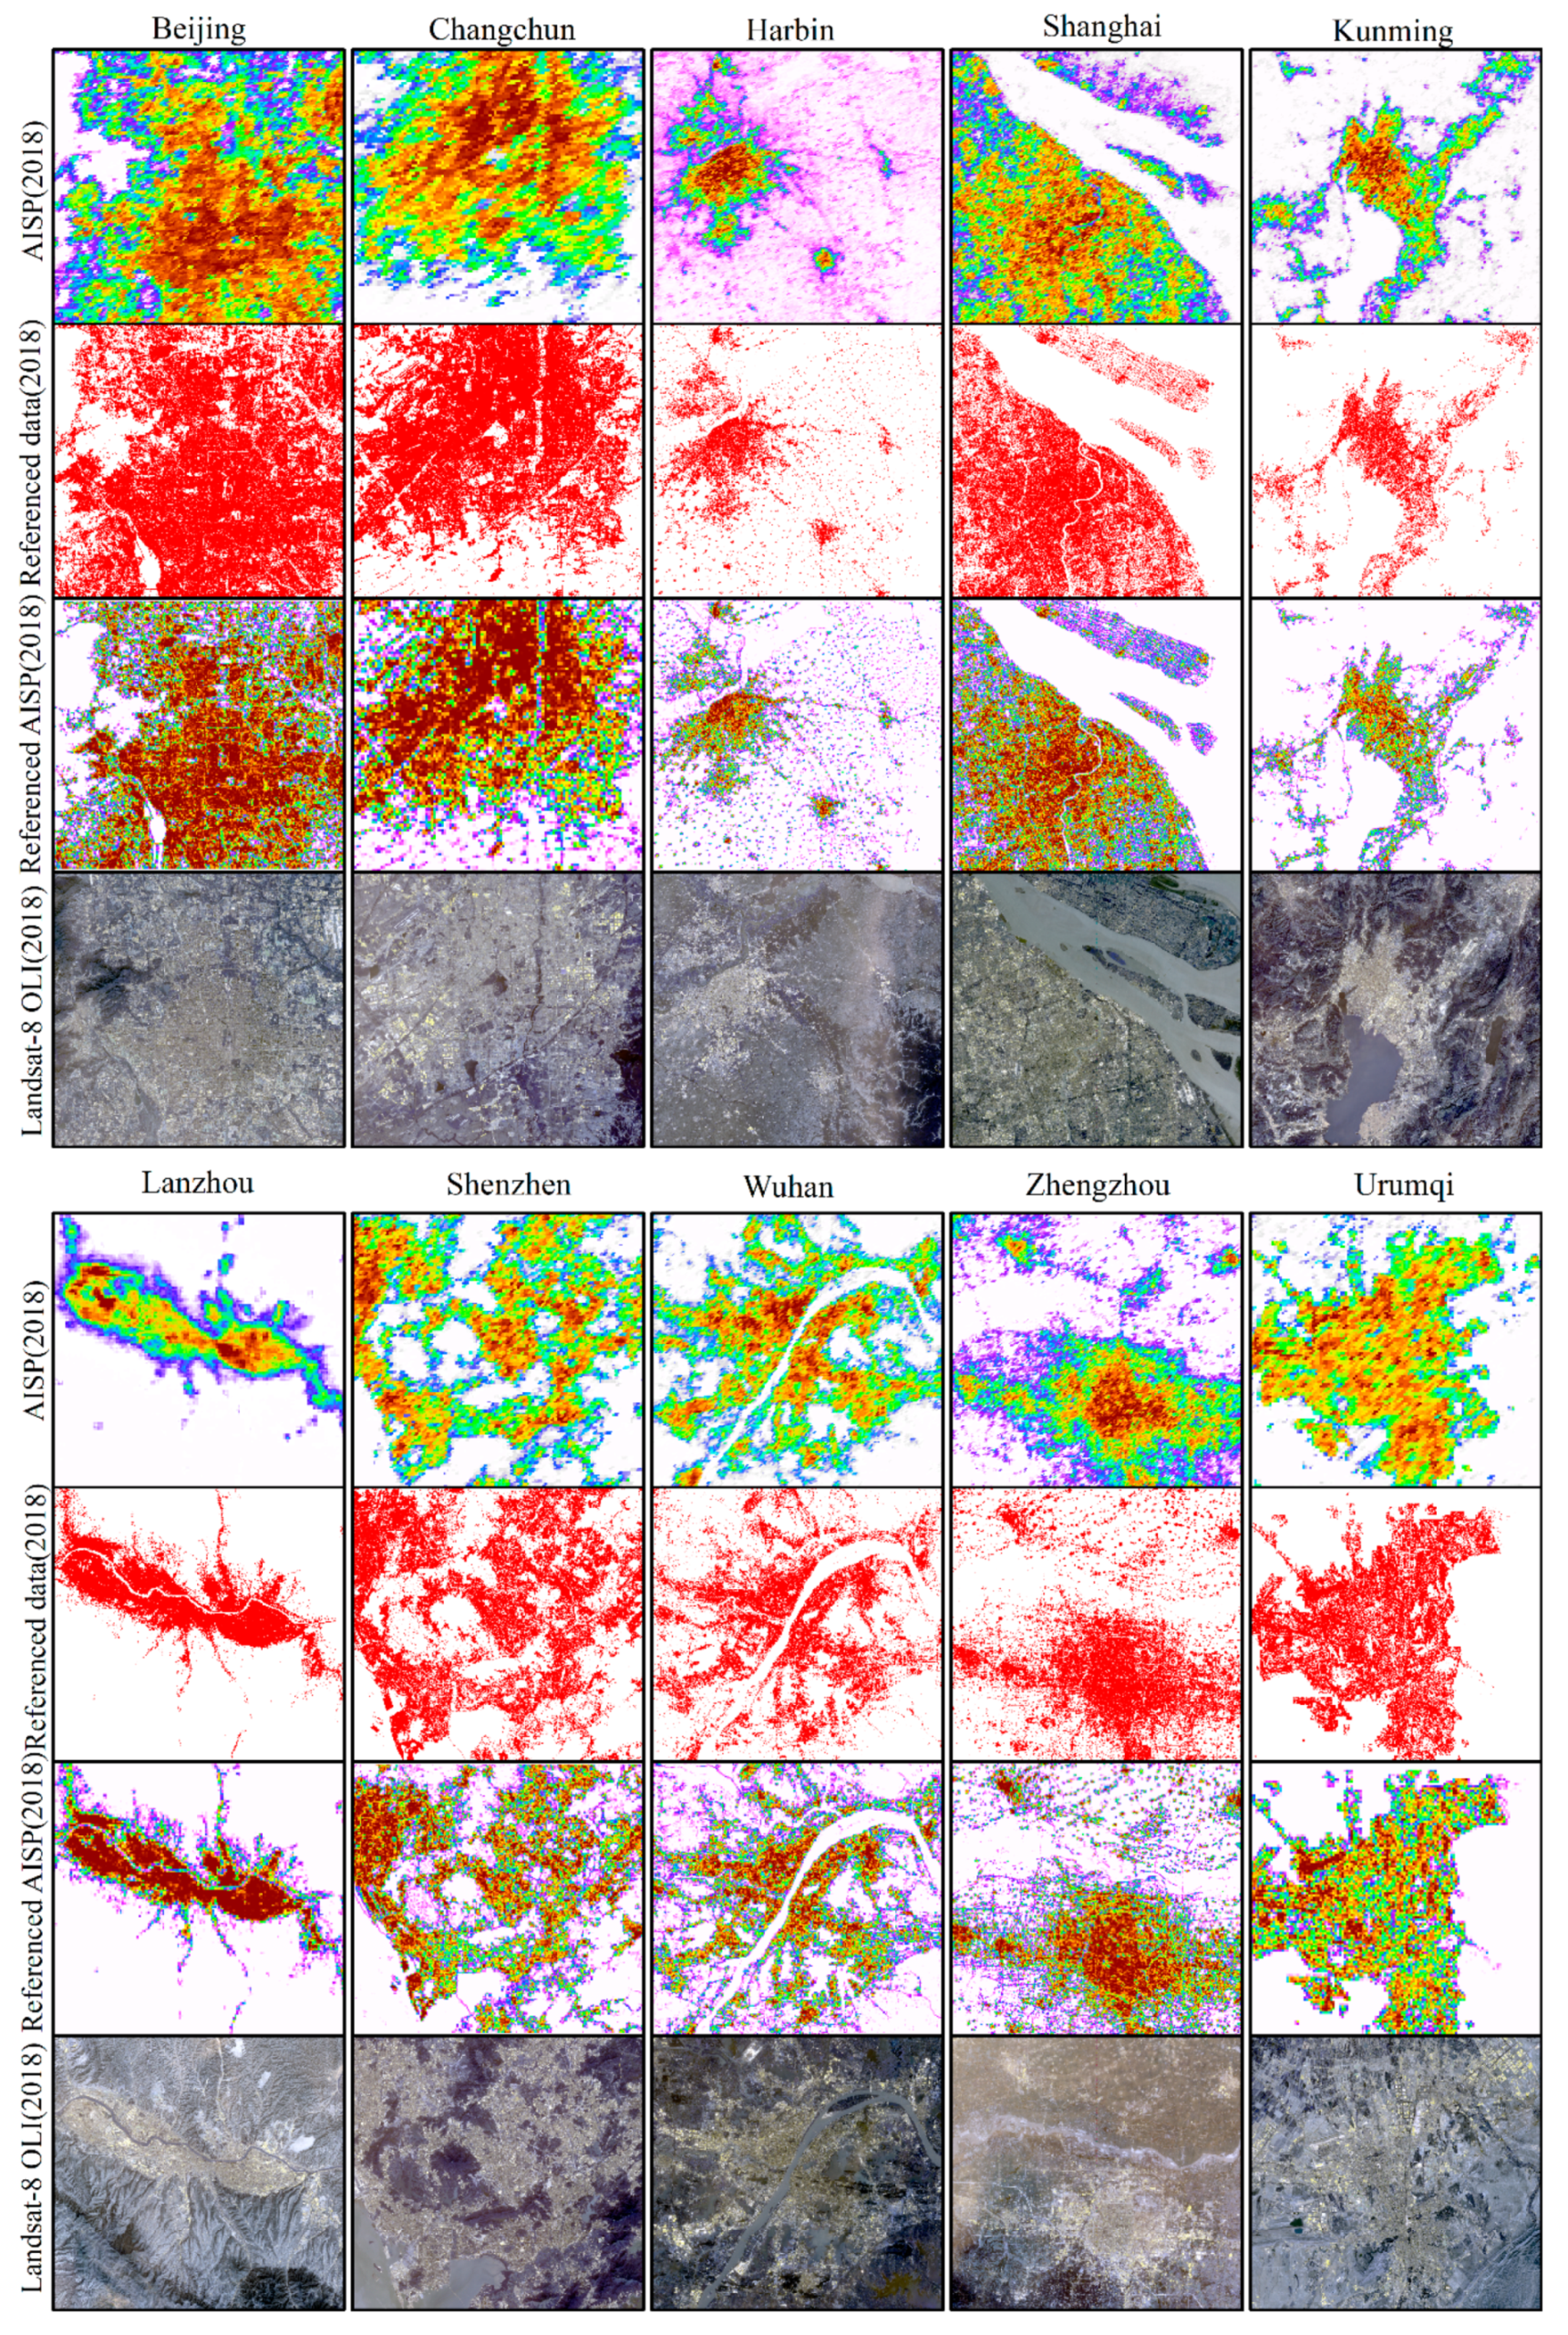
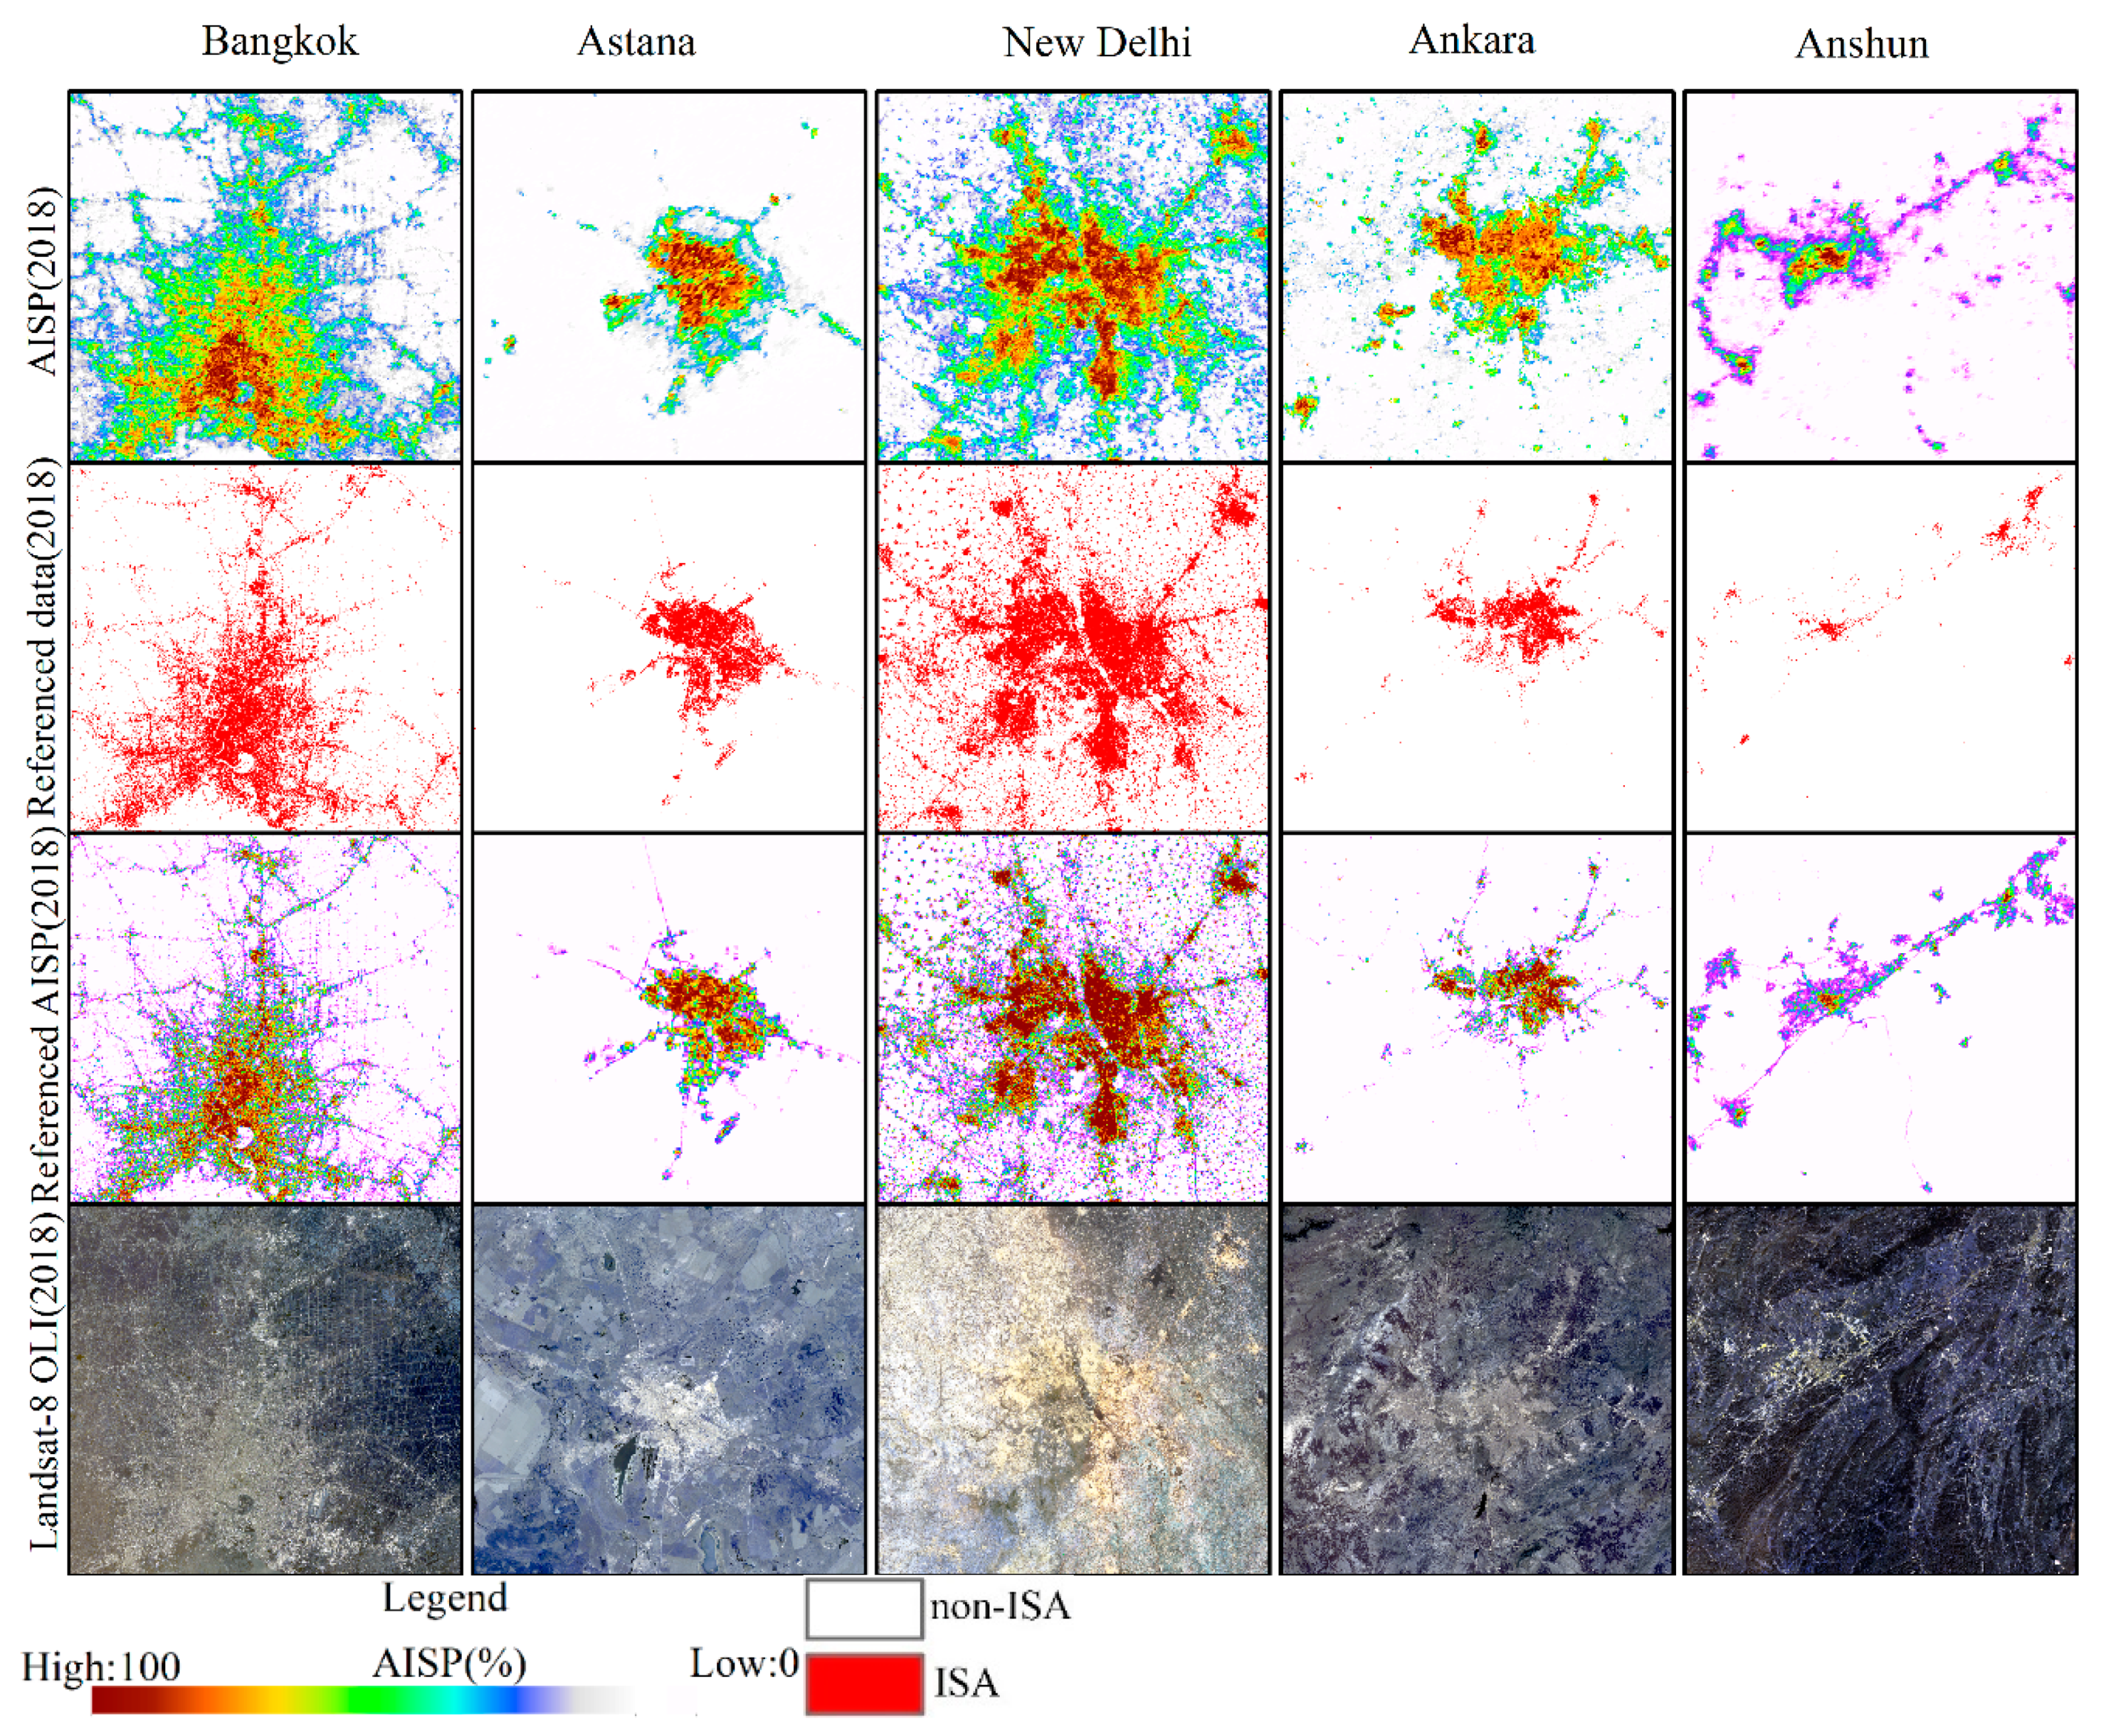
3.3. Analysis of Predicted Results of AISP in Typical Cities

To further compare the performance of these methods, typical cities in Asia were selected for accuracy assessment. As shown in Table 5, the R2s based on our proposed model are significantly higher than those of the LISI and MISI models in typical cities, which implies that for AISP estimation in city area, our proposed method also can achieve good performance. This is especially the case for cities located in northern and western China such as Lanzhou, Urumqi, and Zhengzhou, where vegetation coverage is relatively low and bare soil is widely distributed. In this case, the methods based on a single feature cannot obtain good performance. In contrast, our proposed method based on multiple features can effectively improve the estimation accuracy. This shows that the proposed model has a good prediction ability. To further analyze the generalizability of the model, some typical Asian cities outside of China were also selected, including cities in Southeast Asia, South Asia, Central Asia, and West Asia. Amongst all these Asian cities, Astana and New Delhi show the most accurate predictions (R2 is 0.72 and 0.66, respectively, in 2018). This further demonstrates an enhanced ability for prediction as well as generalizability, which can be applied to the prediction of the percentage of large-area artificial impervious surface.
Scatterplots between referenced and predicted values using regression models are shown in Figure 6 for accuracy assessment in some typical cities in 2018. Figure 6 implies that there was a high agreement between these referenced and predicted values. This result demonstrates that our proposed method has good performance in AISP prediction. Figure 7 further shows the robustness and effectiveness of the proposed model. The extracted AISP could reflect the urban structure while reducing overprediction of urban areas, particularly for those cities with relatively high percentage of urban greenspace (such as Shenzhen).

4. Discussion

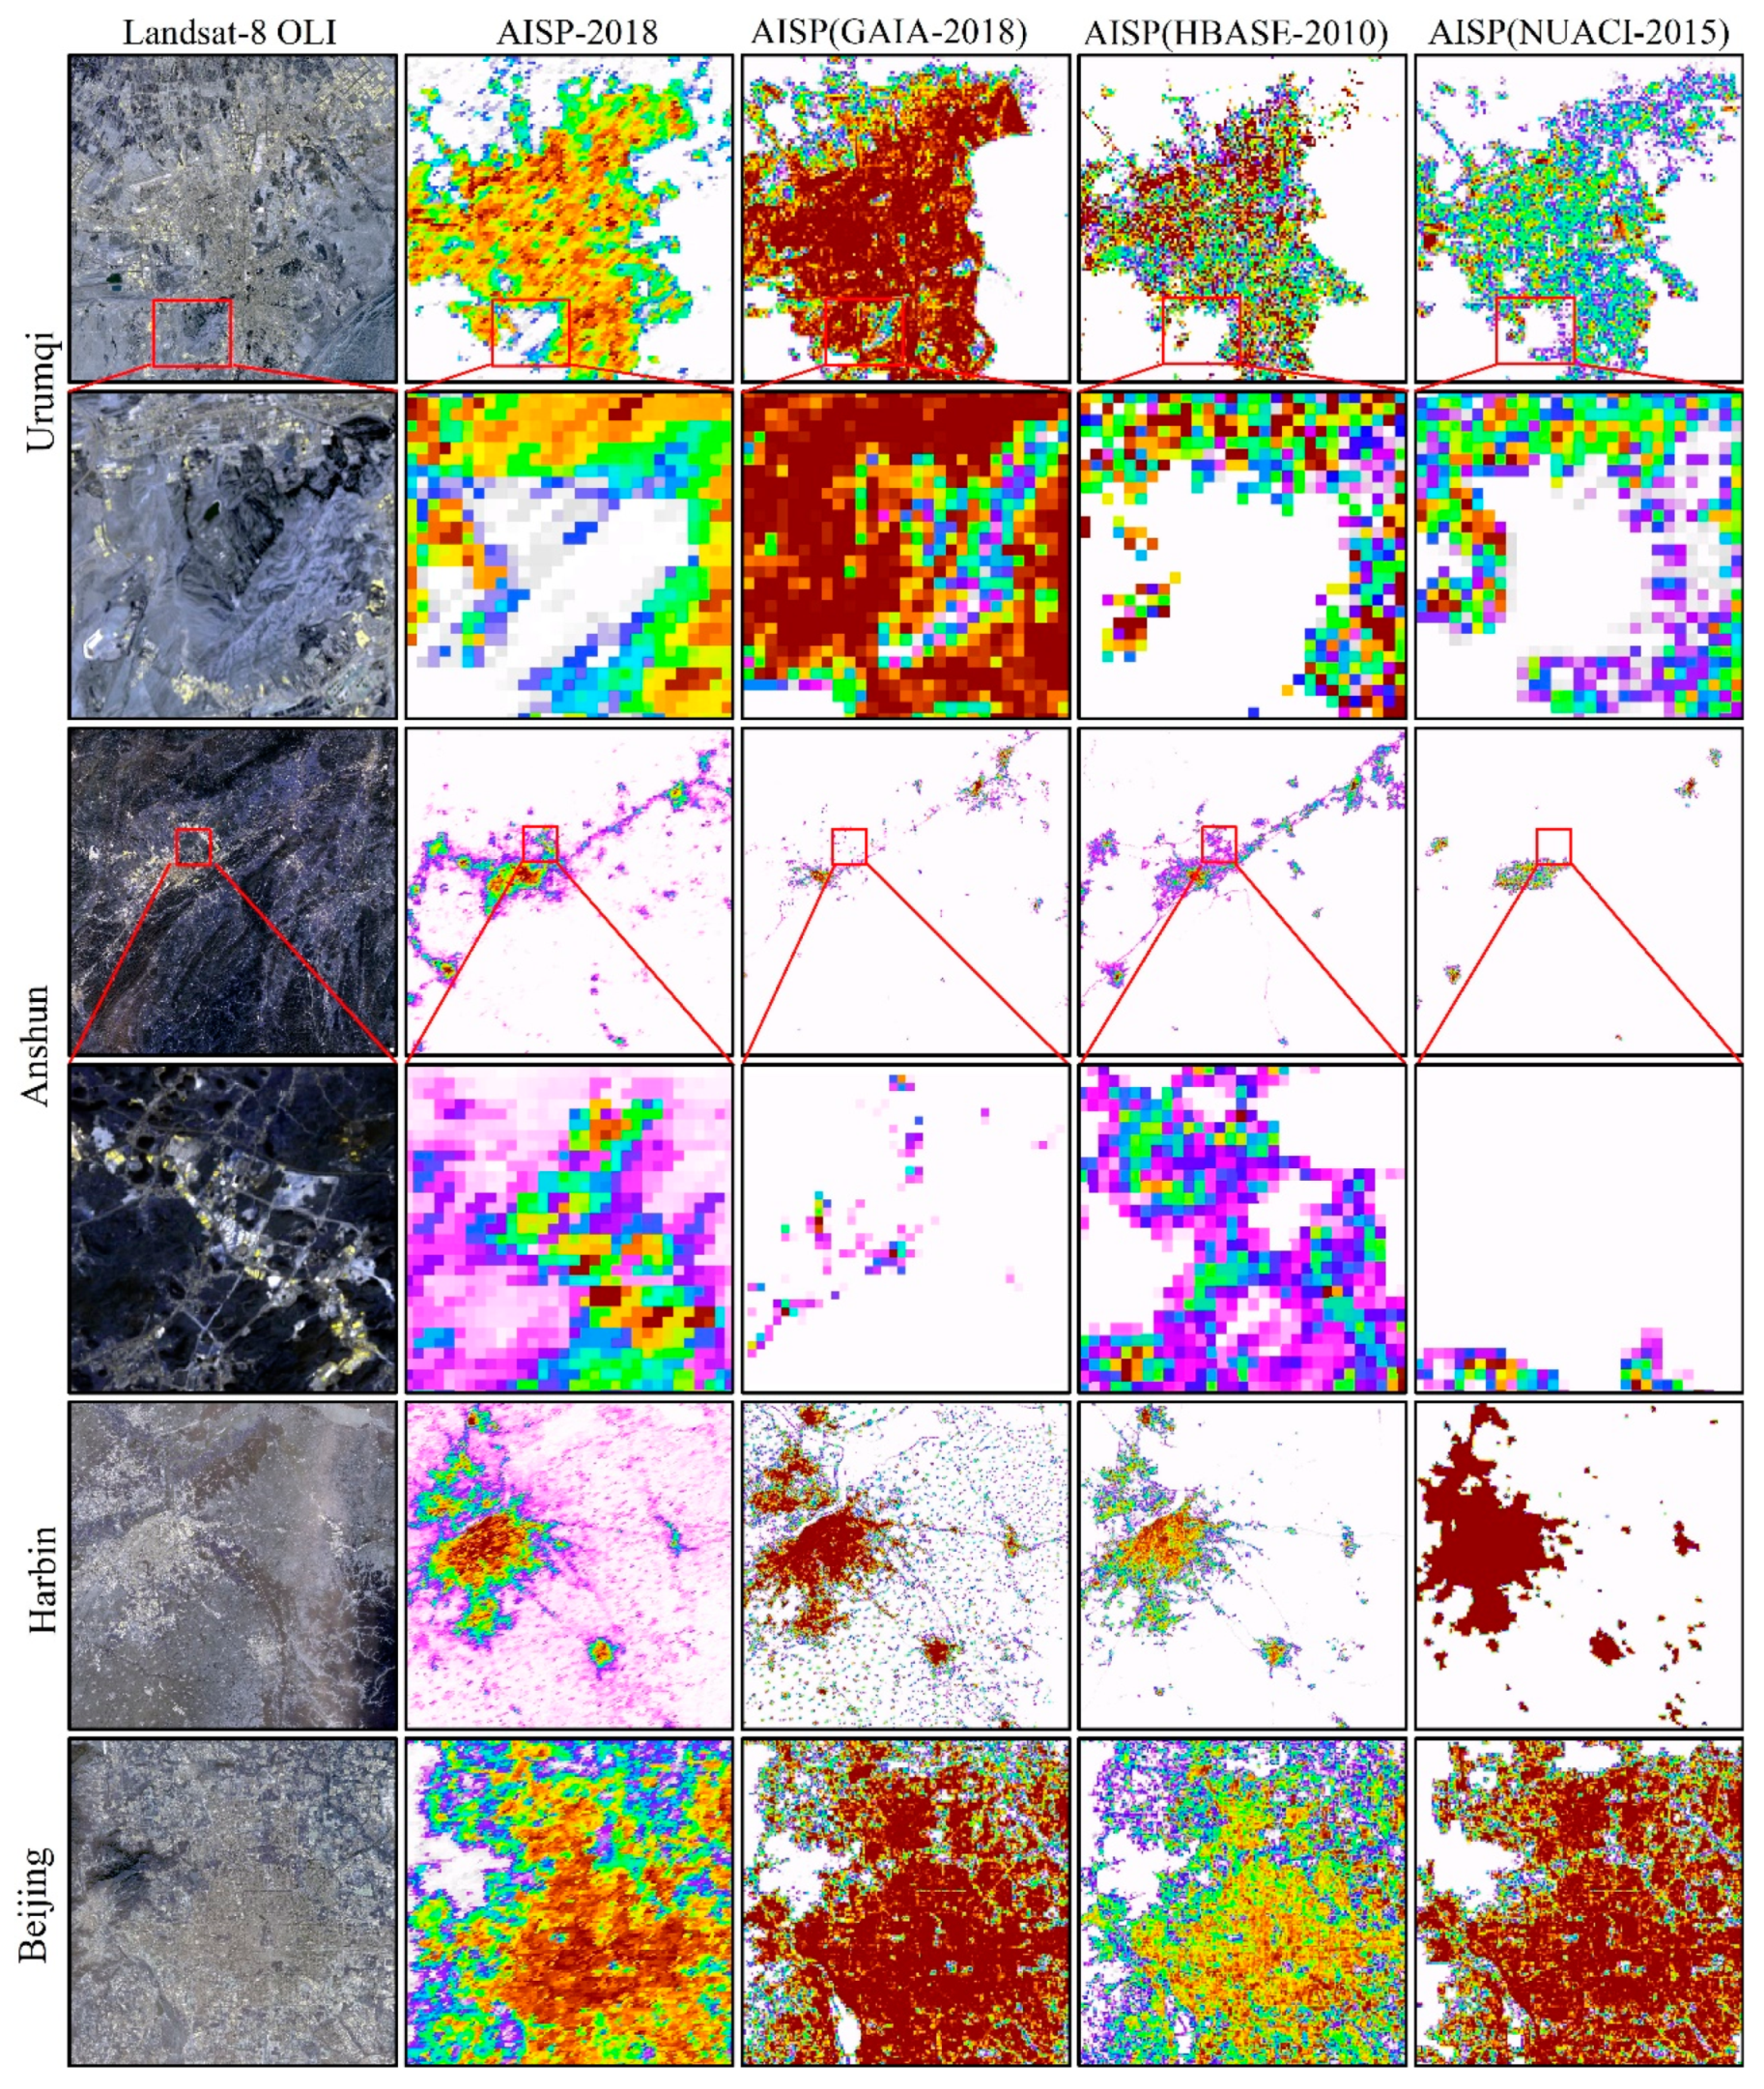
4.1. Comparative Analysis of Different Product Results in a Typical Area

To further validate the proposed method, the predictions were analyzed and compared with existing global impervious surface products (GAIA, NUACI, and HBASE). The GAIA is a global artificial impervious surface product [70]. This dataset is based on multi-season Landsat images and combined with auxiliary data to produce global impervious surface products from 1985 to 2018. Liu et al. provided another multi-temporal global impervious surface product (NUACI) using night light data and Landsat images [39]. The HBASE dataset was the first impervious surface product at a spatial resolution of 30 m globally. It is produced through the fusion of multi-source remotely sensed data and has a high accuracy for extracting global impervious surfaces [71]. We considered the performance of the current impervious surface inversion methods comprehensively in different regions. Four case areas from 15 cities were selected as representative regions for quantitative analysis. These include a bare-soil-prevalent region (Urumqi, China), a region with poor data quality (Anshun, China), a region surrounded with rural settlements (Harbin, China), and a megacity (Beijing, China). There are huge challenges for these regions to acquire impervious surface information accurately.
As shown in Figure 8, in Anshun (a cloudy and rainy area), GAIA-2018 and NUACI-2015 underpredicted significantly the impervious surface of the city and surrounding areas. The reason for the underprediction of GAIA-2018 data may be the influence of Landsat image data quality (e.g., cloud cover) and sample points. The underprediction of NUACI-2015 is due to the segmentation threshold, which leads to the omission of impervious surfaces. However, HBASE-2010 and AISP-2018 were accurate in this area. There are a large number of rural settlements surrounding the city of Harbin. The AISP-2018 and GAIA-2018 not only reflect the impervious surface information of the core urban area but also extract the scattered information of the rural settlements accurately. Although NUACI-2015 and HBASE-2010 characterize the impervious surface information of urban areas accurately, they miss the surrounding rural settlements. In addition, HBASE-2010 overpredicts the impervious surface information in the core area of the city. As a representative city in arid regions, Urumqi has bare soil around and inside the city. As shown in the zoomed-in area in Figure 8, GAIA-2018 mixed bare soil and impervious surfaces and misclassified the bare soil as impervious surface, resulting in overprediction of impervious surfaces. AISP-2018 eliminated the bare soil information in this area. NUACI-2015 tends to underpredict the impervious surface of the city. HBASE-2010 maintains the same effect as AISP-2018 for impervious surface extraction.
To evaluate the performance of our results quantitatively and compare with other global impervious surface datasets, four typical regions were selected. For each verification region, 1000–2500 samples were randomly collected for evaluation. For other datasets, they were converted into impervious surface percentage data with the same spatial resolution. The reference data are obtained based on Landsat 8 images. As shown in Table 6, compared with HBASE and NUACI products, our proposed method achieved better performance. While compared with GAIA product, our method obtained lower accuracy in some big and developed cities such as Harbin and Beijing but obtained significant improvement for some cities such as Urumqi and Anshun, which indicates that our proposed method has better adaptability in some areas with less vegetation overage and difficult data acquisition.
In summary, compared with existing products, our proposed method of integrating multi-temporal MODIS and VIIRS NTL data can achieve better results in the cloudy and rainy areas, as well as in rural areas.

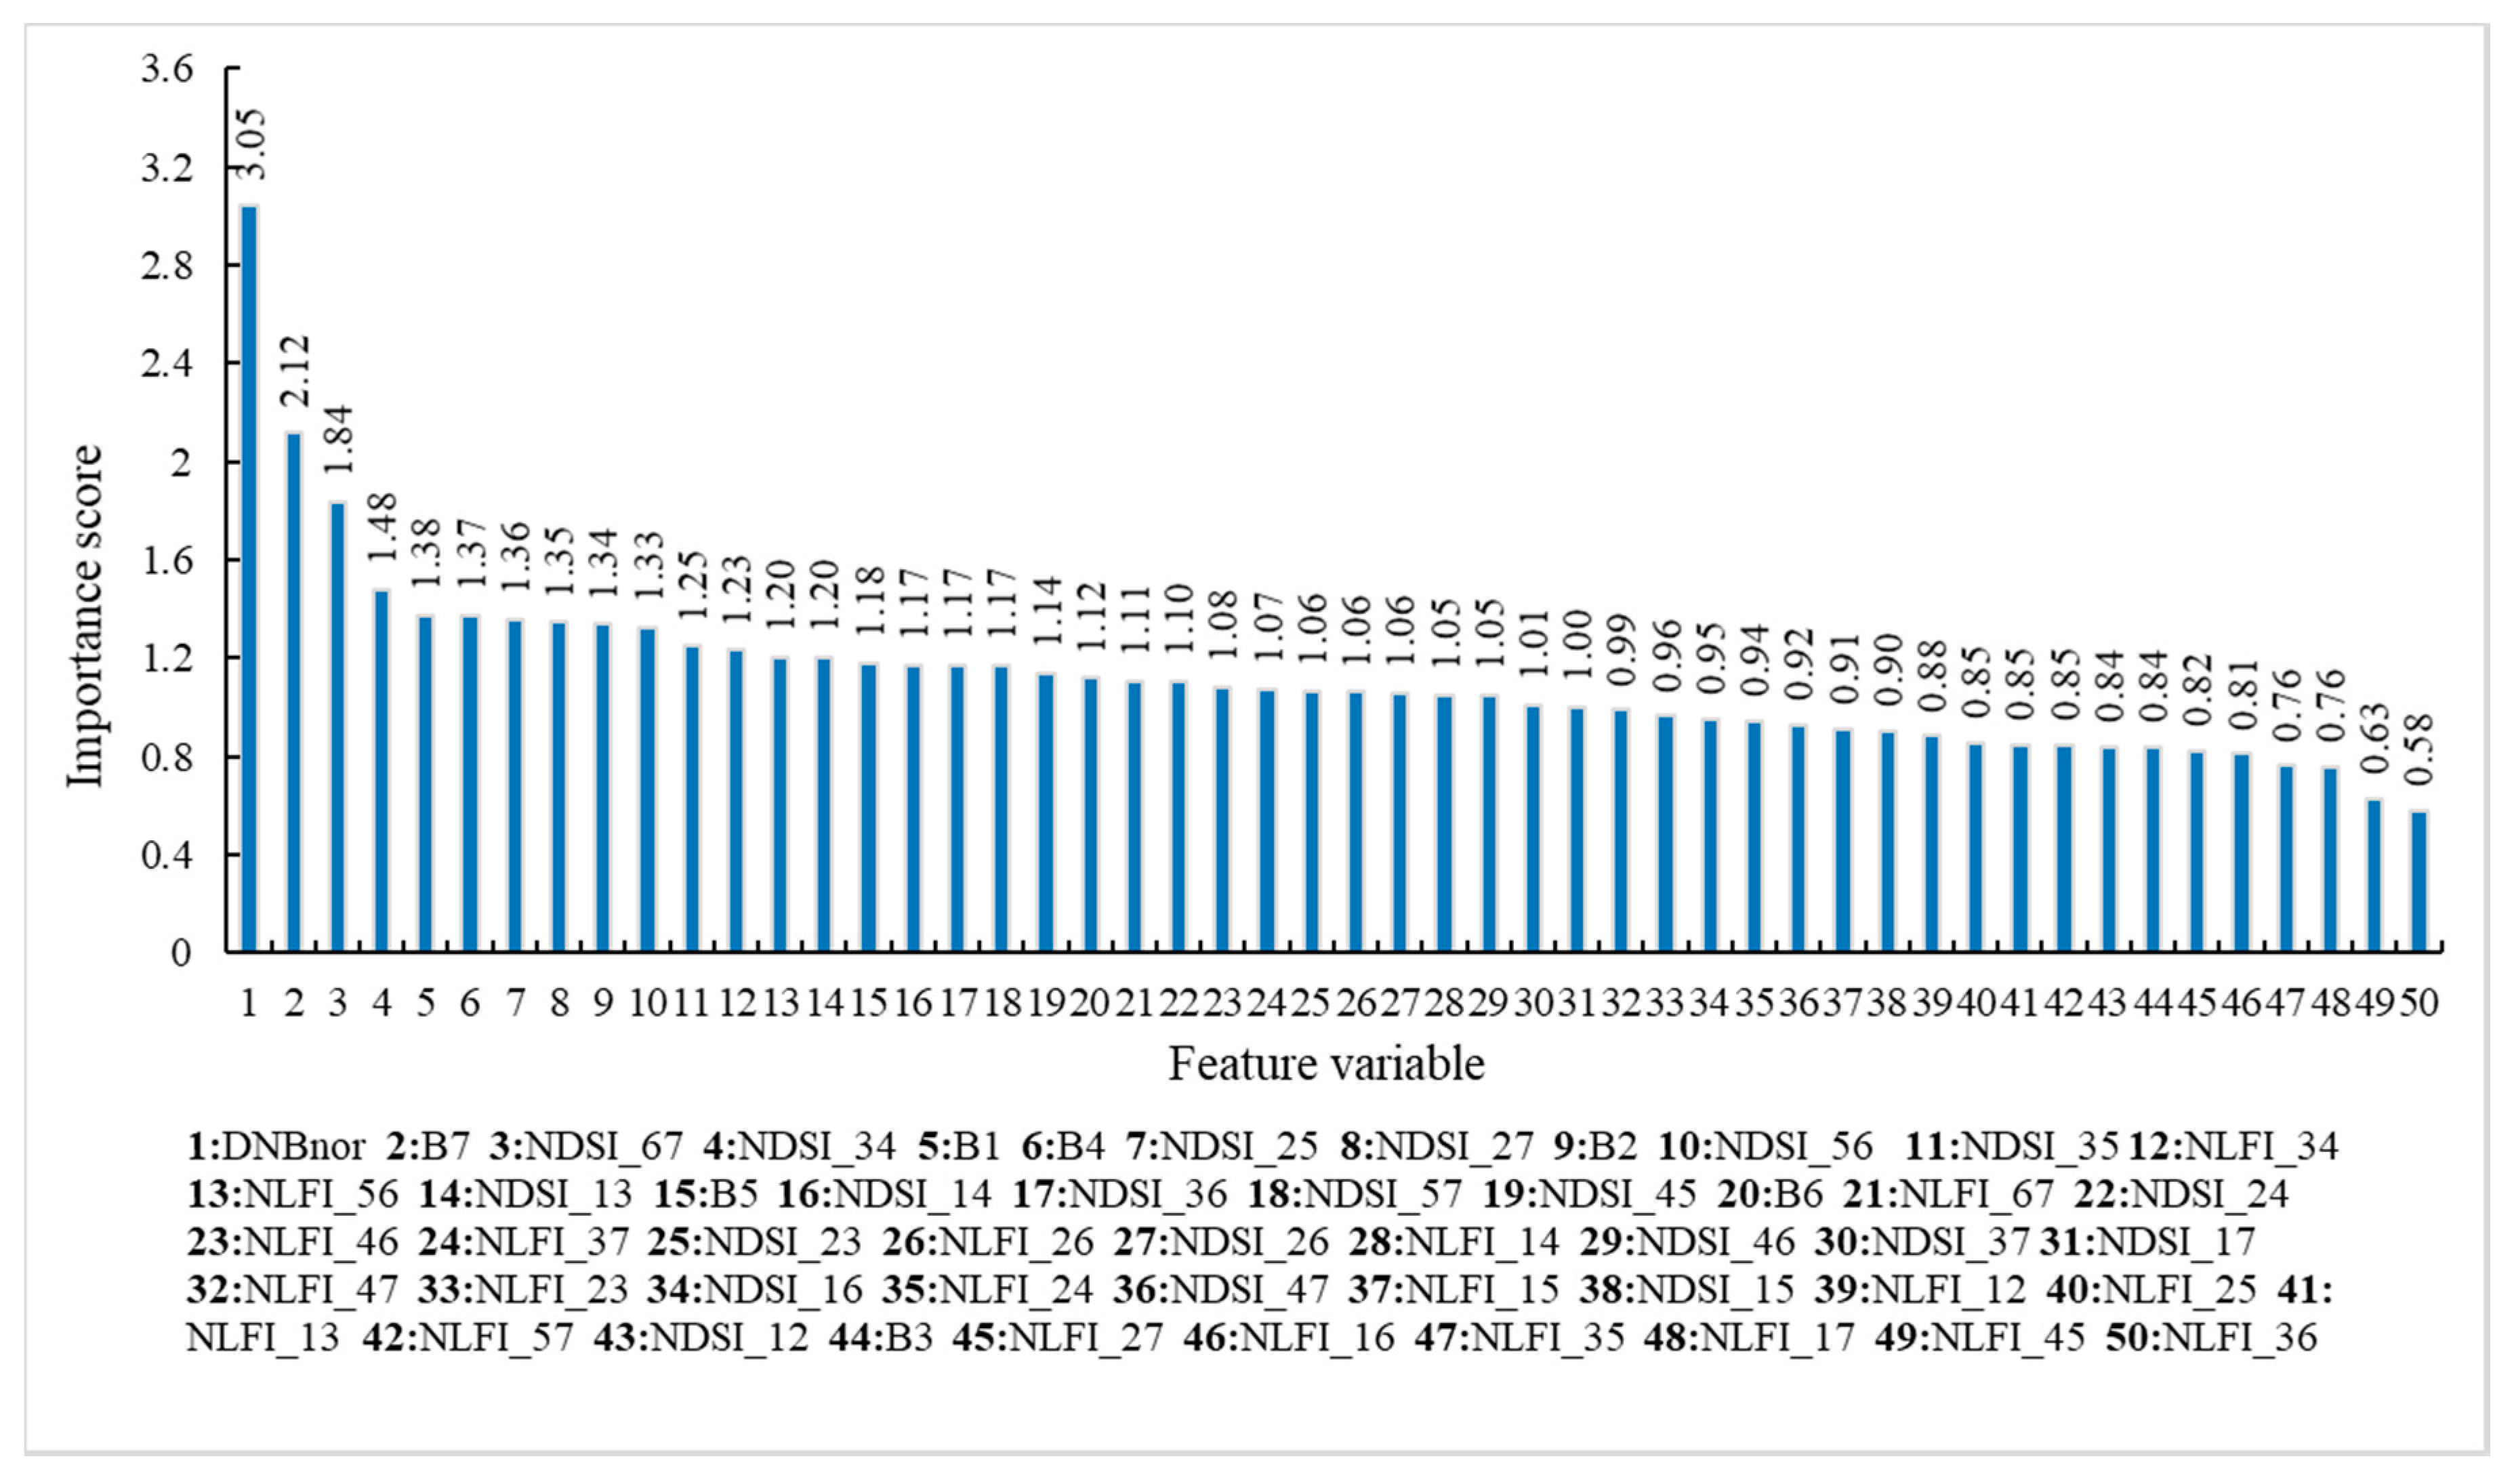
4.2. Feature Importance Analysis

From the above results, the effective increase of features can improve the accuracy of prediction, and the contribution of various features to the prediction capability of the model varies greatly. To evaluate the importance of input features, the feature importance score was used to quantify the contribution of each feature to the model. The result is illustrated in Figure 3, and the importance of different features is represented visually by histograms for large-scale impervious surface prediction. The importance of D N B n o r is significantly higher than any other features, because the nighttime light is mainly derived from artificial light sources that are closely related to human activities. Impervious surface information can be obtained based on the position and intensity of nighttime light [72]. Since there is a positive correlation between the degree of impervious surface and the intensity of nighttime light [73], a number of previous research has been carried out to extract impervious surface information using nighttime light data [74,75]. In this study, the advantage of nighttime light is taken into account, so it is introduced as a feature variable in the prediction model.
The features with high importance scores also include B7, NDSI_67, and NDSI_34. Amongst them, B7 denotes the spectral reflectance of multi-temporal fusion, which is the characteristic response of impervious surface on remotely sensed imagery and is related to urban identification. At the same time, band 6 and band 7 are commonly used bands in urban information extraction, so the combination of them can describe impervious surface information effectively. Meanwhile, band 3 and band 4 of MODIS are the narrow blue band and green band, respectively. The difference in spectral reflectance on blue band does not have much difference for various coverage types, and the green band is sensitive to the vegetation in the mixed pixels. Therefore, the combination of them can describe impervious surface information effectively.

5. Conclusions

The overall aim of this paper was to solve the problem of insufficient features for large-area impervious surface extraction using traditional approaches. Here, we develop a robust feature set by fusing multi-temporal MODIS and VIIRS DNB data for the prediction of large-area impervious surface percentage. First, based on multi-temporal MODIS and VIIRS DNB data, three methods were proposed to extract multi-temporal spectral features, index features, and fusion features of nighttime light data in four different experimental schemes. Then, the random forest algorithm was applied for feature selection and the prediction of large-area artificial impervious surface percentage. To validate the proposed model, fifteen typical cities from different regions of Asia were selected, and a detailed accuracy assessment was undertaken for each. The results demonstrated the high accuracy and robustness of the proposed model for each of these typical cities. Finally, several existing global impervious surface datasets (GAIA, NUACI, HBASE) were considered to provide a benchmark comparison. The results demonstrated that the total impervious surface area of Asia predicted by the proposed method was similar to the area calculated by GAIA in 2013 and 2018, and, in some areas (e.g., arid areas and cloudy areas), showed advantages for impervious surface extraction. Therefore, the use of the proposed multi-feature prediction model by fusing multi-temporal MODIS and VIIRS DNB data can lead to high accuracy and robustness in the prediction of AISP. In the future, we would like to develop the method further through new fusion techniques and generalize the model into global impervious surface estimation.

Author Contributions

Conceptualization, F.L.; methodology, F.L. and E.L.; validation, F.L., C.Z. and C.L.; formal analysis, W.L.; writing—original draft preparation, F.L., E.L., and C.Z.; writing—review and editing, A.S. and P.M.A. All authors have read and agreed to the published version of the manuscript.

Funding

This research was jointly funded by National Natural Science Foundation of China (NSFC) under Grant No. 41801327, The Youth Innovation Promotion Association Foundation of the Chinese Academy of Sciences under Grant No. 2018476, National Natural Science Foundation of China under Grant No. 41701380, and A Project funded by the Priority Academic Program Development of Jiangsu Higher Education Institutions (PAPD).

Informed Consent Statement

Informed consent was obtained from all subjects involved in the study.

Data Availability Statement

Data available on request due to restrictions eg privacy or ethical. The data presented in this study are available on request from the corresponding author.

Acknowledgments

This study is jointly supported by the by National Natural Science Foundation of China (NSFC) under Grant No. 41801327, National Natural Science Foundation of China under Grant No. 41701380, and A Project funded by the Priority Academic Program Development of Jiangsu Higher Education Institutions (PAPD).

Conflicts of Interest

The authors declare no conflict of interest.

References

  1. Arnold, C.L.J.; Gibbons, C.J. Impervious surface coverage: The emergence of a key environmental indicator. J. Am. Plan. Assoc. 1996, 62, 243–258. [Google Scholar] [CrossRef]
  2. Schueler, T. The importance of imperviousness. Watershed Prot. Tech. 1994, 1, 100–101. [Google Scholar]
  3. Gao, F.; Colstoun, E.B.D.; Ma, R.; Weng, Q.; Masek, J.G.; Chen, J.; Pan, Y.; Song, C. Mapping impervious surface expansion using medium-Resolution satellite image time series: A case study in the Yangtze River Delta, China. Int. J. Remote Sens. 2012, 33, 7609–7628. [Google Scholar] [CrossRef]
  4. Weng, Q. Modeling urban growth effects on surface runoff with the integration of remote sensing and GIS. Environ. Manag. 2001, 28, 737–748. [Google Scholar] [CrossRef] [PubMed]
  5. Xu, H. Quantitative analysis on the relationship of urban impervious surface with other components of the urban ecosystem. Acta Ecol. Sin. 2009, 29, 2456–2462. [Google Scholar]
  6. Grimmond, S.U. Urbanization and global environmental change: Local effects of urban warming. Geogr. J. 2007, 173, 83–88. [Google Scholar] [CrossRef]
  7. Bierwagen, B.G.; Theobald, D.M.; Pyke, C.R.; Choate, A.; Groth, P.; Thomas, J.V.; Morefield, P. National Housing and Impervious Surface Scenarios for Integrated Climate Impact Assessments; Proceedings of the National Academy of Sciences: Washington, DC, USA, 2010; Volume 107, pp. 20887–20892. [Google Scholar]
  8. Shao, Z.; Fu, H.; Li, D.; Altan, O.; Cheng, T. Remote sensing monitoring of multi-scale watersheds impermeability for urban hydrological evaluation. Remote Sens. Environ. 2019, 232, 111338. [Google Scholar] [CrossRef]
  9. Phinn, S.; Stanford, M.; Scarth, P.; Murray, A.; Shyy, P. Monitoring the composition of urban environments based on the vegetation-Impervious surface-Soil (VIS) model by subpixel analysis techniques. Int. J. Remote Sens. 2002, 23, 4131–4153. [Google Scholar] [CrossRef]
  10. Wu, J. Urban ecology and sustainability: The State-Of-The-Science and future directions. Landsc. Urban Plan. 2014, 125, 209–221. [Google Scholar] [CrossRef]
  11. Lu, D.; Moran, E.; Hetrick, S.; Li, G. Mapping impervious surface distribution with the integration of Landsat TM and QuickBird images in a complex urban-Rural frontier in Brazil. In Advances of Environmental Remote Sensing to Monitor Global Changes; CRC Press/Taylor and Francis: Boca Raton, FL, USA, 2011; pp. 277–296. [Google Scholar]
  12. Goetz, S.J.; Wright, R.K.; Smith, A.J.; Zinecker, E.; Schaub, E. IKONOS imagery for resource management: Tree cover, impervious surfaces, and riparian buffer analyses in the mid-Atlantic region. Remote Sens. Environ. 2003, 88, 195–208. [Google Scholar] [CrossRef]
  13. Cao, X.; Gao, X.; Shen, Z.; Li, R. Expansion of Urban Impervious Surfaces in Xining City Based on GEE and Landsat Time Series Data. IEEE Access 2020, 8, 147097–147111. [Google Scholar] [CrossRef]
  14. Zhang, Y.; Balzter, H.; Liu, B.; Chen, Y. Analyzing the impacts of urbanization and seasonal variation on land surface temperature based on subpixel fractional covers using Landsat images. IEEE J. Sel. Top. Appl. Earth Obse. Remote Sens. 2016, 10, 1344–1356. [Google Scholar] [CrossRef] [Green Version]
  15. Guan, Y.; Zhou, Y.; He, B.; Liu, X.; Zhang, H.; Feng, S. Improving Land Cover Change Detection and Classification With BRDF Correction and Spatial Feature Extraction Using Landsat Time Series: A Case of Urbanization in Tianjin, China. IEEE J. Sel. Top. Appl. Earth Obs. Remote Sens. 2020, 13, 4166–4177. [Google Scholar] [CrossRef]
  16. Chen, J.; Gong, P.; He, C.; Luo, W.; Tamura, M.; Shi, P. Assessment of the urban development plan of Beijing by using a CA-based urban growth model. Photogramm. Eng. Remote Sens. 2002, 68, 1063–1072. [Google Scholar]
  17. Ju, J.; Roy, D.P. The availability of cloud-Free Landsat ETM+ data over the conterminous United States and globally. Remote Sens. Environ. 2008, 112, 1196–1211. [Google Scholar] [CrossRef]
  18. Sun, G.; Chen, X.; Ren, J.; Zhang, A.; Jia, X. Stratified spectral mixture analysis of medium resolution imagery for impervious surface mapping. Int. J. Appl. Earth Obs. Geoinf. 2017, 60, 38–48. [Google Scholar] [CrossRef] [Green Version]
  19. Li, W.; Wu, C. Phenology-Based temporal mixture analysis for estimating large-Scale impervious surface distributions. Int. J. Remote Sens. 2014, 35, 779–795. [Google Scholar] [CrossRef]
  20. Wu, C.; Murray, A.T. Estimating impervious surface distribution by spectral mixture analysis. Remote Sens. Environ. 2003, 84, 493–505. [Google Scholar] [CrossRef]
  21. Li, W.; Wu, C. A geostatistical temporal mixture analysis approach to address endmember variability for estimating regional impervious surface distributions. GIScience Remote Sens. 2016, 53, 102–121. [Google Scholar] [CrossRef]
  22. Deng, C.; Wu, C. The use of single-Date MODIS imagery for estimating large-Scale urban impervious surface fraction with spectral mixture analysis and machine learning techniques. ISPRS J. Photogramm. Remote Sens. 2013, 86, 100–110. [Google Scholar] [CrossRef]
  23. Deng, C. Incorporating endmember variability into linear unmixing of coarse resolution imagery: Mapping large-Scale impervious surface abundance using a hierarchically object-Based spectral mixture analysis. Remote Sens. 2015, 7, 9205–9229. [Google Scholar] [CrossRef] [Green Version]
  24. Zhou, T.; Zhao, M.; Sun, C.; Pan, J. Exploring the impact of seasonality on urban land-Cover mapping using multi-Season sentinel-1a and gf-1 wfv images in a subtropical monsoon-Climate region. ISPRS Int. J. Geo-Inf. 2018, 7, 3. [Google Scholar] [CrossRef] [Green Version]
  25. Goldblatt, R.; Stuhlmacher, M.F.; Tellman, B.; Clinton, N.; Hanson, G.; Georgescu, M.; Wang, C.; Serrano-Candela, F.; Khandelwal, A.K.; Cheng, W.-H. Using Landsat and nighttime lights for supervised pixel-based image classification of urban land cover. Remote Sens. Environ. 2018, 205, 253–275. [Google Scholar] [CrossRef]
  26. Weng, Q. Remote sensing of impervious surfaces in the urban areas: Requirements, methods, and trends. Remote Sens. Environ. 2012, 117, 34–49. [Google Scholar] [CrossRef]
  27. Xu, H. Analysis of impervious surface and its impact on urban heat environment using the normalized difference impervious surface index (NDISI). Photogramm. Eng. Remote Sens. 2010, 76, 557–565. [Google Scholar] [CrossRef]
  28. Sun, Z.; Wang, C.; Guo, H.; Shang, R. A modified normalized difference impervious surface index (MNDISI) for automatic urban mapping from Landsat imagery. Remote Sens. 2017, 9, 942. [Google Scholar] [CrossRef] [Green Version]
  29. Henderson, M.; Yeh, E.T.; Gong, P.; Elvidge, C.; Baugh, K. Validation of urban boundaries derived from global night-Time satellite imagery. Int. J. Remote Sens. 2003, 24, 595–609. [Google Scholar] [CrossRef]
  30. Kuang, W.; Liu, J.; Zhang, Z.; Lu, D.; Xiang, B. Spatiotemporal dynamics of impervious surface areas across China during the early 21st century. Chin. Sci. Bull. 2013, 58, 1691–1701. [Google Scholar] [CrossRef] [Green Version]
  31. Shao, Z.; Liu, C. The integrated use of DMSP-OLS nighttime light and MODIS data for monitoring large-scale impervious surface dynamics: A case study in the Yangtze River Delta. Remote Sens. 2014, 6, 9359–9378. [Google Scholar] [CrossRef] [Green Version]
  32. Guo, W.; Li, G.; Ni, W.; Zhang, Y.; Lu, D. Exploring improvement of impervious surface estimation at national scale through integration of nighttime light and proba-V data. GIScience Remote Sens. 2018, 55, 699–717. [Google Scholar] [CrossRef]
  33. Lu, D.; Li, G.; Kuang, W.; Moran, E. Methods to extract impervious surface areas from satellite images. Int. J. Digit. Earth 2014, 7, 93–112. [Google Scholar] [CrossRef]
  34. Kaspersen, P.S.; Fensholt, R.; Drews, M. Using Landsat vegetation indices to estimate impervious surface fractions for European cities. Remote Sens. 2015, 7, 8224–8249. [Google Scholar] [CrossRef] [Green Version]
  35. Okujeni, A.; Canters, F.; Cooper, S.D.; Degerickx, J.; Heiden, U.; Hostert, P.; Priem, F.; Roberts, D.A.; Somers, B.; Linden, S.V.D. Generalizing machine learning regression models using multi-Site spectral libraries for mapping vegetation-Impervious-Soil fractions across multiple cities. Remote Sens. Environ. 2018, 216, 482–496. [Google Scholar] [CrossRef]
  36. Gong, P.; Wang, J.; Yu, L.; Zhao, Y.; Zhao, Y.; Liang, L.; Niu, Z.; Huang, X.; Fu, H.; Liu, S. Finer resolution observation and monitoring of global land cover: First mapping results with Landsat TM and ETM+ data. Int. J. Remote Sens. 2013, 34, 2607–2654. [Google Scholar] [CrossRef] [Green Version]
  37. Qiu, C.; Schmitt, M.; Geiß, C.; Chen, T.-H.K.; Zhu, X.X. A framework for large-Scale mapping of human settlement extent from Sentinel-2 images via fully convolutional neural networks. ISPRS J. Photogramm. Remote Sens. 2020, 163, 152–170. [Google Scholar] [CrossRef]
  38. Gong, P.; Li, X.; Zhang, W. 40-Year (1978–2017) human settlement changes in China reflected by impervious surfaces from satellite remote sensing. Sci. Bull. 2019, 64, 756–763. [Google Scholar] [CrossRef] [Green Version]
  39. Liu, X.; Hu, G.; Chen, Y.; Li, X.; Xu, X.; Li, S.; Pei, F.; Wang, S. High-Resolution multi-Temporal mapping of global urban land using Landsat images based on the Google Earth Engine Platform. Remote Sens. Environ. 2018, 209, 227–239. [Google Scholar] [CrossRef]
  40. Sun, Z.; Xu, R.; Du, W.; Wang, L.; Lu, D. High-Resolution urban land mapping in China from sentinel 1A/2 imagery based on Google Earth Engine. Remote Sens. 2019, 11, 752. [Google Scholar] [CrossRef] [Green Version]
  41. Roy, D.P.; Ju, J.; Kline, K.; Scaramuzza, P.L.; Kovalskyy, V.; Hansen, M.; Loveland, T.R.; Vermote, E.; Zhang, C. Web-Enabled Landsat Data (WELD): Landsat ETM+ composited mosaics of the conterminous United States. Remote Sens. Environ. 2010, 114, 35–49. [Google Scholar] [CrossRef]
  42. Yang, F.; Matsushita, B.; Fukushima, T.; Yang, W. Temporal mixture analysis for estimating impervious surface area from multi-temporal MODIS NDVI data in Japan. ISPRS J. Photogramm. Remote Sens. 2012, 72, 90–98. [Google Scholar] [CrossRef] [Green Version]
  43. Zhang, Q.; Seto, K.C. Mapping urbanization dynamics at regional and global scales using multi-Temporal DMSP/OLS nighttime light data. Remote Sens. Environ. 2011, 115, 2320–2329. [Google Scholar] [CrossRef]
  44. Zhang, Q.; Schaaf, C.; Seto, K.C. The vegetation adjusted NTL urban index: A new approach to reduce saturation and increase variation in nighttime luminosity. Remote Sens. Environ. 2013, 129, 32–41. [Google Scholar] [CrossRef]
  45. Guo, W.; Lu, D.; Kuang, W. Improving fractional impervious surface mapping performance through combination of DMSP-OLS and MODIS NDVI data. Remote Sens. 2017, 9, 375. [Google Scholar] [CrossRef] [Green Version]
  46. Zhuo, L.; Zheng, J.; Zhang, X.; Li, J.; Liu, L. An improved method of night-Time light saturation reduction based on EVI. Int. J. Remote Sens. 2015, 36, 4114–4130. [Google Scholar] [CrossRef]
  47. Liu, Y.; Yang, Y.; Jing, W.; Yao, L.; Yue, X.; Zhao, X. A new urban index for expressing inner-City patterns based on MODIS LST and EVI regulated DMSP/OLS NTL. Remote Sens. 2017, 9, 777. [Google Scholar] [CrossRef] [Green Version]
  48. Hao, R.; Yu, D.; Sun, Y.; Cao, Q.; Liu, Y.; Liu, Y. Integrating multiple source data to enhance variation and weaken the blooming effect of DMSP-OLS light. Remote Sens. 2015, 7, 1422–1440. [Google Scholar] [CrossRef] [Green Version]
  49. Small, C.; Milesi, C.; Elvidge, C.; Baugh, K.; Henebry, G.; Nghiem, S. The Land Cover Continuum; Multi-Sensor Characterization of Human-Modified Landscapes. In Proceedings of the EARSeL/NASA Joint Workshop on Land Use and Land Cover Berlin, Berlin, Germany, 17–18 March 2014. [Google Scholar]
  50. Small, C. Multisensor Characterization of Urban Morphology and Network Structure. Remote Sens. 2019, 11, 2162. [Google Scholar] [CrossRef] [Green Version]
  51. Elvidge, C.D.; Tuttle, B.T.; Sutton, P.C.; Baugh, K.E.; Howard, A.T.; Milesi, C.; Bhaduri, B.; Nemani, R. Global distribution and density of constructed impervious surfaces. Sensors 2007, 7, 1962–1979. [Google Scholar] [CrossRef]
  52. Guo, W.; Lu, D.; Wu, Y.; Zhang, J. Mapping impervious surface distribution with integration of SNNP VIIRS-DNB and MODIS NDVI data. Remote Sens. 2015, 7, 12459–12477. [Google Scholar] [CrossRef] [Green Version]
  53. Lin, Y.; Zhang, H.; Lin, H.; Gamba, P.E.; Liu, X. Incorporating synthetic aperture radar and optical images to investigate the annual dynamics of anthropogenic impervious surface at large scale. Remote Sens. Environ. 2020, 242, 111757. [Google Scholar] [CrossRef]
  54. Oliveira, S.; Oehler, F.; San-Miguel-Ayanz, J.; Camia, A.; Pereira, J.M. Modeling spatial patterns of fire occurrence in Mediterranean Europe using Multiple Regression and Random Forest. For. Ecol. Manag. 2012, 275, 117–129. [Google Scholar] [CrossRef]
  55. Li, X. Using “random forest” for classification and regression. Chin. J. Appl. Entomol. 2013, 50, 1190–1197. [Google Scholar]
  56. Anees, A.; Aryal, J.; O’Reilly, M.M.; Gale, T.J.; Wardlaw, T. A robust multi-Kernel change detection framework for detecting leaf beetle defoliation using Landsat 7 ETM+ data. ISPRS J. Photogramm. Remote Sens. 2016, 122, 167–178. [Google Scholar] [CrossRef]
  57. Anees, A.; Aryal, J. Near-Real time detection of beetle infestation in pine forests using MODIS data. IEEE J. Sel. Top. App. Earth Obs. Remote Sens. 2014, 7, 3713–3723. [Google Scholar] [CrossRef]
  58. Anees, A.; Aryal, J. A statistical framework for near-Real time detection of beetle infestation in pine forests using MODIS data. IEEE Geosci. Remote Sens. Lett. 2014, 11, 1717–1721. [Google Scholar] [CrossRef]
  59. Schneider, A.; Friedl, M.A.; Potere, D. Mapping global urban areas using MODIS 500-m data: New methods and datasets based on ‘urban ecoregions’. Remote Sens. Environ. 2010, 114, 1733–1746. [Google Scholar] [CrossRef]
  60. Pandey, B.; Joshi, P.; Seto, K.C. Monitoring urbanization dynamics in India using DMSP/OLS night time lights and SPOT-VGT data. Int. J. Appl. Earth Obs. Geoinf. 2013, 23, 49–61. [Google Scholar] [CrossRef]
  61. Deng, C.; Wu, C. BCI: A biophysical composition index for remote sensing of urban environments. Remote Sens. Environ. 2012, 127, 247–259. [Google Scholar] [CrossRef]
  62. Kauth, R.J.; Thomas, G. The tasselled cap-A graphic description of the spectral-Temporal development of agricultural crops as seen by Landsat. In Proceedings of the LARS Symposia, West Lafayette, IN, USA, 29 June–1 July 1976; p. 159. [Google Scholar]
  63. Mozumder, C.; Tripathi, N.; Tipdecho, T. Ecosystem evaluation (1989–2012) of Ramsar wetland Deepor Beel using satellite-Derived indices. Environ. Monit. Assess. 2014, 186, 7909–7927. [Google Scholar] [CrossRef]
  64. Yang, Z.; He, X. Automatic extraction of urban land-Use information from remote sensing images based on improved NDBI method. J. Hohai Univ. Nat. Sci. 2010, 38, 181–184. [Google Scholar]
  65. Huete, A.; Didan, K.; Miura, T.; Rodriguez, E.P.; Gao, X.; Ferreira, L.G. Overview of the radiometric and biophysical performance of the MODIS vegetation indices. Remote Sen. Environ. 2002, 83, 195–213. [Google Scholar] [CrossRef]
  66. Xie, Y.; Weng, Q. Updating urban extents with nighttime light imagery by using an object-Based thresholding method. Remote Sens. Environ. 2016, 187, 1–13. [Google Scholar] [CrossRef]
  67. Zhou, Y.; Smith, S.J.; Elvidge, C.D.; Zhao, K.; Thomson, A.; Imhoff, M. A cluster-Based method to map urban area from DMSP/OLS nightlights. Remote Sens. Environ. 2014, 147, 173–185. [Google Scholar] [CrossRef]
  68. Cao, X.; Chen, J.; Imura, H.; Higashi, O. A SVM-Based method to extract urban areas from DMSP-OLS and SPOT VGT data. Remote Sens. Environ. 2009, 113, 2205–2209. [Google Scholar] [CrossRef]
  69. Echeverry-Galvis, M.A.; Peterson, J.K.; Sulo-Caceres, R. The social nestwork: Tree structure determines nest placement in kenyan weaverbird colonies. PLoS ONE 2014, 9, e88761. [Google Scholar] [CrossRef]
  70. Gong, P.; Li, X.; Wang, J.; Bai, Y.; Chen, B.; Hu, T.; Liu, X.; Xu, B.; Yang, J.; Zhang, W. Annual maps of global artificial impervious area (GAIA) between 1985 and 2018. Remote Sens. Environ. 2020, 236, 111510. [Google Scholar] [CrossRef]
  71. Wang, P.; Huang, C.; Tilton, J.C.; Tan, B.; de Colstoun, E.C.B. HOTEX: An approach for global mapping of human built-Up and settlement extent. In Proceedings of the 2017 IEEE International Geoscience and Remote Sensing Symposium (IGARSS), Fort Worth, TX, USA, 23–28 July 2017; pp. 1562–1565. [Google Scholar]
  72. Pok, S.; Matsushita, B.; Fukushima, T. An easily implemented method to estimate impervious surface area on a large scale from MODIS time-Series and improved DMSP-OLS nighttime light data. ISPRS J. Photogramm. Remote Sens. 2017, 133, 104–115. [Google Scholar] [CrossRef] [Green Version]
  73. Sutton, P.C.; Anderson, S.J.; Elvidge, C.D.; Tuttle, B.T.; Ghosh, T. Paving the planet: Impervious surface as proxy measure of the human ecological footprint. Prog. Phys. Geogr. 2009, 33, 510–527. [Google Scholar] [CrossRef]
  74. Shi, K.; Huang, C.; Yu, B.; Yin, B.; Huang, Y.; Wu, J. Evaluation of NPP-VIIRS night-Time light composite data for extracting built-Up urban areas. Remote Sens. Lett. 2014, 5, 358–366. [Google Scholar] [CrossRef]
  75. Letu, H.; Hara, M.; Tana, G.; Nishio, F. A saturated light correction method for DMSP/OLS nighttime satellite imagery. IEEE Trans. Geosci. Remote Sens. 2011, 50, 389–396. [Google Scholar] [CrossRef]
Figure 1. Location map of the study area in Asia with typical cities highlighted.
Remotesensing 13 00212 g001
Figure 2. Framework for predicting artificial impervious surface percentage (AISP: artificial impervious surface percentage, BCI: Biophysical Composition Index).
Remotesensing 13 00212 g002
Figure 3. Importance of the input features derived from the random forest model using 80% of samples as training data in 2018. Note: NDSI_12 is normalized difference index calculated for band 1 and band 2 of MODIS, NLFI_12 is the fusion night light index based on the normalized difference index.
Remotesensing 13 00212 g003
Figure 4. The relationship between the test R2 and the number of feature variables in 2018 and 2013.
Remotesensing 13 00212 g004
Figure 5. Spatial distribution of artificial impervious surface percentage achieved by scheme 4 using 80% of samples for training in Asia in 2018. (a) Beijing, (b) Changchun, (c) Harbin, (d) Shanghai, (e) Kunming, (f) Lanzhou, (g) Shenzhen, (h) Wuhan, (i) Zhengzhou, (j) Urumqi, (k) Bangkok, (l) Astana, (m) New Delhi, (n) Ankara, (o) Anshun.
Remotesensing 13 00212 g005
Figure 6. Scatterplots of predicted and reference values in typical cities in 2018. Values of predicted AISP derived from scheme 4 using 80% of samples as training in typical cities.
Remotesensing 13 00212 g006aRemotesensing 13 00212 g006b
Figure 7. The result of predicted AISP derived from scheme 4 using 80% of samples as training data in typical cities (reference data from Landsat 8; AISP denotes the artificial impervious surface percentage).
Remotesensing 13 00212 g007aRemotesensing 13 00212 g007b
Figure 8. Comparison of artificial impervious surface amongst four products over typical regions.
Remotesensing 13 00212 g008aRemotesensing 13 00212 g008b
Table 1. Details of remote sensing data.
Data TypeDescriptionSource
MOD09A1MODIS Terra/Aqua Surface Reflectance 8-Day L3 Global 500 m; 46 periods in a year, the 8-day surface reflectance composites in 2013 and 2018 covering 4232 scenes are used.NASA Goddard Space Flight Center (Https://Ladsweb.Modaps.Eosdis.Nasa.Gov/Search/)
VIIRS DNBVIIRS DNB Cloud Free Composites; Version 1 monthly products covering the globe from 75 N to 65 S. Fifteen arc-second geographic grids (approximately 500 m spatial resolution); Date range: January, February, November and December in 2013 and 2018.National Centers for Environmental Information (https://ngdc.noaa.gov/eog/viirs/download_dnb_composites.htmL)
Landsat-8 OLISpatial resolution: 30 m.
Path/row: acquisition data
118/28: 24 June 2018, 30 September 2013; 118/30: 24 June 2018, 25 May 2013; 118/38: 23 May 2018, 29 August 2013; 123/32: 17 October 2018, 3 October 2013; 123/39: 15 September 2018, 31 July 2013; 129/43: 1 March 2018, 20 April 2013; 130/35: 12 June 2018, 4 October 2013; 143/29: 23 June 2018, 9 June 2013; 122/44: 12 February 2018, 29 November 2013; 124/36: 24 October 2018, 4 June 2013; 129/51: 13 February 2018, 20 April 2013; 146/40: 2 October 2018, 18 September 2013; 177/32: 18 April 2018, 23 June 2013; 155/24: 14 August 2018, 31 July 2013; 127/36: 11 September 2018, 13 September 2013.
United States Geological Survey (http://earthexplorer.usgs.gov/)
Table 2. Description of constructed feature set.
Feature VariableFeature DescriptionFeature Number
Spectral feature set B 1 B 7 ,   D N B n o r 8
Index feature set N D S I i   j ,   i , j 1 , , 7   i j 21
Fusion feature set N L F I i   j , i , j 1 , , 7   i j 21
Note: DNB and D N B n o r denote the DN value and normalized value of the VIIRS DNB after preprocessing, respectively.
Table 3. The information of experimental schemes.
Experimental SchemeFeature Combination
1Spectral features
2Spectral features + Index features
3Spectral features + Fusion features
4Preferred combination of all features
Table 4. Model prediction accuracy of AISP based on different schemes.
SchemeTest_R2 (60%)Test RMSE (60%)Test_R2 (80%)Test RMSE (80%)
(2018/2013)(2018/2013)(2018/2013)(2018/2013)
10.59/0.660.058/0.0480.59/0.660.058/0.049
20.60/0.670.055/0.0460.61/0.680.056/0.047
30.66/0.710.048/0.0410.67/0.710.047/0.041
40.69/0.710.044/0.0400.69/0.720.044/0.039
LISI0.56/0.460.063/0.0730.57/0.470.061/0.075
MISI0.62/0.490.054/0.0720.62/0.500.054/0.070
Note: 60%: 60% of the samples were used for training the model. 80%: 80% of the samples were used for training the model.
Table 5. Predicted accuracy of AISP in typical cities.
CitiesOur Method (2018/2013)LISI (2018/2013)MISI (2018/2013)
R2RMSER2RMSER2RMSE
Beijing0.86/0.870.146/0.1230.52/0.580.271/0.2170.59/0.630.250/0.206
Changchun0.89/0.880.142/0.1350.60/0.630.256/0.2350.69/0.680.226/0.222
Harbin0.86/0.870.125/0.1280.59/0.600.193/0.2210.67/0.650.175/0.209
Shanghai0.87/0.880.137/0.1320.59/0.380.237/0.2960.67/0.390.213/0.295
Kunming0.88/0.850.116/0.1450.71/0.640.175/0.2220.75/0.680.162/0.211
Lanzhou0.88/0.850.138/0.1280.47/0.470.283/0.2310.55/0.490.263/0.227
Shenzhen0.89/0.870.135/0.1340.66/0.280.226/0.3160.70/0.270.209/0.329
Wuhan0.83/0.850.150/0.1430.54/0.460.237/0.2690.58/0.460.229/0.267
Zhengzhou0.86/0.850.148/0.1420.40/0.510.305/0.2590.47/0.620.288/0.243
Urumqi0.86/0.850.139/0.1470.41/0.490.288/0.3120.39/0.530.292/0.299
Bangkok0.54/0.600.227/0.1980.42/0.500.256/0.2190.46/0.540.247/0.212
Astana0.72/0.690.212/0.1750.51/0.580.285/0.2010.58/0.640.265/0.186
New Delhi0.66/0.720.237/0.2120.64/0.630.243/0.2430.68/0.670.227/0.233
Ankara0.52/0.540.255/0.2370.39/0.400.288/0.2700.38/0.410.289/0.265
Anshun0.75/0.700.196/0.2140.65/0.640.240/0.2420.66/0.640.239/0.241
Note: The above models are all obtained by using 80% of these samples for training in 2018 and 2013, respectively. Our method denotes the scheme 4 of the proposed methods.
Table 6. Accuracy of the four impervious surface maps over 4 validation regions.
CitiesAISP-2018GAIA-2018HBASE-2010NUACI-2015
R2RMSER2RMSER2RMSER2RMSE
Urumqi0.870.1390.670.3170.470.3010.480.293
Anshun0.750.1960.200.4200.310.3730.490.299
Harbin0.840.1220.860.1690.680.1700.460.328
Beijing0.860.1550.950.0810.620.2380.700.232
Publisher’s Note: MDPI stays neutral with regard to jurisdictional claims in published maps and institutional affiliations.

