
Exurbia East and West: Responses of Bird Communities to Low Density Residential Development in Two North American Regions

1
Paul Smith’s College Adirondack Watershed Institute, Paul Smiths, NY 12970, USA
2
Wildlife Conservation Society, Saranac Lake, NY 12983, USA
3
Department of Natural Resources, Cornell University, Ithaca, NY 12983, USA
*
Author to whom correspondence should be addressed.
Diversity 2021, 13(2), 42; https://doi.org/10.3390/d13020042
Submission received: 25 November 2020
/
Revised: 8 January 2021
/
Accepted: 20 January 2021
/
Published: 22 January 2021
(This article belongs to the Special Issue Effects of Human Disturbance on Ecological Communities)
Abstract
:Exurban development is a prevalent cause of habitat loss and alteration throughout the globe and is a common land-use pattern in areas of high natural amenity value. We investigated the response of bird communities to exurban development in two contrasting North American regions, the Adirondack Park (New York) in the eastern US, and the Greater Yellowstone Ecosystem (Montana) in the Rocky Mountain West. We combined social and ecological data collection methods to compare the effects of exurban development on avian communities between the two landscapes, and, in exurban residential areas within them, to compare the relative roles of habitat structure, resource provisioning, and human disturbance in influencing avian habitat use. Contrasting with an earlier pilot study, we found differential effects of exurban development in the two regions, with birds generally more responsive in the Adirondack Park. Characteristics of habitat context and structure had larger influences on bird habitat use than human-associated resource provisioning or disturbance in both landscapes. The smaller magnitude and high variability in the responses of birds to landowner stewardship and/or disturbance suggest that broader geographical factors are highly important and that careful siting of developments on the landscape may be more successful at protecting wildlife communities than attempts to influence the behaviors of their inhabitants once built.
1. Introduction
Among human-caused impacts to natural systems, some of the most challenging to address are those that are incremental, widespread, and cumulative. Exurban development, or rural sprawl, on private land is prevalent throughout much of the world [1,2], and its impacts, generally perceived as relatively low [3,4,5,6], are less well-known than those associated with urban and suburban contexts [7,8,9,10,11,12]. It often appears relatively benign: a ranchette in a river valley here, a retirement home in the woods there; cumulatively, however, exurban development is altering landscapes 10 times faster than urban and suburban sprawl combined [12]. The prevalence of this form of development makes the likelihood of emergent patterns high.
Exurban development is frequently driven by amenity migration. With new technologies enabling work from remote locations, highly valued private lands in close proximity to natural and protected areas in the US have become attractive for second-home development and/or amenity migration [13,14]. These private lands, including areas near the Adirondack State Park (ADK) in New York State and the Greater Yellowstone Ecosystem (GYE) in the state of Montana, USA, are often more ecologically productive than public lands because of their low elevation and high soil productivity [15,16] but are susceptible to exurban development because of their natural beauty, privacy, and accessibility to nature [17,18,19,20,21,22,23,24]. More than 90% of all US federally threatened and endangered flora and fauna have some or all of their habitat on non-federal land [25] and private lands adjacent to protected areas are therefore critical to biodiversity protection. Moreover, exurbanization near protected areas hardens the boundaries, which hinders species movement and contributes to isolation, especially for terrestrial vertebrates [26]. As conservationists and legislators call for the protection of 30% of lands by 2030 as a way to stem biodiversity loss and mitigate the effects of climate change [27,28,29], understanding the ways in which human development impacts lands surrounding protected areas can lead to strategies for private land protection that can contribute to meeting this ambitious goal.
Despite the misconception that, because most of the physical area taken up by exurban development remains in the original ecosystem type, the effects on biological diversity are relatively benign [30], increasing evidence suggests that exurbanization may result in altered wildlife behavior [31,32], altered wildlife species composition [3,33,34,35], and decreased biotic integrity [36]. However, most studies are site or species-specific. It is likely that the effects of exurban development on biodiversity differ among ecosystems and understanding the types of ecosystems that are relatively vulnerable to exurban development is an important need [5].
Early North American work on exurban development and its impacts was disproportionately centered in the Rocky Mountain west [3,4,30], and the extent to which conclusions from this work could apply to eastern temperate forest systems was unknown. Landscape heterogeneity may confer stability to landscapes and buffer populations against environmental change, relative to organisms in landscapes that are more homogeneous, as has been suggested by a number of researchers [37,38,39,40] and supported by studies on crickets [41], amphibians [42], and butterflies [43]. George and Dobkin [44] suggested that avian populations in parts of the Western US have contended with natural heterogeneity for thousands of years and may be less affected by fragmentation processes such as exurban development than avian populations of the relatively more homogeneous landscapes of the pre-European-settlement Eastern US. We previously examined changes in breeding bird community structure in exurban subdivisions and control areas between the Adirondack Park in northern NY and the Madison Valley, MT of the Greater Yellowstone Ecosystem (GYE) [45] and predicted that, given its greater landscape structural diversity, the GYE would be less sensitive and demonstrate fewer changes to bird communities as a result of exurban development than would the Adirondacks. Despite our predictions, we found similar responses to development among several avian guilds across these distinct regions. In a separate study in the Adirondack Park [46], we detected a similar building effect distance [3,47] associated with exurban residential homes in the Adirondacks as those previously detected by Odell and Knight [3] in Colorado. The similarity of these findings suggests that the types and levels of human activity surrounding homes may play an equal or more important role in explaining patterns than purely structural habitat differences wrought by exurban development [48].
In the current study, we built on our previous work in these diverse ecosystems and combined sociological and ecological approaches on a larger scale to examine human impacts on biological communities. Specifically, we examined whether it is possible to generalize across ecosystems the human activities (e.g., gardening, cutting trees, leaving barking dogs outside, maintaining trails, outdoor lighting) and habitat structure that are associated with characteristics of breeding birds in exurban developments. While socio-economic models have begun to characterize and predict exurbanization (e.g., [49,50]), few models have been developed to predict how the actions of individual landowners will influence biotic distributions. Some researchers have emphasized the importance of including human-dominated landscapes in addressing and potentially promoting the conservation of species [51,52,53]. This idea is not new: Aldo Leopold recognized the importance of private land stewardship and indicated the importance of “a conviction of individual responsibility for the health of the land” [54] (p. 221). However, the specific relationship among stewardship activities, human behaviors, and breeding bird community characteristics remains unclear. As a result, planners and resource managers struggle to assess and manage the potential impacts of exurban residential growth on species and ecosystems.
We examined breeding bird communities in exurban subdivisions and ecologically similar control areas in Essex County, NY and Madison County, MT. We combined ecological data collection with a social survey to characterize landowners’ practices and behaviors that may influence wildlife communities around their homes. Our objectives were to compare (1) the effects of exurban development on avian communities between two diverse landscapes, and, (2) the relative roles of habitat structure, resource provisioning, and human disturbance in influencing avian habitat use within exurban residential areas in both landscapes.
2. Materials and Methods
2.1. Study Locations
This study builds upon a prior pilot effort [45] and takes place in the same eastern and western North American systems. Specifically, we collected data in the interior northeast forest of Essex County, NY in the Adirondack State Park and in the forest/shrub/grassland mosaic of Madison County, MT, in the Greater Yellowstone Ecosystem. As previously described [45], the Adirondack Park in northern New York is a mountainous area with elevations ranging from 30 to 1600 m with dominant habitat types including Northern Hardwood and Conifer and Boreal Upland Forest [55]. The park is 24,000 km2 in size and inhabited by 130,000 full-time residents and large numbers of seasonal residents. Essex County is 4652 square kilometers and has 39,000 residents. Like the rest of the Adirondack Park, most of Essex County is a heavily forested region in which natural openings are created primarily by wetlands and water bodies and is not highly fragmented.
Madison County, MT has a basin and range topography with elevations from 1400 to 2900 m and is part of the GYE, which encompasses lands surrounding Yellowstone and Grand Teton national parks. Dominant habitats include Big Sagebrush Shrubland and Steppe, intermixed with small amounts of Western Riparian Woodland and Shrubland and Douglas-fir Forest and Woodland [56]. Madison County is primarily an open landscape punctuated with structures in the riparian corridor and in the forested areas as elevation increases. The county is 9287 km2, is 52% federally or state-owned and 48% privately-owned, and has a population of 7700 residents.
Study sites in Essex County, NY, were located in mixed hardwood-conifer forests in the northern part of the park within the towns of Saranac Lake, Lake Placid, Keene Valley, and Wilmington. Those in Madison County were located in the northern part of Madison Valley with one set of sample points located between Ennis and Virginia City and a second set of sample points northwest of the town of McAllister, MT, both in mixed-structure systems at the confluence of forest and shrub/grassland habitat. Similar to our previous study [45], we used GIS and available parcel data to classify residential areas within the two counties into rural housing densities as defined by Theobald [57] and identified potential subdivisions by selecting contiguous patches of residential housing density that met the criteria of 2–40 acres/house and selected among them by considering access limitations and potential control areas nearby. Potential control sites were located by identifying the nearest area of accessible undeveloped land within the same habitat types and of the same minimum area as the selected subdivision. The primary differences between the two treatment types consisted of the presence of anthropogenic features such as houses and associated roads.
We identified potential subdivisions and study sites and obtained landowner information from tax parcel data. In the GYE, all potential private land study locations were subdivisions, defined as single large tracts of land divided into lots on which homes were built. In the Adirondacks, large scale subdivisions are less common and potential study locations in the Adirondacks were drawn from a mix of true subdivisions and areas of residential development that were characterized by exurban qualities, namely areas with significant numbers of rural homes on large lots and in which the forested matrix surrounding homes and roads remains intact. We sent letters to 303 contacts within seven subdivisions in the GYE and 267 contacts within five subdivisions and two residential neighborhoods in the Adirondacks and obtained permission to access 75 parcels in Madison County, MT, and 90 parcels in Essex County, NY. We sampled the same number of points on control sites. In the Adirondacks, control points were distributed among 11 areas and located entirely on lands owned by the State of NY as part of the New York State Forest Preserve and protected as forever wild forest lands [58]. In Greater Yellowstone, control points were distributed among seven areas located on a mix of US Forest Service lands (n = 3) and nearby undeveloped private lands (n = 4) on which owners were amenable to our study. These private parcels included former ranchlands and one unused portion of an active ranch. Though ranchlands were not ideal, locating sufficient areas for control sample points characterized by elevation and habitat types that matched the study subdivisions was challenging in the GYE. Former ranchlands are some of the lands most rapidly being transformed into subdivisions in the west and their ecological similarity to our study subdivisions is, therefore, to be expected. The lack of available control sites configured in similar sizes and ecological characteristics in both regions precluded a paired study design.
2.2. Bird Sampling
We sampled birds via 10-minute, unlimited distance point counts [59] performed by highly skilled observers and conducted between dawn and three hours after sunrise. On individual ownerships within subdivisions, we located a point count at a distance of 50 m from the home, oriented in a direction away from the driveway or access road. On control sites, point counts were located along trails and/or dirt roads (in the GYE) with count stations located a minimum of 250 m apart. In general, the majority of birds detected with point count methods are of the orders Passeriformes and Piciformes. We noted all species detected as well as whether detections were made by ear or sight. Activity for all species was noted (e.g., singing, drumming, individual observed). Factors influencing detection probability were noted for all samples including observer, date of survey, time of count, temperature, cloud cover, and wind conditions. Counts were not conducted in the rain and/or if wind conditions impeded detection. All sites were sampled twice between the last week of May and the first week of July in 2012, 2013, and 2014, overlapping with the primary breeding season for birds in both regions.
2.3. Habitat Context
To capture characteristics of bird sampling locations at the parcel scale, we collapsed LANDFIRE data [56] to broad habitat categories such that both the Adirondack Park and the GYE could be described (e.g., conifer, shrubland). We summarized habitat types within a 100 m buffer around each point count location (total of 170 polygons). We also recorded the mean elevation and total number of habitat types present within the 100 m radius. Spatial analysis was conducted in ArcMap (Esri 2020). A 100 m radius corresponds to approximately 0.03 km2, which is similar to the mean lot sizes of landowners in the Adirondacks (0.04 km2) and smaller than that of the mean lot size in the GYE (0.07 km2) but enabled us to ensure that we were primarily capturing the characteristics of the focal parcel and those which might be subject to landowner management.
2.4. Habitat Structure
We characterized the habitat at our point count locations using vegetation sampling methods adapted from Martin et al. [60]. Vegetation composition and structure were sampled within a circular plot of 11.3 m radius centered on the point count location. Within the plot, we counted all trees and shrubs by species and size class and noted all dead trees (snags) of any size, recording species where possible. We estimated canopy cover in four cardinal directions using a spherical densiometer and made note of basic topographic (e.g., basin, ridgeline, gently rolling) and edaphic (e.g., stream, rocky outcrop) characteristics that applied to the parcel, noting any evidence of current or previous cattle browsing.
2.5. Resource Provision/Alteration
We used a checklist to record anthropogenic features and potential human impacts and alterations to the site, noting all characteristics that could be observed at the parcel within several categories (Table 1). Information from within the categories of structures, habitat alteration, food sources, and water sources was used to characterize alteration or provisioning of resources.
2.6. Potential Disturbance
To document the potential disturbances created by private landowners living in these exurban landscapes, we implemented a four-wave mail survey [61] to collect data from landowners in each study area from September to November 2013. The mailings consisted of a cover letter and self-administered questionnaire, a reminder letter, a second letter and copy of the questionnaire, followed by one last reminder letter, each spaced two weeks apart. We used the same tax parcel data identified in Section 2.1 above to census 260 landowners in Madison County, MT and 248 landowners in Essex County, NY. Lower numbers represent the removal of landowners whose invitations for participation in the ecological component of the study were undeliverable or who previously asked not to be contacted again.
Landowners completed the self-administered survey, answering questions about activities in which they engage on their property, their land management practices, their attitudes towards wildlife, the influence of others on management activities, and socio-demographic information. For this study, we used only the data related to activities and management practices for four potential types of disturbances: pets, noise, lights, and the level of human activity on the property itself. The project was reviewed by the Wildlife Conservation Society’s Institutional Review Board (Bronx, NY, USA) and the survey methods were reviewed by Cornell University’s Institutional Review Board for Human Participants (Ithaca, NY, USA) #1008001625.
Cornell University’s Survey Research Institute conducted a short non-respondent follow-up phone survey with 15 residents in each region. The non-respondent questions included duration of ownership, reasons for owning property, attitude toward activities that could benefit wildlife, intent to engage in activities to benefit wildlife, influence of friends and family on management activities, and demographics.
We created four additive indexes from the z-scores of dichotomous and Likert-scale questions measuring activities contributing to disturbances from pets, noise, human activity, and lights. For pets, we combined the reported presence or absence of cats, dogs, horses. and other species with information about whether the dogs or cats are allowed outside during the day or the night and whether dogs and cats are roaming free and able to chase wildlife while outside. For noise, we combined the presence and intensity of noise-producing activities on the property including using a lawn mower, listening to music outside, working on small or large construction projects, and using power tools. For human activity, we summed activities that had humans outside on the property including using a grill, eating meals, kids playing in the yard, and recreational activities such as hiking, mountain biking, non-motorized winter recreation, horseback riding, motorized recreation, wildlife watching, and birding. For light, we asked landowners to report on the number of indoor and outdoor lights outside, the frequency with which these lights were on in the evening, overnight, and early morning, and the extent to which indoor lights shine through uncovered windows.
2.7. Statistical Analysis
We used an occupancy modeling framework to analyze patterns of habitat use by individual bird species. Occupancy offers an alternative state variable to abundance and has demonstrated utility for many applications including examinations of habitat selection [62], and anthropogenic impacts such as habitat fragmentation [63,64]. We used the program Presence [65] to calculate detection and occupancy probabilities for bird species detected at each sample point. Occupancy probability (ψ) is defined as the probability of a site being occupied within a given season, while detection probability (p) denotes the probability of a species being detected, given presence. For each species, counts were converted to detection/non-detection information at each of the count locations. We calculated occupancy parameters for all passerine and piciform species detected in at least 15% of study locations for both regions to provide sufficient data for estimation and omitted species that were detected in more than 90% of study locations. We pooled the data across 2012, 2013, and 2014 and used the single-season occupancy model; individual estimates of annual occupancy were not of interest and preliminary analysis revealed little support for inter-annual variability in occupancy for the overwhelming majority of species. Pooling across seasons requires a relaxation of the population closure assumption and hence, for the purpose of this study, the sampling season is defined to encompass all three seasons, with the occupancy estimator interpreted as the proportion of sites “used” by each species [63,66,67].
To compare the effects of exurban development on avian communities across diverse landscapes (objective 1), we tested whether estimated bird use differed between subdivisions and controls. Within each region, we ran two models for each species; one in which occupancy (use) was constant across all sample points, and one in which occupancy was dependent on whether points were conducted in subdivisions or controls. We modeled detection to include all possible predictor variables for each species and reduced the number of predictor variables for the detection component when models did not converge.
To compare the relative roles of human management and disturbance vs. alteration of habitat structure in influencing avian habitat use in exurban subdivisions (objective 2), we ran a set of models for each individual species in each landscape in which occupancy was predicted based on the influence of several variables (Table 2). To assess the natural characteristics of the landscape likely to influence avian habitat use, we reduced the full set of potential natural habitat drivers to a smaller set to reduce multicollinearity and to represent the influence of both structural and contextual habitat factors. From plot-level habitat data, we modeled the influence of five variables including trees, shrubs, and snags per plot, as well as mean tree size and canopy cover. From GIS data summarized within 100 m of point count locations, we also modeled the influence of five factors including elevation and number of habitats, as well as the proportion of the area comprised of primary habitat types including conifer forest (ADK), mixed forest (ADK), shrubland (GYE), grassland (GYE), and developed cover (both landscapes). To assess the influence of anthropogenic drivers on bird use of habitats within exurban subdivisions, we modeled several factors to represent both resource provision/alteration as well as potential disturbances to birds. Resource provision was modeled in terms of four variables which were created from summaries of the numbers of features observed at each individual parcel within the categories of habitat alteration (“alteration”), structures (“structures”), water sources (“water”), and food sources (“food”; Table 1). Disturbance was modeled in terms of four index variables (pets, noise, lights, humans) derived from the data reported in the social survey to represent the potential influence of outdoor pets, noise disturbance, nighttime lighting, and outdoor human activity as described in Section 2.6. Because there was not a 1:1 correlation between the landowner participants in the study and the respondents to the social survey, there were a small number of sites for which we had ecological data without social data and vice versa. In the case of the disturbance variables, we used the mean response from each residential area (subdivision or neighborhood) to replace missing covariate data for pets, noise, lights, and human activity. All covariates were standardized prior to modeling. We modeled each covariate independently and also ran one model with constant occupancy, resulting in a total of 19 models for each species (Table 2). Again, where models did not converge for individual species, we reduced the number of predictor variables for the detection component.
3. Results
3.1. Cross-Site Comparison
We made a total of 7304 detections of 98 bird species in the Adirondack Park and 7854 detections of 123 bird species in the GYE. We obtained adequate data to model the habitat use of birds in exurban subdivisions and control sites for 18 passerine and piciform species in the Adirondacks and 30 species in GYE. In ADK, the model containing the subdivision treatment was the best model for 11 species (Table 3). Among them were five species with higher predicted habitat use in subdivisions than in controls and six species with higher predicted use of control sites; the remaining seven species did not indicate a difference in predicted habitat use between subdivisions and controls. Within the GYE, only 5 of 30 species demonstrated clear support for a treatment effect, all of them with a higher probability of use in subdivisions (Table 3).
3.2. Social Survey and Potential Disturbance
The landowner survey response rate in the Adirondacks was 55% (n = 125) and 45% (n = 100) in the GYE. Respondents from the ADK and the GYE did not differ in age (F = 4.837, p < 0.173), gender (X2 = 0.852, p < 0.356), or the proportion of permanent versus seasonal residents (X2 = 1.172, p < 0.0183). Respondents from the ADK were more likely to have grown up in an urban area (60.7%) compared to the GYE (35.1%, Χ2 = 14.173, p < 0.01). ADK respondents were also significantly more likely to have earned a graduate or professional degree (Percent above a B.A./B.S.: ADK = 87.7%, GYE = 70.1%; Χ2 = 10.428, p < 0.001).
The non-respondent phone survey with 15 residents in each region indicated no differences across gender or permanent versus seasonal residents. Survey respondents attained higher levels of education with over half (53.4%) receiving a graduate or professional degree compared to non-respondents (41.4%). Notably, survey respondents were more likely to own their land to use for recreation (Survey = 70.3%, NR = 49.9) or as a place to relax (Survey = 82.1%, NR = 50). By contrast, non-respondents were more likely to have bought their land to manage as they see fit (Survey = 51.1%, NR = 79.9%). Nonrespondents were also slightly more likely to have owned their property for more years (24.73 years) compared to survey respondents (19.93 years, p = 0.060).
Landowners reported a variety of potential disturbances to the avian community (Table 4). We grouped the disturbances under four broad categories of pets, noise, human activity, and lights.
3.3. Habitat Use
We examined the effect of 18 covariates representing potential influences on birds inhabiting exurban subdivisions including characteristics of habitat structure and context, resource provision resulting from management, and potential disturbance resulting from human activity. We drew conclusions about the importance of individual factors by examining the proportion of species for which each predictor variable was among top models within each landscape. We considered models with ΔAIC ≤ 4.0 to have reasonable support [69]. In both the eastern and western landscapes, a larger overall proportion of species were influenced by characteristics of habitat structure and context than those influenced by resource alteration and disturbance (Figure 1, Appendix A). In the Adirondacks, among the habitat categories, percentage of conifer and elevation were most important at the 100-m scale and generally had a positive influence on bird habitat use, while the number of trees, shrubs, and snags per plot was important at ground level with mixed but primarily positive effects. With respect to resource provision, habitat alteration influenced the largest proportion of species with mixed effects, followed by the provision of structures (negative effect) and water sources (positive). On factors describing potential disturbance, the highest proportion of species were affected by reported pet activity, with positive effects. Noise also had a generally positive effect on predicted bird habitat use, while reported outdoor human activity negatively influenced habitat use.
In the Greater Yellowstone Ecosystem, natural habitat characteristics were similarly more important than resource provision or disturbance in terms of the proportion of species influenced (Figure 1, Appendix A). With respect to habitat context, the number of habitats represented within 100 m of the count location was most important and had a generally positive effect on bird habitat use. In terms of habitat structure, the number and sizes of trees per plot had positive effects on bird habitat use, while smaller proportions of species were influenced by snags (negative), shrubs (mixed), and canopy cover (mixed). Factors related to resource alteration or provision had generally low influence in the GYE, with structures and food sources having mixed effects and habitat alteration and provision of water sources having a negative effect on small proportions of species. In terms of disturbance, pets, noise, and human activity had mixed effects. Lights had positive effects on a small proportion of species in both landscapes.
4. Discussion
We examined the effects of exurban development on avian communities across diverse landscapes and compared the relative roles of habitat structure, resource provisioning, and human disturbance in influencing avian habitat use. In contrast to previous findings, our study revealed differential patterns of response to subdivisions between diverse ecosystems in the eastern and western US. In the Adirondack Park, more than half (61%) of the species examined exhibited differential use of subdivisions and control sites, the majority with higher predicted use of control sites than residential areas. In the GYE, contrastingly, only 17% of species responded to the subdivision treatment at all, and all had higher predicted use in subdivisions than control sites. These findings are similar to those of Farr et al. [70], who compared habitat use for 16 bird species between conservation subdivisions and undeveloped areas in northern Colorado, USA and found that 81% of tested species exhibited similar habitat use between subdivisions and undeveloped sites.
It is possible that developments within naturally patchy landscape mosaics exhibit less change in biotic community composition than developments within naturally homogenous landscapes because typical residential developments more closely resemble patchy mosaics. In addition to being characterized by a larger number of small habitat patches relative to the Adirondack Park [45], lot sizes in the GYE, and in fact, throughout much of the intermountain western US, are much larger than those in the Northeast US. As a result, houses are spaced much more widely on the landscape. It is possible that in these western systems, the potential benefits associated with scattered houses on the landscape outweigh their negative impacts. Bock and Bock [71] discuss the importance of scale in the context of clustered vs. dispersed housing patterns and point out that, at large enough scales, exurban home sites may function as ecological oases or resource supply points, providing assets such as shade and water in otherwise open, arid environments where such features are scarce. Such an “oasis effect” was suggested as an explanation for higher species richness and abundance of birds in exurban neighborhoods relative to undeveloped areas in southeastern Arizona [72] and “anthropogenic refugia” have also been suggested as important to mediating the climate-related decline of Belding’s ground squirrels in California [73]. The patchy distribution of resources available around exurban homes in the GYE may more closely resemble the naturally patchy habitat structure in that landscape as a whole.
The lower degree of contrast between individual bird species’ use of developed and undeveloped areas in the GYE is also potentially the result of the prevalence of ranching. Evidence of prior grazing activity was present on a number of our count locations on control sites in the GYE. These sites are likely to differ from other control sites in the GYE on which recreation is the primary activity, though the degree to which they represent a departure from their historical characteristics is probably dependent on the extent to which bison once ranged in the same areas [71]. In general, the challenge associated with locating control sites with comparable ecological characteristics in the western landscape was higher than that in the east. In the GYE, the common pattern of concentrated rural residences in productive valley bottoms and public ownership of less productive mountain settings [5] is more pronounced than in the Adirondack Park, where protected lands are interspersed with private ownership throughout the region and control sites of similar ecological characteristics to residential areas are more often located in close proximity. The variability of control site characteristics may have also contributed to the overall apparent lack of a strong subdivision effect in the GYE.
In addition to assessing the relative sensitivity of different ecosystem types to exurban development, we also sought to understand the factors that influence bird habitat use within subdivisions themselves. We examined the importance of habitat context, habitat structure, resource provision or alteration, and potential disturbance and their influence on bird habitat use in exurban residential areas. In both the eastern and western systems, we found that natural habitat characteristics were more important than localized human-influences relating to resource provision or potential disturbance around a home site. Larger proportions of species in both landscapes responded to variables describing the context and structure of the available natural habitat (e.g., elevation, canopy cover, tree and shrub density) than to variables describing the alteration or provision of resources (e.g., maintaining a lawn, provisioning of water or food resources) or to those describing potential disturbances (e.g., reported activity of outdoor pets, reported potential disturbance associated with noise or outdoor lighting). Though working at a larger scale in Colorado, Farr et al. [70] similarly found that characteristics describing context and availability of habitat explained a larger proportion of the variability in bird habitat use within exurban subdivisions than did characteristics relating to disturbances or resource subsidies. In the Lake Tahoe Basin of California and Nevada, USA, Schlesinger et al. [48], also found that landscape-level vegetation characteristics were most important in explaining patterns of bird abundance, but that disturbance from human activity was more important in explaining overall species richness.
Habitat characteristics were important to birds at both the parcel level and at the sample point scale. At the larger scale, within 100 m of the sample point, elevation and overall habitat diversity were important, as well as the proportion of conifer (Adirondacks) and shrub (GYE) present. Elevation and conifer cover were largely positive influences in the Adirondacks, potentially because both are associated with a number of Neotropical migrant and/or conifer forest species which may increase in representation in association with these characteristics, adding to the overall species diversity and contrasting with more general and human-adapted species that were common in most locations. In the GYE, elevation had a mixed effect on bird habitat use, possibly reflecting relatively harsher conditions associated with higher elevations in western landscapes. In the west, the overall diversity of habitats available was a positive influence on several species. Sites in the west in general were characterized by a broader diversity of habitat types while those in the east were dominated by hardwood forest interspersed with small amounts of coniferous forest. At the parcel level, the availability of a variety of habitat types is likely to increase overall species richness in both landscapes [74].
Landowners may be more likely to influence the structure of habitats at ground level and we found that numerous species were influenced by vegetation characteristics at the location of our sampling points. In both eastern and western study sites, tree density was important and generally a positive influence on birds. Not unexpectedly, responses of birds to structural habitat characteristics varied across species and the range of responses is most likely reflective of the broader habitat context of each privately owned parcel and the extent to which particular habitat features are more or less common in the surrounding landscape. Landowners can use this information to influence the habitat around their home toward benefiting a particular suite of birds if they so desire. Like urbanization, exurbanization is known to be associated with the homogenization of the avian and other wildlife communities [75,76]. Landowners who wish to counteract the general trend of selection toward more common and generalist species can potentially do so by promoting habitat characteristics that are beneficial to more sensitive species. In the Adirondacks, this may include planting or maintaining coniferous species and maintaining high tree and snag density near homes. In the GYE, more sensitive species may benefit from maintaining a diversity of habitats at the parcel scale, including shrub cover, and keeping a high density of trees, including those of large diameter, near homes. Grassland and western forest biomes are among those experiencing the largest avifaunal declines on the North American continent [77]. The GYE has a number of species whose regional trends indicate moderate to significant large declines including dusky flycatcher, mountain chickadee, western meadowlark, and savannah sparrow [78] which may respond to such habitat management.
Equally important to understanding habitat characteristics that benefit birds, perhaps, is to examine the potential role of human activities and disturbances and, in particular, those which can negatively impact birds in exurban landscapes. We examined the influence of resource provision/alteration and potential human disturbance and, though less influential on bird habitat use and community structure than natural habitat characteristics, found these factors to impact birds in several ways. The number of structures associated with individual homes in the Adirondacks was negatively associated with a number of species but had little influence in the GYE. In both landscapes, the top two structures observed in association with homes were outdoor seating and/or a deck or gazebo. Given that the most oft-observed structures outside of the homes themselves were structures associated with human activity, it is possible that structures serve as a proxy for levels of potential human disturbance and may be negatively associated with some bird species. It is also possible, however, that some structures provide nesting or protective cover for either birds themselves or their potential nest predators. In addition to adding structures, humans also modify habitats around exurban homes in a variety of ways. The most commonly observed habitat structural alterations in both the eastern and western landscapes were lawns and landscaping which had little effect in the GYE and mixed effects in ADK. Lawns in the Adirondacks tend to produce hard edges in the heavily forested region that often serve to attract some species but deter others who are more sensitive to fragmentation effects [46]. Forest-field edges are also used as travel corridors by generalist nest predators such as raccoons [79,80] and may therefore increase vulnerability for some bird species.
Other potential forms of resource alteration include the provisioning of food and water sources. A variety of potential food sources was noted in both landscapes (e.g., outdoor grill, fruiting shrubs/trees, vegetable gardens, compost, garbage) and their effect on habitat use was generally small. Some potential food sources will benefit birds but others may be important attractants for bird nest predators including generalist mammals that associate with human habitats such as rodents, foxes, and black bears [81,82,83]. Glennon and Porter [84] found higher abundances of both grey squirrel and red squirrel in areas of residential development relative to undeveloped old growth and managed forest sites in the Adirondacks. Both species, in addition to being associated with bird feeders and other human food sources, are common nest predators [85] and birds nesting low to the ground may be particularly vulnerable.
Water is important to birds and may be an important attractant in arid landscapes [86]. Anthropogenic water sources were relatively sparse among ownerships in both landscapes, with birdbaths and “other” water sources (e.g., pet water dish, outdoor shower) most common, while pools, hot tubs, and water troughs or stock tanks were less commonly observed. Water sources provided by humans were a universally positive effect in the Adirondacks, associated with increased habitat use by the blue jay, dark-eyed junco, and red-breasted nuthatch. In the GYE, only one species—the green-tailed towhee—exhibited a relationship with water and its response was negative. The general lack of response to water in the GYE was somewhat surprising and its reasons are unclear given the importance of this resource to birds and the relative scarcity of water in this landscape relative to the Adirondack Park.
In addition to resource alteration, humans also potentially create disturbances to wildlife communities in association with their activities around homes. We used reported information from our landowner survey to investigate the potential impact of disturbance via pets, noise, lights, and outdoor human activity. Responses to these factors were generally small but nevertheless revealed interesting patterns. Dogs were by far the most commonly reported pet present at homes in the Adirondacks (41% of homes) and in the GYE (67% of homes), followed by cats and a small number of other animals including horses and chickens (Table 4). With respect to potential disturbance associated with pets, cats were largely reported as indoor pets and so disturbance can be attributed primarily to dogs being outside with or without their owners. Interestingly, pets had a universally positive influence in the Adirondacks while their influence was mixed in the GYE. The positive association of reported pet activity in the eastern landscape was somewhat unexpected but, if the most activity is attributable to dogs as reported, may be the result of the effects that dogs have on potential mammalian nest predators. Soulé et al. [87] postulated the notion of mesopredator release to explain higher predation rates on chaparral-requiring bird species in California resulting from the absence of coyotes which normally exert numerical control over smaller predators such as foxes and domestic cats. Domestic dogs interact with and affect biodiversity in a number of ways [88] and have been shown to reduce the richness and abundance of birds [89]. They have also been shown to suppress the activity of small mammals [90]. It is possible that, in some circumstances, birds who are tolerant of disturbance by dogs may also benefit from reduced activity of nest predators such as rodents that are affected negatively by dogs in exurban environments. Among the species showing a positive association with reported pet activity were a handful of those closely associated with human environments including the American crow, American goldfinch, and blue jay in the Adirondacks and brown-headed cowbird in the GYE. Dogs were more prevalent in the GYE and reported to spend time outdoors more frequently than in the Adirondacks, which may contribute to the mixed response of birds in that landscape. It is likely that more sensitive species in both landscapes may be less tolerant to dog activity in association with rural residences.
Like pet activity, reported nighttime lighting behaviors also demonstrated some unexpected positive associations. Nighttime lights were positively associated with one species in ADK and were positively associated with two species in the GYE. Again, here it is important to note that the information reflected in this variable came from reported behaviors of landowners with respect to their tendency to leave a variety of indoor and outdoor lights on at varying times of the evening. The ecological impacts of lights at night are broad and research into this field is somewhat new and rapidly growing [91]. For birds, much concern is associated with the impact of lights on night-migrating birds although light has also been shown to alter singing behavior for at least one passerine species [92]. In both landscapes, the nighttime lighting disturbance reported by landowners was associated with either outdoor or indoor lights being on in the evening, while far fewer owners reported having lights on overnight or in the early morning. Therefore, potential disturbance from lights is relatively low. The positive association of lights with a small number of species is unexpected, but like pets, the possibility exists that lights left on in the evenings deter or alter activity patterns of other species, particularly potential mammalian nest predators, in some way that may benefit birds. Our own efforts to measure lights at night in these subdivisions using sensitive light meters resulted in very little detectable light and little useable data, reassuring us that exurban residential areas in both landscapes are generally quite dark.
The remaining two disturbances we investigated for their potential influence on birds were noise and human activity. Though related to one another, our survey questions attempted to parse out the impacts that might be associated with noise resulting from anthropogenic sources such as lawn mowing, playing music outdoors, and small or large construction projects from the disturbance that may result from humans themselves being active in the outdoors around their homes (e.g., eating meals outside, walking dogs, walking trails, kids playing). Responses to reported noise and human activity were mixed. In response to noise, four species, all of which are human-adapted (American crow, American goldfinch, blue jay, cedar waxwing), responded positively in the eastern landscape, while one species responded negatively (blue-headed vireo). In the GYE, the response to reported noise was smaller and split between one positive response (brown-headed cowbird) and one negative (green-tailed towhee). The ecological consequences of disturbance to wildlife from noise, like light, is rapidly growing as a research field and, similarly, established impacts have primarily been studied in association with broad-scale and chronic loud noise sources rather than the kinds of noise associated with rural residential development. Although there is abundant evidence for negative wildlife impacts associated with chronic noise exposure [93,94] and both density [95] and diversity [96] of bird communities have been shown to be responsive to noise impacts, studies have also revealed surprising results. Francis et al. [97], for example, found that noise associated with gas well compressors positively influenced nest survival for birds because predators (in this case Western scrub jay Aphelocoma californica) were less likely to occupy noisy sites. The frequency of bird vocalizations is known to influence the degree to which they may be sensitive to noise. Because most anthropogenic noise is relatively low frequency, it is thought that birds who vocalize at higher frequencies may be less susceptible to masking from anthropogenic noise sources than birds who vocalize at lower frequencies [98]. In general, the GYE landscape may be more acoustically favorable to birds because of its more open character, but this may also make it more likely that anthropogenic structures in these open environments degrade overall sound quality. Kight et al. [98] found that persistence of tones was higher and reverberation was lower in more open grassy habitats and that the addition of open habitat can improve the acoustic space of singing birds. These qualities may make birds less susceptible to noise disturbance in the western landscape.
Like noise, reported human activity had relatively little impact on birds but did demonstrate a negative relationship with 2 species in the Adirondack landscape and a split response between brown-headed cowbird (positive) and mourning dove (negative) in the GYE. Among the most commonly reported human activities by landowners in both landscapes were walking dogs and hiking trails and so it is possible that some of the response to human activity is also represented in the pets category. Nevertheless, the response of birds to outdoor human activity was relatively modest and possibly a disturbance with which birds around exurban homes can more easily adapt, particularly if it is regular and predictable.
5. Conclusions
Exurban locales have been among the regions experiencing the highest levels of population growth in the US in the last three decades [99]. The current COVID-19 pandemic appears to be contributing toward the continuation or even acceleration of this trend, as residents abandon densely populated cities in favor of rural regions perceived as more safe, analogous to migrations that occurred after the 9/11 terrorist attacks [100]. We examined the differential response of avian communities to habitat and stewardship characteristics in exurban residential areas in two contrasting geographies in the eastern and western United States. Exurban development in the heavily forested Adirondack Park tends to remove vertical structural diversity and produce new edges by clearing forest in order to create roads, lawns, and houses, whereas exurban development in the GYE may actually enhance structures in more open areas by adding features to the landscape in areas where trees are sparser and the landscape generally more heterogeneous. Birds in both landscapes were more strongly influenced by characteristics associated with the context and structure of the available natural habitat than they were by the stewardship activities of humans that influence the provision of resources or result in potential disturbance and responses of birds were mixed across most categories. The mix of bird responses to human landscape modifications and disturbances suggests that it is difficult to provide a one-size-fits-all set of recommendations for landowners wishing to benefit, or at least not harm wildlife. Some basic principles apply and are likely to be beneficial to birds in any landscape including maintaining large portions of ownerships in natural habitat types, diversifying habitat types, maintaining snags, minimizing impervious surfaces, keeping cats indoors, and prioritizing native species in landscaping efforts [101,102].
Three phases of development must be considered in the creation of residential neighborhoods for their potential ecological impacts: design, construction, and post-construction [103]. Our aim in the current study was to understand the actions that landowners undertake in the post-construction phase and their potential impacts on bird communities. Management of all three phases is challenging and influencing the behavior of humans living in exurban homes may be as hard as influencing the behavior of those who design the developments at the outset. The results of this analysis suggest that characteristics of habitat context and structure had larger influences on bird habitat use than human-associated resource provisioning or disturbance at the parcel level in both landscapes. The smaller magnitude and high variability in the responses of birds to landowner stewardship and/or disturbance suggest that broader geographical factors are highly important. Careful siting of developments on the landscape may be more successful at protecting wildlife communities than attempts to influence the behaviors of their inhabitants once built. Local governments have the ability to guide the location and configuration of developments through local land-use ordinances. Existing ordinances may require only small adjustments to yield relatively large benefits for wildlife [104]; these adjustments may be possible if a community is ready for change [105]. Similarly, there may be opportunities for homeowners’ associations (HOAs) to influence subdivision or neighborhood-level decisions that affect habitat availability and structure at broader scales and in turn influence bird communities. HOAs have been shown to improve species biodiversity in more urban contexts [106]. A combination of thoughtful land-use planning for situating developments on the landscape combined with guidance for coordinating landowner actions related to habitat management and stewardship across multiple parcels will be necessary to ensure private lands provide critical habitat for birds and other wildlife.
Author Contributions
Data curation, M.J.G. and H.E.K.; formal analysys, M.J.G. and H.E.K.; funding acquisition, M.J.G. and H.E.K.; investigation, M.J.G.; writing original draft, M.J.G.; writing review and editing, M.J.G. and H.E.K.; project administration H.E.K. Both authors have read and agreed to the published version of the manuscript.
Funding
This material is based upon work supported by the National Science Foundation BCS-#1060505. Any opinions, findings, and conclusions or recommendations expressed in this material are those of the author(s) and do not necessarily reflect the views of the National Science Foundation.
Institutional Review Board Statement
The study was conducted according to the guidelines of the Declaration of Helsinki, and the overall project was approved by the Institutional Review Board of the Wildlife Conservation Society (#2010-01, issued 10 February 2010; Bronx, NY, USA) and the survey and survey instruments were approved by Cornell University’s Institutional Review Board for Human Participants (#1008001625 issued 10 September 2013; Ithaca, NY, USA).
Informed Consent Statement
Informed consent was obtained from all subjects involved in the study.
Data Availability Statement
The data presented in this study are available on request from the corresponding author. The data are not publicly available because they are the subject of ongoing analysis for several publications.
Acknowledgments
The authors would like to acknowledge all of the landowners who generously allowed us on their property and completed the social survey. We would also like to acknowledge our numerous colleagues who supported the development and implementation of this project including Jodi Hilty, Brent Brock, Sarah Reed, Carrianne Pershyn, Kris Inman, T. Bruce Lauber, Nancy Connelly, Karlene Smith, Shorna Broussard, and our amazing field crew: Alan Belford, Whitney Fenton, Aaron Grade, Jamie Hogberg, Mikaela Howie, Melissa Hunt, Colleen Hujar, Ashley Jackson, Sam McKenzie, Melanie McCormack, Laine Sullivan, John Vogel, Michelle Volk, John Wojcikiewicz, and Santi Zindel. Last, we wish to acknowledge the support of the Nuttall Ornithological Club and Northern New York Audubon in bringing the manuscript to publication.
Conflicts of Interest
The authors declare no conflict of interest. The funders had no role in the design of the study; in the collection, analyses, or interpretation of data; in the writing of the manuscript, or in the decision to publish the results.
Appendix A
Estimated coefficients (ß) and standard errors for habitat context, habitat structure, resource provision, and disturbance covariates appearing in top models (ΔAIC ≤ 4) explaining habitat use of birds in exurban residential areas in Essex County, NY (Adirondack Park) and Madison County, MT (Greater Yellowstone). Species designated by American Ornithologists’ Union four-letter codes (Chesser et al., 2020) as per Table 3.
| Covariate | Species | ß(SE) | Species | ß(SE) |
| Adirondack Park | Greater Yellowstone | |||
| Habitat Context | ||||
| Developed cover | AMGO | 1.81(2.20) | ||
| BLJA | 0.41 (0.58) | |||
| Conifer or Shrub cover | AMGO | 2.56 (3.20) | BRSP | 1.03 (0.36) |
| BHVI | 0.69 (0.74) | GTTO | 0.54 (0.31) | |
| BLBW | 1.62 (0.95) | MOBL | 1.51 (0.57) | |
| BLJA | 3.29 (4.08) | ROWR | 0.90 (0.37) | |
| DEJU | 0.63 (0.67) | SAVS | 0.69 (0.30) | |
| MAWA | 0.89 (0.27) | VESP | 1.83 (0.54) | |
| WIWR | 0.82 (0.51) | BHCO | −0.60 (0.46) | |
| WTSP | 1.18 (0.84) | |||
| BAWW | −0.90 (0.39) | |||
| YBSA | −0.92 (0.32) | |||
| Mixed or Grass cover | BLBW | 6.57 (4.49) | CORA | 6.48 (11.67) |
| CEDW | −0.68 (0.31) | WEME | 1.76 (0.67) | |
| DEJU | −0.48 (0.28) | GTTO | −0.33 (0.30) | |
| HOWR | −0.88 (0.29) | |||
| NOFL | −0.86 (0.34) | |||
| Elevation | AMGO | 0.71 (0.47) | HOWR | 0.98 (0.30) |
| BTBW | 1.20 (0.33) | NOFL | 1.29 (2.84) | |
| CEDW | 0.64 (0.43) | PISI | 2.75 (1.86) | |
| DEJU | 0.83 (0.48) | WCSP | 2.63 (0.65) | |
| HETH | 1.48 (0.59) | BBMA | −1.32 (0.45) | |
| MAWA | 1.37 (0.44) | GTTO | −0.15 (0.31) | |
| BLJA | −0.07 (0.39) | HOLA | −2.62 (0.63) | |
| RWBL | −0.92 (0.29) | |||
| Number of Habitats | BLBW | 1.31 (0.58) | BHCO | 0.81 (0.53) |
| BLJA | 0.94 (0.68) | DEJU | 1.83 (0.56) | |
| PIWO | 1.86 (1.77) | HOWR | 1.23 (0.43) | |
| BAWW | −0.64 (0.37) | PISI | 1.76 (0.59) | |
| CEDW | −0.54 (0.34) | RBNU | 4.42 (2.09) | |
| HAWO | −1.13 (0.46) | RCKI | 1.45 (0.37) | |
| WAVI | 1.78 (0.46) | |||
| WETA | 1.30 (0.47) | |||
| WEWP | 1.72 (0.74) | |||
| YEWA | 1.25 (0.39) | |||
| MOBL | −1.47 (0.49) | |||
| SAVS | −0.55 (0.28) | |||
| Habitat Structure | ||||
| Trees per plot | AMGO | 2.12 (1.50) | CLNU | 13.25 (9.25) |
| BHVI | 0.57 (0.69) | DEJU | 13.53 (5.48) | |
| BLJA | 0.37 (0.49) | DUFL | 14.51 (12.37) | |
| WIWR | 0.53 (0.33) | HOWR | 6.02 (3.65) | |
| WTSP | 0.72 (0.51) | MOCH | 566.42 (1.07) | |
| CEDW | −0.33 (0.26) | PISI | 15.28 (9.59) | |
| CHSP | −0.47 (0.25) | RCKI | 12.25 (4.61) | |
| WAVI | 15.69 (6.25) | |||
| YRWA | 22.98 (9.32) | |||
| SAVS | −0.61 (0.41) | |||
| Mean tree size | BLJA | 0.05 (0.39) | BHCO | 1.20 (0.84) |
| BAWW | −1.51 (2.23) | CHSP | 2.51 (2.39) | |
| BHVI | −0.35 (0.40) | CLNU | 1.64 (0.42) | |
| DEJU | −0.46 (0.30) | DUFL | 1.71 (0.53) | |
| HOWR | 1.38 (0.48) | |||
| MOCH | 3.19 (2.20) | |||
| NOFL | 1.48 (0.91) | |||
| PISI | 2.04 (0.99) | |||
| RCKI | 1.53 (0.38) | |||
| WAVI | 2.01 (0.62) | |||
| YRWA | 2.62 (1.03) | |||
| SAVS | −0.49 (0.27) | |||
| Shrubs per plot | AMCR | 1.54 (0.75) | BRSP | 2.08 (0.91) |
| AMGO | 1.04 (0.62) | GTTO | 0.61 (0.35) | |
| BLJA | 0.25 (0.43) | RWBL | −0.99 (0.40) | |
| CEDW | 0.61 (0.60) | |||
| DEJU | 0.83 (1.03) | |||
| BHVI | −0.73 (0.36) | |||
| BLBW | −0.84 (0.29) | |||
| PIWO | −0.99 (0.99) | |||
| Snags per plot | BHVI | 1.21 (1.12) | CORA | −1.01 (0.44) |
| BLBW | 1.72 (0.70) | GTTO | −0.32 (0.36) | |
| BLJA | 0.05 (0.39) | SAVS | −0.58 (0.39) | |
| WIWR | 0.92 (0.56) | |||
| WTSP | 1.06 (0.68) | |||
| BAWW | -1.04 (0.72) | |||
| CHSP | -1.07 (0.55) | |||
| Canopy cover | BLJA | −0.61 (0.43) | WETA | 292.41 (1.28) |
| CEDW | −0.50 (0.42) | CORA | −0.63 (0.41) | |
| DEJU | −0.94 (0.56) | SAVS | −0.58 (0.34) | |
| Resource Provision | ||||
| Structures | BHVI | −0.59 (0.50) | GTTO | 0.49 (0.31) |
| BLJA | −0.08 (0.39) | SAVS | −0.68 (0.31) | |
| DEJU | −0.70 (0.44) | |||
| Food | BLJA | −0.33 (0.37) | GTTO | 0.30 (0.26) |
| SAVS | −0.43 (0.28) | |||
| Water | BLJA | 0.53 (0.82) | GTTO | −0.53 (0.32) |
| DEJU | 0.36 (0.49) | |||
| RBNU | 0.85 (0.72) | |||
| Alteration | BLJA | 0.13 (0.38) | GTTO | −0.40 (0.29) |
| WIWR | 0.47 (0.27) | |||
| WTSP | 0.56 (0.33) | |||
| BHVI | −0.55 (0.72) | |||
| CEDW | −0.47 (0.34) | |||
| Disturbance | ||||
| Pets | AMCR | 0.81 (0.74) | BHCO | 0.15 (0.12) |
| AMGO | 0.81 (0.74) | GTTO | 0.16 (0.09) | |
| BLJA | 0.03 (0.17) | SAVS | −0.15 (0.09) | |
| MAWA | 0.42 (0.14) | WEME | −0.30 (0.10) | |
| RBNU | 0.30 (0.16) | |||
| WIWR | 0.18 (0.13) | |||
| WTSP | 0.26 (0.18) | |||
| Noise | AMCR | 0.28 (0.16) | BHCO | 0.19 (0.17) |
| AMGO | 0.28 (0.16) | GTTO | −0.11 (0.12) | |
| BLJA | 0.12 (0.15) | |||
| CEDW | 0.22 (0.19) | |||
| BHVI | −0.24 (0.37) | |||
| Lights | BLJA | 0.19 (0.16) | CORA | 0.42 (0.31) |
| SOSP | 3.52 (1.37) | |||
| Humans | BHVI | −0.12 (0.10) | BHCO | 0.17 (0.11) |
| BLJA | −0.03 (0.08) | MODO | −0.21 (0.08) | |
References
- Struyk, R.; Angelici, K. The Russian dacha phenomenon. Hous. Stud. 1996, 11, 233–261. [Google Scholar] [CrossRef]
- Brown, D.G.; Johnson, K.M.; Loveland, T.R.; Theobald, D.M. Rural land–use trends in the conterminous United States, 1950–2000. Ecol. Apps. 2005, 15, 1851–1863. [Google Scholar] [CrossRef] [Green Version]
- Odell, E.A.; Knight, R.L. Songbird and medium-sized mammal communities associated with exurban development in Pitkin County, Colorado. Conserv. Biol. 2001, 15, 1143–1150. [Google Scholar] [CrossRef] [Green Version]
- Odell, E.A.; Theobald, D.M.; Knight, R.L. Incorporating ecology into land use planning: The songbird’s case for clustered development. J. Am. Plann. Assoc. 2003, 69, 72–82. [Google Scholar] [CrossRef]
- Hansen, A.J.; Knight, R.; Marzluff, J.; Powell, S.; Brown, K.; Gude, P.; Jones, K. Effects of exurban development on biodiversity: Patterns, mechanisms, and research needs. Ecol. Apps. 2005, 15, 1893–1905. [Google Scholar] [CrossRef]
- Clark, J.K.; McChesney, R.; Munroe, D.K.; Irwin, E.G. Spatial characteristics of exurban settlement pattern in the United States. Landsc. Urban Plan. 2009, 90, 178–188. [Google Scholar] [CrossRef]
- Allen, J.W.; O’Conner, R.J. Hierarchical correlates of bird assemblage structure on northeastern USA lakes. Environ. Monitor. Assess. 2000, 62, 15–35. [Google Scholar] [CrossRef]
- Cam, E.; Nichols, J.D.; Sauer, J.R.; Hines, J.E.; Flather, C.H. Relative species richness and community completeness: Birds and urbanization in the Mid-Atlantic states. Ecol. Apps. 2000, 10, 1196–1210. [Google Scholar] [CrossRef]
- Kluza, D.A.; Griffin, C.R.; DeGraaf, R.M. Housing developments in rural New England: Effects on forest birds. Anim. Conserv. 2000, 3, 15–26. [Google Scholar] [CrossRef]
- Blair, R.B. Birds and butterflies along urban gradients in two ecoregions of the United States: Is urbanization creating a homogeneous fauna? In Biotic Homogenization: The Loss of Diversity through Invasion and Extinction; Lockwood, J.L., McKinney, M.L., Eds.; Kluwer Academic Publishers: Boston, MA, USA, 2001. [Google Scholar]
- Chace, J.F.; Walsh, J.J. Urban effects on native avifauna: A review. Landsc. Urban Plan. 2006, 74, 46–69. [Google Scholar] [CrossRef]
- Heimlich, R.E.; Anderson, W.D. Development at the Urban Fringe and Beyond: Impacts on Agriculture and Rural Land; Agricultural Economic Report No. 803; U.S. Department of Agriculture, Economic Research Service: Washington, DC, USA, 2001.
- Barcus, H. Urban-rural migration in the USA: An analysis of residential satisfaction. Reg. Stud. 2004, 38, 643–657. [Google Scholar] [CrossRef]
- Radeloff, V.C.; Stewart, S.I.; Hawbaker, T.J.; Gimmi, U.; Pidgeon, A.M.; Flather, C.H.; Hammer, R.B.; Helmers, D.P. Housing growth in and near United States protected areas limits their conservation value. Proc. Natl. Acad. Sci. USA 2010, 107, 940–945. [Google Scholar] [CrossRef] [PubMed] [Green Version]
- Scott, J.M.; Davis, F.W.; McGhie, R.G.; Wright, R.G.; Groves, C.; Estes, J. Nature reserves: Do they capture the full range of America’s biological diversity? Ecol. Apps. 2001, 11, 999–1007. [Google Scholar] [CrossRef]
- Glennon, M.J.; Curran, R.P. How much is enough? Distribution and protection status of habitats in the Adirondacks. Adirondack J. Environ. Stud. 2013, 19, 36–46. [Google Scholar]
- Davis, J.S.; Nelson, A.C. The new “burbs”. The exurbs and their implications for planning policy. J. Am. Plann. Assoc. 1994, 60, 45–60. [Google Scholar] [CrossRef]
- Cairncross, F. The Death of Distance; Harvard Business School Press: Boston, MA, USA, 1997. [Google Scholar]
- Hansen, A.J.; Rasker, R.; Maxwell, B.; Rotella, J.J.; Johnson, J.D.; Parmenter, A.W.; Langner, U.; Cohen, W.B.; Lawrence, R.L.; Kraska, M.P.V. Ecological causes and consequences of demographic change in the new west. Bioscience 2002, 52, 151–162. [Google Scholar] [CrossRef] [Green Version]
- Hilty, J.A.; Merenlender, A.M. Studying biodiversity on private lands. Cons. Biol. 2003, 17, 132–137. [Google Scholar] [CrossRef]
- Walker, P.A.; Marvin, S.J.; Fortmann, L.P. Landscape changes in Nevada County reflect social and ecological transitions. Calif. Agric. 2003, 57, 115–121. [Google Scholar] [CrossRef]
- Johnson, B.E. Nature, affordability, and privacy as motivations for exurban living. Urban Geogr. 2008, 29, 705–723. [Google Scholar] [CrossRef]
- Kretser, H.E.; Hilty, J.; Glennon, M.; Burrell, J.; Smith, Z.; Knuth, B.A. Challenges of governance and land management on the exurban/wilderness frontier in the USA. In Beyond the Urban-rural Divide; Andersson, K., Eklund, E., Lehtola, M., Salmi, P., Eds.; Emerald Group Publishing, Limited: Bingley, UK, 2009. [Google Scholar]
- Baldwin, R.F.; Trombulak, S.C.; Baldwin, E.D. Assessing risk of large–scale habitat conversion in lightly settled landscapes. Landsc. Urban. Plan. 2009, 91, 219–225. [Google Scholar] [CrossRef]
- Wilcove, D.; Bean, M.; Bonnie, R.; McMillan, M. Rebuilding the Arc: Toward a More Effective Endangered Species Act for Private Land; Environmental Defense Fund: Washington, DC, USA, 1996. [Google Scholar]
- Miller, J.R.; Hobbs, R.J. Conservation where people live and work. Conserv. Biol. 2002, 16, 330–337. [Google Scholar] [CrossRef]
- Dinerstein, E.; Vynne, C.; Sala, E.; Joshi, A.R.; Fernando, S.; Lovejoy, T.E.; Mayorga, J.; Olson, D.; Asner, G.P.; Baillie, J.E.M.; et al. A global deal for nature: Guiding principles, milestones, and targets. Sci. Adv. 2019, 5, eaaw2869. [Google Scholar] [CrossRef] [PubMed] [Green Version]
- S. Res. 372. A Resolution Expressing the Sense of the Senate that the Federal Government Should Establish a National Goal of Conserving at Least 30 Percent of the Land and Ocean of the United States by 2030. 116th Congress. Available online: https://congress.gov/bill/116th-congress/senate-resolution/372/ (accessed on 8 January 2021).
- H. Res. 835. A Resolution Expressing the Sense of the House of Representatives that the Federal Government Should Establish a National Goal of Conserving at Least 30 Percent of the Land and Ocean of the United States by 2030. 116th Congress. Available online: https://congress.gov/bill/116th-congress/house-resolution/835/ (accessed on 8 January 2021).
- Maestas, J.D.; Knight, R.L.; Gilgert, W.C. Biodiversity and land use change in the American mountain west. Geogr. Rev. 2001, 91, 509–524. [Google Scholar]
- Beckmann, J.P.; Berger, J. Rapid ecological and behavioral changes in carnivores: The response of black bears (Ursus americanus) to altered food. J. Zool. 2003, 261, 207–212. [Google Scholar] [CrossRef] [Green Version]
- Baron, D. Beast in the Garden; W.W. Norton & Company: New York, NY, USA, 2004. [Google Scholar]
- Mitchell, J.C.; Klemens, M.W. Primary and secondary effects of habitat alteration. In Turtle Conservation; Klemens, M.W., Ed.; Smithsonsian Institution Press: Washington, DC, USA, 2000. [Google Scholar]
- Pidgeon, A.M.; Radeloff, V.C.; Flather, C.H.; Lepczyk, C.A.; Clayton, M.K.; Hawbaker, T.J.; Hammer, R.B. Associations of forest bird species richness with housing and landscape patterns across the USA. Ecol. Appl. 2007, 17, 1989–2010. [Google Scholar] [CrossRef]
- Fraterrigo, J.M.; Wiens, J.A. Bird communities of the Colorado Rocky Mountains along a gradient of exurban development. Landsc. Urban Plan. 2005, 71, 263–275. [Google Scholar] [CrossRef]
- Glennon, M.J.; Porter, W.F. Effects of land use management on biotic integrity: An investigation of bird communities. Biol. Cons. 2005, 126, 499–511. [Google Scholar] [CrossRef]
- Forman, R.T.T. Land Mosaics: The Ecology of Landscapes and Regions; Cambridge University Press: Cambridge, UK, 1997. [Google Scholar]
- Benton, T.; Vickery, J.A.; Wilson, J.D. Farmland biodiversity: Is habitat heterogeneity the key? Trends Ecol. Evol. 2003, 18, 182–188. [Google Scholar] [CrossRef]
- Dover, J.; Settele, J. The influences of landscape structure on butterfly distribution and movement: A review. J. Insect Conserv. 2009, 13, 3–27. [Google Scholar] [CrossRef]
- Luoto, M.; Heikkinen, R.K. Disregarding topographical heterogeneity biases species turnover assessments based in bioclimate models. Glob. Chang. Biol. 2008, 14, 1–12. [Google Scholar] [CrossRef]
- Kindvall, O. Habitat heterogeneity and survival in a bush cricket metapopulation. Ecology 1996, 77, 207–214. [Google Scholar] [CrossRef]
- Piha, H.; Luoto, M.; Piha, M.; Merilä, J. Anuran abundance and persistence in agricultural landscapes during a climatic extreme. Glob. Chang. Biol. 2007, 13, 300–311. [Google Scholar] [CrossRef]
- Oliver, T.; Roy, D.B.; Hill, J.K.; Brereton, T.; Thomas, C.D. Heterogeneous landscapes promote population stability. Ecol. Lett. 2010, 13, 473–484. [Google Scholar] [CrossRef] [PubMed]
- George, T.L.; Dobkin, D.S. Introduction: Habitat fragmentation and western birds. In Effects of Habitat Fragmentation on Birds in Western Landscapes: Contrasts with Paradigms from the Eastern United States, Studies in Avian Biology No. 25; George, T.L., Dobkin, D.S., Eds.; Cooper Ornithological Society, Allen Press, Inc: Lawrence, KS, USA, 2002. [Google Scholar]
- Glennon, M.J.; Kretser, H.E.; Hilty, J.A. Identifying common patterns in diverse systems: Effects of exurban development on birds of the Adirondack Park and the Greater Yellowstone Ecosystem, USA. Environ. Manag. 2014, 55, 453–466. [Google Scholar] [CrossRef] [PubMed]
- Glennon, M.J.; Kretser, H.E. Size of the ecological effect zone associated with exurban development in the Adirondack Park, N.Y. Landsc. Urban Plan. 2013, 112, 10–17. [Google Scholar] [CrossRef]
- Theobald, D.M.; Miller, J.R.; Hobbs, N.T. Estimating the cumulative effects of development on wildlife habitat. Landsc. Urban Plan. 1997, 39, 25–36. [Google Scholar] [CrossRef]
- Schlesinger, M.D.; Manley, P.N.; Holyoak, M. Distinguishing stressors acting on land bird communities in an urbanizing environment. Ecology 2008, 89, 2302–2314. [Google Scholar] [CrossRef]
- Gude, P.H.; Hansen, A.J.; Rasker, R.; Maxwell, B. Rates and drivers of rural residential development in the Greater Yellowstone. Landsc. Urban Plan. 2006, 77, 131–151. [Google Scholar] [CrossRef]
- Irwin, E.G.; Geoghegan, J. Theory, data, methods: Developing spatially explicit economic models of land use change. Agric. Ecosyst. Environ. 2001, 85, 7–23. [Google Scholar] [CrossRef] [Green Version]
- Daily, G.C.; Ehrlich, P.R.; Sanchez–Azofeifa, G.A. Countryside biogeography: Use of human-dominated habitats by the avifauna of southern Costa Rica. Ecol. Apps. 2001, 11, 1–13. [Google Scholar] [CrossRef]
- Ricketts, T.H.; Daily, G.C.; Ehrlich, P.R.; Fay, J.P. Countryside biogeography of moths in a fragmented landscape: Biodiversity in native and agricultural habitats. Conserv. Biol. 2001, 15, 378–388. [Google Scholar] [CrossRef] [Green Version]
- Horner-Devine, M.C.; Daily, G.C.; Ehrlich, P.R. Countryside biogeography of tropical butterflies. Cons. Biol. 2003, 17, 168–177. [Google Scholar] [CrossRef]
- Leopold, A. A Sand County Almanac: And Sketches Here and There; Oxford University Press: New York, NY, USA, 1949. [Google Scholar]
- Anderson, M.G.; Clark, M.; Ferree, C.E.; Jospe, A.; Olivero Sheldon, A.; Weaver, K.J. Northeast Habitat Guides: A Companion to the Terrestrial and Aquatic Habitat Maps; The Nature Conservancy, Eastern Conservation Science, Eastern Regional Office: Boston, MA, USA, 2013; Available online: https://www.conservationgateway.org/ConservationByGeography/NorthAmerica/UnitedStates/edc/reportsdata/hg/Pages/default.aspx (accessed on 23 November 2020).
- LANDFIRE Remap 2016 Existing Vegetation Type (EVT) CONUS. U.S. Geological Survey. Available online: https://www.landfire.gov/evt.php (accessed on 23 November 2020).
- Theobald, D.M. Placing exurban land-use change in a human modification framework. Front. Ecol. Environ. 2004, 2, 139–144. [Google Scholar] [CrossRef]
- New York State Constitution; Article XIV; Section 1; State of New York: New York, NY, USA, 1938.
- Ralph, C.G.; Droege, S.; Sauer, J.R. Managing and monitoring birds using point counts: Standards and applications. In Monitoring Bird Populations by Point Counts; Sauer, J.R., Droege, S., Eds.; Technical Report PSW-GTR-149; United States Department of Agriculture Forest Service: Albany, CA, USA, 1995. [Google Scholar]
- Martin, T.E.; Paine, C.R.; Conway, C.J.; Hochachka, W.M.; Jenkins, W. BBIRD Field Protocol; Montana Cooperative Wildlife Research Unit, University of Montana: Missoula, MT, USA, 1997. [Google Scholar]
- Dillman, D.A.; Smith, J.D.; Christian, L.M. Internet, Mail, and Mixed–mode Surveys: The Tailored Design Method, 3rd ed.; Wiley: Hoboken, NJ, USA, 2009. [Google Scholar]
- Rinehart, K.A.; Donovan, T.M.; Mitchell, B.R.; Long, R.A. Factors influencing occupancy patterns of Eastern newts across Vermont. J. Herpetol. 2009, 43, 521–531. [Google Scholar] [CrossRef]
- DeWan, A.A.; Sullivan, P.J.; Lembo, A.J.; Smith, C.R.; Maerz, J.C.; Lassoie, J.P.; Richmond, M.E. Using occupancy models of forest breeding birds to prioritize conservation planning. Biol. Cons. 2009, 142, 982–991. [Google Scholar] [CrossRef]
- Ferraz, G.; Nichols, J.D.; Hines, J.E.; Stouffer, P.C.; Bierregaard, R.O., Jr.; Lovejoy, T.E. A large–scale deforestation experiment: Effects of patch area and isolation on Amazon birds. Science 2007, 315, 238–241. [Google Scholar] [CrossRef] [Green Version]
- Hines, J.A. PRESENCE2–Software to Estimate Patch Occupancy and Related Parameters; United States Geological Survey Patuxent Wildlife Research Center: Denver, CO, USA, 2006. Available online: https://www.mbr-pwrc.usgs.gov/software/presence.html (accessed on 23 November 2020).
- MacKenzie, D.I. Modeling the probability of resource use: The effect of, and dealing with, detecting a species imperfectly. J. Wildl. Manag. 2006, 70, 367–374. [Google Scholar] [CrossRef]
- MacKenzie, D.I.; Nichols, J.D.; Royle, J.A.; Pollock, K.H.; Bailey, L.L.; Hines, J.E. Occupancy Estimation and Modeling: Inferring Patterns and Dynamics of Species Occurrence; Elsevier: Burlington, MA, USA, 2006. [Google Scholar]
- Chesser, R.T.; Billerman, S.M.; Burns, K.J.; Cicero, C.; Dunn, J.L.; Kratter, A.W.; Lovette, I.J.; Mason, N.A.; Rasmussen, P.C.; Remsen, J.V., Jr.; et al. Sixty–first supplement to the American Ornithological Society’s checklist of North American birds. Auk 2020, 137. [Google Scholar] [CrossRef]
- Burnham, K.P.; Anderson, D.R.; Huyvaert, K.P. AIC model selection and multimodel inference in behavioral ecology: Some background, observations, and comparisons. Behav. Ecol. Sociobiol. 2011, 65, 23–35. [Google Scholar] [CrossRef]
- Farr, C.M.; Pejchar, L.; Reed, S.E. Subdivision design and stewardship affect bird and mammal use of conservation developments. Ecol. Apps. 2017, 27, 1236–1252. [Google Scholar] [CrossRef]
- Bock, C.E.; Bock, J.H. Biodiversity and residential development beyond the urban fringe. In The Planner’s Guide to Natural Resource Conservation: The Science of Land Development Beyond the Metropolitan Fringe; Esparza, A.X., McPherson, G., Eds.; Springer Nature: New York, NY, USA, 2009. [Google Scholar]
- Bock, C.E.; Jones, Z.F.; Bock, J.H. The oasis effect: Response of birds to exurban development in a southwestern savanna. Ecol. Apps. 2008, 18, 1093–1106. [Google Scholar] [CrossRef] [PubMed]
- Morelli, T.L.; Smith, A.B.; Kastely, C.R.; Mastroserio, I.; Moritz, C.; Beissinger, S.R. Anthropogenic refugia ameliorate the severe climate-related decline of a montane mammal along its trailing edge. Proc. R. Soc. B 2012, 279, 4279–4286. [Google Scholar] [CrossRef] [PubMed] [Green Version]
- Böhning–Gaese, K. Determinants of avian species richness at different spatial scales. J. Biogeogr. 2007, 24, 49–60. [Google Scholar] [CrossRef]
- Groffman, P.M.; Cavender–Bares, J.; Bettez, N.D.; Grove, J.M.; Hall, S.J.; Heffernan, J.B.; Hobbie, S.E.; Larson, K.L.; Morse, J.L.; Neill, C.; et al. Ecological homogenization of urban USA. Front. Ecol. Environ. 2014, 12, 74–81. [Google Scholar] [CrossRef] [Green Version]
- Glennon, M.J.; Kretser, H.E. State of the birds in exurbia. Adirondack J. Environ. Stud. 2016, 20, 49–66. [Google Scholar]
- Rosenberg, K.V.; Dokter, A.M.; Blancher, P.J.; Sauer, J.R.; Smith, A.C.; Smith, P.A.; Stanton, J.C.; Panjabi, A.; Helft, L.; Parr, M.; et al. Decline of the North American Avifauna. Science 2019, 366, 120–124. [Google Scholar] [CrossRef]
- Avian Conservation Assessment Database. Partners in Flight c2019. Available online: http://pif.birdconservancy.org/files/US_Canada%20Regional%20ACAD%206–03–20.xlsx (accessed on 21 November 2020).
- Bollinger, E.K.; Peak, R.G. Depredation of artificial avian nests: A comparison of forest–field and forest–lake edges. Am. Midl. Nat. 1995, 143, 200–203. [Google Scholar] [CrossRef]
- Heske, E.J.; Robinson, S.K.; Brawn, J.D. Predator activity and predation on songbird nests on forest–field edges in east–central Illinois. Landsc. Ecol. 1999, 14, 345–354. [Google Scholar] [CrossRef]
- Goad, E.H.; Pejchar, L.; Reed, S.E.; Knight, R.L. Habitat use by mammals varies along an exurban development gradient in northern Colorado. Biol. Cons. 2014, 176, 172–182. [Google Scholar] [CrossRef]
- Farias, V.; Fuller, T.K.; Sauvajot, R.M. Activity and distribution of gray foxes (Urocyon cinereoargenteus) in southern California. Southwest. Nat. 2012, 57, 176–181. [Google Scholar] [CrossRef]
- Pita, R.; Mira, A.; Moreira, F.; Morgado, R.; Beja, P. Influence of landscape characteristics on carnivore density and abundance in Mediterranean farmland. Agric. Ecosyst. Environ. 2009, 132, 57–65. [Google Scholar] [CrossRef] [Green Version]
- Glennon, M.J.; Porter, W.F. Impacts of land use management on small mammals in the Adirondack Park, New York. Northeast. Nat. 2007, 14, 323–342. [Google Scholar] [CrossRef]
- Malpass, J.S.; Rodewald, A.D.; Matthews, S.N. Species-dependent effects of bird feeders on nest predators and nest survival of urban American robins and northern cardinals. Condor 2017, 119, 1–16. [Google Scholar] [CrossRef] [Green Version]
- Bock, C.E.; Bock, J.H. Abundance and variety of birds associated with point sources of water in southwestern New Mexico, USA. J. Arid Environ. 2015, 116, 53–56. [Google Scholar] [CrossRef]
- Soulé, M.E.; Bolger, D.T.; Alberts, A.C.; Wright, J.; Sorice, M.; Hill, S. Reconstructed dynamics of rapid extinctions of chaparral-requiring birds in urban habitat islands. Conserv. Biol. 1988, 2, 75–92. [Google Scholar] [CrossRef] [Green Version]
- Ritchie, E.G.; Dickman, C.R.; Letnic, M.; Vanak, A.T. Dogs as predators and trophic regulators. In Free-Ranging Dogs and Wildlife Conservation; Gompper, M.E., Ed.; Oxford University Press: Oxford, UK, 2014. [Google Scholar]
- Banks, P.B.; Bryant, J.V. Four–legged friend or foe? Dog walking displaces native birds from natural areas. Biol. Lett. 2007, 3, 611–613. [Google Scholar] [CrossRef] [PubMed]
- Length, B.E.; Knight, R.L.; Brennan, M.E. The effects of dogs on wildlife communities. Nat. Areas J. 2008, 28, 218–227. [Google Scholar] [CrossRef]
- Rich, C.; Longcore, T. (Eds.) Ecological Consequences of Artificial Night Lighting; Island Press: Washington, DC, USA, 2006. [Google Scholar]
- Miller, M.W. Apparent effects of light pollution on singing behavior of American robins. Condor 2006, 108, 130–139. [Google Scholar] [CrossRef]
- Barber, J.R.; Crooks, K.J.; Fristrup, K.M. The costs of chronic noise exposure for terrestrial organisms. Trends Ecol. Evol. 2009, 25, 180–189. [Google Scholar] [CrossRef]
- Schroeder, J.; Nakagawa, S.; Cleasby, I.R.; Burke, T. Passerine birds breeding under chronic noise experience reduced fitness. PLoS ONE 2012, 7, e39200. [Google Scholar] [CrossRef] [Green Version]
- Reijnen, R.; Foppen, R.; Terbraak, C.; Thissen, J. The effects of car traffic on breeding bird populations in woodland. 3. Reduction of density in relation to proximity of the main roads. J. Appl. Ecol. 1995, 32, 187–202. [Google Scholar] [CrossRef]
- Francis, C.D.; Ortega, C.P.; Cruz, A. Noise pollution changes avian communities and species interactions. Curr. Biol. 2009, 19, 1415–1419. [Google Scholar] [CrossRef] [PubMed] [Green Version]
- Francis, C.D.; Ortega, C.P.; Kennedy, R.I.; Nylander, P.J. Are nest predators absent from noisy areas or unable to locate nests? Ornithol. Monogr. 2012, 74, 101–110. [Google Scholar]
- Kight, C.R.; Hinders, M.K.; Swaddle, J.P. Acoustic space is affected by anthropogenic habitat features: Implications for avian vocal communication. Ornithol. Monogr. 2012, 74, 47–62. [Google Scholar]
- Golding, S.A.; Winkler, R.L. Tracking urbanization and exurbs: Migration across the rural-urban continuum, 1990–2016. Popul. Res. Policy Rev. 2020, 39, 835–859. [Google Scholar] [CrossRef]
- Hughes, C.J. Coronavirus Escape: To the Suburbs. New York Times. 8 May 2020. Available online: https://www.nytimes.com/2020/05/08/realestate/coronavirus–escape–city–to–suburbs.html (accessed on 23 November 2020).
- Hostetler, M. Beyond design: The importance of construction and post–construction phases in green developments. Sustainability 2010, 2, 1128–1137. [Google Scholar] [CrossRef] [Green Version]
- Hostetler, M. The Green Leap: A Primer for Conserving Biodiversity in Subdivision Development; University of California Press: Berkeley, CA, USA, 2012. [Google Scholar]
- Hostetler, M.; Drake, D. Conservation subdivisions: A wildlife perspective. Landsc. Urban Plan. 2009, 90, 95–101. [Google Scholar] [CrossRef]
- Reed, S.E.; Hilty, J.A.; Theobald, D.M. Guidelines and incentives for conservation development in local land-use regulations. Conserv. Biol. 2014, 28, 258–268. [Google Scholar] [CrossRef]
- Kretser, H.E.; Dale, E.; Karasin, L.; Reed, S.E.; Goldstein, L.J. Factors influencing adoption and implementation of conservation development ordinances in the rural United States. Soc. Nat. Resour. 2019, 9, 1021–1039. [Google Scholar] [CrossRef]
- Lerman, S.H.; Turner, V.K.; Bang, C. Homeowner associations as a vehicle for promoting native urban biodiveristy. Ecol. Soc. 2012, 17, 45. [Google Scholar] [CrossRef] [Green Version]
Figure 1.
Proportion of species for which each covariate occurred in top models (ΔAIC ≤ 4.0) predicting bird habitat use as affected by variables describing (a) habitat context, (b) habitat structure, (c) resource provision, and (d) disturbance in exurban subdivisions in the eastern (Adirondack Park, ADK) and western (Greater Yellowstone, GYE) systems. Shading indicates the positive (grey) or negative (black) influence of each variable on bird habitat use.


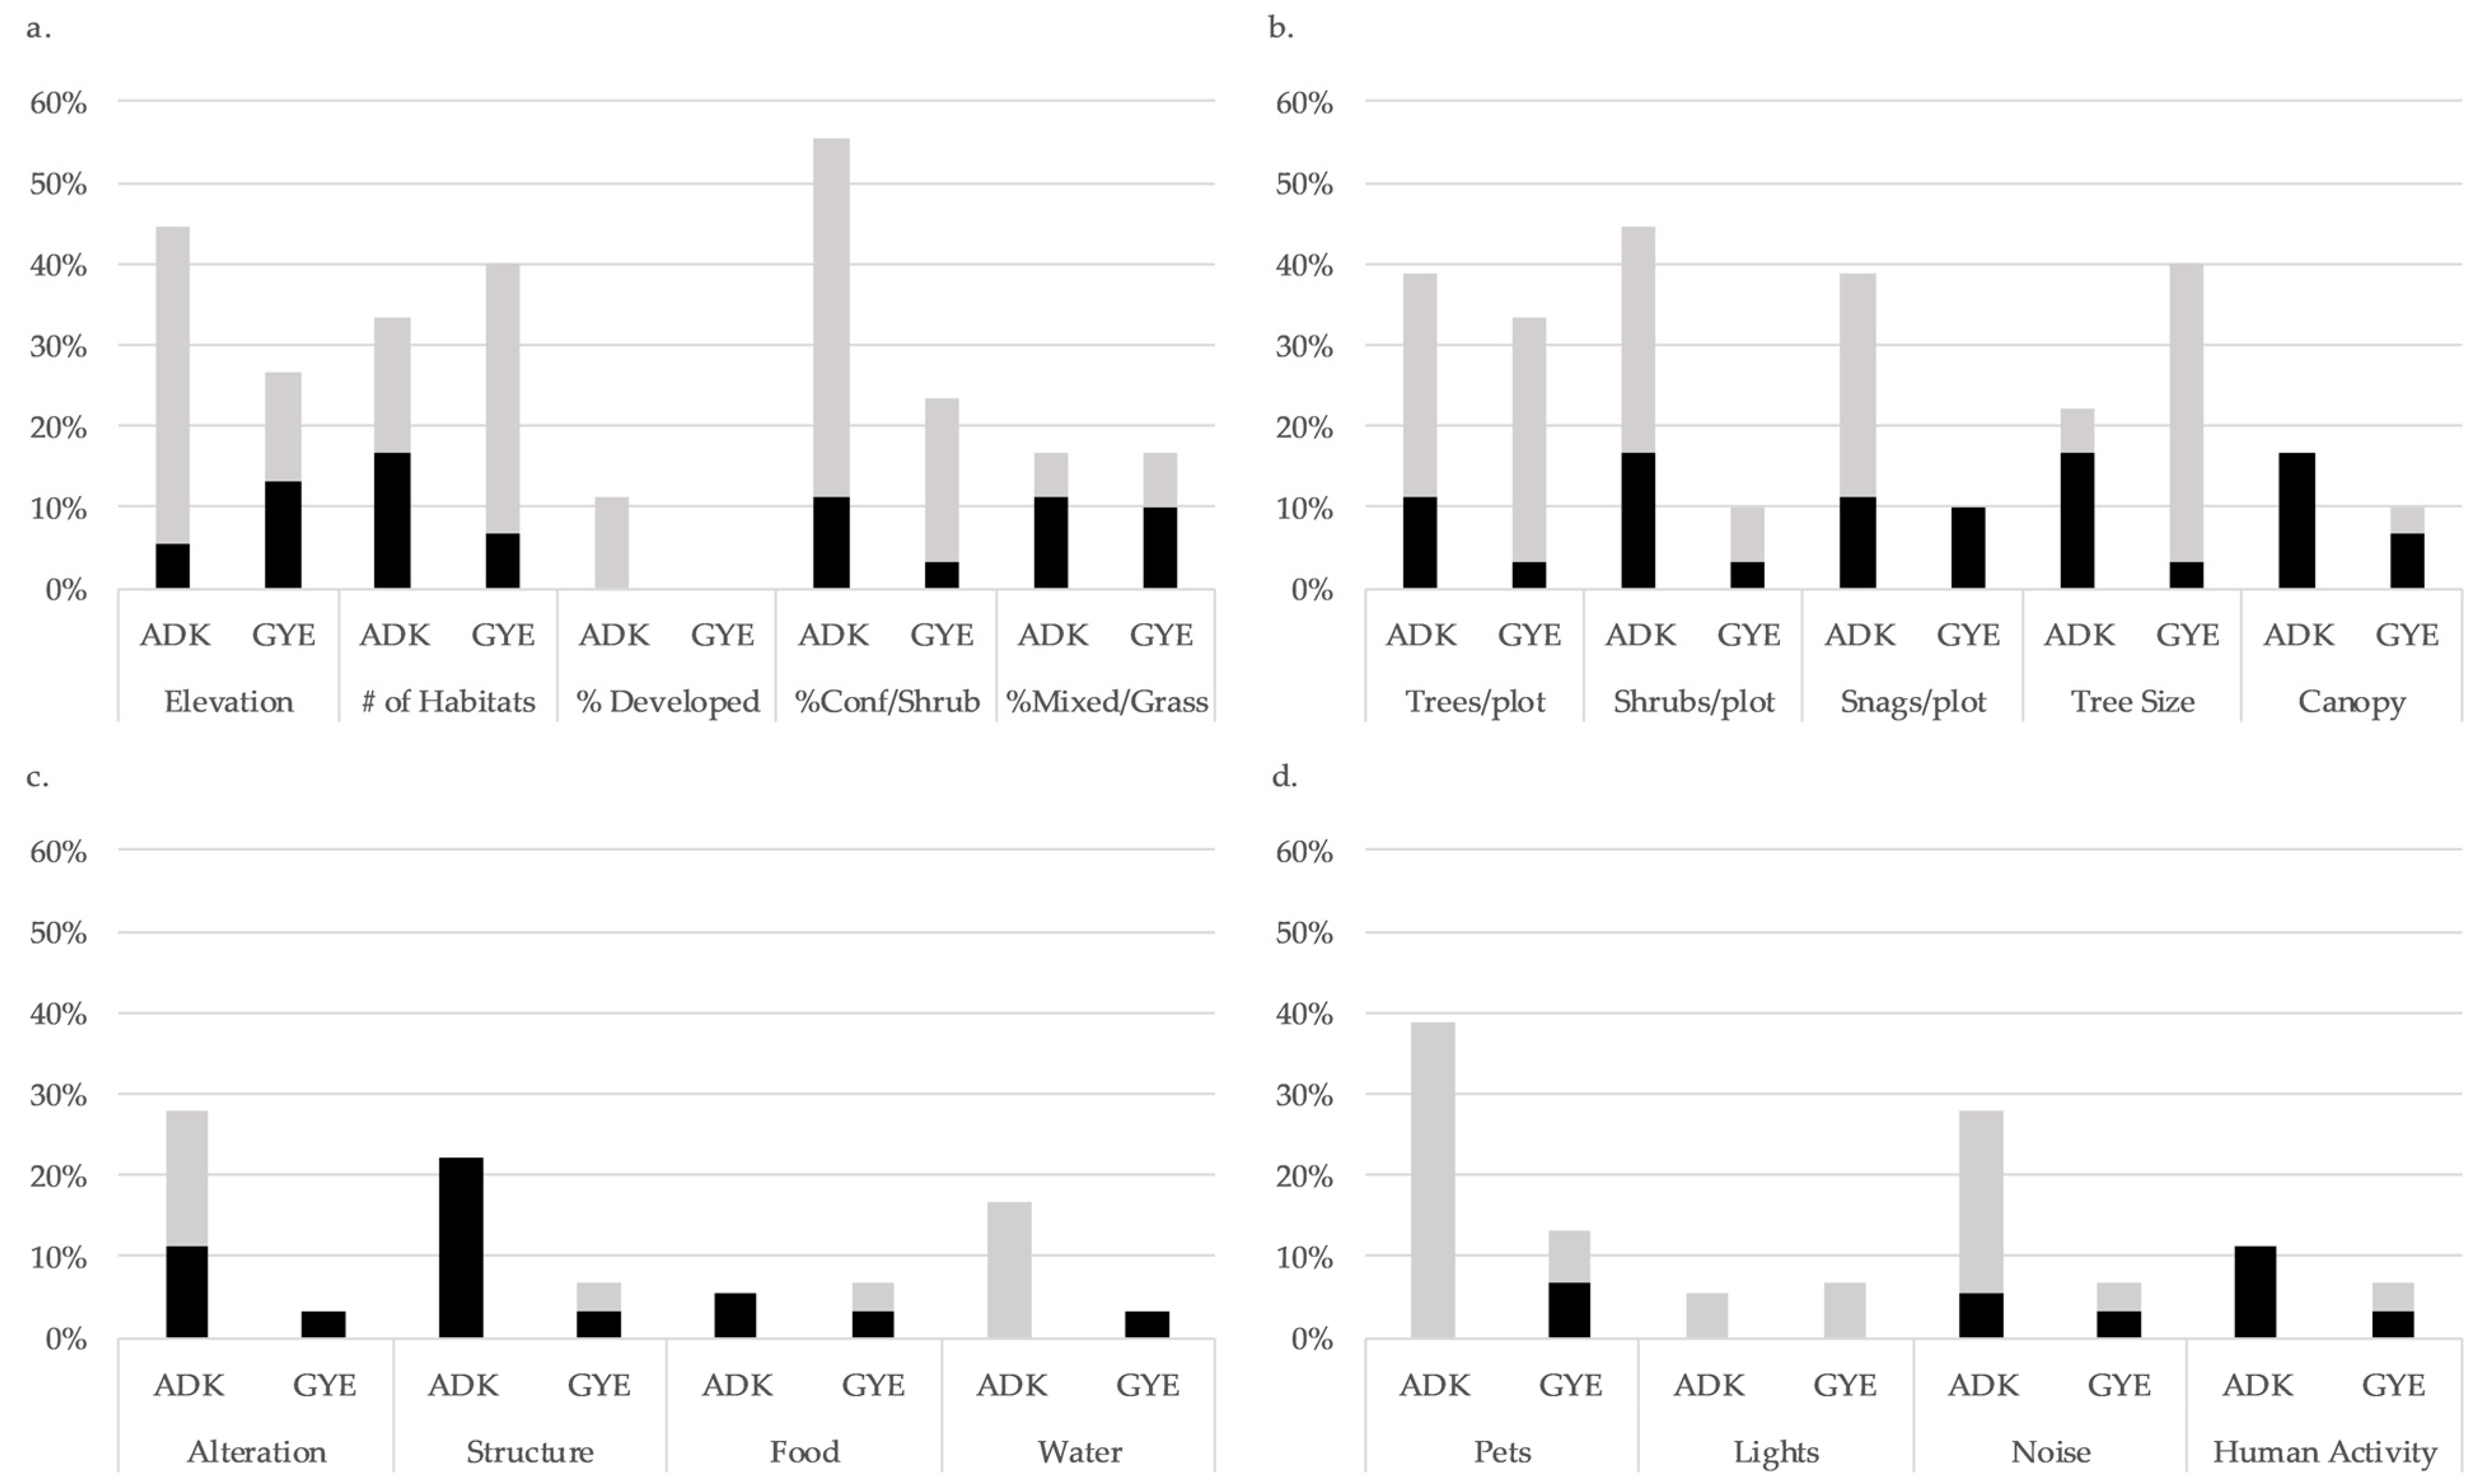
Table 1.
Checklist used to record the presence of anthropogenic/land-use features observed at individual exurban parcels in Essex County, NY and Madison County, MT, USA.
Table 1.
Checklist used to record the presence of anthropogenic/land-use features observed at individual exurban parcels in Essex County, NY and Madison County, MT, USA.
| Structures | Habitat Alteration |
|---|---|
| House | Lawn |
| Barn | Pasture |
| Shed | Logging/Forestry |
| Closed garage | Landscaping |
| Other outbuilding | Rock |
| Fence | |
| Powerline | Transportation |
| Satellite dish | Primary road |
| Picnic table | Secondary road |
| Outdoor seating | Dirt road |
| Playset | Recreational trail/use |
| Target (shooting) | Vehicle(s) |
| Deck/Gazebo | Motorcycle |
| Firepit | ATV |
| Birdhouse(s) | Snowmobile |
| Golf cart | |
| Food Sources | |
| Flower garden(s) | Disturbance |
| Vegetable garden(s) | Cat |
| Fruiting shrubs/trees | Dog |
| Bird feeder | Cattle |
| Grill | Horses |
| Compost | Other livestock |
| Pet food | Outdoor lights |
| Open garbage | Evidence of outdoor lights on at night |
| Lawnmower | |
| Water sources | Snowblower |
| Bird bath | Chainsaw |
| Pool | Power tools |
| Water trough | Active construction |
| Stock tank | Kid toys |
| Hot tub | |
| Other water sources |
Table 2.
Occupancy models used to examine the relative roles of human disturbance vs. alteration of habitat structure in influencing avian communities in exurban subdivisions in Essex County, NY and Madison County, MT; ψ = probability of occupancy (use), p = probability of detection.
Table 2.
Occupancy models used to examine the relative roles of human disturbance vs. alteration of habitat structure in influencing avian communities in exurban subdivisions in Essex County, NY and Madison County, MT; ψ = probability of occupancy (use), p = probability of detection.
| Model |
|---|
| ψ (.), p (date, time, temperature, wind, sky, observer) |
| ψ (trees per plot), p (date, time, temperature, wind, sky, observer) |
| ψ (shrubs per plot), p (date, time, temperature, wind, sky, observer) |
| ψ (snags per plot), p (date, time, temperature, wind, sky, observer) |
| ψ (mean tree size), p (date, time, temperature, wind, sky, observer) |
| ψ (canopy cover), p (date, time, temperature, wind, sky, observer) |
| ψ (developed cover), p (date, time, temperature, wind, sky, observer) |
| ψ (conifer cover 1), p (date, time, temperature, wind, sky, observer) |
| ψ (mixed forest cover 1), p (date, time, temperature, wind, sky, observer) |
| ψ (number of habitats), p (date, time, temperature, wind, sky, observer) |
| ψ (mean elevation), p (date, time, temperature, wind, sky, observer) |
| ψ (structure), p (date, time, temperature, wind, sky, observer) |
| ψ (alteration), p (date, time, temperature, wind, sky, observer) |
| ψ (food), p (date, time, temperature, wind, sky, observer) |
| ψ (water), p (date, time, temperature, wind, sky, observer) |
| ψ (pets), p (date, time, temperature, wind, sky, observer) |
| ψ (noise), p (date, time, temperature, wind, sky, observer) |
| ψ (lights), p (date, time, temperature, wind, sky, observer) |
| ψ (humans), p (date, time, temperature, wind, sky, observer) |
1 Conifer cover and mixed forest cover pertain to ADK and were replaced with shrubland and grassland cover in models for the GYE.
Table 3.
Estimated use probabilities for individual bird species of subdivisions (Ψs) and control sites (Ψc) in Essex County, NY (Adirondack Park), and Madison County, MT (Greater Yellowstone) and associated standard errors (SE). Bold text denotes species for which model selection indicated support for a subdivision treatment effect (ΔAIC ≤ 2). AOU denotes American Ornithologists’ Union four-letter codes [68].
| Common Name | Scientific Name | AOU | Ψs | SE | Ψc | SE |
|---|---|---|---|---|---|---|
| Adirondack Park | ||||||
| American crow | Corvus brachyrhynchos | AMCR | 0.90 | 0.04 | 0.72 | 0.05 |
| American goldfinch | Spinus tristis | AMGO | 0.79 | 0.13 | 0.27 | 0.07 |
| Black-and-white warbler | Mniotilta varia | BAWW | 0.60 | 0.06 | 0.60 | 0.06 |
| Blue-headed vireo | Vireo solitaries | BHVI | 0.95 | 0.04 | 0.96 | 0.04 |
| Blackburnian warbler | Setophaga fusca | BLBW | 0.79 | 0.04 | 0.81 | 0.04 |
| Blue jay | Cyanocitta cristata | BLJA | 0.91 | 0.03 | 0.93 | 0.03 |
| Black-thr. blue warbler | Setophaga caerulescens | BTBW | 0.45 | 0.05 | 0.76 | 0.05 |
| Cedar waxwing | Bombycilla cedrorum | CEDW | 0.84 | 0.08 | 0.68 | 0.09 |
| Chipping sparrow | Spizella passerina | CHSP | 0.65 | 0.06 | 0.06 | 0.03 |
| Dark-eyed junco | Junco hyemalis | DEJU | 0.80 | 0.07 | 0.55 | 0.07 |
| Hairy woodpecker | Dryobates villosus | HAWO | 0.85 | 0.14 | 0.85 | 0.13 |
| Hermit thrush | Catharus guttatus | HETH | 0.89 | 0.04 | 0.94 | 0.03 |
| Magnolia warbler | Setophaga magnolia | MAWA | 0.20 | 0.05 | 0.39 | 0.05 |
| Pileated woodpecker | Dryocopus pileatus | PIWO | 0.88 | 0.12 | 0.84 | 0.11 |
| Red-breasted nuthatch | Sitta canadensis | RBNU | 0.69 | 0.06 | 0.89 | 0.05 |
| Winter wren | Troglodytes hiemalis | WIWR | 0.54 | 0.05 | 0.84 | 0.04 |
| White-throated sparrow | Zonotrichia albicollis | WTSP | 0.20 | 0.04 | 0.38 | 0.05 |
| Yellow-bell. sapsucker | Sphyrapicus varius | YBSA | 0.67 | 0.06 | 0.80 | 0.06 |
| Greater Yellowstone | ||||||
| Black-billed magpie | Pica hudsonia | BBMA | 0.66 | 0.06 | 0.43 | 0.06 |
| Brown-headed cowbird | Molothrus ater | BHCO | 0.88 | 0.04 | 0.91 | 0.04 |
| Brewer’s sparrow | Spizella breweri | BRSP | 0.81 | 0.04 | 0.81 | 0.04 |
| Chipping sparrow | Spizella passerina | CHSP | 0.82 | 0.04 | 0.83 | 0.04 |
| Clark’s nutcracker | Nucifraga columbiana | CLNU | 0.44 | 0.10 | 0.59 | 0.11 |
| Common raven | Corvus corax | CORA | 0.95 | 0.04 | 0.96 | 0.04 |
| Dark-eyed junco | Junco hyemalis | DEJU | 0.52 | 0.05 | 0.55 | 0.05 |
| Dusky flycatcher | Empidonax oberholseri | DUFL | 0.59 | 0.06 | 0.60 | 0.06 |
| Green-tailed towhee | Pipilo chlorurus | GTTO | 0.35 | 0.05 | 0.35 | 0.05 |
| Horned lark | Eremophila alpestris | HOLA | 0.26 | 0.06 | 0.35 | 0.06 |
| House wren | Troglodytes aedon | HOWR | 0.67 | 0.06 | 0.54 | 0.07 |
| Mountain bluebird | Sialia currucoides | MOBL | 0.88 | 0.04 | 0.57 | 0.06 |
| Mountain chickadee | Poecile gambeli | MOCH | 0.69 | 0.05 | 0.69 | 0.05 |
| Mourning dove | Zenaida macroura | MODO | 0.44 | 0.08 | 0.35 | 0.07 |
| Northern flicker | Colaptes auratus | NOFL | 0.72 | 0.05 | 0.68 | 0.06 |
| Pine siskin | Spinus pinus | PISI | 0.79 | 0.04 | 0.77 | 0.05 |
| Red-breasted nuthatch | Sitta canadensis | RBNU | 0.41 | 0.07 | 0.49 | 0.07 |
| Ruby-crowned kinglet | Regulus calendula | RCKI | 0.52 | 0.05 | 0.53 | 0.05 |
| Rock wren | Salpinctes obsoletus | ROWR | 0.30 | 0.07 | 0.23 | 0.07 |
| Red-winged blackbird | Agelaius phoeniceus | RWBL | 0.39 | 0.06 | 0.13 | 0.04 |
| Savannah sparrow | Passerculus sandwichensis | SAVS | 0.50 | 0.05 | 0.51 | 0.05 |
| Song sparrow | Melospiza melodia | SOSP | 0.27 | 0.06 | 0.22 | 0.06 |
| Vesper’s sparrow | Pooecetes gramineus | VESP | 0.84 | 0.04 | 0.66 | 0.06 |
| Warbling vireo | Vireo gilvus | WAVI | 0.61 | 0.05 | 0.65 | 0.05 |
| White-crowned sparrow | Zonotrichia leucophrys | WCSP | 0.59 | 0.06 | 0.56 | 0.06 |
| Western meadowlark | Sturnella neglecta | WEME | 0.76 | 0.06 | 0.65 | 0.06 |
| Western tanager | Piranga ludoviciana | WETA | 0.62 | 0.10 | 0.73 | 0.11 |
| Western wood-pewee | Contopus sordidulus | WWPE | 0.56 | 0.07 | 0.51 | 0.07 |
| Yellow warbler | Setophaga petechia | YEWA | 0.54 | 0.05 | 0.52 | 0.05 |
| Yellow-rumped warbler | Setophaga coronata | YRWA | 0.67 | 0.04 | 0.67 | 0.04 |
Table 4.
Survey responses of landowners in Essex County, NY (ADK) and Madison County, MT (GYE) to questions pertaining to potential disturbances to wildlife; n = number of respondents to each question within each landscape.
Table 4.
Survey responses of landowners in Essex County, NY (ADK) and Madison County, MT (GYE) to questions pertaining to potential disturbances to wildlife; n = number of respondents to each question within each landscape.
| Pets 1 | ADK (n = 114) | GYE (n = 97) |
|---|---|---|
| Horses live on my land | 2.5% | 16.5% |
| Chickens live on my land | 1.6% | 8.2% |
| Cats live on my land | 9.8% | 24.7% |
| Dogs live on my land | 41% | 67% |
| A dog went outside during the day | 2.88 | 3.74 |
| A dog went outside during the night | 2.48 | 2.83 |
| A dog chased or killed wildlife | 1.15 | 1.30 |
| A cat went outside during the day | 1.25 | 1.87 |
| A cat went outside during the night | 1.15 | 1.74 |
| A cat chased or killed wildlife | 1.13 | 1.27 |
| Noise 1 | ADK (n = 117) | GYE (n = 9 7) |
| Mowed the lawn with a gas or electric lawnmower | 2.54 | 2.62 |
| Listened to music outside my house | 1.87 | 2.01 |
| Worked on a small construction project around my house (painting, installing new windows, etc.) | 2.46 | 2.82 |
| Used power tools (e.g., chainsaw, leaf blower) | 2.51 | 2.40 |
| Worked on large construction project around my house (room addition, constructed outbuilding, etc.) | 21% | 26% |
| Human Activity on Property 1 | ADK (n = 117) | GYE (n = 97) |
| Used a grill outside | 2.79 | 3.11 |
| Ate meals outside my house (e.g., on a porch, by a fire pit, etc.) | 2.97 | 3.02 |
| Had kids playing in my yard | 2.27 | 2.59 |
| Engaged in non-motorized winter recreation on my property | 2.41 | 1.86 |
| Walked dogs on my property | 2.71 | 3.27 |
| Hiked trails | 2.98 | 3.01 |
| Mountain biked | 1.47 | 1.53 |
| Went horseback riding | 1.04 | 1.73 |
| Went off-roading (i.e., with an ATV, dirt bike, snowmobile) | 1.15 | 1.77 |
| Used a trail camera or wildlife camera | 24% | 15% |
| Went birdwatching | 57% | 60% |
| Lights 2 | ADK (n = 119) | GYE (n = 97) |
| About how many outdoor lights do you have affixed to various places outside of your house or other buildings on your property? | 4.67 | 4.03 |
| At what times do you have these (outdoor) lights on? | ||
| Evenings (after sundown) | 73.8% | 55.7% |
| Overnight | 2.5% | 4.1% |
| Mornings (before sunrise) | 3.3% | 6.2% |
| How frequently are these outdoor lights on? | 9% | 10.3% |
| About how many indoor lights do you have on at night that shine through your windows without curtains? | 5.10 | 3.05 |
| At what times do you have these (indoor) lights on? | ||
| Evenings (after sundown) | 82% | 79.4% |
| Overnight | 4.1% | 4.1% |
| Mornings (before sunrise) | 11.5% | 6.2% |
1 For Pets, Noise, and Human Activity, proportions represent the percent of respondents answering yes on a yes/no question; numerical values represent means reported on a frequency question whereby respondents were asked to indicate how frequently each of the following activities took place at their house in the past year when it was occupied or in the season where the activity was appropriate: 1 = never, 2 = yearly, 3 = monthly, 4 = weekly, 5 = daily. 2 For Lights, proportions represent the percent of respondents answering yes on a yes/no question about when lights are left on at their homes and how frequently (Never, Sometimes, Nightly; percent Nightly reported); numerical values represent means in response to questions about numbers of lights present.
Publisher’s Note: MDPI stays neutral with regard to jurisdictional claims in published maps and institutional affiliations. |
© 2021 by the authors. Licensee MDPI, Basel, Switzerland. This article is an open access article distributed under the terms and conditions of the Creative Commons Attribution (CC BY) license (http://creativecommons.org/licenses/by/4.0/).
Share and Cite
MDPI and ACS Style
Glennon, M.J.; Kretser, H.E. Exurbia East and West: Responses of Bird Communities to Low Density Residential Development in Two North American Regions. Diversity 2021, 13, 42. https://doi.org/10.3390/d13020042
AMA Style
Glennon MJ, Kretser HE. Exurbia East and West: Responses of Bird Communities to Low Density Residential Development in Two North American Regions. Diversity. 2021; 13(2):42. https://doi.org/10.3390/d13020042
Chicago/Turabian StyleGlennon, Michale J., and Heidi E. Kretser. 2021. "Exurbia East and West: Responses of Bird Communities to Low Density Residential Development in Two North American Regions" Diversity 13, no. 2: 42. https://doi.org/10.3390/d13020042
Note that from the first issue of 2016, this journal uses article numbers instead of page numbers. See further details here.