Article

Fittonia verschaffeltii Response to Artificial Light Treatments: BIOMASS, Nutrient Concentrations and Physiological Changes

by
Pedro García-Caparros
1,
Eva María Almansa
1,
Francisco Javier Barbero
2,
Rosa María Chica
3 and
María Teresa Lao
1,*
1
Agronomy Department of Higher Engineering School, University of Almeria, CIAIMBITAL, Agrifood Campus of International Excellence ceiA3. Ctra. Sacramento s/n, La Cañada de San Urbano, 04120 Almería, Spain
2
Chemistry and Physics Department of Higher Engineering School, University of Almería, CIAIMBITAL, Agrifood Campus of International Excellence ceiA3, Ctra. Sacramento s/n, La Cañada de San Urbano, 04120 Almería, Spain
3
Engineering Department of Higher Engineering School, University of Almería, CIAIMBITAL, Agrifood Campus of International Excellence ceiA3, Ctra. Sacramento s/n, La Cañada de San Urbano, 04120 Almería, Spain
*
Author to whom correspondence should be addressed.
Agronomy 2020, 10(1), 126; https://doi.org/10.3390/agronomy10010126
Submission received: 1 December 2019 / Revised: 9 January 2020 / Accepted: 12 January 2020 / Published: 15 January 2020
(This article belongs to the Special Issue Control of LED Lighting Based on Plant Physiological Principles)

Abstract

:
The purpose of the present study was to evaluate the effects of different light treatments on biomass, nutrient concentrations and physiological parameters of Fittonia verschaffeltii (Lem) Van Houtte. The aim was to establish a methodology to evaluate the effect of photosynthetically active radiation (PAR) emitted by lamps on biomass. The light treatments used were tube luminescent Dunn (TL-D), tube luminescent Dunn + light emitting diodes (LEDs) and Tube luminescent 5 (TL-5). At the end of the experimental period, biomass, nutritional, biochemical, and physiological parameters were assessed. A clear reduction in total plant dry weight under TL-D + LEDs at the end of the experiment was recorded. With respect to nutrient concentration in the different organs assessed, there was no clear response under the different light treatments. The growth under TL-D lamps resulted in the highest concentration of total soluble sugars and starch in leaves, whereas the highest value of indole 3-acetic acid concentration was under TL-5 lamps. Plants grown under TL-D + LEDs showed the lowest values of chlorophyll a, b and a + b. The relationship proposed between integrated use of spectral energy (IUSE) and total dry weight (TDW) showed a good correlation with an R2 value of 0.86, therefore we recommend this methodology to discern the effects of the different spectral qualities on plant biomass.

1. Introduction

Illumination is a powerful environmental stimulus with impacts on a wide range of plant metabolic processes [1]. The ability of plants to sense and respond to light depends on their photosynthetic pigments and photoreceptors that absorb different wavelengths of the light [2].
In plant sciences, a wide variety of lamps have been used to study the effects of spectral quality on plant growth. Growth improvements have been obtained by adjusting the spectral quality [3]. Fluorescent lamps (FL) and high intensity discharge (HID) lamps (e.g., high pressure sodium (HPS)) are the most commonly used artificial light sources for plant research and greenhouse horticulture [4]. Currently, light emitting diodes (LEDs) are replacing these light sources for plant growth under controlled conditions. The use of LEDs can enable commercial growers to obtain plants with desired characteristics and to optimize the spectra for each crop and stage of development [5]. The LEDs have several distinctive advantages like small volume, single spectrum wavelength, long life, directional light emission and little heat production and high energy efficiency power [6]. In our experiment, we investigated the effects of fluorescent lamps and supplementary LED lighting in Fittonia verschaffeltii (Lem) Van Houtte. Mosaic plant (F. verschaffeltii) is an evergreen creeping herbaceous perennial plant native to the Peruvian rainforest, belonging to the family Acanthaceae. It is appreciated by nursery growers for its attractive and decorative foliage and is often used in terrariums or arrangements in various combinations of plants to decorate offices and housing [7].
Many earlier studies have dealt with the use of LEDs as source lighting in greenhouses for horticultural and ornamental plants production [8,9,10,11]. Nevertheless, there is little information on the effects of light treatments on this much-appreciated ornamental species.
On the other hand, the light conversion efficiency in photosynthesis has been well studied by Radmer and Kok [12], as has the relationship between photosynthetically active radiation (PAR) and biomass [13]. Nevertheless, under artificial light, spectral quality differences in PAR region may generate differences between lamps and as consequence in the use of energy by the plant. This work has tested the hypothesis that adequate crop management in horticulture using different lamp types including LEDs is only possible when the plant’s response to spectral quality and intensity of the given lamp is known in depth. For this, we studied the effects of spectral composition from three different sources of light on biomass production, nutrient concentration and physiological parameters in Fittonia verschaffeltii.

2. Materials and Methods

2.1. Experimental Design and Treatments

Rooted cuttings (plants) of F. verschaffeltii were acquired from a commercial nursery (Las Fresas, El Ejido, Almería, Spain) with an initial total dry weight of 1.34 ± 0.10 g. Each plant was transplanted into 1.5 L polyethylene pots containing Sphagnum peat-moss (Kekkila Finnpeat; Projar, Valencia, Spain, with the following characteristics: porosity (95%), water retention capacity (53%)). During the trial (8 weeks), the pots were scheduled for follow-up in a growth chamber where they were randomly assigned to each light treatment. The growth chamber was set at a constant (day/night) 25 °C and a relative humidity of 55% to minimize any potentially confounding effect of a diurnal temperature difference or relative humidity on extension growth. The plants were grown under a 16 h-8 h light-dark photoperiod and irrigated manually every day with a Steiner nutrient solution [14] in order to avoid any water or nutrient limitation. To further minimize any edge or position effects within each treatment, the pots were rearranged every other day.
The experiment consisted of three light treatments: TL-D (9067 cd) (Tube luminescent Dunn (Ø = 26 mm)) treatment (Fluorescent TL-D 18W (4 light Philips TCS097 × 2 lamps, Philips Lighting Spain, Madrid, Spain)) with a power of 144 W, TL-D + LEDs treatment (9067 cd) (Fluorescent TL-D 18W (3 light Philips TCS097 × 2 lamps, Philips Lighting Spain, Madrid, Spain)) with a power of 108 W + Pure Blue and Pure Red Mix-Light-Emitting Diodes (BR-LEDs) RGB (4 lines ALUM 40 × 25 LED SMD RGB × 9 W with console DN-RGB FIBER LIGHT, Modular Signs, Murcia, Spain) with a power of 36 W resulting in total in 144 W, and TL-5 (8815 cd) (Tube luminescent (Ø = 16 mm)) treatment (High Efficiency Fluorescent TL-5 35W (2 light MAXOS 4M691 × 2 lamps, Philips Lighting Spain, Madrid, Spain)) with a power of 140 W.
The experimental design consisted of three light treatments, four blocks, and five plants (one plant per pot) per block giving a total of 60 plants per species, plus border plants. The selection of these light treatments was done following the recommendations given by local nursery growers.

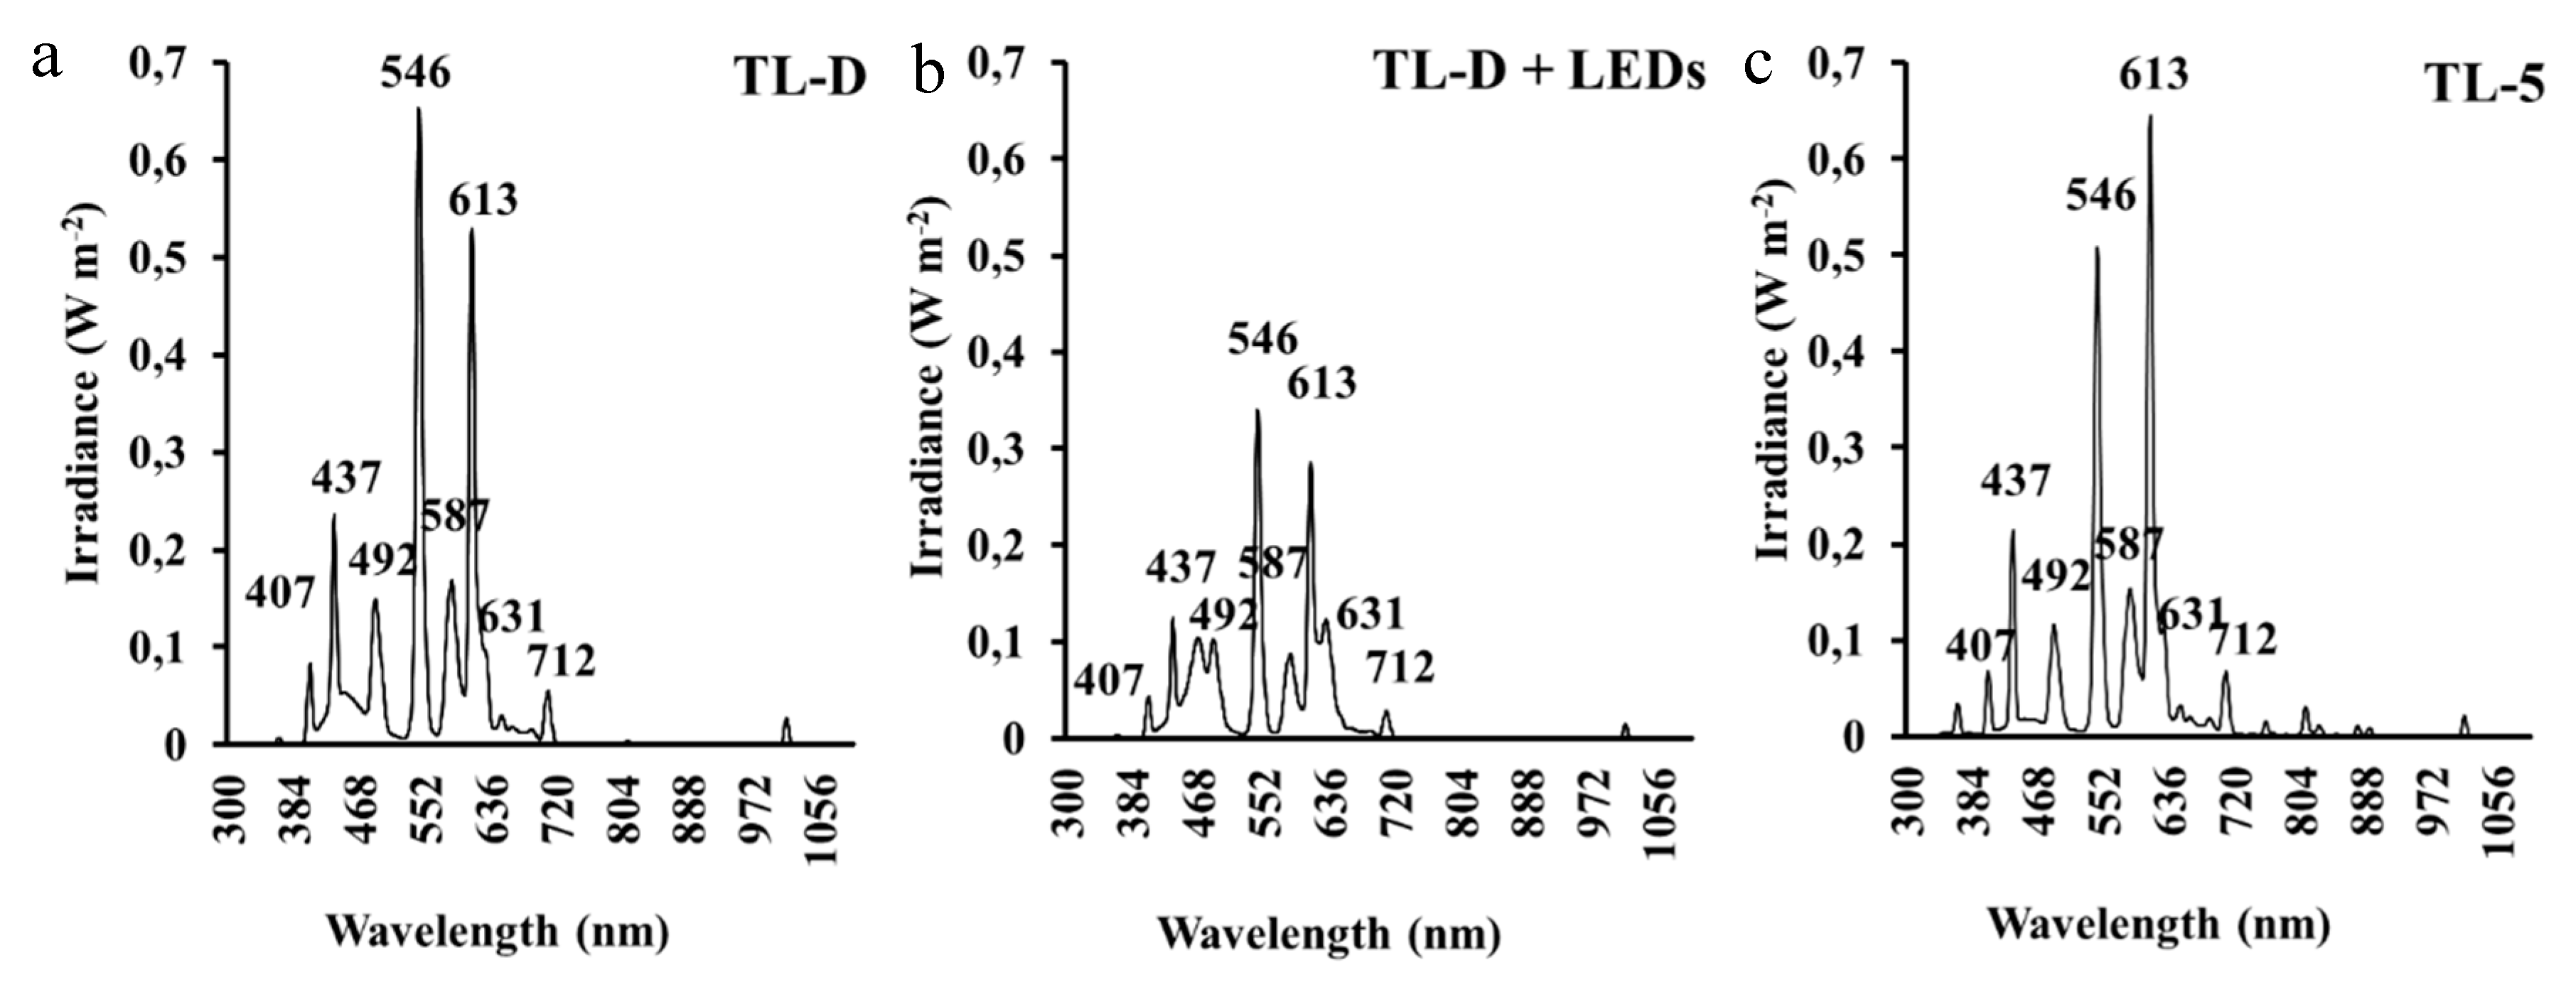
2.2. Spectral Distribution and Agronomic Characterization of Light Treatments

The spectral distribution of each treatment was recorded at 300–1100 nm with 1-nm steps, using a calibrated spectroradiometer (LI-COR 1800, Lincoln, NE, USA) at the canopy level. With these measurements, agronomic characterization of each light treatment was assessed following the methodology established by Baille et al. [15].

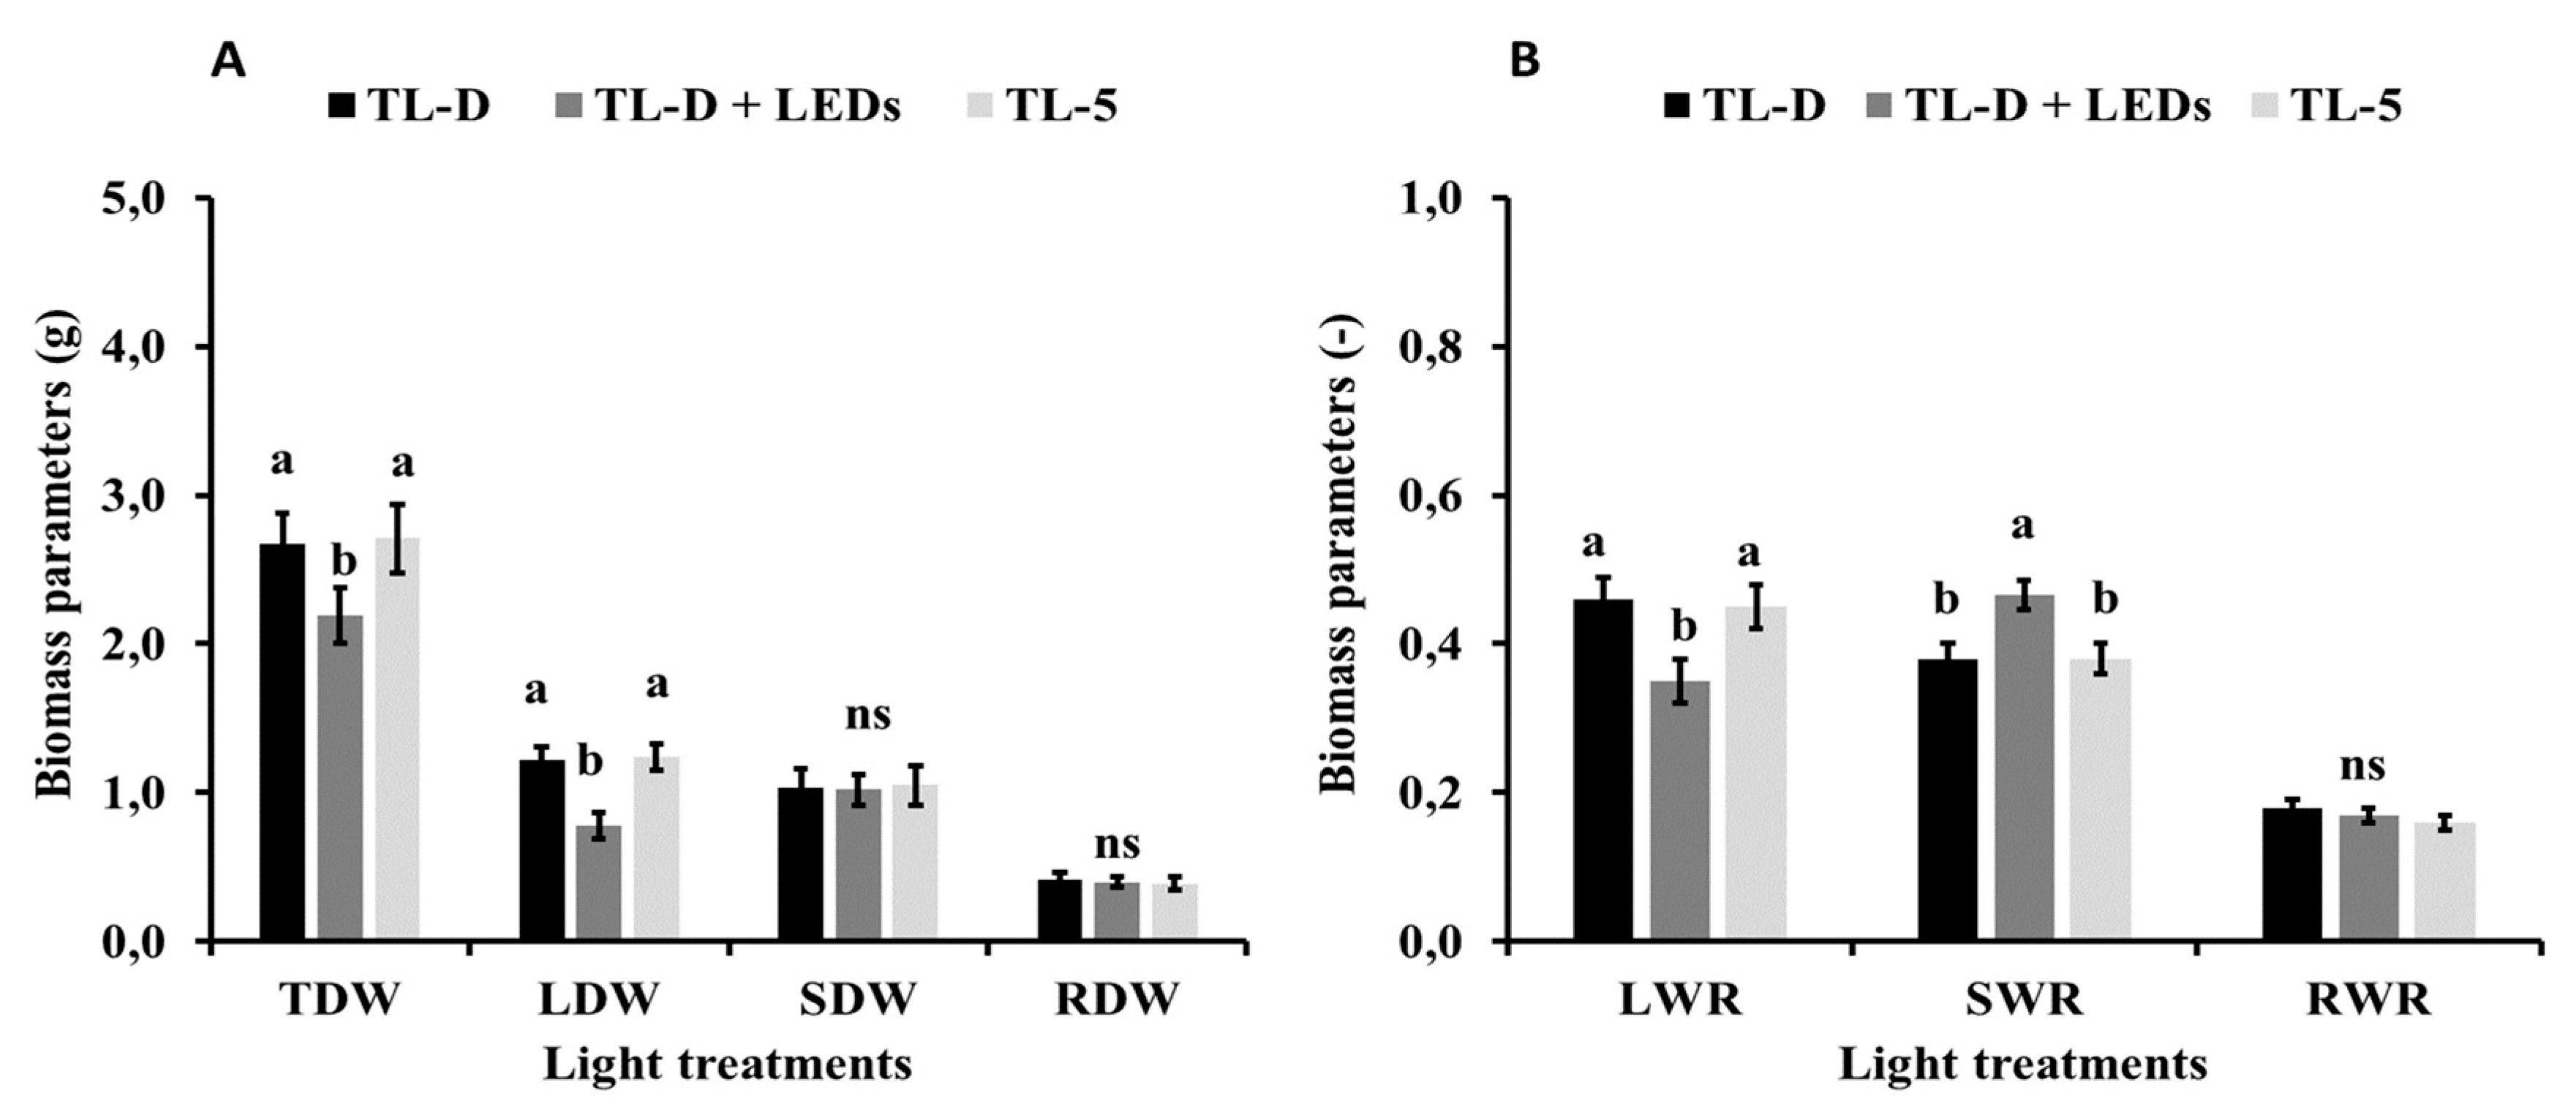
2.3. Biomass Parameters

At the end of the trial, the plants were harvested, the substrate gently washed from the roots and the root surface dried with blotting paper. The plants were split into roots (R), stems (S) and leaves (L) and the respective fresh weights (FW) measured. Roots, stems and leaves were then oven-dried (model E FN500; Nüve, Istanbul, Turkey) at 60 °C until they reached a constant weight (~48 h) to provide the respective dry weights (DW). Parameters associated with biomass partitioning were calculated as indicated by Ryser and Lambers [16] and García-Caparrós et al. [17]: relative leaf weight ratio (LWR; leaf DW per unit plant DW); the stem weight ratio (SWR; stem DW per unit plant DW); and the root weight ratio (RWR; root DW per unit plant DW). The plant’s total dry weight (TDW) was calculated as the sum of the leaves, stems and roots DW. The fresh and dry weights of roots, stems and leaves were used to calculate the water content (WC—g water per g fresh weight) in each organ, as indicated by Ben Amor et al. [18]:
WC = (FW − DW)/FW

2.4. Root, Stem and Leaf Nutrients

The oven-dried samples were ground in a mill and divided into two subsamples. The analysis of soluble ionic form (NO3) in the roots, stems and leaves was carried out using high performance liquid chromatography (HPLC); model Metrohm 883 Basic IC Plus, anions ion exchange column model Metrosep A SUPP 4, IC conductivity detector range (0–15000 µS cm−1)) in one subsample following water extraction as described by Csáky and Martínez-Grau [19]. The other subsample was mineralized with sulfuric acid (H2SO4, 96%) in the presence of hydrogen peroxide (H2O2, 30% (w v−1), P-free) at 300 °C and used for the colorimetric determination of organic N [20] and total P [21] expressed as mg g−1 DW. The total N concentration was calculated as the sum of the organic N and N-NO3 concentration. The K+ concentration expressed as mg g−1 DW was directly measured in the mineralized extract by flame spectrophotometry (model Jenway PFP 7) [22].

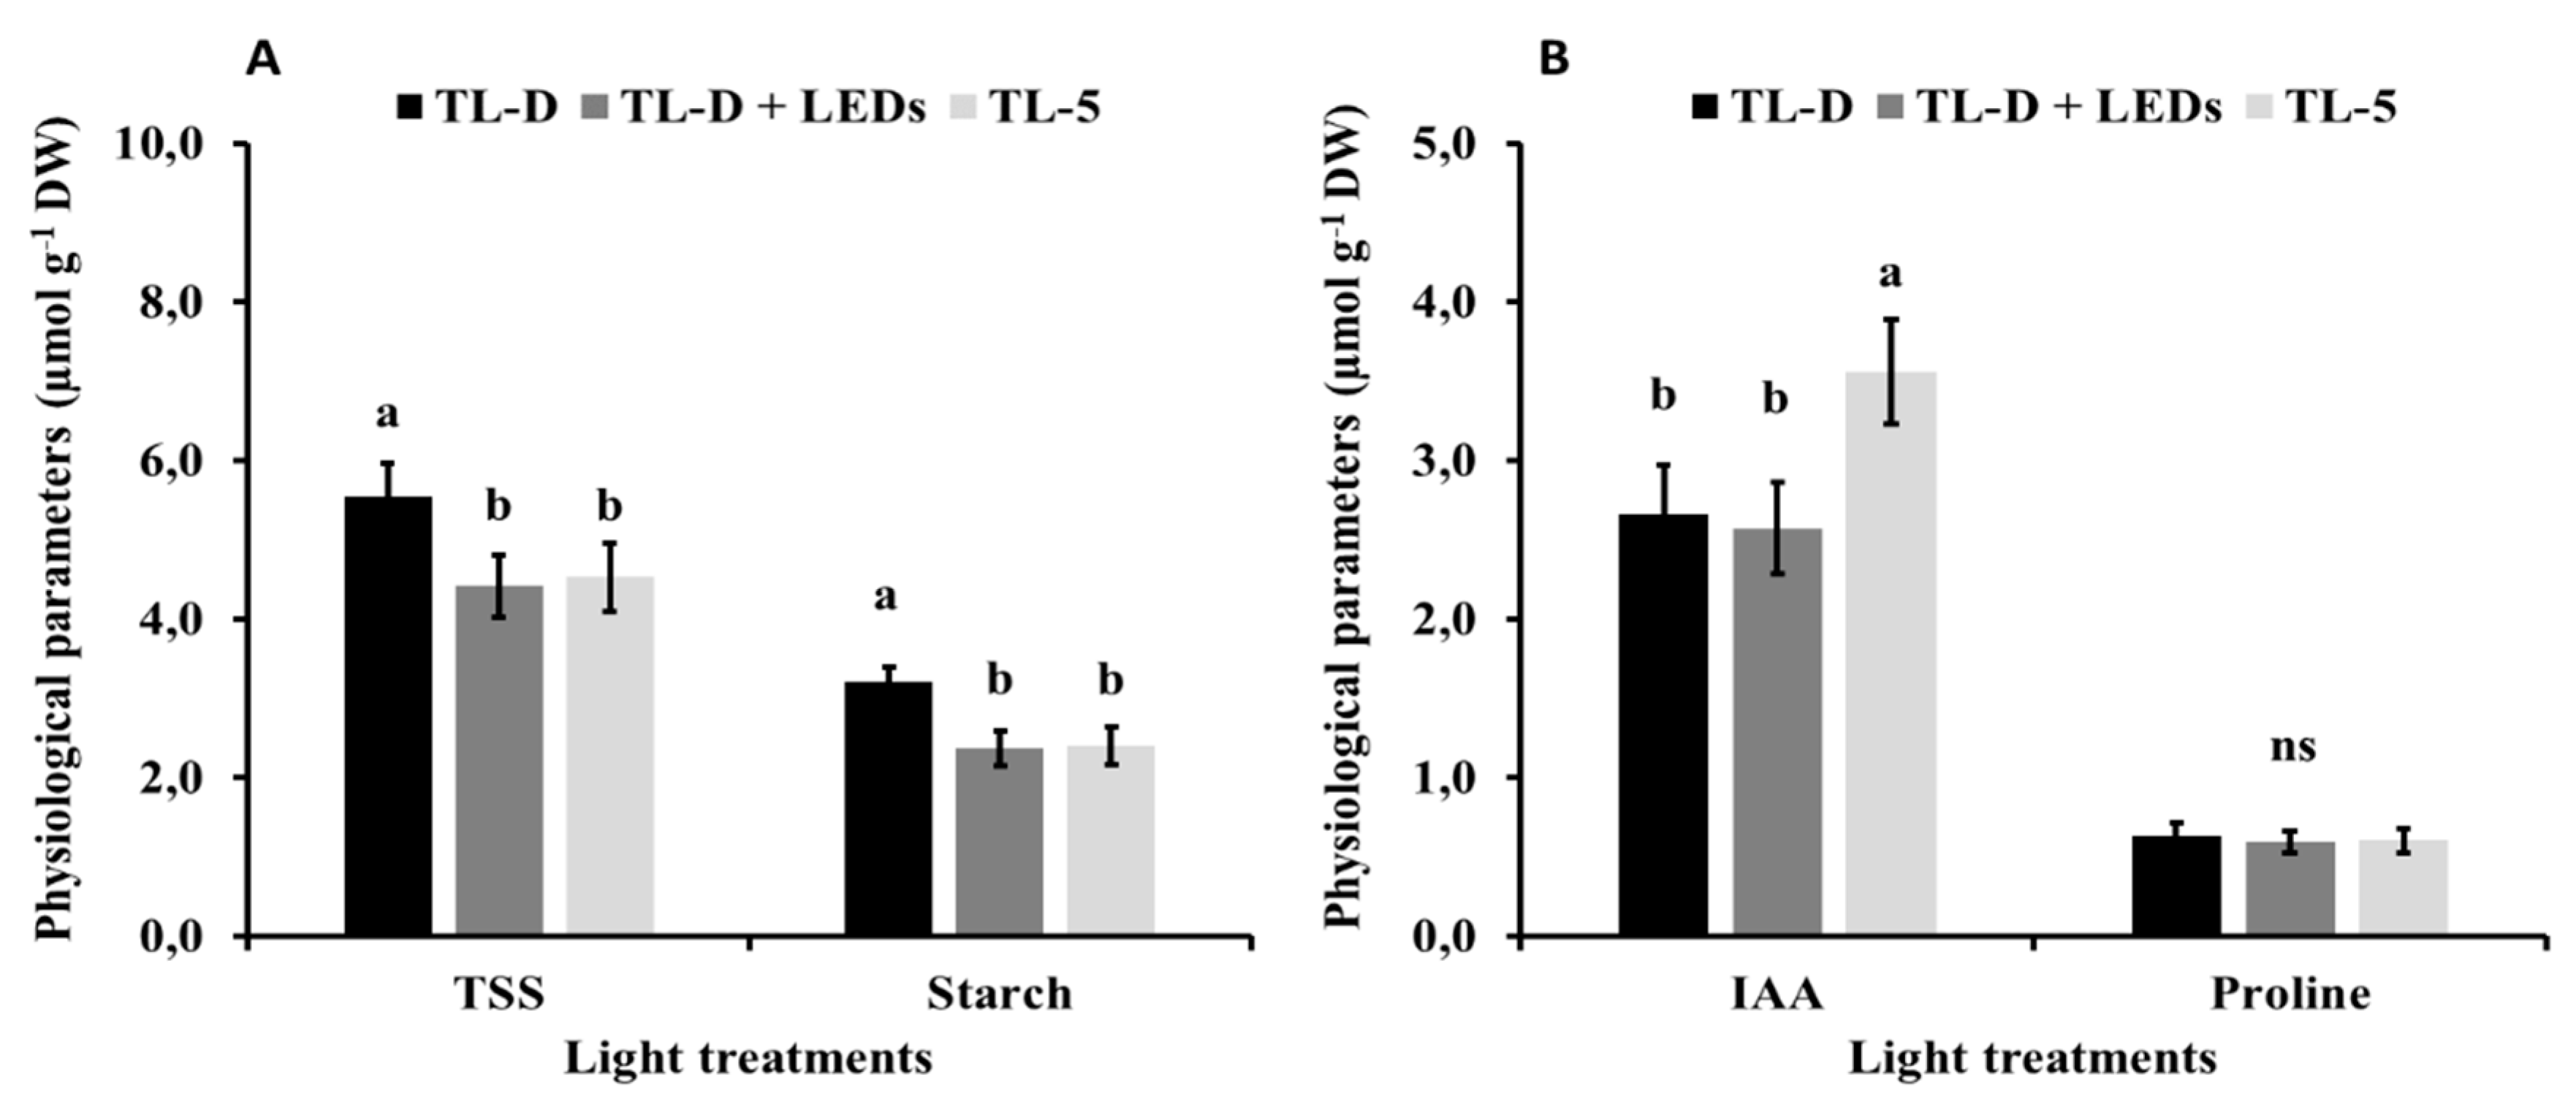
2.5. Biochemical Parameters

To determine the concentrations of proline, total soluble sugars (TSS), starch and indole 3-acetic acid (IAA) in leaves, five plants were randomly selected per treatment at harvest. Fresh material (0.5 g of leaves) was crushed in 5 mL of 95% (v v−1) ethanol and centrifuged (model Digicen 21 R) at 3500 g for 10 min. The pellet was washed twice with 5 mL of 70% (v v−1) ethanol and recentrifuged. The free proline, indole 3-acetic acid (IAA), TSS and starch concentrations were determined in the alcoholic extract supernatant. The free proline concentration was determined using the ninhydrin reagent method (expressed as µmol g−1 DW). The total soluble sugars (TSS) concentration was determined using the anthrone reagent method and was expressed as µmol glucose-equivalent g−1 DW. The starch concentration was determined using the oven-dried residue of total soluble sugars determination. The starch concentration was also expressed as µmol glucose-equivalent g−1 DW [23]. The indole 3-acetic acid (IAA) concentration was determined using the Salkowski reagent method and was expressed as µmol g−1 DW [24].

2.6. Pigments Concentrations

To determine the concentrations of pigments (chlorophylls and carotenoids) in leaves, five plants were randomly selected per treatment at harvest. Extraction of chlorophyll a and b (Chl a and Chl b) and carotenoids were performed by submerging 0.2 g of fresh leaves in methanol in the dark at room temperature (15 °C) for 24 h. The supernatant was removed, and the photosynthetic pigment concentrations were determined colorimetrically at their respective wavelengths in a spectrophotometer (Shimadzu Scientific Instruments, Columbia, MD, USA): Chl a (λ = 666 nm), Chl b (λ = 653 nm), and carotenoids (λ = 470 nm) following the methodology of Wellburn [25]. Pigment concentrations were expressed as mg g−1 FW.

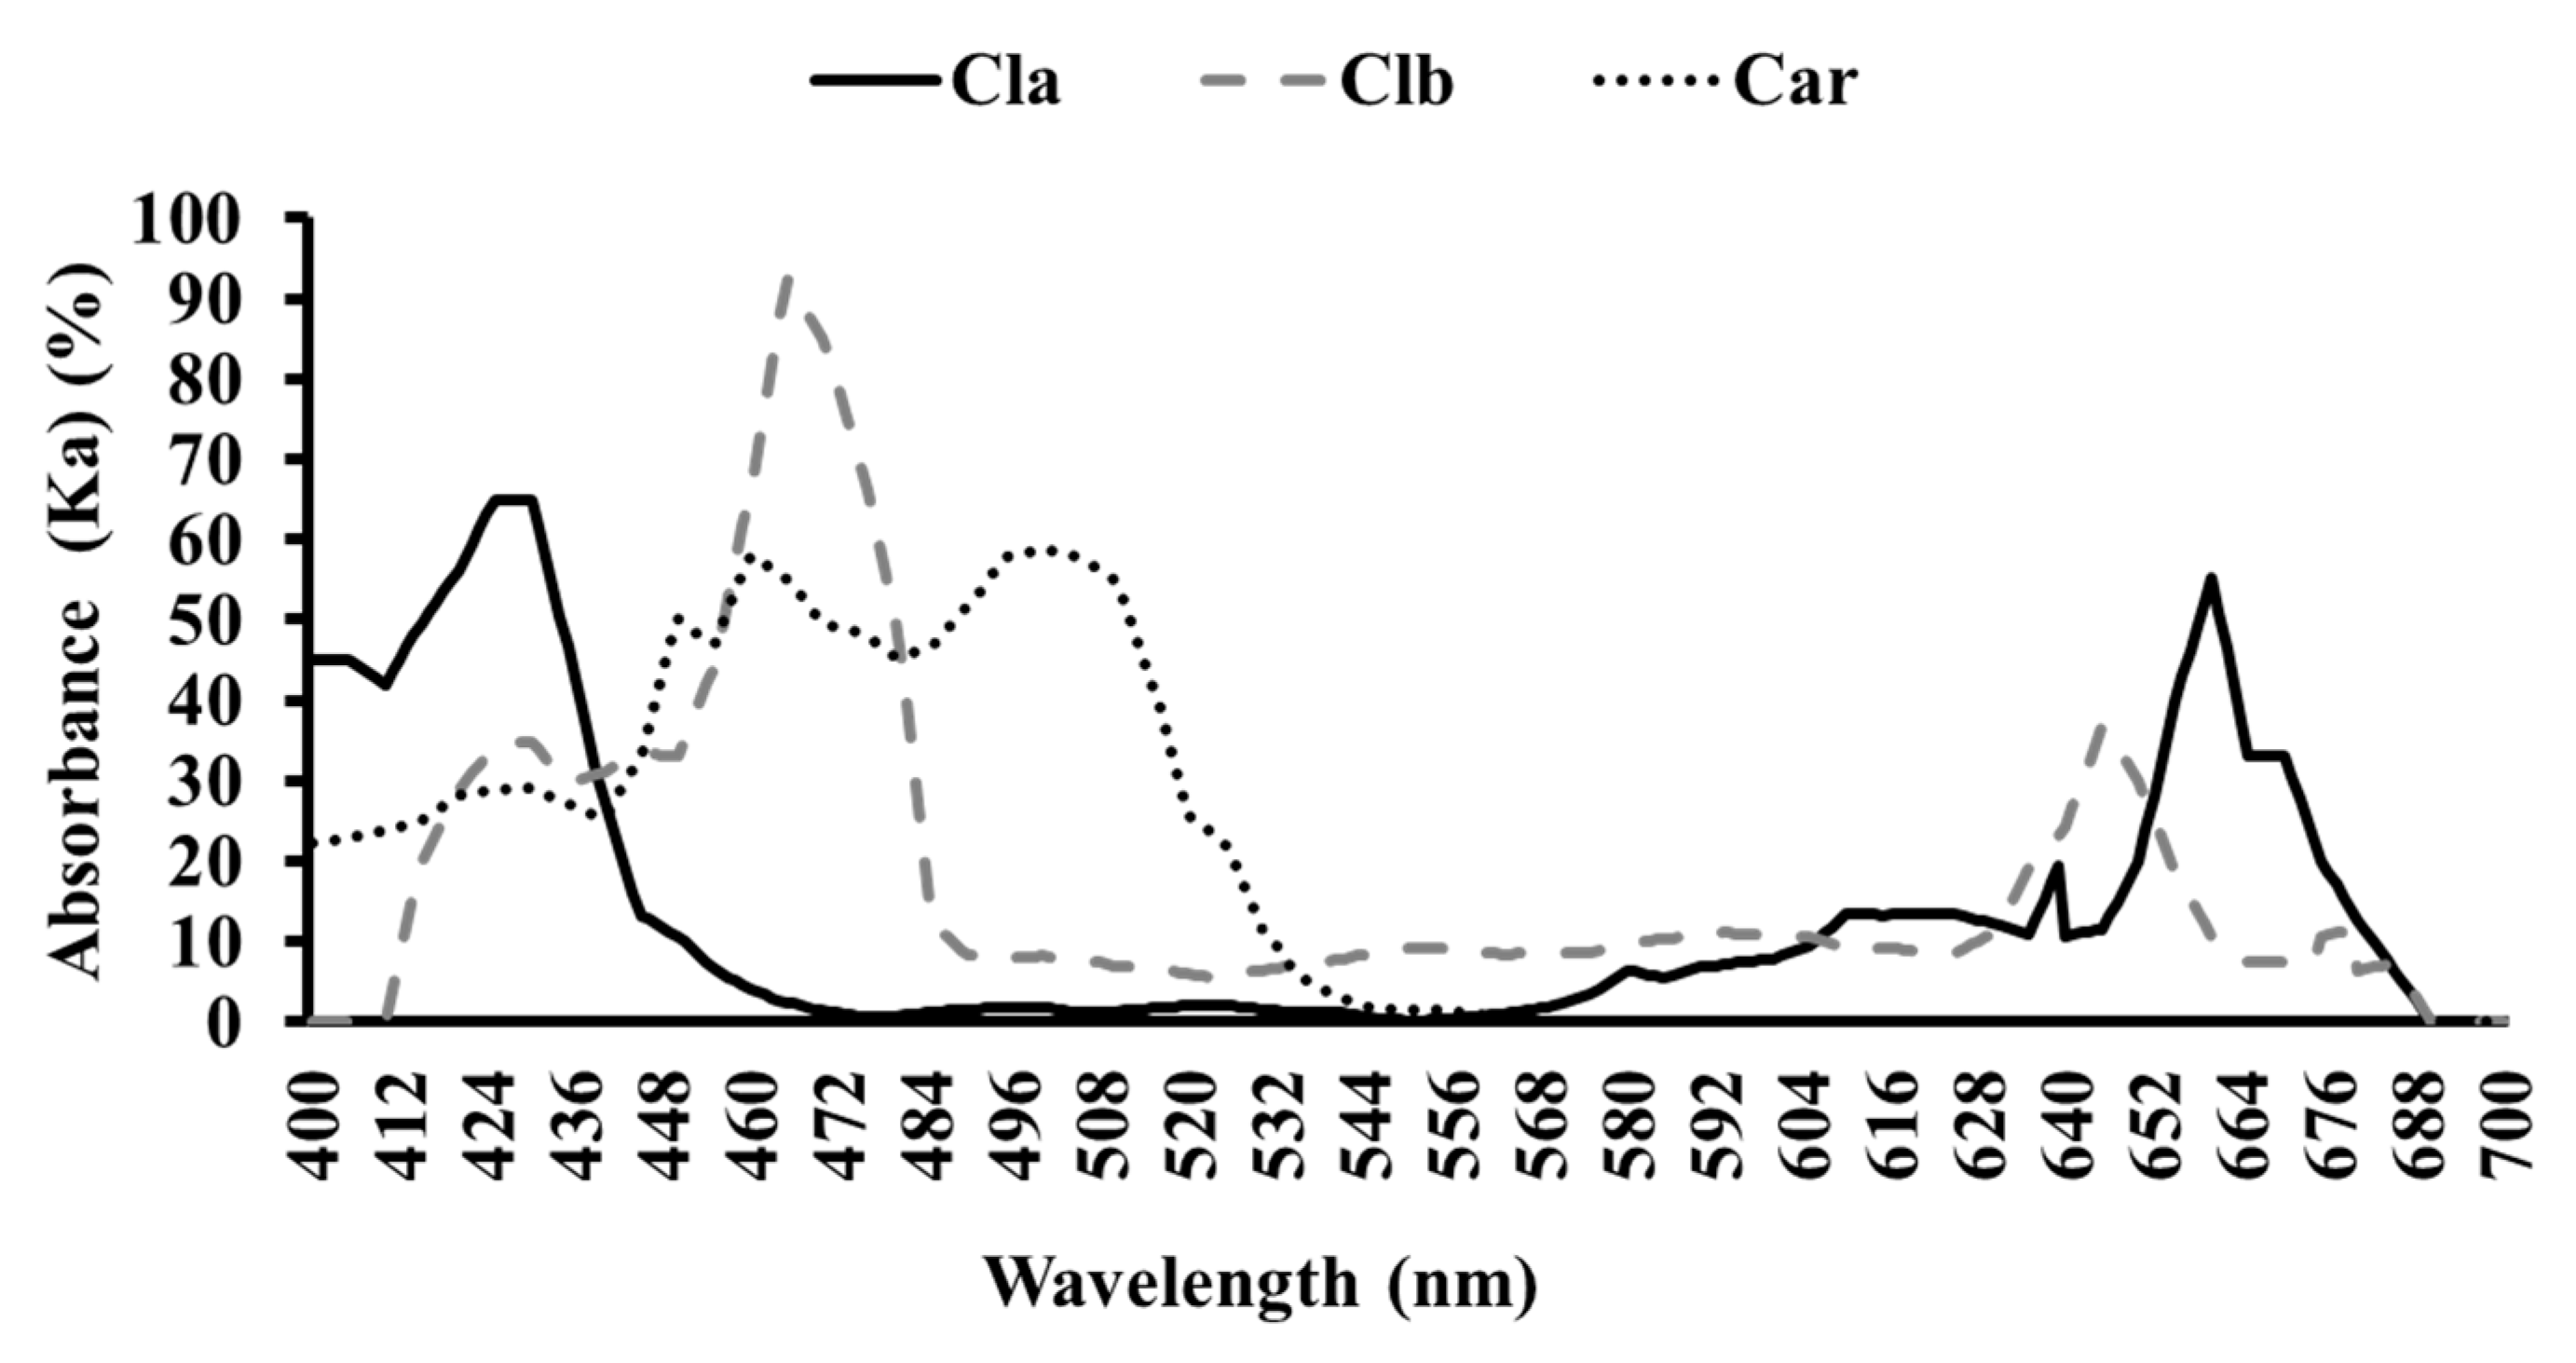
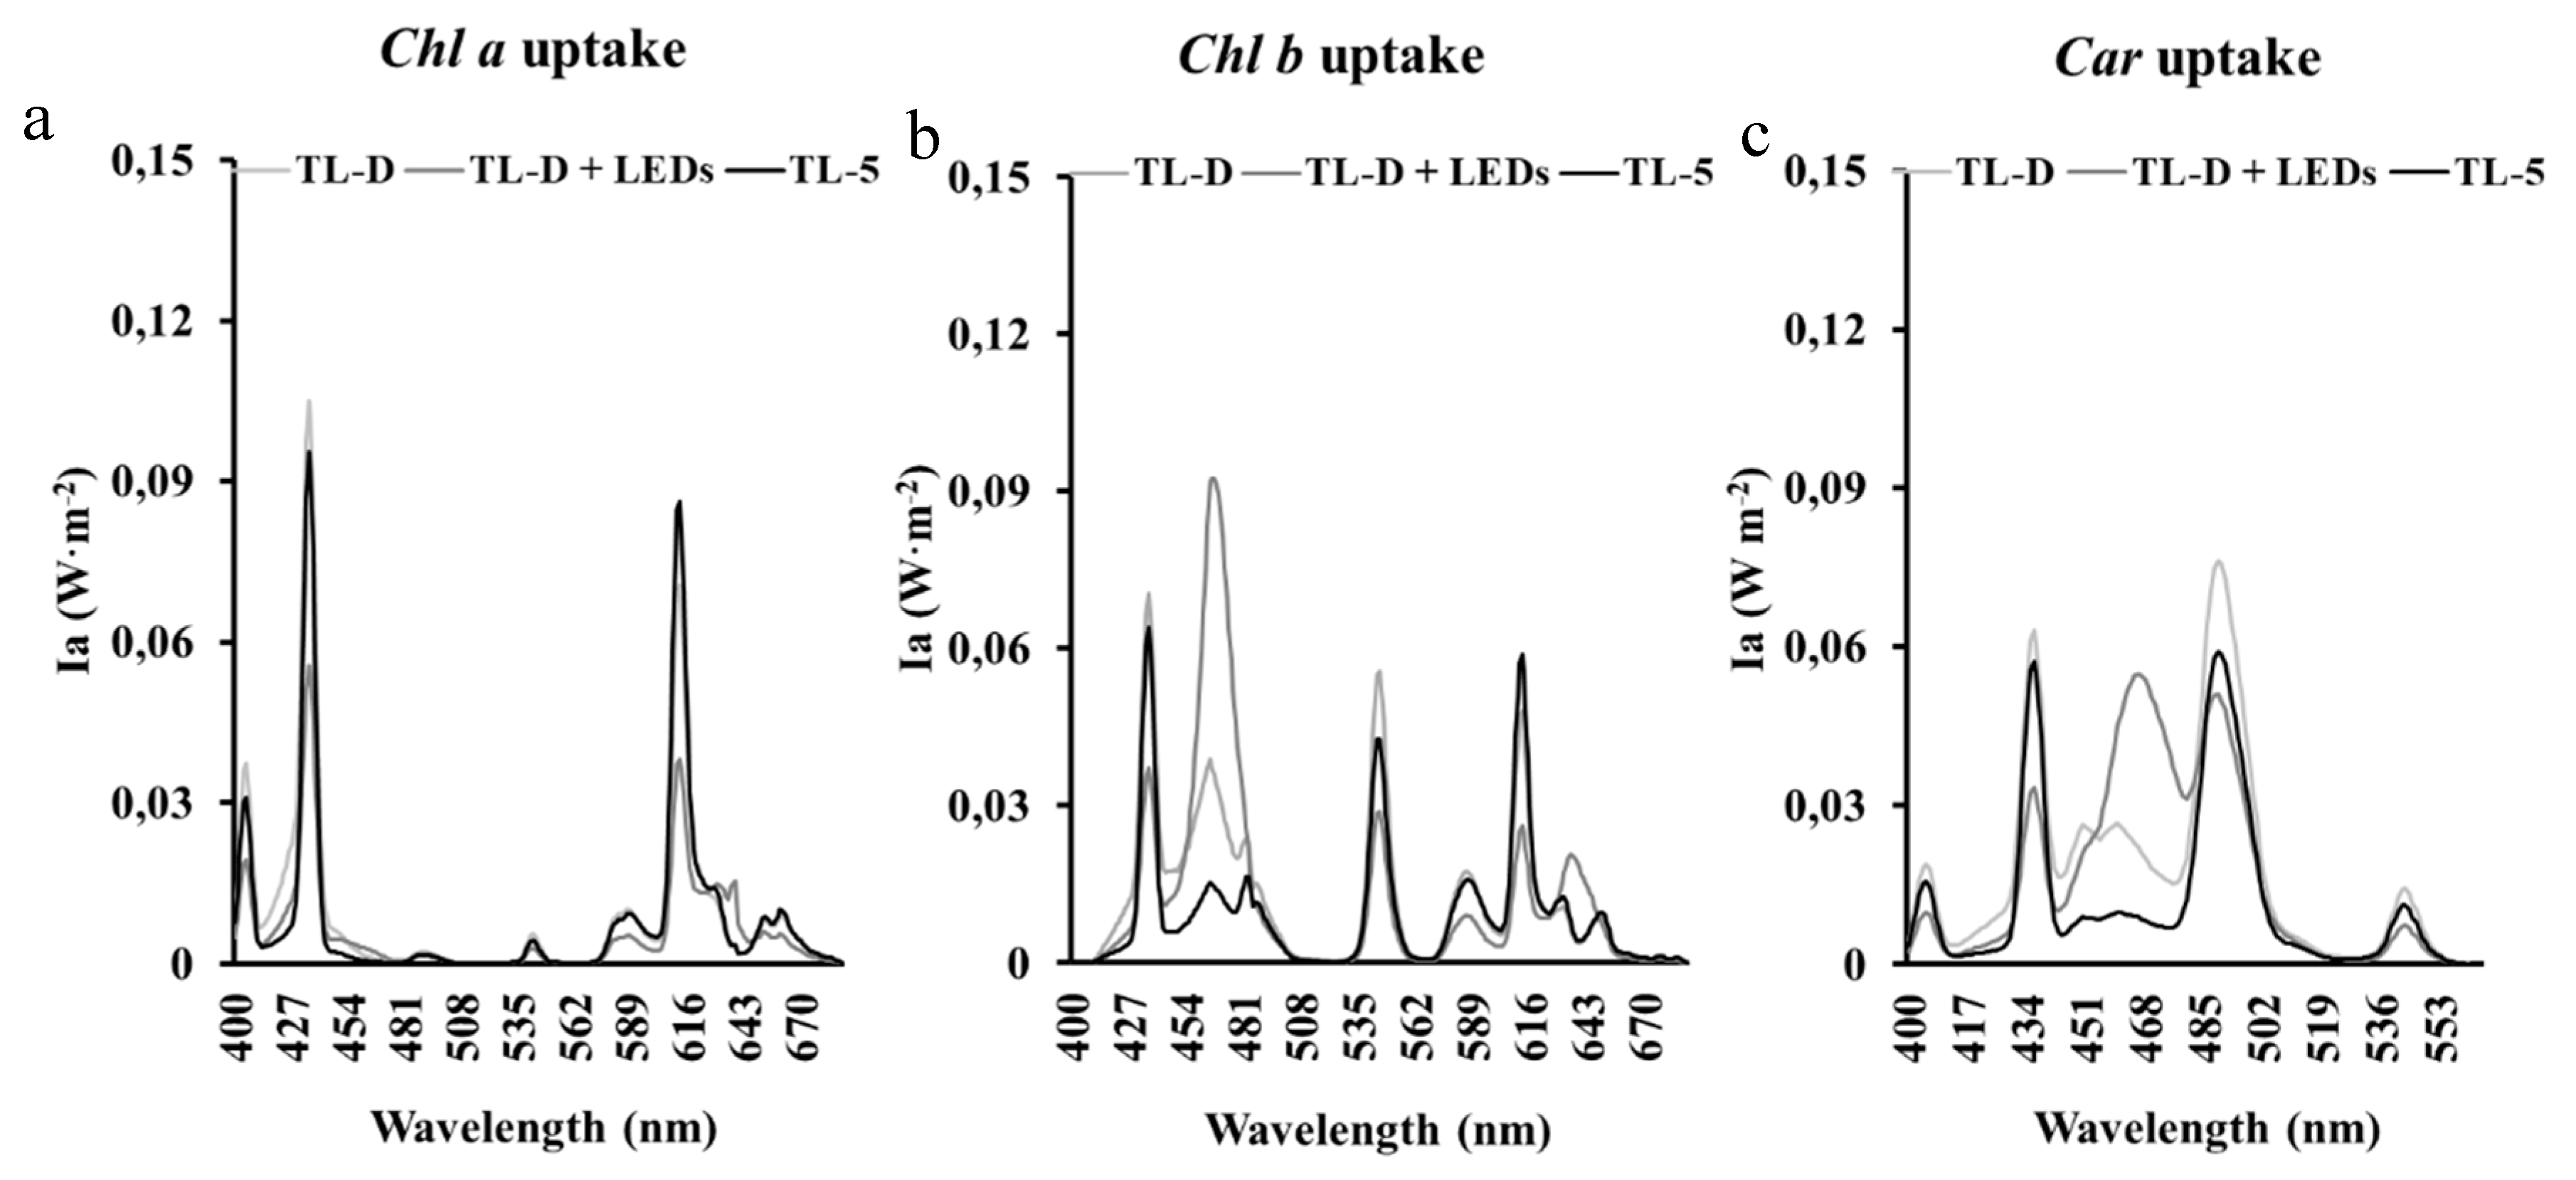
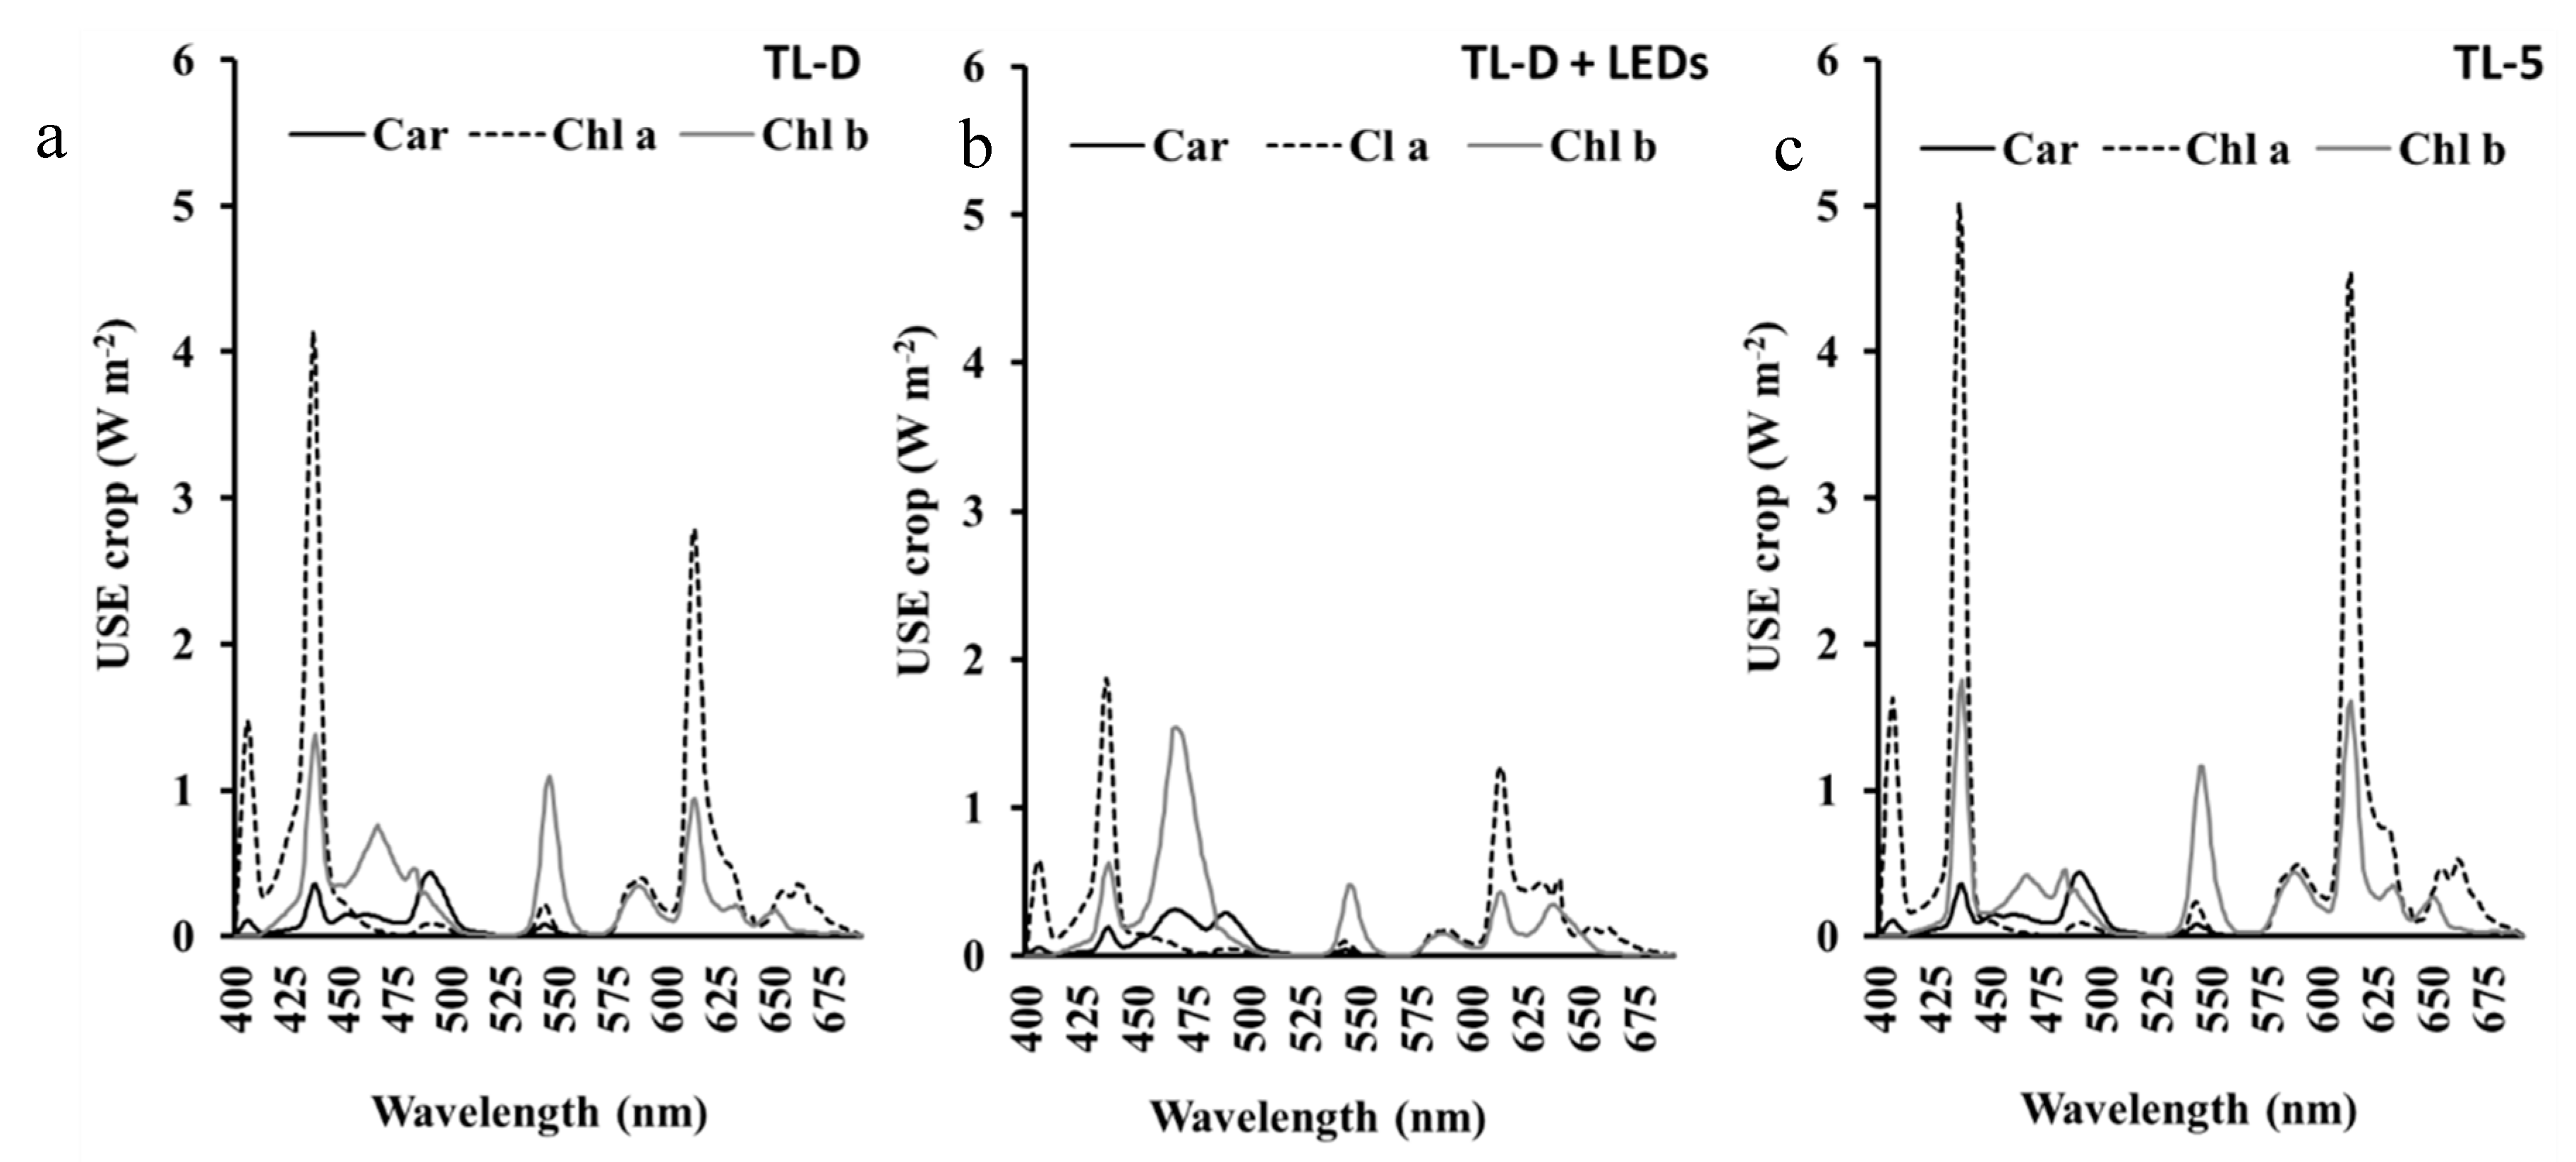
2.7. Relationship between Pigment Content and Absorbed Light Spectrum

To study the energy collected by plant to be transformed in biomass, we considered the concepts of theoretical irradiance energy absorbed by pigments (Ia), the theoretical use of spectral energy by each pigment of the plant (USEpigment) and the theoretical integrated use of spectral energy (IUSE) by crop as capacity of harvesting radiation energy by plant.
The theoretical irradiance energy absorbed by pigments (Ia) (chlorophyll a and b and carotenoids) was calculated using the following equation:
Ia ( car ,   chl   a ,   chl   b ) = 400 700 Ka ( car ,   chl   a ,   chl   b ) ×   Ie   d λ
where Ia (car, Chl a, Chl b) is total irradiance energy absorbed by each pigment expressed in W m−2, Ka (car, Chl a, Chl b) is percentage of energy absorbed by pigment according to each wavelength following the recommendations established by Whitmarsh and Govindjee [26], and Ie is irradiance emitted by each lamp per wavelength expressed in W m−2.
Assuming that all leaves have received the same irradiance, the theoretical use of spectral energy by each pigment of the plant (USEpigment) for each light treatment was calculated using the following equation:
USEpigment (car, chl a, chl b) = (LW × c) × Ia
where USEpigment (car, Chl a, Chl b): Use of spectral energy absorbed by each pigment per plants expressed in W m−2. LW: leaf fresh weight per plant expressed in g plant−1. c: pigment concentration in leaves, expressed in mg g−1 FW.
Considering the three photosynthetic pigments, the theoretical Integrated use of spectral energy (IUSE) by crop was calculated as summation of the USE of each pigment
IUSE crop = USE Cla + USE Clb + USE car

2.8. Statistical Analysis

The experiment had a completely randomized block design, and the values obtained for each plant and each variable were considered as independent replicates. The data were analyzed through one-way analysis of variance (ANOVA) and least significant difference (LSD) tests (p < 0.05) in order to assess the differences between treatments. To relate the IUSE and biomass (TDW), a simple regression has been done and this regression was compared with the classical simple regression between PAR and biomass (TDW). All the statistical analyses were done with Statgraphic Plus for Windows (version 5.1).

3. Results

3.1. Spectral Distribution and Agronomic Characterization

Spectral distribution of the different light treatments showed common peaks at 407, 437, 492, 546, 587, 613, 631 and 712 nm (B, R and FR regions). The treatment with TL-D + LEDs showed the lowest values compared with those undergoing TL-D and TL-5 treatments. Moreover, the highest peak in TL-D occurred at 546 nm, whereas in TL-5 it occurred at 613 nm (R region) (Figure 1). The agronomic characterization of light treatments showed different trends according to the spectral region studied. The treatment TL-D showed the highest values of B, PAR and total radiation compared to the other light treatments, whereas TL-5 had the highest values of UV, R, FR and NIR. The treatment TL-D + LEDs showed the highest values in the ratios calculated except for the ratio of PAR:TOTAL showing the same value than in TL-D (Table 1).

3.2. Biomass Parameters

Plants grown under TL-D + LEDs showed a reduction of 18% of the total dry weight (TDW) compared to the other light treatments mainly due to a decrease in leaf dry weight (LDW). On the other hand, stem and root dry weight (SDW and RDW; respectively) were unaffected by light treatments. Plants grown under TL-D + LEDs showed the lowest leaf weight ratios (LWR) and the highest stem weight ratio (SWR), whereas relative root dry weight ratio (RWR) remained unchanged under different light treatments. The water content of the organs analyzed (roots, stems or leaves) was unaffected by the light treatments (data not shown) (Figure 2).

3.3. Contents of N, P and K in Roots, Stems and Leaves

The N concentration in all the organs studied remained unchanged under different light treatments. The leaves of plants grown under TL-5 had the highest P concentration, whereas in roots and stems was unaffected by light treatments. The roots and stems of plants grown under TL-D + LEDs had the highest K concentration whereas leaves present the highest value under TL-5 (Table 2).

3.4. Biochemical Parameters

The leaves of plants grown under TL-D had the highest concentration of total soluble sugars (TSS) and starch. Leaves indole 3-acetic acid (IAA) concentration was the highest in plants grown under TL-5. Proline concentration in leaves remained unchanged under different light treatments (Figure 3).

3.5. Changes in Pigment Concentrations

Chlorophyll a concentrations of F. verschaffeltii leaves in all treatments were higher than the respective Chl b concentrations. Plants grown under TL-D + LEDs treatment had the lowest chlorophyll (a, b and a + b) concentrations. However, no significant differences were observed in carotenoids concentration regardless of the light treatments (Table 3).

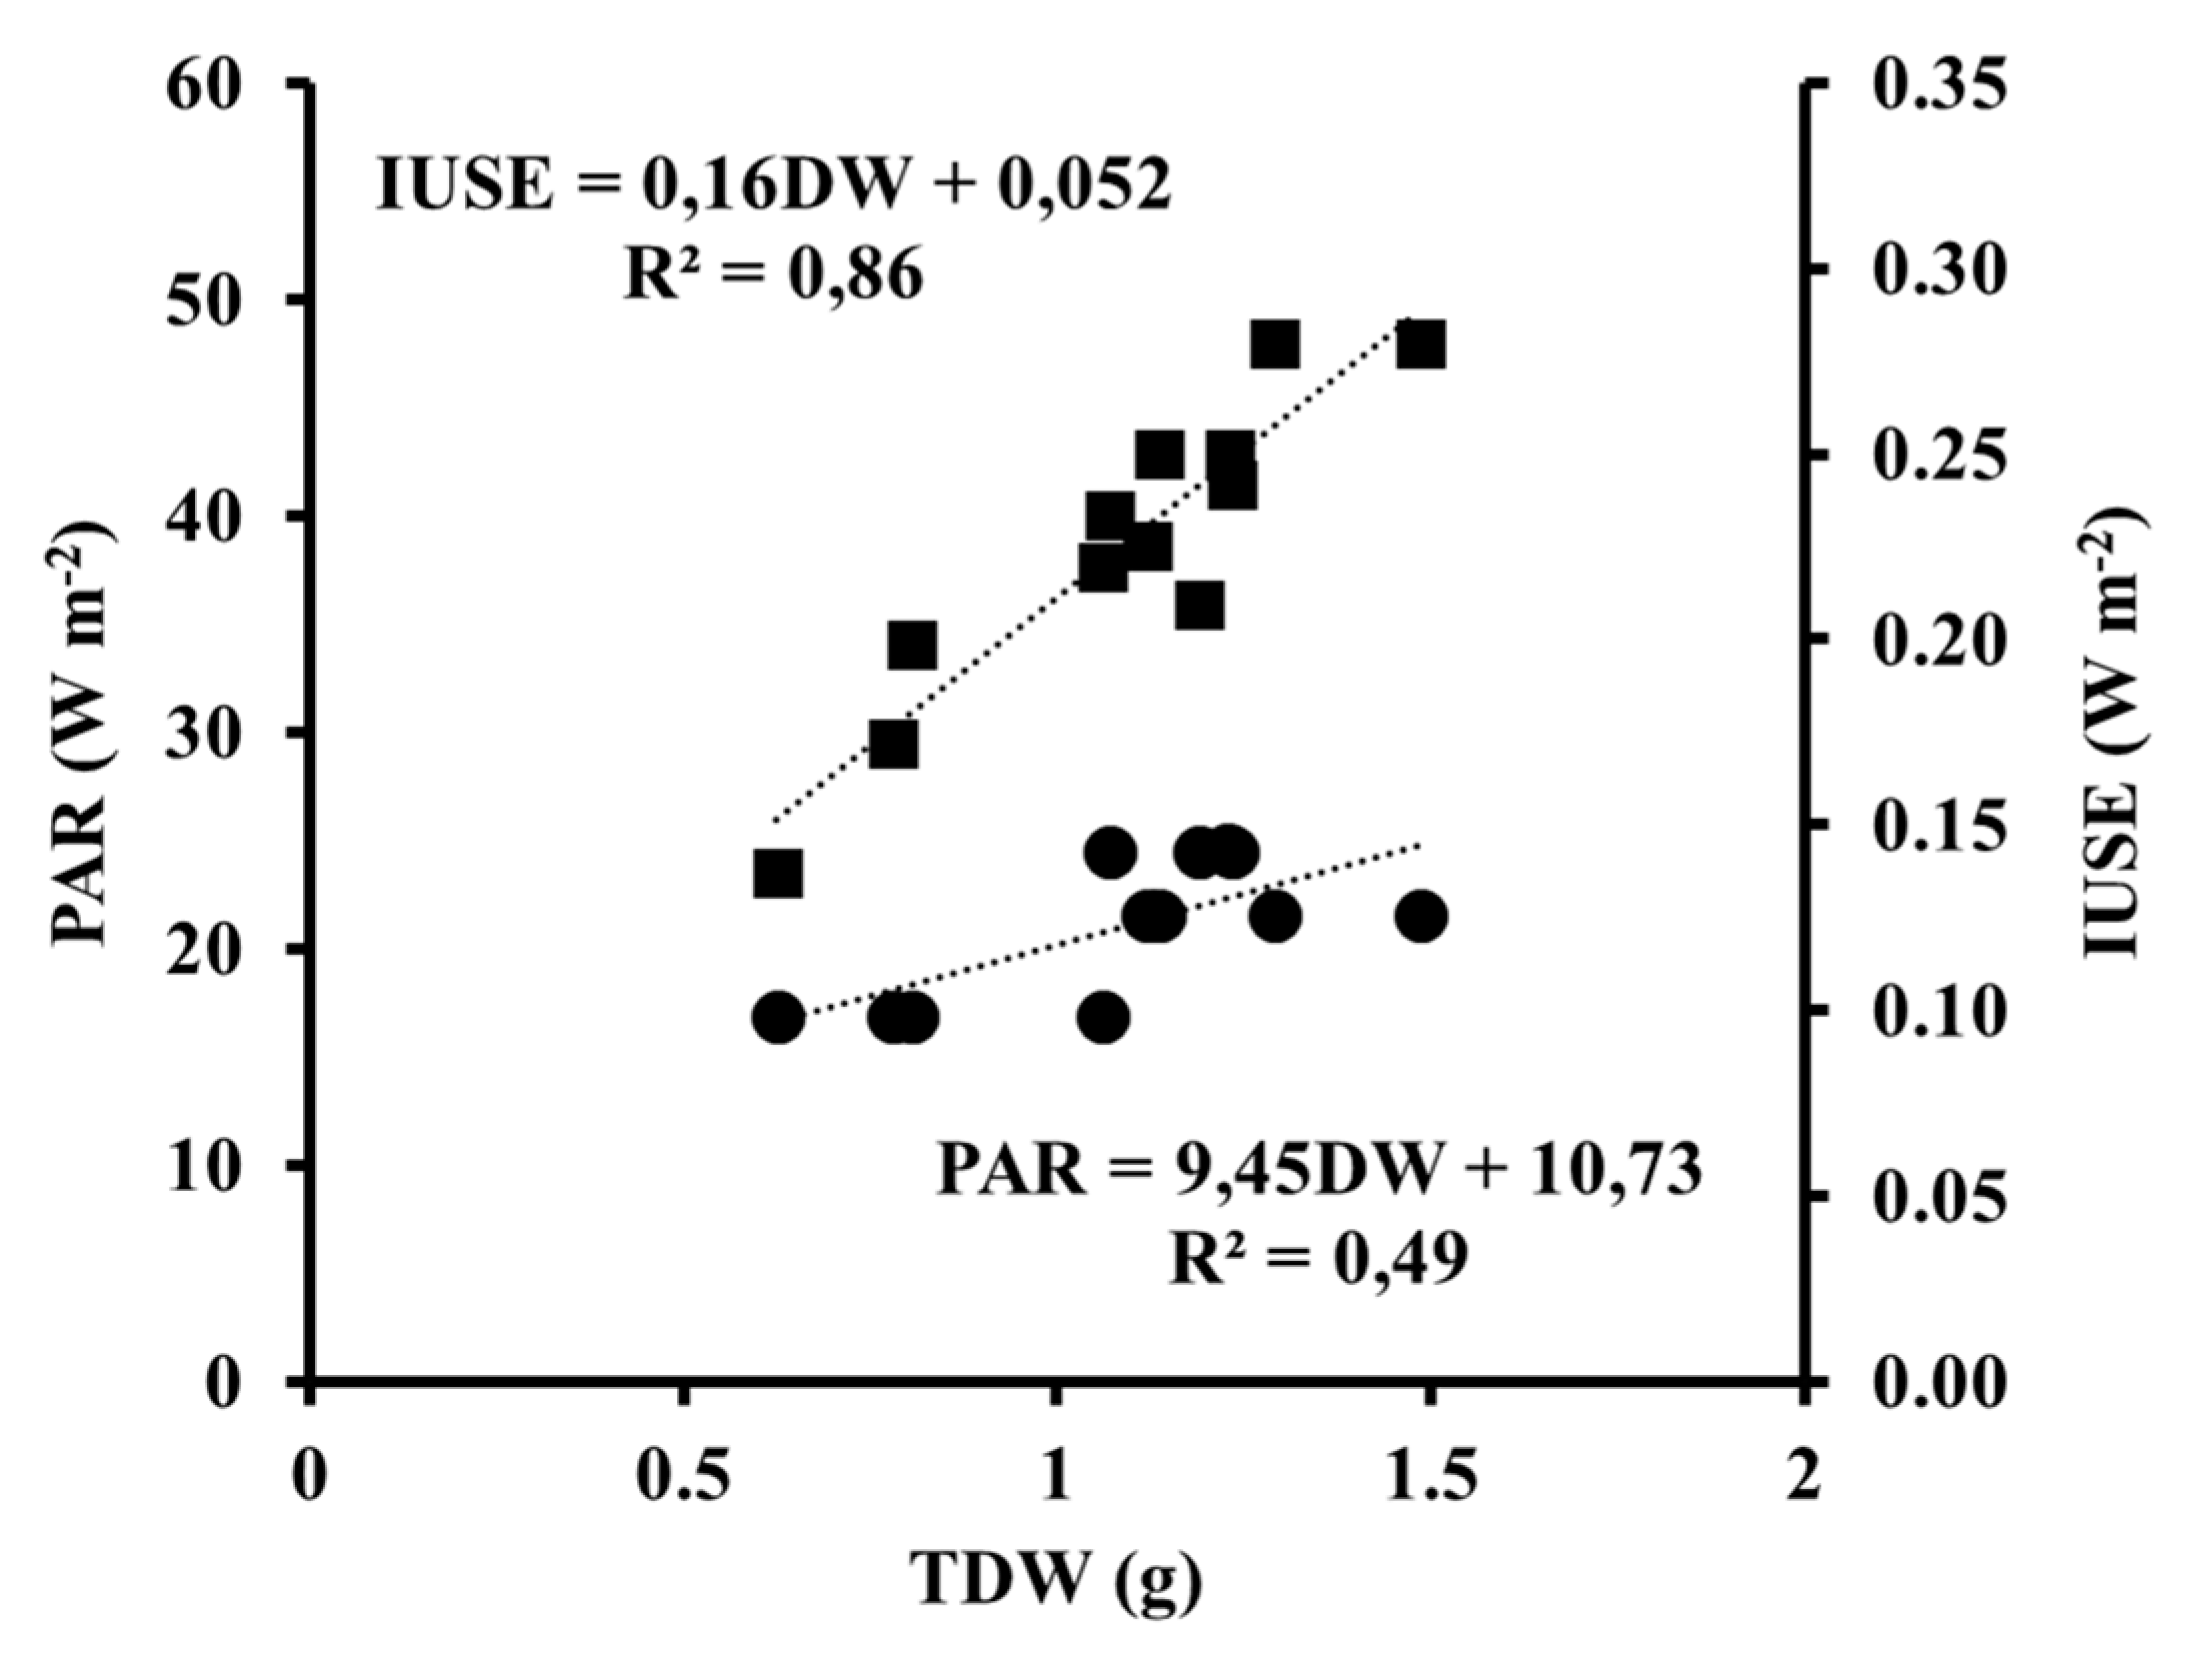
3.6. Plant’s Harvesting Lamp PAR Model

The percentage of energy absorbed by each pigment (Ka) (chlorophylls a and b and carotenoids) following the recommendations established by Whitmarsh and Govindjee [25] are presented in Figure 4. The highest peaks in Chl a were at 430 and 660 nm, in Chl b at 430, 500 and 646 nm and in carotenoids at 460 and 500 nm. With these results, and considering the data recorded of Ie (irradiance emitted by each lamp per wavelength expressed in W m−2), we calculated the theoretical irradiance energy absorbed by pigments (Ia) (chlorophyll a and b and carotenoids) in each light treatment (Figure 5). Then using the formulas above mentioned, we calculated the use of spectral energy absorbed by each pigment per plants USEpigment (car, Chl a, Chl b) (expressed in W m−2) (Figure 6). Integrating the results obtained for each pigment and light treatment, we obtained the data reported in Table 4, where TL-D + LEDS showed the lowest value of USE for Chl a and b, whereas in USEcar there were no differences between light treatments. The IUSE values by crop were the following: 2.51, 1.82 and 2.70 W m−2 under TL-D, TL-D + LEDS and TL-5; respectively. Finally, total plant dry weight (TDW) was related to IUSE and PAR through a linear regression (Figure 7), showing that the relationship between ISUE and TDW (R2 = 0.86; p < 0.05) was higher than the relationship between PAR and TDW (R2 = 0.49).

4. Discussion

With respect to light quality and intensity of the treatments, the addition of LEDs in lamps resulted in lower values of photosynthetically active radiation (PAR), as well as total radiation.
As a consequence, total plant dry weight after eight weeks of treatment showed a reduction when grown under TL-D + LEDs. This reduction was reflected only in reduced leaf weight, and did not affect stem and root mass.
This result suggests that the lowest value of total plant dry weight grown under TL-D + LEDs may be ascribed to the lowest value of red light and the corresponding morphogenetic response in plants. Concerning the effects of red light on leaf dry weight in ornamental species, Wollaeger and Runkle [27] reported that leaf dry weight was greater for salvia and petunia under these light conditions. In the present investigation, stem and root dry weight remained unchanged under different light treatments. With respect to stem dry weight, different results were found by other researchers. For instance, stem dry weight of Chrysanthemum plants showed an inverse relationship with the proportion of blue light received, resulting in a decrease at the end of the experiment [28]. The same results were also reported by Randall and Lopez [29] in Impatiens and Petunia. Concerning the lack of variations in root dry weight under different light treatments, different results were reported by Randall and Lopez [30] who noted that the root dry weight of marigold, geranium, impatiens and petunia increased as the amount of blue light increased. The different trends in biomass partitioning for roots of plants grown under three different light treatments suggested preferential biomass accumulation between different sink tissues with respect to the light characteristics. No differences in the water content of the organs studied in the present investigation suggest that there was no relationship between light treatments and water content in organs. Nevertheless, Sharkey and Raschke [31] found that blue light was nearly ten times more effective than red light in affecting the stomatal conductance generating differences in water content in the plant.
The leaf nutrient concentration for N (15.54 mg g−1 DW) and P (3.41 mg g−1 DW) were lower than the values reported for both nutrients in F. verschaffeltii (N (42.28 mg g−1 DW) and P (7.75 mg g−1 DW)) by Mills and Jones [32] whereas the values of leaf K concentration in our experiment (59.67 mg g−1 DW) were similar to the value of 56.55 mg g−1 DW proposed by these researchers in these species.
There have been a limited number of studies on mineral nutrient uptake by crops as affected by different light treatments. Results in the present investigation showed that the N, P, and K concentrations in the different organs of the plants displayed different patterns under different light treatments. The N concentration did not vary in the different organs of the plants under different light treatments. Different results were obtained by Almansa et al. [33] who reported an increase of N concentration in tomato seedlings grown under lamps with high values of blue radiation.
As far as P and K were concerned, there were no variations in root and stem P concentrations, whereas plant gown under TL-5 showed the highest leaf P concentration, which could be due to the high value of red radiation emitted by these lamps. Contrary to results in the present investigation, Kopsell and Sams [34] reported an increase of P in leaves of sprouting broccoli microgreens grown under blue light exposure. The highest value of K concentration in the organs studied in plants grown under TL-D + LEDs can be ascribed to the high value of B:R emitted by these lamps. Different results have been observed in Arabidopsis seedlings grown under blue light conditions, which showed an increase of K concentration due to the changes in guard cell membrane transport activity [35].
The highest concentration of total soluble sugars and starch was found in plants grown under TL-D lamps, which can be attributed to the high value of blue emitted by these lamps. These results are at odds with the increase of total soluble sugars and starch concentration under a combination (1:1) of red and blue radiation observed in several ornamental species, such as Ageratum houstonianum L., Tagetes erecta L. and Salvia splendens L. [36].
The highest value of red and far red radiation emitted by TL-5 lamps may be the responsible for the high concentration of indole 3-acetic acid (IAA). These results are in line with the findings of Islam et al. [37] who reported an increase of IAA concentration in poinsettia plants grown under red light conditions. The increase of IAA concentration under red and far red radiation may be explained by the photo-conversion of most phytochrome (phyB) into the inactive (Pr) form and the low phyA levels due to the R-enriched light environment before the shift to low R/FR ratio light since phyA and phyB are both repressors of auxin-regulated gene transcription [38]. We did not find variation in the leaf proline concentrations between the light treatments. Different results were obtained in other ornamental species such as Chrysanthemum where higher proline levels were found in plants grown under blue light compared to the other light qualities [39].
Changes in irradiance wavelengths may modify pigment concentrations in plants [40]. In our experiment, the lowest concentration of pigments (chlorophylls) in plants grown under TL-D + LEDs lamps may be attributed to the lowest value of red region. Different results were observed by Garcia-Caparros et al. [41] in an experiment with Dieffenbachia maculata plants which showed lower pigment concentrations under higher red conditions. No variations in carotenoids concentrations under different light treatments were reported in this experiment. These results suggest that carotenoid concentrations did not appear to be influenced by the wavelengths in the light environment, coinciding with the results reported by Zheng and Van Labeke [42], who noted that carotenoid concentrations in Cordyline australis G. Forst. Endl. and Ficus benjamina L. did not vary under different light treatments.
In our experiment we assessed IUSE using the spectral energy emitted by the lamp, radiation absorption by the pigments, and the photosynthetic pigment concentrations in the plants, in order to evaluate the light energy captured by the plant. The results obtained reporting a higher correlation between IUSE and DW. Our model may help to quantify the spectral effect to adjust the relationship between biomass and PAR received under artificial light, which also has been shown by researchers such as Garcia-Caparros et al. [41] in Dieffenbachia maculata. In our approach, we have considered that the main function of chlorophyll in plants is the absorbance of light and the transference through plants during the photosynthesis and also the jointly pigments capacity for harvesting radiation [43]. In this sense, it is necessary to mention that although chlorophyll a is the primary cofactor for photochemical reactions in both photosystems (I and II), chlorophyll b is an accessory pigment with a fundamental role in the photosynthetic process only found in peripheral light-harvesting complexes (LHCs) [44].

5. Conclusions

Total plant dry weight was reduced in Fittonia verschaffeltii plants grown under TL-D + LEDs. Mineral composition of the different organs analyzed did not show a clear trend under different light treatments. Plants grown under TL-D lamps showed the highest concentration of total soluble sugars and starch in leaves, whereas plants grown under TL-5 lamps had the greatest concentration of indole 3-acetic acid. Leaf proline did not differ between light treatments. Plants grown under TL-D + LEDs showed the lowest values of chlorophyll a, b, and a + b. With respect to the model proposed, it can be highlighted that there was no strong relationship between PAR and total dry weight, whereas the comparison between IUSE and TDW showed a better relationship, with a R2 value of 0.86. Therefore, calculated IUSE values better explained the plant biomass relative to lamp treatment than the PAR output did. Therefore, we recommend this methodology to discern the effects of the different spectral qualities on plant biomass.

Author Contributions

P.G.-C. investigation, data curation, writing-original draft preparation. E.M.A. formal analysis, investigation. F.J.B. analysis, investigation. R.M.C. analysis, investigation. M.T.L. conceptualization, supervision, project administration. All authors have read and agreed to the published version of the manuscript.

Funding

This research was funded by the Research Group AGR-242 of the University of Almería.

Acknowledgments

The authors thank Margit Olle for her suggestions and English style corrections. The authors also thank the funding of this work by the group AGR-242 from University of Almería (Sustainability of Horticultural and Ornamental Protected Systems).

Conflicts of Interest

The authors declare no conflict of interest.

References

  1. Yang, B.; Zhou, X.; Xu, R.; Wang, J.; Lin, Y.; Pang, J.; Wu, S.; Zhong, F. Comprehensive analysis of photosynthetic characteristics and quality improvement of purple cabbage under different combinations of monochromatic light. Front. Plant Sci. 2016, 7, 1788. [Google Scholar] [CrossRef] [PubMed] [Green Version]
  2. Gautam, P.; Terfa, M.T.; Olsen, J.E.; Torre, S. Red and blue light effects on morphology and flowering of Petunia × hybrida. Sci. Hortic. 2015, 184, 171–178. [Google Scholar] [CrossRef]
  3. Chung, J.P.; Huang, C.Y.; Dai, T.E. Spectral effects on embryogenesis and plant-let growth of Oncidium ‘Gower Ramsey’. Sci. Hortic. 2010, 124, 511–526. [Google Scholar] [CrossRef]
  4. Hogewoning, S.W.; Douwstra, P.; Trouwborst, G.; van Ieperen, W.; Harbinson, J. An artificial solar spectrum substantially alters plant development compared with usual climate room irradiance spectra. J. Exp. Bot. 2010, 61, 1267–1276. [Google Scholar] [CrossRef] [PubMed] [Green Version]
  5. Stutte, G.W. Light-emitting diodes for manipulating the phytochrome apparatus. HortScience 2009, 44, 231–234. [Google Scholar] [CrossRef]
  6. Goto, E. Plant production in a closed plant factory with artificial lighting. Acta Hortic. 2012, 956, 37–49. [Google Scholar] [CrossRef]
  7. Bercu, R.; Popoviciu, D.R. Anatomy of Fittonia verschaffeltii (Lem.) Van Houtte (Acanthaceae). Ann. Rom. Soc. Cell Biol. 2015, 19, 23–28. [Google Scholar]
  8. Almansa, E.M.; Espín, A.; Chica, R.M.; Lao, M.T. Changes in endogenous auxin concentration in cultivars of tomato seedlings under artificial light. HortScience 2011, 46, 698–704. [Google Scholar] [CrossRef] [Green Version]
  9. Currey, C.J.; Lopez, R.G. Cuttings of Impatiens, Pelargonium, and Petunia propagated under light-emitting diodes and high-pressure sodium lamps have comparable growth, morphology, gas exchange, and post-transplant performance. HortScience 2013, 48, 428–434. [Google Scholar] [CrossRef] [Green Version]
  10. Dieleman, J.A.; De Visser, P.H.; Meinen, E.; Grit, J.G.; Dueck, T. Integrating morphological and physiological responses of tomato plants to light quality to the crop level by 3D modelling. Front. Plant Sci. 2019, 10, 839. [Google Scholar] [CrossRef] [Green Version]
  11. Kaiser, E.; Ouzounis, T.; Giday, H.; Schipper, R.; Heuvelink, E.; Marcelis, L.F. Adding blue to red supplemental light increases biomass and yield of greenhouse-grown tomatoes, but only to an optimum. Front. Plant Sci. 2019, 9, 2002. [Google Scholar] [CrossRef] [PubMed] [Green Version]
  12. Radmer, R.J.; Kok, B. Light Conversion Efficiency in Photosynthesis. In Encyclopedia of Plant Physiology (New Series); Trebst, A., Avron, M., Photosynthesis, I., Eds.; Springer: Berlin/Heidelberg, Germany, 1977; Volume 5. [Google Scholar]
  13. Long, S.P.; Zhu, X.G.; Naidu, S.L.; Ort, D.R. Can improvement in photosynthesis increase crop yields? Plant Cell Environ. 2006, 29, 315–330. [Google Scholar] [CrossRef] [PubMed]
  14. Steiner, A. A universal method for preparing nutrient solution of a certain desired composition. Plant Soil 1961, 15, 134–154. [Google Scholar] [CrossRef] [Green Version]
  15. Baille, A.; González-Real, M.M.; López, J.C.; Cabrera, J.; Pérez-Parra, J. Characterization of the solar diffuse component under “Parral” plastic greenhouses. Acta Hortic. 2003, 614, 341–346. [Google Scholar] [CrossRef]
  16. Ryser, P.; Lambers, H. Root and leaf attributes accounting for the performance of fast- and slow-growing grasses at different nutrient supply. Plant Soil 1995, 170, 251–265. [Google Scholar] [CrossRef]
  17. García-Caparrós, P.; Llanderal, A.; Pestana, M.; Correia, P.J.; Lao, M.T. Lavandula multifida response to salinity: Growth, nutrient uptake, and physiological changes. J. Plant Nutr. Soil Sci. 2017, 180, 96–104. [Google Scholar] [CrossRef]
  18. Ben Amor, N.; Ben Hamed, K.; Debez, A.; Grignon, C.; Abdelly, C. Physiological and antioxidant responses of the perennial halophyte Crithmum maritimum to salinity. Plant Sci. 2005, 168, 889–899. [Google Scholar] [CrossRef]
  19. Csáky, A.; Martínez-Grau, M.A. Técnicas Experimentales en Síntesis Orgánica; Síntesis: Madrid, Spain, 1998. [Google Scholar]
  20. Krom, M.D. Spectrophotometric determination of ammonia: Study of a modified Berthelot reaction using salicylate and dicholoroisocyanurate. Analyst 1980, 105, 305–316. [Google Scholar] [CrossRef]
  21. Hogue, E.; Wilcow, G.E.; Cantliffe, D.J. Effect of soil P on phosphate fraction in tomato leaves. J. Am. Soc. Hortic. Sci. 1970, 95, 174–176. [Google Scholar]
  22. Lachica, M.; Aguilar, A.; Yanez, J. Análisis foliar: Métodos utilizados en la estación experimental del Zaidín. Anal. Edafol. Agrobiol. 1973, 32, 1033–1047. [Google Scholar]
  23. Irigoyen, J.J.; Emerich, D.W.; Sánchez-Díaz, M. Water stress induced changes in concentrations of proline and total soluble sugars in nodulated alfalfa (Medicago sativa) plants. Physiol. Plant. 1992, 84, 55–60. [Google Scholar] [CrossRef]
  24. Tien, T.M.; Gaskin, M.H.; Hubbell, D.H. Plant growth substance produced by Azospirillum brasilense and their effect on the growth of pearl millet (Pennisetum americanun L.). Appl. Environ. Microbiol. 1979, 37, 219–226. [Google Scholar] [CrossRef] [Green Version]
  25. Wellburn, A. The spectral determination of chlorophylls a and b, as well as total carotenoids, using various solvent with spectrophotometers of different resolution. J. Plant Physiol. 1994, 144, 307–313. [Google Scholar] [CrossRef]
  26. Whitmarsh, J.; Govindjee. The photosynthetic process. In Concepts in Photobiology: Photosynthesis and Photomorphogenesis; Singhal, G.S., Renger, G., Sopory, S.K., Irrgang, K.-D., Govindjee, Eds.; Narosa Publishers and Kluwer Academic: New Delhi, India, 1999; pp. 11–51. [Google Scholar]
  27. Wollaeger, H.M.; Runkle, E.S. Growth and acclimation of impatiens, salvia, petunia, and tomato seedlings to blue and red light. HortScience 2015, 50, 522–529. [Google Scholar] [CrossRef] [Green Version]
  28. Khattak, A.M.; Pearson, S. Spectral filters and temperature effects on the growth and development of chrysanthemums under low light integral. Plant Growth Regul. 2006, 49, 61–68. [Google Scholar] [CrossRef]
  29. Randall, W.C.; Lopez, R.G. Comparison of supplemental lighting from high-pressure sodium lamps and light-emitting diodes during bedding plant seedling production. HortScience 2014, 49, 589–595. [Google Scholar] [CrossRef]
  30. Randall, W.C.; Lopez, R.G. Comparison of bedding plant seedlings grown under sole-source light-emitting diodes (LEDs) and greenhouse supplemental lighting from LEDs and high-pressure sodium lamps. HortScience 2015, 50, 705–713. [Google Scholar] [CrossRef] [Green Version]
  31. Sharkey, T.D.; Raschke, K. Effect of light quality on stomatal opening in leaves of Xanthium strumarium L. Plant Physiol. 1981, 68, 1170–1174. [Google Scholar] [CrossRef] [Green Version]
  32. Mills, H.A.; Jones, J.J.B. Plant Analysis Handbook II; MicroMacro Publishing, Inc.: Athens, GA, USA, 1996; p. 422. [Google Scholar]
  33. Almansa, E.M.; Espín, A.; Chica, R.M.; Lao, M.T. Nutritional response of seedling tomato plants under different lighting treatments. J. Plant Nutr. 2017, 40, 467–475. [Google Scholar] [CrossRef]
  34. Kopsell, D.A.; Sams, C.E. Increases in shoot tissue pigments, glucosinolates, and mineral elements in sprouting broccoli after exposure to short-duration blue light from light emitting diodes. J. Am. Soc. Hortic. Sci. 2013, 138, 31–37. [Google Scholar] [CrossRef] [Green Version]
  35. Babourina, O.; Newman, I.; Shabala, S. Blue light-induced kinetics of H+ and Ca2+ fluxes in etiolated wild-type and phototropin mutant Arabidopsis seedlings. Proc. Natl. Acad. Sci. USA 2002, 99, 2433–2438. [Google Scholar] [CrossRef] [Green Version]
  36. Heo, J.W.; Lee, C.W.; Paek, K.Y. Influence of mixed LED radiation on the growth of annual plants. J. Plant Biol. 2006, 49, 286–290. [Google Scholar] [CrossRef]
  37. Islam, M.A.; Tarkowská, D.; Clarke, J.L.; Blystad, D.R.; Gislerød, H.R.; Torre, S.; Olsen, J.E. Impact of end-of-day red and far-red light on plant morphology and hormone physiology of poinsettia. Sci. Hortic. 2014, 174, 77–86. [Google Scholar] [CrossRef]
  38. Halliday, K.J.; Martinez-Garcia, J.F.; Josse, E.M. Integration of light and auxin signaling. Cold Spring Harbor Perspect. Biol. 2009, 1, a001586. [Google Scholar] [CrossRef] [Green Version]
  39. Zheng, L.; Van Labeke, M.C. Chrysanthemum morphology, photosynthetic efficiency and antioxidant capacity are differentially modified by light quality. J. Plant Physiol. 2017, 213, 66–74. [Google Scholar] [CrossRef]
  40. Taiz, L.; Zeiger, E. Plant Physiology, 3rd ed.; Sinauer Associates: Sunderland, MA, USA, 2002; p. 690. [Google Scholar]
  41. García-Caparrós, P.; Almansa, E.M.; Chica, R.M.; Lao, M.T. Effects of artificial light treatments on growth, mineral composition, physiology, and pigment concentration in Dieffenbachia maculata “Compacta” plants. Sustainability 2019, 11, 2867. [Google Scholar] [CrossRef] [Green Version]
  42. Zheng, L.; Van Labeke, M.C. Long-term effects of red-and blue-light emitting diodes on leaf anatomy and photosynthetic efficiency of three ornamental pot plants. Front. Plant Sci. 2017, 8, 917. [Google Scholar] [CrossRef] [Green Version]
  43. Pinheiro, C.; Chaves, M.M. Photosynthesis and drought: Can we make metabolic connections from available data? J. Exp. Bot. 2010, 62, 869–882. [Google Scholar] [CrossRef] [Green Version]
  44. Eggink, L.L.; Park, H.; Hoober, J.K. The role of chlorophyll b in photosynthesis: Hypothesis. BMC Plant Biol. 2001, 1, 2. [Google Scholar] [CrossRef]
Figure 1. Spectral distribution of the different light treatments: (a) TL-D, (b) TL-D+LEDs and (c) TL-5.
Agronomy 10 00126 g001
Figure 2. Effect of light treatments on leaf (LDW), stem (SDW), root (RDW), and total dry weight (TDW; expressed in g) (A), and leaf weight ratio (LWR), stem weight ratio (SWR), and relative root weight ratio (RWR) (B) at the end of the experiment (8 weeks). Each parameter was analyzed individually. Values are the means ± standard deviations (error bars) of five plants per treatment. Bars with different letters are significantly different at p < 0.05 (analysis of variance (ANOVA) and least significant difference (LSD) tests). ns: not significant.
Agronomy 10 00126 g002
Figure 3. Effect of light treatments on total soluble sugars (TSS) and starch (expressed as µmol glucose equivalents g−1 DW) (A), indole 3-acetic acid (IAA) and proline (µmol g−1 DW) (B) in leaves at the end of the experiment (8 weeks). Each parameter was analyzed individually. Values are the means ± standard deviations (error bars) of five plants per treatment. Bars with different letters are significantly different at p < 0.05 (ANOVA and LSD test). ns: not significant.
Agronomy 10 00126 g003
Figure 4. Percentage of energy absorbed (Ka) by pigments (car, chla, chlb) according to each wavelength.
Agronomy 10 00126 g004
Figure 5. Theoretical irradiance energy absorbed by pigments (Ia) (chlorophyll a and b and carotenoids) in light treatments: (a) TL-D, (b) TL-D+LEDs and (c) TL-5.
Agronomy 10 00126 g005
Figure 6. Use of spectral energy by each pigment of the crop (USEcrop) (chlorophyll a and b and carotenoids) in light treatments: (a) TL-D, (b) TL-D+LEDs and (c) TL-5.
Agronomy 10 00126 g006
Figure 7. Linear univariant regression model integrated use of spectral energy (IUSE) and photosynthetically active radiation (PAR) with TDW.
Agronomy 10 00126 g007
Table 1. Agronomic characterization of light treatments.
Spectral Region (nm)Irradiance (µmol m−2 s−1)
TL-DTL-D + LEDsTL-5
UV (300–400)0.490.251.22
B (400–500)25.4022.1116.78
R (600–700)39.3230.0244.99
FR (700–800)3.811.945.45
PAR (400–700)112.3877.37101.22
NIR (700–1100)6.093.0610.56
TOTAL (300–1100)118.9680.68113.00
PAR:TOTAL0.940.960.90
PAR:NIR18.4525.259.58
B:R0.650.740.37
B:FR6.6611.393.08
R:FR10.3115.468.25
UV = ultraviolet, B = blue, R = red, FR = far red, PAR = photosynthetically active radiation, NIR = near red infrared.
Table 2. Mineral nutrient composition (expressed in mg g−1 DW) in roots, stems and leaves of F. verschaffeltii treated with different light treatments at the end of the experiment (8 weeks). Values with the same letters are not significantly different at p < 0.05 (ANOVA and LSD test). ns: not significant. Data are the means ± standard deviation of five plants per treatment.
Light TreatmentsRootsStemsLeaves
NTL-D15.54 ± 1.54 a16.66 ± 1.40 a14.84 ± 1.26 a
TL-D + LEDs15.54 ± 1.54 a16.38 ± 1.52 a14.98 ± 1.35 a
TL-515.12 ± 1.33 a16.24 ± 1.68 a15.54 ± 1.50 a
PTL-D1.55 ± 0.31 a0.93 ± 0.31 a2.48 ± 0.28 b
TL-D + LEDs1.86 ± 0.26 a1.14 ± 0.30 a2.60 ± 0.25 b
TL-51.78 ± 0.29 a1.20 ± 0.25 a3.41 ± 0.30 a
KTL-D26.13 ± 2.34 b15.21 ± 1.24 b46.41 ± 4.29 b
TL-D + LEDs33.54 ± 3.12 a24.96 ± 2.38 a45.24 ± 4.51 b
TL-527.13 ± 2.21 b16.38 ± 1.39 b59.67 ± 5.56 a
Table 3. Pigment concentration (expressed in mg g−1 FW) in plants of F. verschaffeltii treated with different light treatments at the end of the experiment (8 weeks). Values with the same letters are not significantly different at p < 0.05 (ANOVA and LSD test). ns: not significant. Data are the means ± standard deviation of five plants per treatment.
Light TreatmentsChl aChl bChl (a+b)Car
TL-D0.58 ± 0.02 a0.31 ± 0.01 a0.89 ± 0.04 a0.09 ± 0.01 a
TL-D + LEDs0.53 ± 0.02 b0.27 ± 0.01 b0.80 ± 0.03 b0.09 ± 0.01 a
TL-50.60 ± 0.03 a0.32 ± 0.03 a0.90 ± 0.03 a0.11 ± 0.01 a
Table 4. Use of spectral energy by each pigment (USEpigment) (chlorophyll a and b and carotenoids) (expressed in W m−2) in each light treatment. Values with the same letters are not significantly different at p < 0.05 (ANOVA and LSD test). ns: not significant. Data are the means ± standard deviation of five plants per treatment.
USEClaUSEClbUSECar
TL-D1.39 ± 0.27 a0.90 ± 0.09 a0.22 ± 0.04 a
TL-D + LEDs0.86 ± 0.16 b0.73 ± 0.07 b0.20 ± 0.04 a
TL-51.57 ± 0.27 a0.92 ± 0.09 a0.21 ± 0.05 a

