Global Approaches to Reduce Light Pollution from Media Architecture and Non-Static, Self-Luminous LED Displays for Mixed-Use Urban Developments


Abstract
:1. Introduction
2. Background Research
2.1. The Importance of Correct Definitions
2.2. Existing Light Pollution Laws, Related Lighting Standards and Guidlines
- The rapid development of solid-state lighting: LEDs and lighting control technology has meant this field has just recently emerged, and although it has increased to an unprecedented scale, scant research on its impact has been undertaken and made available;
- While research is being undertaken in chronobiology and other related fields, wider awareness is needed about the non-visual effects of artificial light on the circadian cycle and its negative consequences on humans, flora, and fauna [56]. This crucial study needs to be acknowledged and its outcomes integrated into lighting norms and regulations;
- The mixed use of urban development sets a great challenge due to the conflicting interests of businesses and residents;
- The changing light levels of existing LED video installations make it very difficult to accurately measure their luminance output, and the equipment needed to do this effectively does not exist.
- Lastly, these standards and guidelines are not free of charge.
2.3. Future Trends in Display Technology
3. Research Hypotheses
4. Materials and Methods
4.1. Field Measurement Survey (Step 1)
4.1.1. Procedure
4.1.2. Analysis and Hypothesis Testing
4.2. Photographic Survey (Step 2)
Procedure
4.3. Technical Equipment
5. Results: Hypothesis Testing
5.1. Results: An Overview
5.2. Hypothesis 1 (H1)
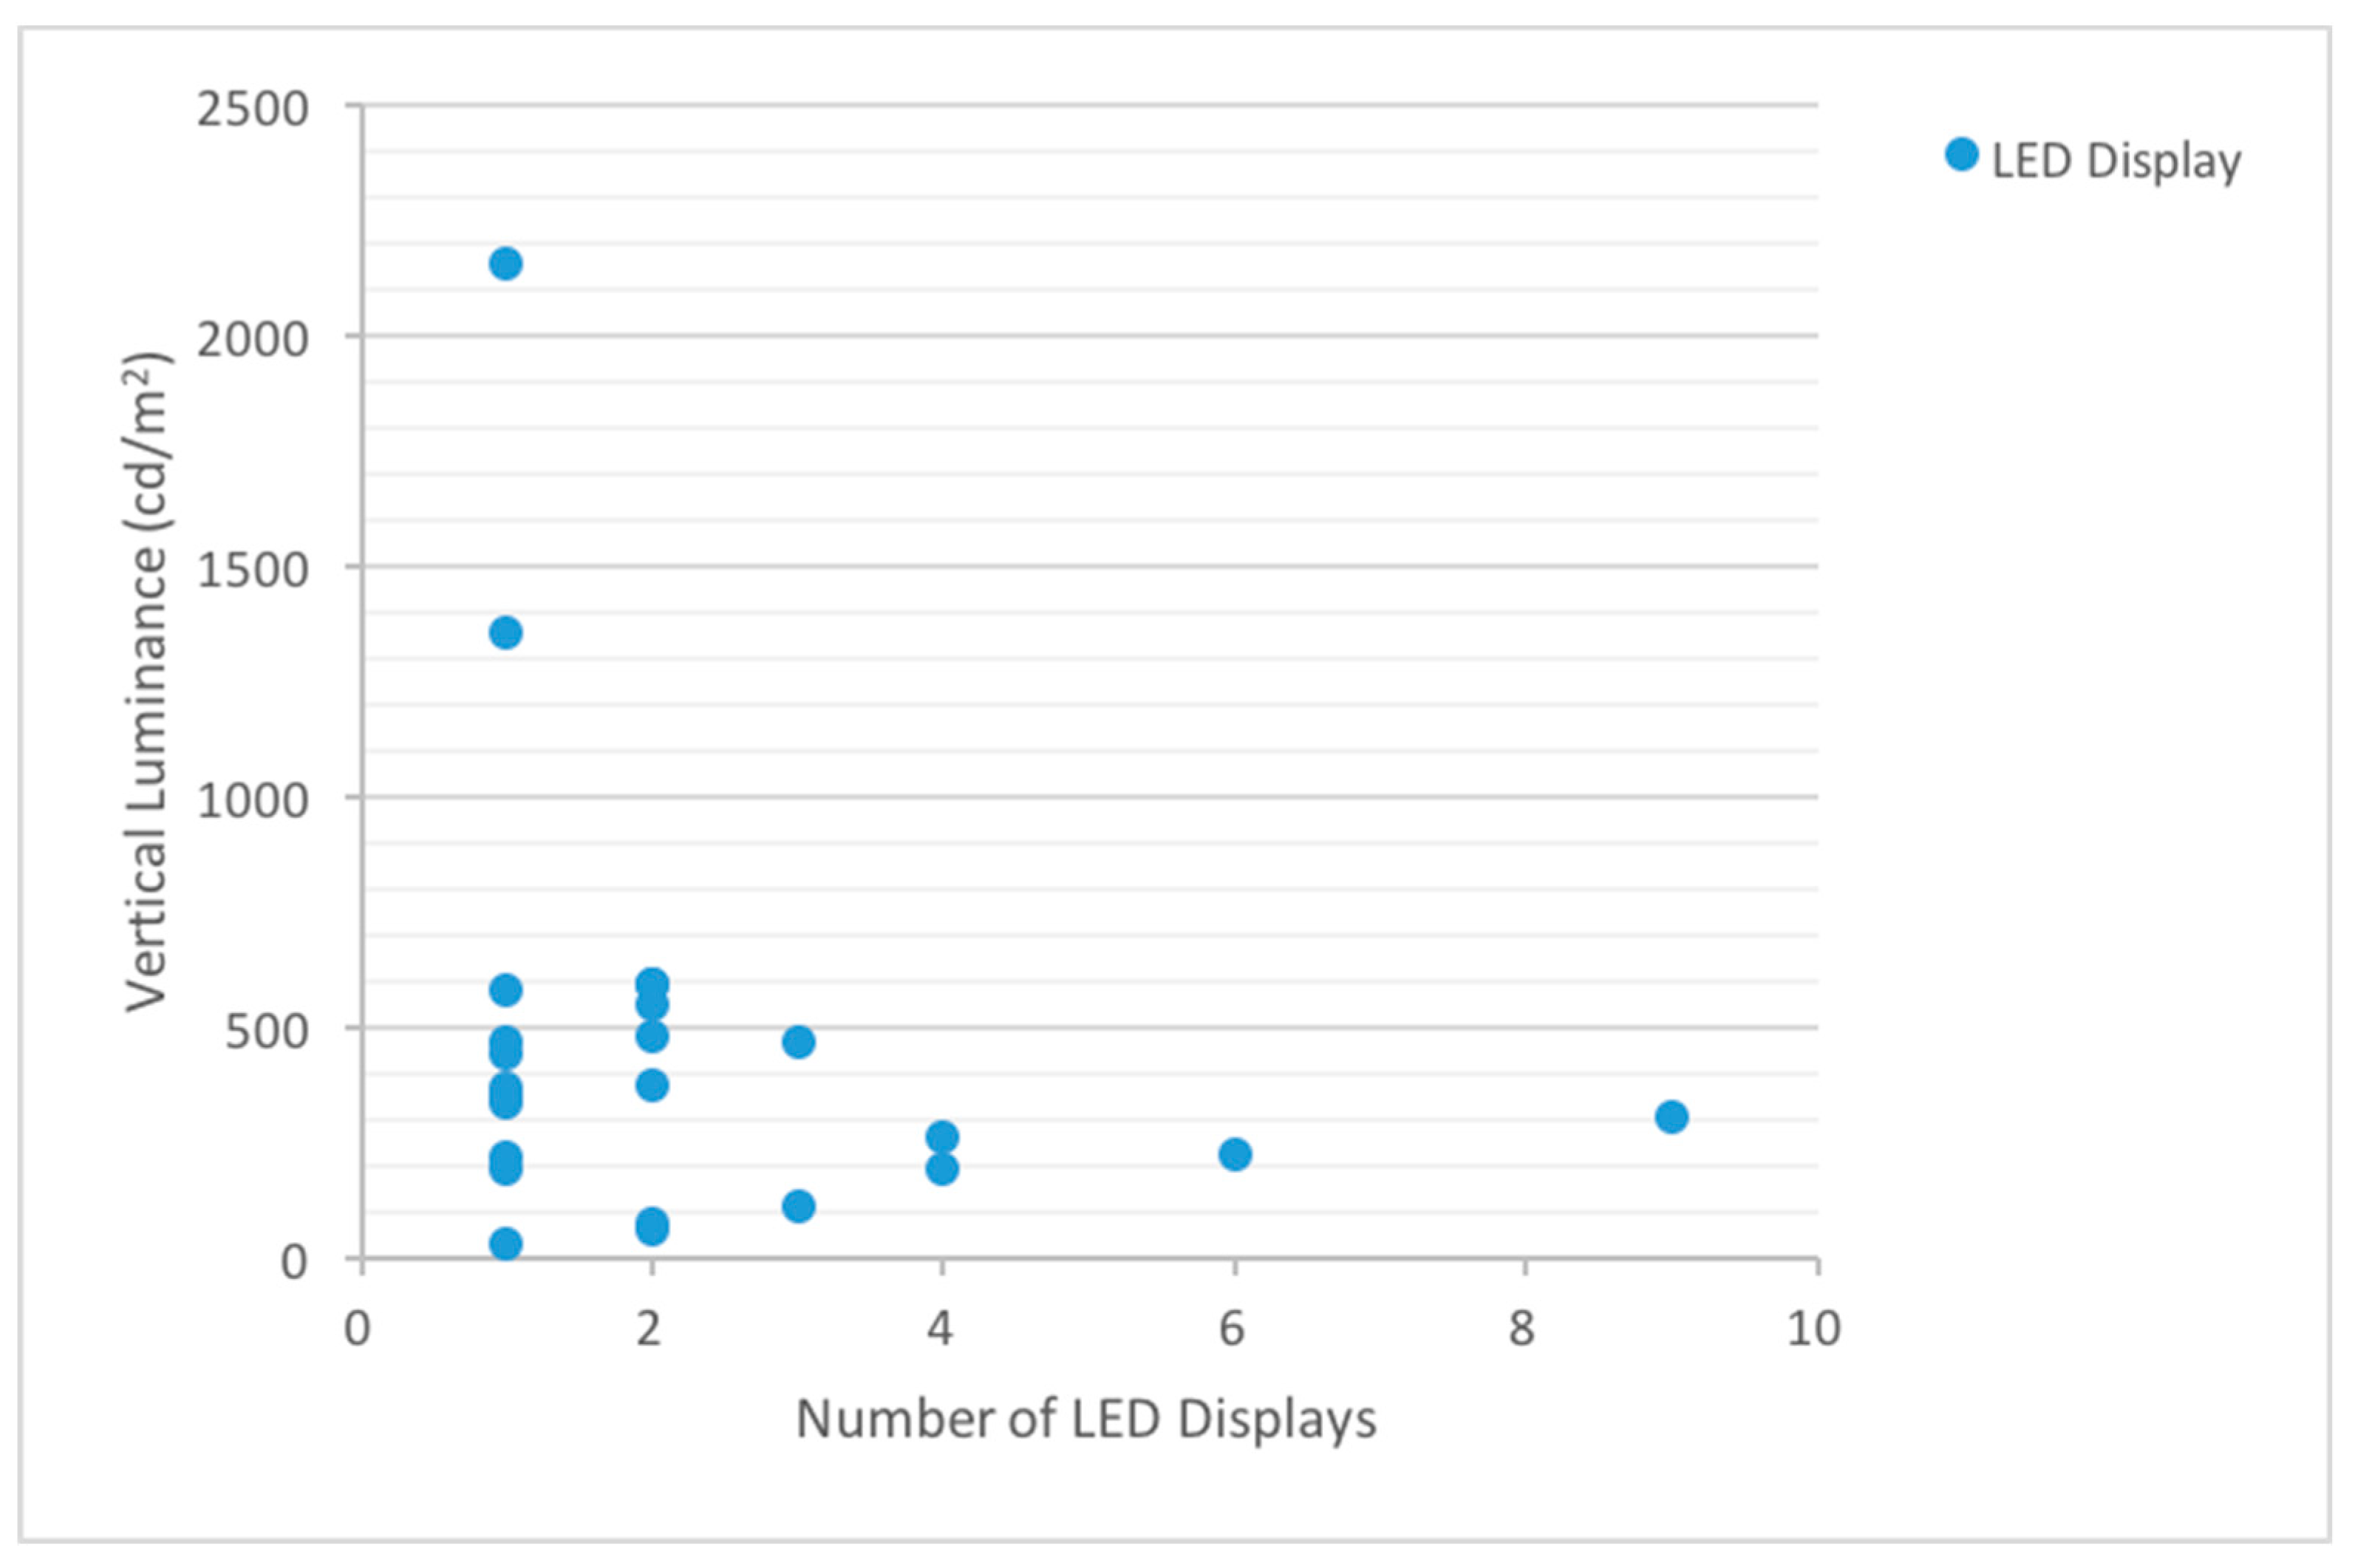
5.2.1. The Number of LED Displays versus Achieved Vertical Luminance
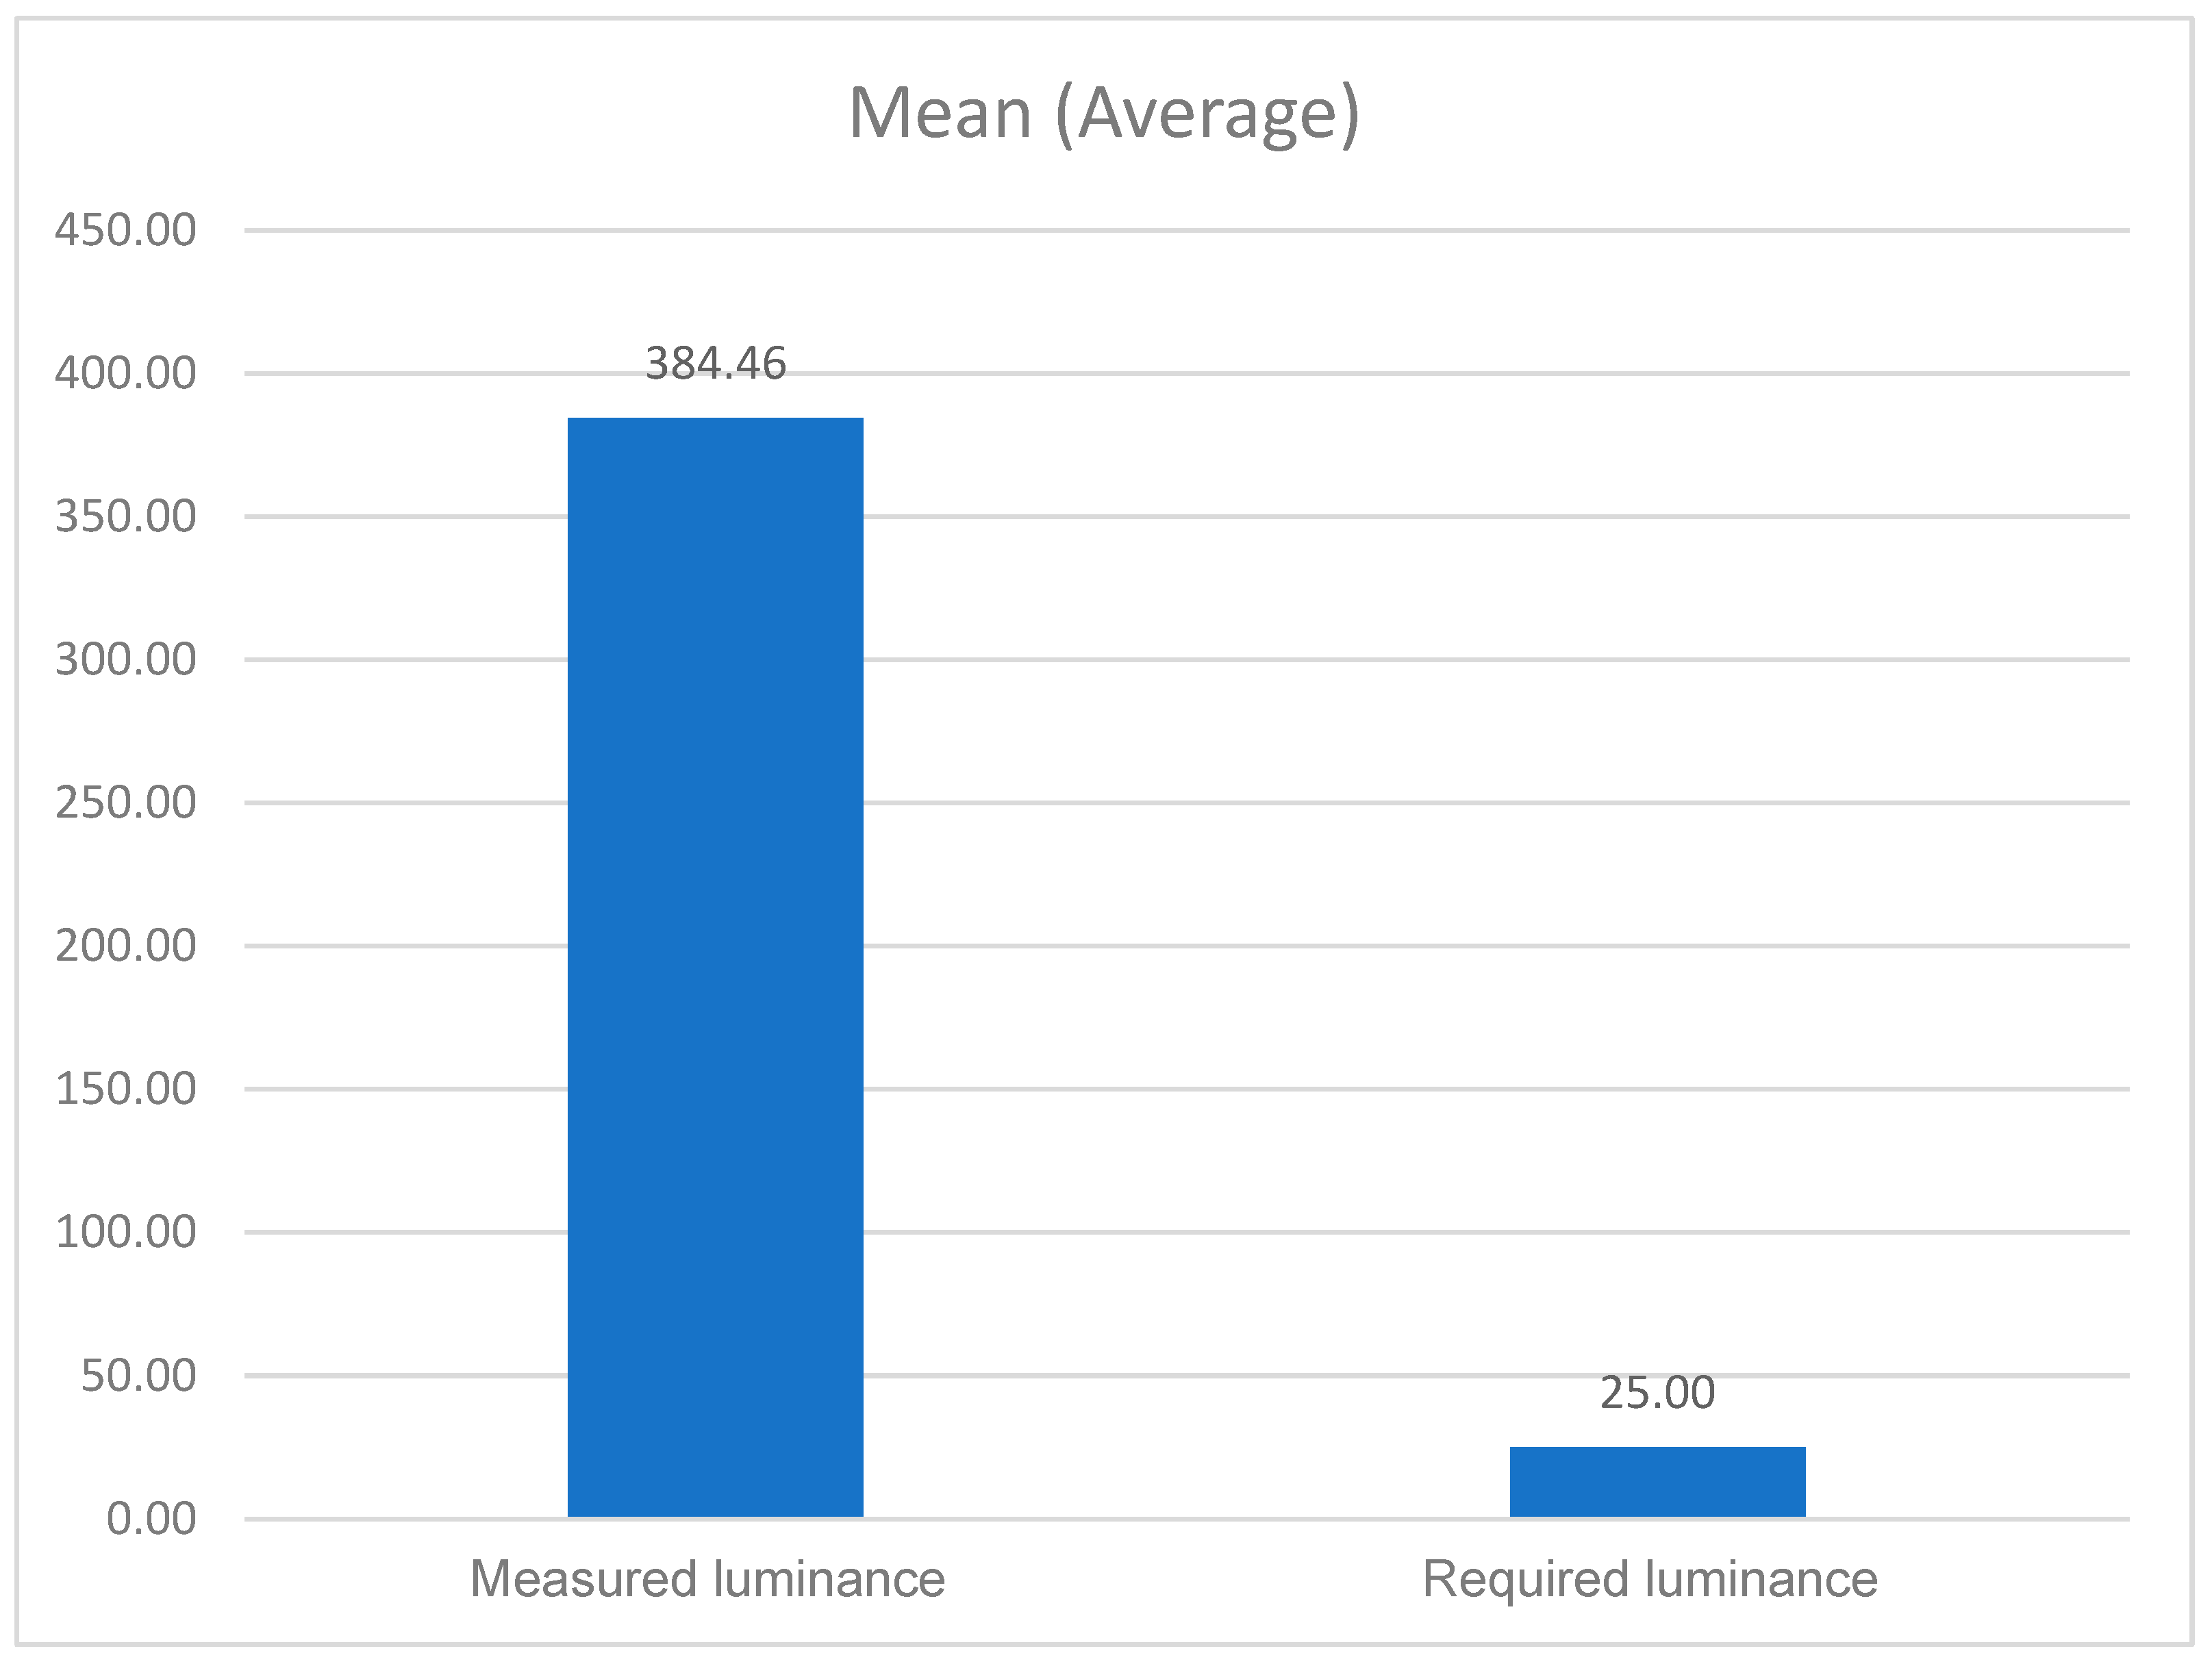
5.2.2. The Minimum and Maximum Values of Vertical Luminance
5.2.3. The Minimum and Maximum Sizes of the LED Display
5.2.4. The Resolution of LED Displays
6. Discussion
7. Limitations of the Study
7.1. Research Methodology
- There is a lack of a recommended and approved worldwide research methodology and procedures to measure non-static, self-luminous LED displays.
- No guidance exists for the maximum, minimum, and average luminance of vertical displays, nor are the values from non-static, self-luminous displays assigned to any of the five environmental zones.
- No proposals exist for the spectral emissions of LED light sources.
- No proposals exist for the maximum permitted levels of Upward Light Ratio (ULR) of the installation and vertical illuminance on properties to evaluate the impact of obstructive light.
- It is often impractical to measure the vertical luminance values of a window display as proposed by the IES,—by pausing the video of an LED display to achieve a static image with 100% output of white light (RGB) as typical of the factory setting (it might require a number of approvals and agreements from third parties, access to the interior control room, as well as access to the computer/laptop that has the programmed settings).
- There are still unresolved issues with the measuring tools (for static and non-static LED displays). The calibration of photometers is still performed using incandescent-based standards [65], as there is not a single spectral power distribution that would be representative of all white LED sources. This issue also includes the mobile phone Candela App (from Opticalight) used in this research, which was calibrated to a CCT of 3000 K (warm white light) as a base.
7.2. Tools to Correctly Measure Vertical Luminace of Non-Static, Self-Luminous LED Displays
- The tools typically used to measure the surface luminance of LED displays, like a luminance meter (from Konica Minolta_LS-110 [66]) or portable Imaging Photometer Measurement Systems based on a digital camera photometer (from Technoteam LMK [67]) are limited and insufficient to measure LED displays due to the fact that they have a non-uniform diffusing surface, and a standard luminance meter’s sensor is unable to focus on one point, as the luminance levels constantly change, so values are often inaccurate.
- The calibrated free of charge Candela App (from Opticalight) is only available for the following devices: iPhone 4S, iPhone 5, iPhone 5C, iPhone 5S, iPhone 6, iPhone SE, iPad 3, iPad 4, iPad air, iPad air 2, iPad mini, iPad mini 2.
- The CIE recommends taking a minimum of nine readings, but each time the values may still be different (See Section 5.2.2).
- The calculation method procedure for the interpolation of photometric data used by the mobile application might vary from other methods used with different measuring instruments, so comparing values might not provide the same results. According to CIE: “even with the use of high quality instruments, errors of up to 10% due to instrument calibration alone must be expected” [52].
7.3. Field Measurement Survey Setup
- The photocell of the measuring instrument may not have been correctly positioned and aligned with respect to the measured plane.
- With the available measuring tools, it is not possible to completely remove stray ambient lighting (downlights above the screen, luminaires in the background of the store, or input from facade or street lighting), and this may have an additional impact on the overall levels of recorded vertical luminance.
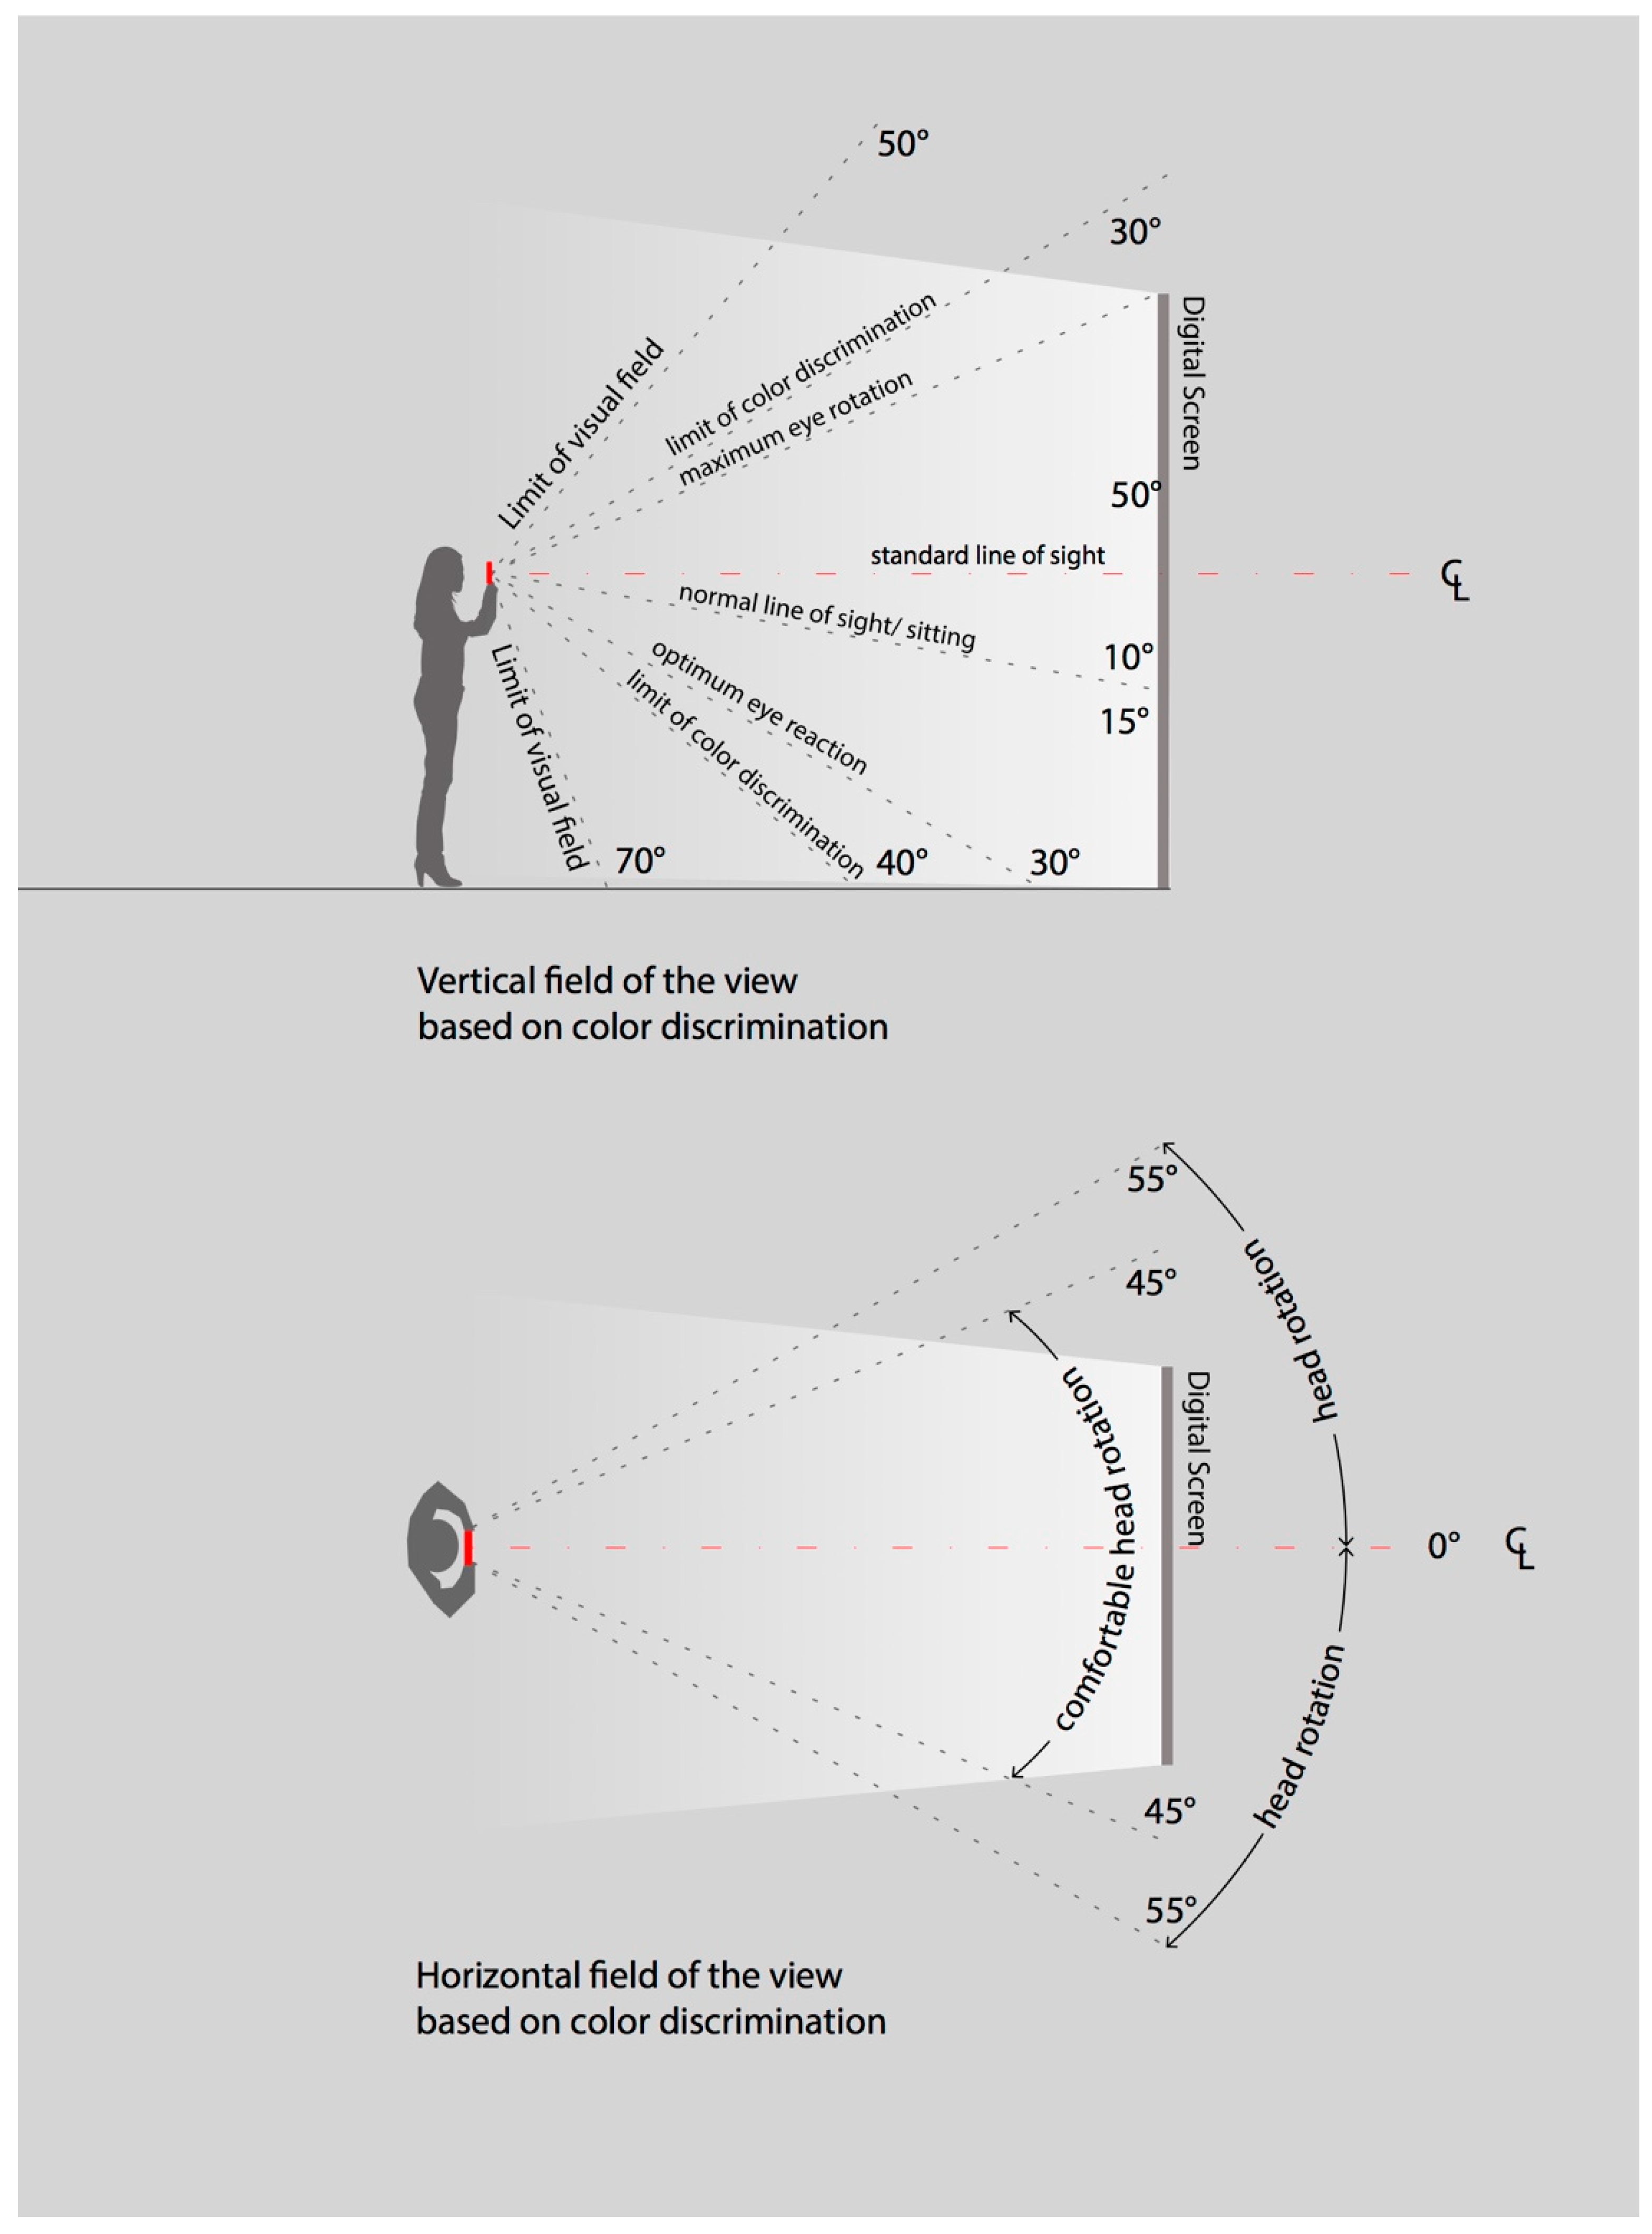
- The field of view based on color discrimination perceived by the human eye is often overlooked and it might be different than the field of view of the luminance meter used, therefore, guidance here is necessary.
8. Conclusions
Author Contributions
Funding
Acknowledgments
Conflicts of Interest
References
- Zielinska-Dabkowska, K.M. Urban Lighting Masterplan—Definitions, Methodologies and Collaboration In Urban Lighting for People: Evidence—Based Lighting Design for the Built Environment, 1st ed.; Davoudian, N., Ed.; RIBA Publishing: London, UK, 2019; pp. 18–41. [Google Scholar]
- Zielinska-Dabkowska, K.M. Night in a big city. Light festivals as a creative medium used at night and their impact on the authority, significance and prestige of a city. In The Role of Cultural Institutions and Events in the Marketing of Cities and Regions, 1st ed.; Domański, T., Ed.; Wydawnictwo Uniwersytetu Łódzkiego: Łódz, Poland, 2016; pp. 63–90. [Google Scholar]
- The Challenges and Benefits of Mixed-Use Facilities. Available online: https://www.buildings.com/article-details/articleid/9004/title/the-challenges-and-benefits-of-mixed-use-facilities (accessed on 6 June 2019).
- Ohayon, M.M.; Milesi, C. Artificial Outdoor Nighttime Lights Associate with Altered Sleep Behavior in the American General Population. Sleep 2016, 39, 1311–1320. [Google Scholar] [CrossRef] [PubMed] [Green Version]
- How Hong Kong’s Light Pollution Can Ruin Your Nights and Make Days a Drag. Available online: https://www.scmp.com/lifestyle/health-beauty/article/1920407/how-hong-kongs-light-pollution-can-ruin-your-nights-and-make (accessed on 6 June 2019).
- Europe 2020 Strategy. Available online: https://ec.europa.eu/info/business-economy-euro/economic-and-fiscal-policy-coordination/eu-economic-governance-monitoring-prevention-correction/european-semester/framework/europe-2020-strategy_en (accessed on 6 June 2019).
- Campisi, D.; Gitto, S.; Morea, D. Economic Feasibility of Energy Efficiency Improvements in Street Lighting Systems in Rome. J. Clean. Prod. 2018, 175, 190–198. [Google Scholar] [CrossRef]
- Campisi, D.; Gitto, S.; Morea, D. Light Emitting Diodes Technology in Public Light System of the Municipality of Rome: An Economic and Financial Analisys. Int. J. Energy Econ. Policy 2017, 7, 200–208. [Google Scholar]
- Beccali, M.; Bonomolo, M.; Leccese, F.; Lista, D.; Salvadori, G. On the impact of safety requirements, energy prices and investment costs in street lighting refurbishment design. Energy 2018, 165, 739–759. [Google Scholar] [CrossRef]
- Zielinska-Dabkowska, K.; Xavia, K. Historic Urban Settings, LED Illumination and its Impact on Nighttime Perception, Visual Appearance, and Cultural Heritage Identity. In Proceedings of the 5th SGEM International Multidisciplinary Scientific Conferences on Social Sciences and Arts SGEM2018, Florence, Italy, 23–26 October 2018; STEF92 Technology: Sofia, Bulgaria; pp. 277–292. [Google Scholar]
- Żagan, W.; Krupiński, R. A study of the classical architecture floodlighting. Light Eng. 2017, 25, 57–64. [Google Scholar]
- Menéndez, A.; Martínez, A.; Santos, A.; Ruiz, B.; Moritz, K.; Klein, I.; Díaz, J.; Lagunas, A.R.; Sauermann, T.; Gómez, D. A multifunctional ETFE module for sustainable façade lighting: Design, manufacturing and monitoring. Energy Build. 2018, 161, 10–21. [Google Scholar] [CrossRef]
- Trends in Outdoor Lighting: LEDs Rule the Landscape. Available online: https://www.totallandscapecare.com/landscaping/trends-in-outdoor-lighting-leds-rule-the-landscape/ (accessed on 20 June 2019).
- Petritoli, E.; Leccese, F.; Stefano Pizzuti, S.; Pieroni, F. Smart lighting as basic building block of smart city: An energy performance comparative case study. Measurement 2019, 136, 466–477. [Google Scholar] [CrossRef]
- Lee, J.S.; Sul, S.H. Media Façade and the design identity of buildings based on visual density. Int. J. Asia Digit. Art Des. Assoc. 2017, 21, 49–55. [Google Scholar]
- Global LED Video Walls Market Analysis & Trends—Industry Forecast to 2025 (ID: 4333052). Available online: https://www.researchandmarkets.com/reports/4333052/global-led-video-walls-market-analysis-and-trends (accessed on 30 March 2019).
- Wouters, N.; Keignaert, K.; Huyghe, J.; Vande Moere, A. Revealing the architectural quality of media architecture. In Proceedings of the 3rd ACM Conference Media Architecture Biennale (MAB 2016), Sydney, Australia, 1–4 June 2016; The Association for Computing Machinery (ACM): New York, NY, USA, 2016. [Google Scholar]
- Korsgaard, H.; Brynskov, M. City Bug Report: Urban prototyping as participatory process and practice. In Proceedings of the 2nd ACM Conference Media Architecture Biennale (MAB 2014), Aarhus, Denmark, 19–22 November 2014; The Association for Computing Machinery (ACM): New York, NY, USA, 2014; pp. 21–29. [Google Scholar]
- Fatah gen Schieck, A.; Boddington, G.; Fink, P. Framework for the Implementation of Urban Big Screens in the Public Space, 1st ed.; Bartlett School of Graduate Studies, University College London: London, UK, 2009; Available online: http://www.bodydataspace.net/wp-content/uploads/SCREAM_Framework_Jan2009.pdf (accessed on 30 March 2019).
- Dalsgaard, P.; Halskov, K. Designing Urban Media Façades: Cases and Challenges. In Proceedings of the SIGCHI Conference on Human Factors in Computing Systems (CHI 2010), Atlanta, GA, USA, 10–15 April 2010; The Association for Computing Machinery (ACM): New York, NY, USA, 2010; pp. 2277–2286. [Google Scholar]
- Fredericks, J.; Caldwell, G.A.; Tomitsch, M. Middle-out design: Collaborative community engagement in urban HCI. In Proceedings of the 28th Australian Conference on Computer-Human Interaction (OzCHI 2016), Launceston, Australia, 29 November–2 December 2016; pp. 200–204. [Google Scholar]
- Vande Moere, A.; Wouters, N. The role of context in media architecture. In Proceedings of the 2012 International Symposium on Pervasive Displays (PerDis 2012), Porto, Portugal, 4–5 June 2012; The Association for Computing Machinery (ACM): New York, NY, USA, 2012. [Google Scholar]
- Dalsgaard, P.; Halskov, K.; Wiethoff, A. Designing Media Architecture: Tools and Approaches for Addressing the Main Design Challenges. In Proceedings of the 2016 CHI Conference on Human Factors in Computing Systems (CHI 2016), San Jose, CA, USA, 7–12 May 2016; The Association for Computing Machinery (ACM): New York, NY, USA, 2016; pp. 2562–2573. [Google Scholar]
- Sade, G.J. Aesthetics of urban media façades. In Proceedings of the 2nd ACM Conference Media Architecture Biennale (MAB 2014), Aarhus, Denmark, 19–22 November 2014; The Association for Computing Machinery (ACM): New York, NY, USA, 2014; pp. 58–67. [Google Scholar]
- Foth, M.; Caldwell, G.A. More-than-human media architecture. In Proceedings of the 5th ACM Conference Media Architecture Biennale (MAB 2018), Beijing, China, 13–16 November 2018; The Association for Computing Machinery (ACM): New York, NY, USA, 2018. [Google Scholar]
- Ticleanu, C.; Littlefair, P. A summary of LED lighting impacts on health. Int. J. Sustain. Lighting 2015, 34, 5–11. [Google Scholar] [CrossRef]
- Health Effects of Large LED Screens on Local Residents. Available online: http://www.ncceh.ca/documents/practice-scenario/health-effects-large-led-screens-local-residents#conclusions (accessed on 6 June 2019).
- The Lost LED Revolution: Light Pollution Is Increasing. Available online: https://www.skyandtelescope.com/astronomy-news/lost-led-revolution-light-pollution-increasing/ (accessed on 6 June 2019).
- Scheir, G.; Hanselaer, P.; Ryckaert, W. Defining the Actual Luminous Surface in the Unified Glare Rating. Leukos 2017, 13, 201–210. [Google Scholar] [CrossRef]
- Jin, H.; Jin, S.; Chen, L.; Cen, S.; Yuan, K. Research on the Lighting Performance of LED Street Lights with Different Color Temperatures. IEEE Photonics J. 2015, 7, 1601309. [Google Scholar] [CrossRef]
- Our Nights are Getting Brighter, and Earth is Paying the Price. Available online: https://www.nationalgeographic.com/science/2019/04/nights-are-getting-brighter-earth-paying-the-price-light-pollution-dark-skies/ (accessed on 6 June 2019).
- Zielinska-Dabkowska, K.M.; Fatah gen Schieck, A. Designing digital displays and interactive media in today’s cities by night. Do we know enough about attracting attention to do so? Hum. Cent. Des. Sci. Technol. Conscious Cities Anthol. 2018. [Google Scholar] [CrossRef]
- Min, J.; Min, K. Outdoor artificial nighttime light and use of hypnotic medications in older adults: A population-based cohort study. J. Clin. Sleep Med. 2018, 14, 1903–1910. [Google Scholar] [CrossRef] [PubMed]
- Digital Media are Changing the Face of Buildings, and Urban Policy Needs to Change with Them. Available online: https://theconversation.com/digital-media-are-changing-the-face-of-buildings-and-urban-policy-needs-to-change-with-them-84779 (accessed on 6 June 2019).
- 4-58: Obtrusive Light from Colourful and Dynamic Lighting and Its Limitation. Available online: http://www.cie.co.at/technicalcommittees/obtrusive-light-colourful-and-dynamic-lighting-and-its-limitation (accessed on 30 March 2019).
- Hespanhol, L.; Haeusler, M.H.; Tomitsch, M.; Tscherteu, G. Media Architecture Compendium: Digital Placemaking, 1st ed.; Avedition: Stuttgart, Germany, 2017. [Google Scholar]
- Definition. Available online: https://en.oxforddictionaries.com/definition/definition (accessed on 30 March 2019).
- Zielinska-Dabkowska, K.M. Critical Perspectives On Media Architecture: Is It Still Possible to Design Projects Without Negatively Affecting Urban Nighttime Environments and Will the Future Remain Dynamic, Bright and Multi-Colored? In Proceedings of the 2nd ACM Conference Media Architecture Biennale (MAB 2014), Aarhus, Denmark, 19–22 November 2014; The Association for Computing Machinery (ACM): New York, NY, USA, 2014; p. 102. [Google Scholar]
- Zielinska-Dabkowska, K.M.; Hartmann, J. LED outdoor advertising in the urban context. Case study of “Walk”: A video installation integrated into the façade of a store in Zürich/CH. Prof. Lighting Des. Mag. 2016, 101, 52–58. [Google Scholar]
- Youyuenyong, P. Comparative Environmental and Planning Law Relating to Light Pollution Control in England and Other Jurisdictions. Unpublished Ph.D. Thesis, School of Law De Montfort University, Leicester, UK, 2015. Available online: https://www.dora.dmu.ac.uk/bitstream/handle/2086/11434/Pedithep%20Youyuenyong%20final.pdf?sequence=1&isAllowed=y (accessed on 30 March 2019).
- Stone, T. Light Pollution: A Case Study in Framing an Environmental Problem. Ethics Policy Environ. 2017, 20. [Google Scholar] [CrossRef]
- City of Monterey Loses Lawsuit over Streetlights. Available online: http://www.montereycountyweekly.com/blogs/news_blog/city-of-monterey-loses-lawsuit-over streetlights/article_89e8e764-d3b2-11e6-b53b-935d775754e7.html (accessed on 30 March 2019).
- Republic of Slovenia. The Environmental Protection Act. Decree on Limiting Values of the Light Pollution of the Environment. Available online: http://www.uradni-list.si/1/objava.jsp?urlid=200781&stevilka=4162%20 (accessed on 30 March 2019).
- Parliament of the United Kingdom. Clean Neighbourhoods and Environment Act 2005. Chapter 16, Part 9 Statutory Nuisances, Section 102. Available online: https://www.legislation.gov.uk/ukpga/2005/16/section/102 (accessed on 30 March 2019).
- IDA and IES Model Lighting Ordinance (MLO) with User’s Guide. Available online: https://www.darksky.org/our-work/lighting/public-policy/mlo/ (accessed on 30 March 2019).
- Light Pollution Reduction. The Leadership in Energy and Environmental Design (LEED). Available online: https://www.usgbc.org/credits/sspc7 and https://www.usgbc.org/credits/ss8 (accessed on 30 March 2019).
- Internally Illuminated Exterior Signage. The Leadership in Energy and Environmental Design (LEED). Available online: https://www.usgbc.org/credits/reqss8r12-0 (accessed on 30 March 2019).
- The Minister of Ecology, Sustainable Development and Energy. Order of 25 January 2013 on Night Lighting of Non-Residential Buildings to Limit Light Pollution and Energy Consumption. Available online: https://www.legifrance.gouv.fr/affichTexte.do?cidTexte=JORFTEXT000027003910&categorieLien=id (accessed on 30 March 2019).
- Korean Ministry of Environment. Act on the Prevention of Light Pollution due to Artificial Light. Act No. 11261. Available online: https://elaw.klri.re.kr/eng_mobile/viewer.do?hseq=39814&type=part&key=39 (accessed on 30 March 2019).
- Charter on External Lighting. Available online: http://www.charteronexternallighting.gov.hk/en/introduction/introduction.html (accessed on 30 March 2019).
- EN 12464-2:2014 Light and Lighting–Lighting of Work Places, Part 2: Outdoor Work Places. CIE Publication. Vienna: CIE. Available online: https://www.techstreet.com/cie/standards/bs-en-12464-2-2014?product_id=1872098#product/ (accessed on 6 June 2019).
- Commission Internationale de l’Eclairage (CIE). Guide on the Limitation of the Effects of Obtrusive Light from Outdoor Lighting Installations: Technical Report: CIE 150: 2003, 2nd ed.; CIE Publication: Vienna, Austria, 2003; Available online: http://www.cie.co.at/publications/guide-limitation-effects-obtrusive-light-outdoor-lighting-installations- (accessed on 30 March 2019).
- Plg05 the Brightness of Illuminated Advertisements. Available online: https://www.theilp.org.uk/resources/ilp-general-reports/plg05-the-brightness-of-illuminated-advertisements/ (accessed on 6 June 2019).
- Recommended Practice: Off-Roadway Sign Luminance. Available online: https://www.ies.org/product/recommended-practice-off-roadway-sign-luminance/ (accessed on 6 June 2019).
- IDA Guidance for Electronic Message Centres (EMCs). Available online: https://www.darksky.org/wp-content/uploads/2019/05/EMC-Guidelines-IDA2019-1.pdf (accessed on 6 June 2019).
- Gaston, K.J.; Visser, M.E.; Hölker, F. The biological impacts of artifcial light at night: The research challenge. Philos. Trans. R. Soc. B 2015, 370, 20140133. [Google Scholar] [CrossRef] [PubMed]
- Cheong, Y. Market Opportunities for LED Video Display Technology. In Unpublished PowerPoint Slides Presented at the International LED Summit; LED Expo: Bangkok, Thailand, May 2017. [Google Scholar]
- Plan Lumière Gesamtkonzept. Available online: https://www.stadt-zuerich.ch/ted/de/index/taz/publikationen_u_broschueren/plan_lumiere_gesamtkonzept.html (accessed on 30 March 2019).
- Main Streets Across the World 2018. Available online: http://www.cushmanwakefield.com/en/research-and-insight/2018/main-streets-across-the-world-2018 (accessed on 30 March 2019).
- EN 13201-3 Road lighting—Part 3: Calculation of Performance. Available online: https://www.en-standard.eu/csn-en-13201-1-4-road-lighting/ (accessed on 6 June 2019).
- Panero, J.; Zelnik, M. Human Dimension & Interior Space. A Source Book of Design Reference Standards, 1st ed.; Whitney Library of Design: New York, NY, USA, 1979; p. 287. [Google Scholar]
- American Medical Association (AMA), Council on Science and Public Health. Human and Environmental Effects of Light Emitting Diode (LED) Community Lighting. CSAPH Report: 2-A-16. Available online: http://darksky.org/wp-content/uploads/bsk-pdf-manager/AMA_Report_2016_60.pdf (accessed on 30 March 2019).
- Opticalight Candela Meter. Available online: https://www.smoca.ch/projekte/iphone/opticalight (accessed on 6 June 2019).
- Characterization of the Performance of Illuminance Meters and Luminance Meters. Available online: http://www.cie.co.at/publications/characterization-performance-illuminance-meters-and-luminance-meters (accessed on 30 March 2019).
- CIE Research Strategy on Defining New Calibration Sources and Illuminants. Available online: https://www.led-professional.com/resources-1/articles/cie-research-strategy-on-defining-new-calibration-sources-and-illuminants (accessed on 30 March 2019).
- Luminance Meters LS-100/LS-110. Available online: https://www5.konicaminolta.eu/en/measuring-instruments/products/light-display-measurement/discontinued-products/ls-100-ls-110.html (accessed on 6 June 2019).
- LMK Mobile Air. Available online: https://www.technoteam.de/product_overview/lmk/products/lmk_mobile_air/index_eng.html (accessed on 6 June 2019).
- Opticalight/Research/Opticalight App. Available online: http://opticalight.ch/wordpress/en/category/research (accessed on 6 June 2019).
- Video Luminance Meter. Available online: http://www.buykorea.org/product-details/video-luminance-meter--3033884.html (accessed on 6 June 2019).
- Fatah gen Schieck, A. Towards an integrated architectural media space: The urban screen as a socialising platform. In Urban Screens Reader; McQuire, S., Martin, M., Niederer, S., Eds.; Institute of Network Cultures: Amsterdam, Holland, 2009; pp. 243–260. [Google Scholar]
- Zielinska-Dabkowska, K.M. Make lighting healthier. Nature 2018, 553, 274–276. [Google Scholar] [CrossRef] [PubMed]
- Ngarambe, J.; Kim, G. Sustainable Lighting Policies: The Contribution of Advertisement and Decorative Lighting to Local Light Pollution in Seoul, South Korea. Sustainability 2018, 10, 1007. [Google Scholar] [CrossRef]


| Definition | Proposed Description |
|---|---|
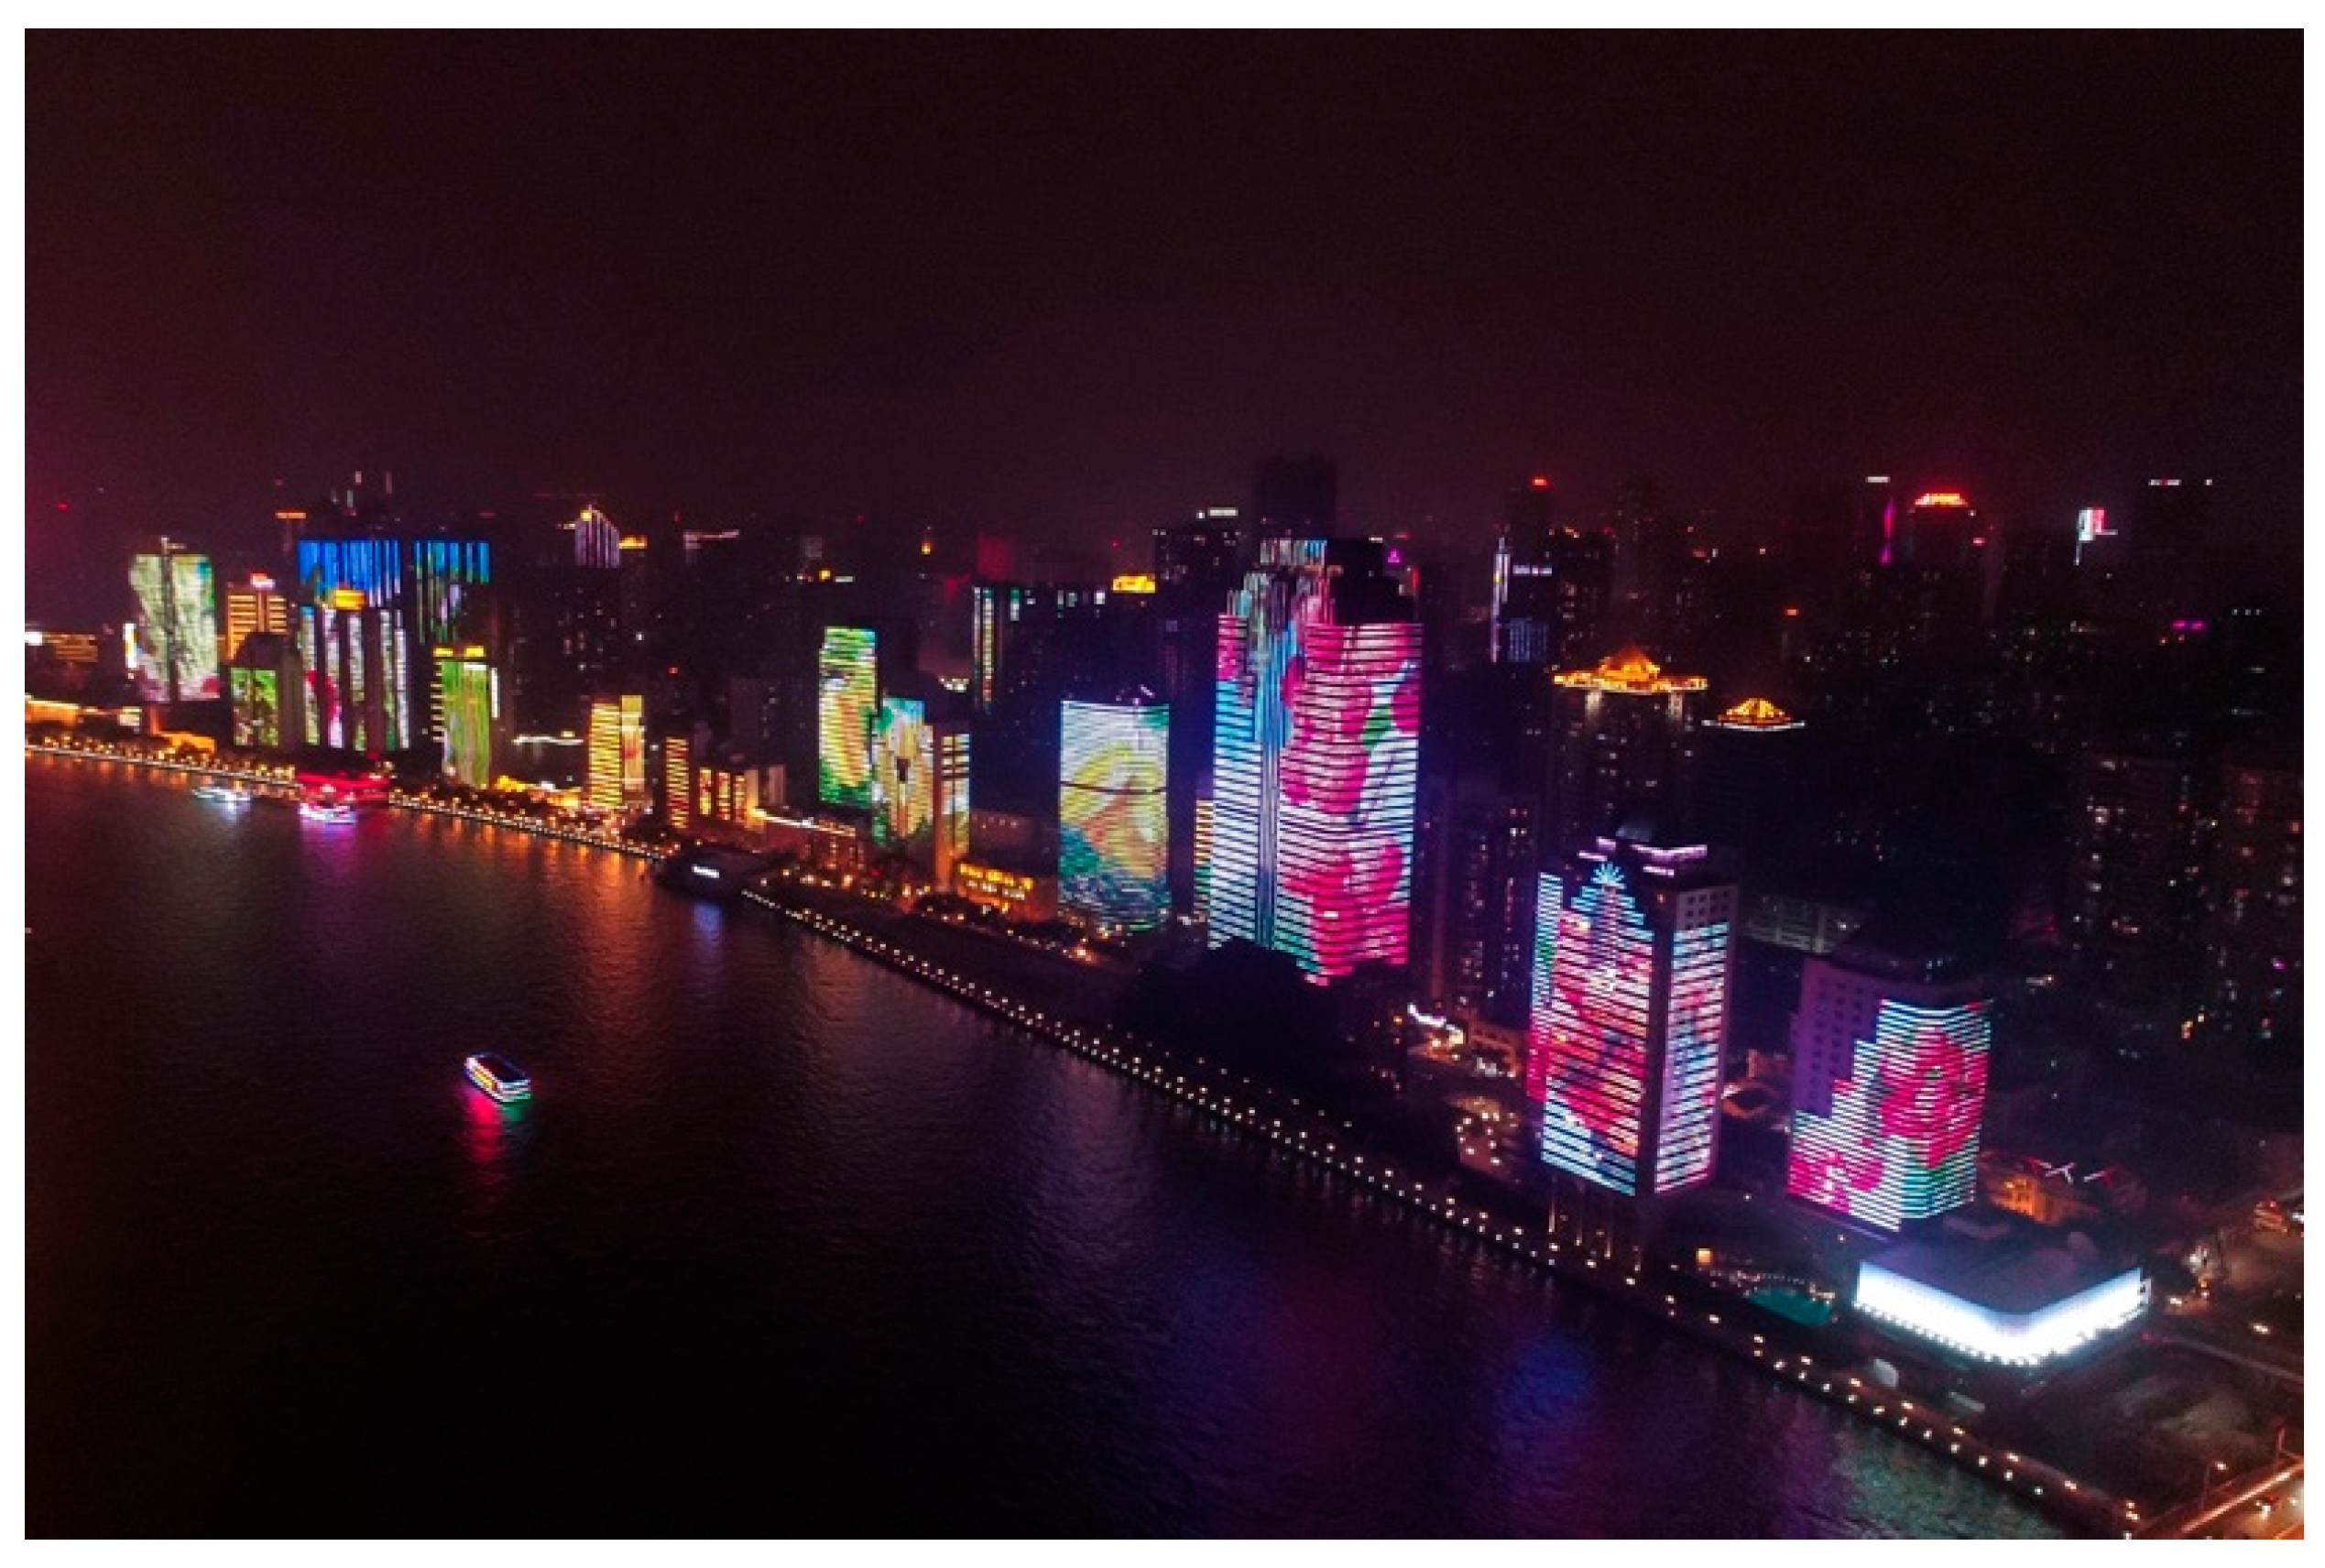
| Media Architecture | Media architecture is a new emerging field within exterior illumination, where dynamic graphics, text, images, and spatial movement are displayed on elements of the built environment, properly integrated within architectural structures and/or buildings within public spaces. Modern digital technologies allow for adaptation and interaction with users. The main function of media architecture is to “communicate specific information” in an active, dynamic, and interactive form via high-quality visual and artistic content. Media facades and digital outdoor media displays that emit light are a vital component of media architecture and the digitalization of cities, forming part of the original and intellectual enrichment of the urban environment with cultural, social, and economic implications for the immediate surroundings. Such installations are usually permanent in nature, but can have variable, temporary content. Well-designed media architecture should not only enhance the environment, it should also be biologically and ecologically responsible, minimizing its impact on the nighttime landscape, and the health and well-being of human residents, wildlife, and/or flora and fauna. |
| Non-Static LED Advertising | Non-static LED advertising can be defined as a means of promoting just about anything in a publicly or privately owned space. It can also be used commercially for marketing purposes (light art installations). The systems use LEDs and feature different resolutions, colors, luminous intensities, and lighting controls. They can be installed on a temporary or permanent basis, and content can be dynamic or static, in low or high resolution, and in the form of text, images or video sequences. Due to the technological advancements in the development of the brightness of LEDs, such display systems can also be used outdoors during daylight hours. There are different types of digital advertising platforms: signs, logos, lettering, shop windows, screens or media facades [39]. |
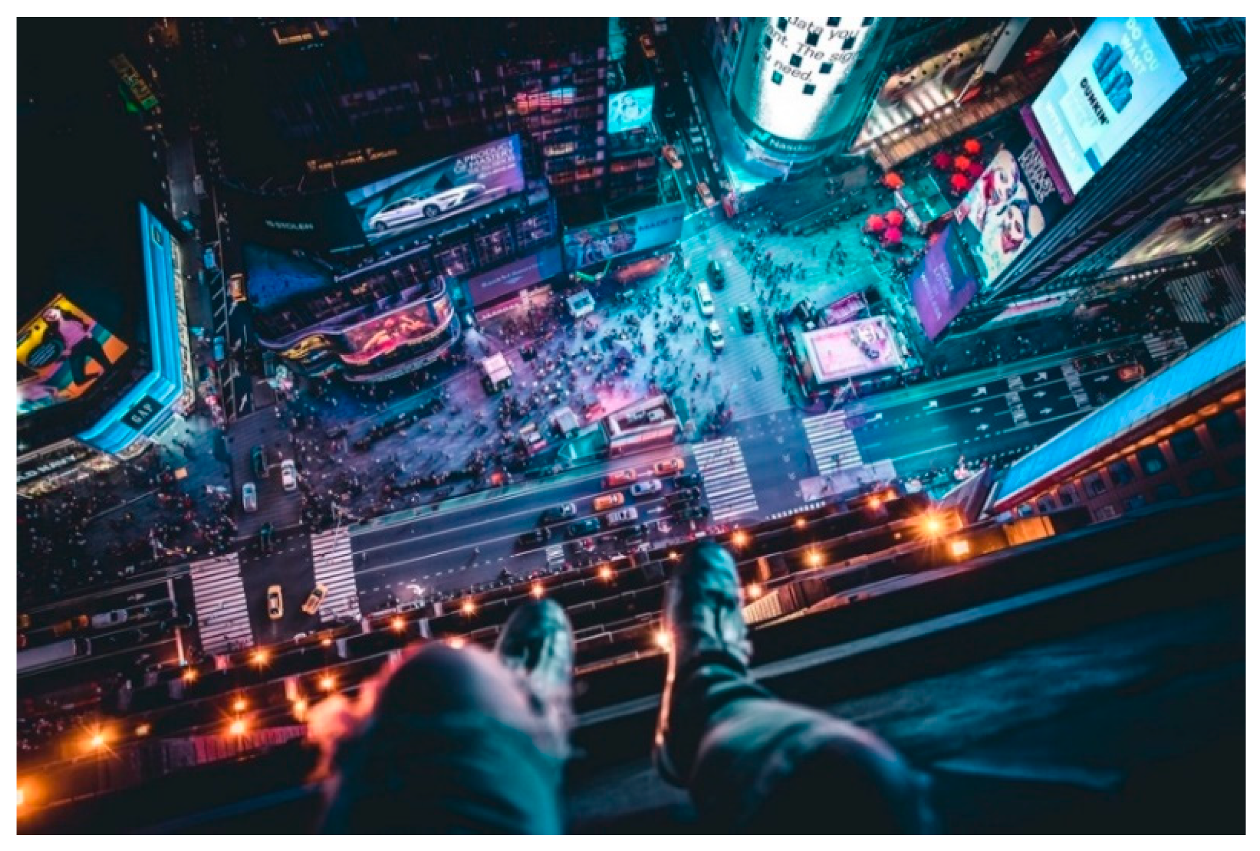
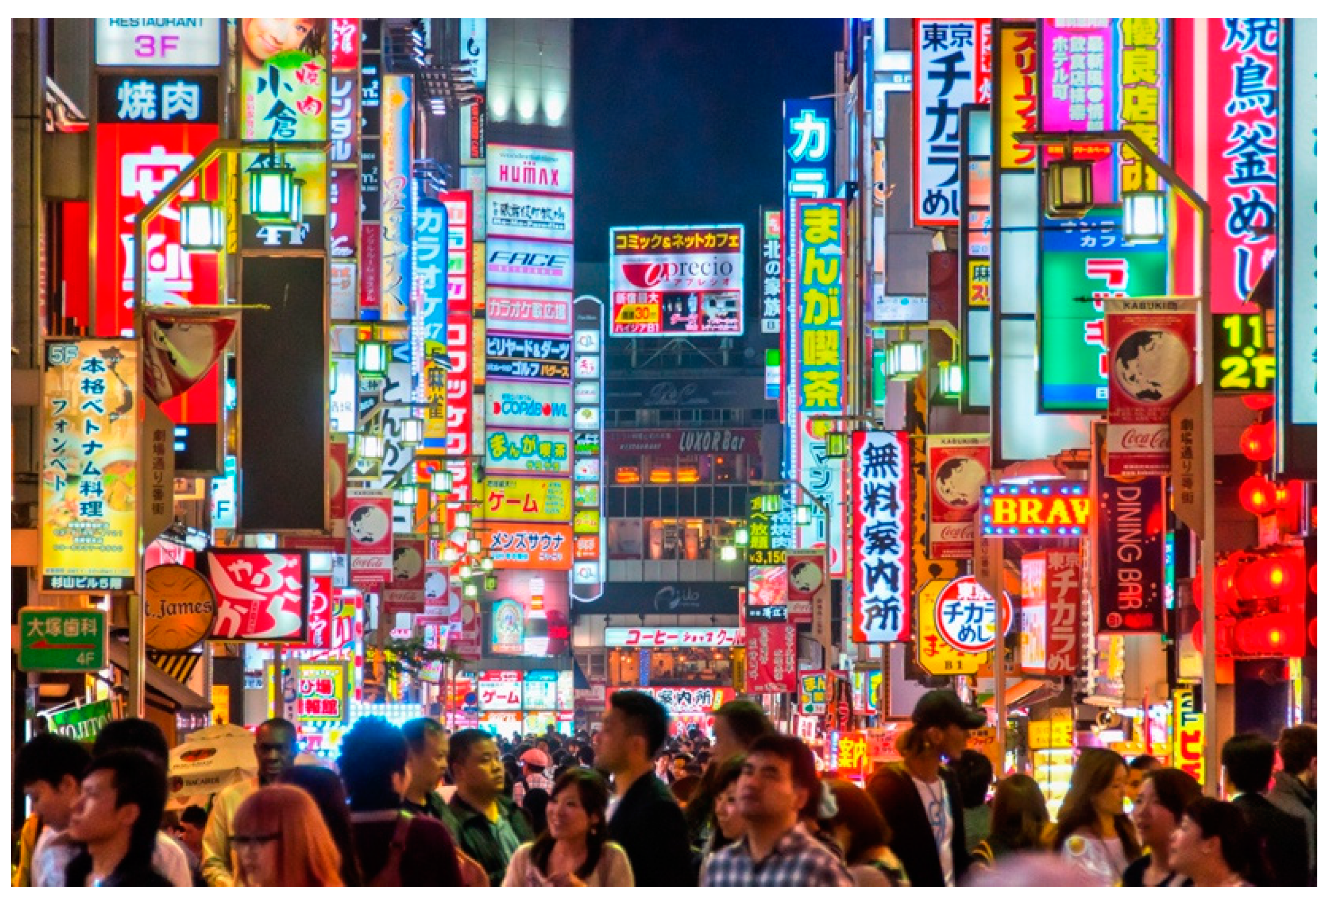
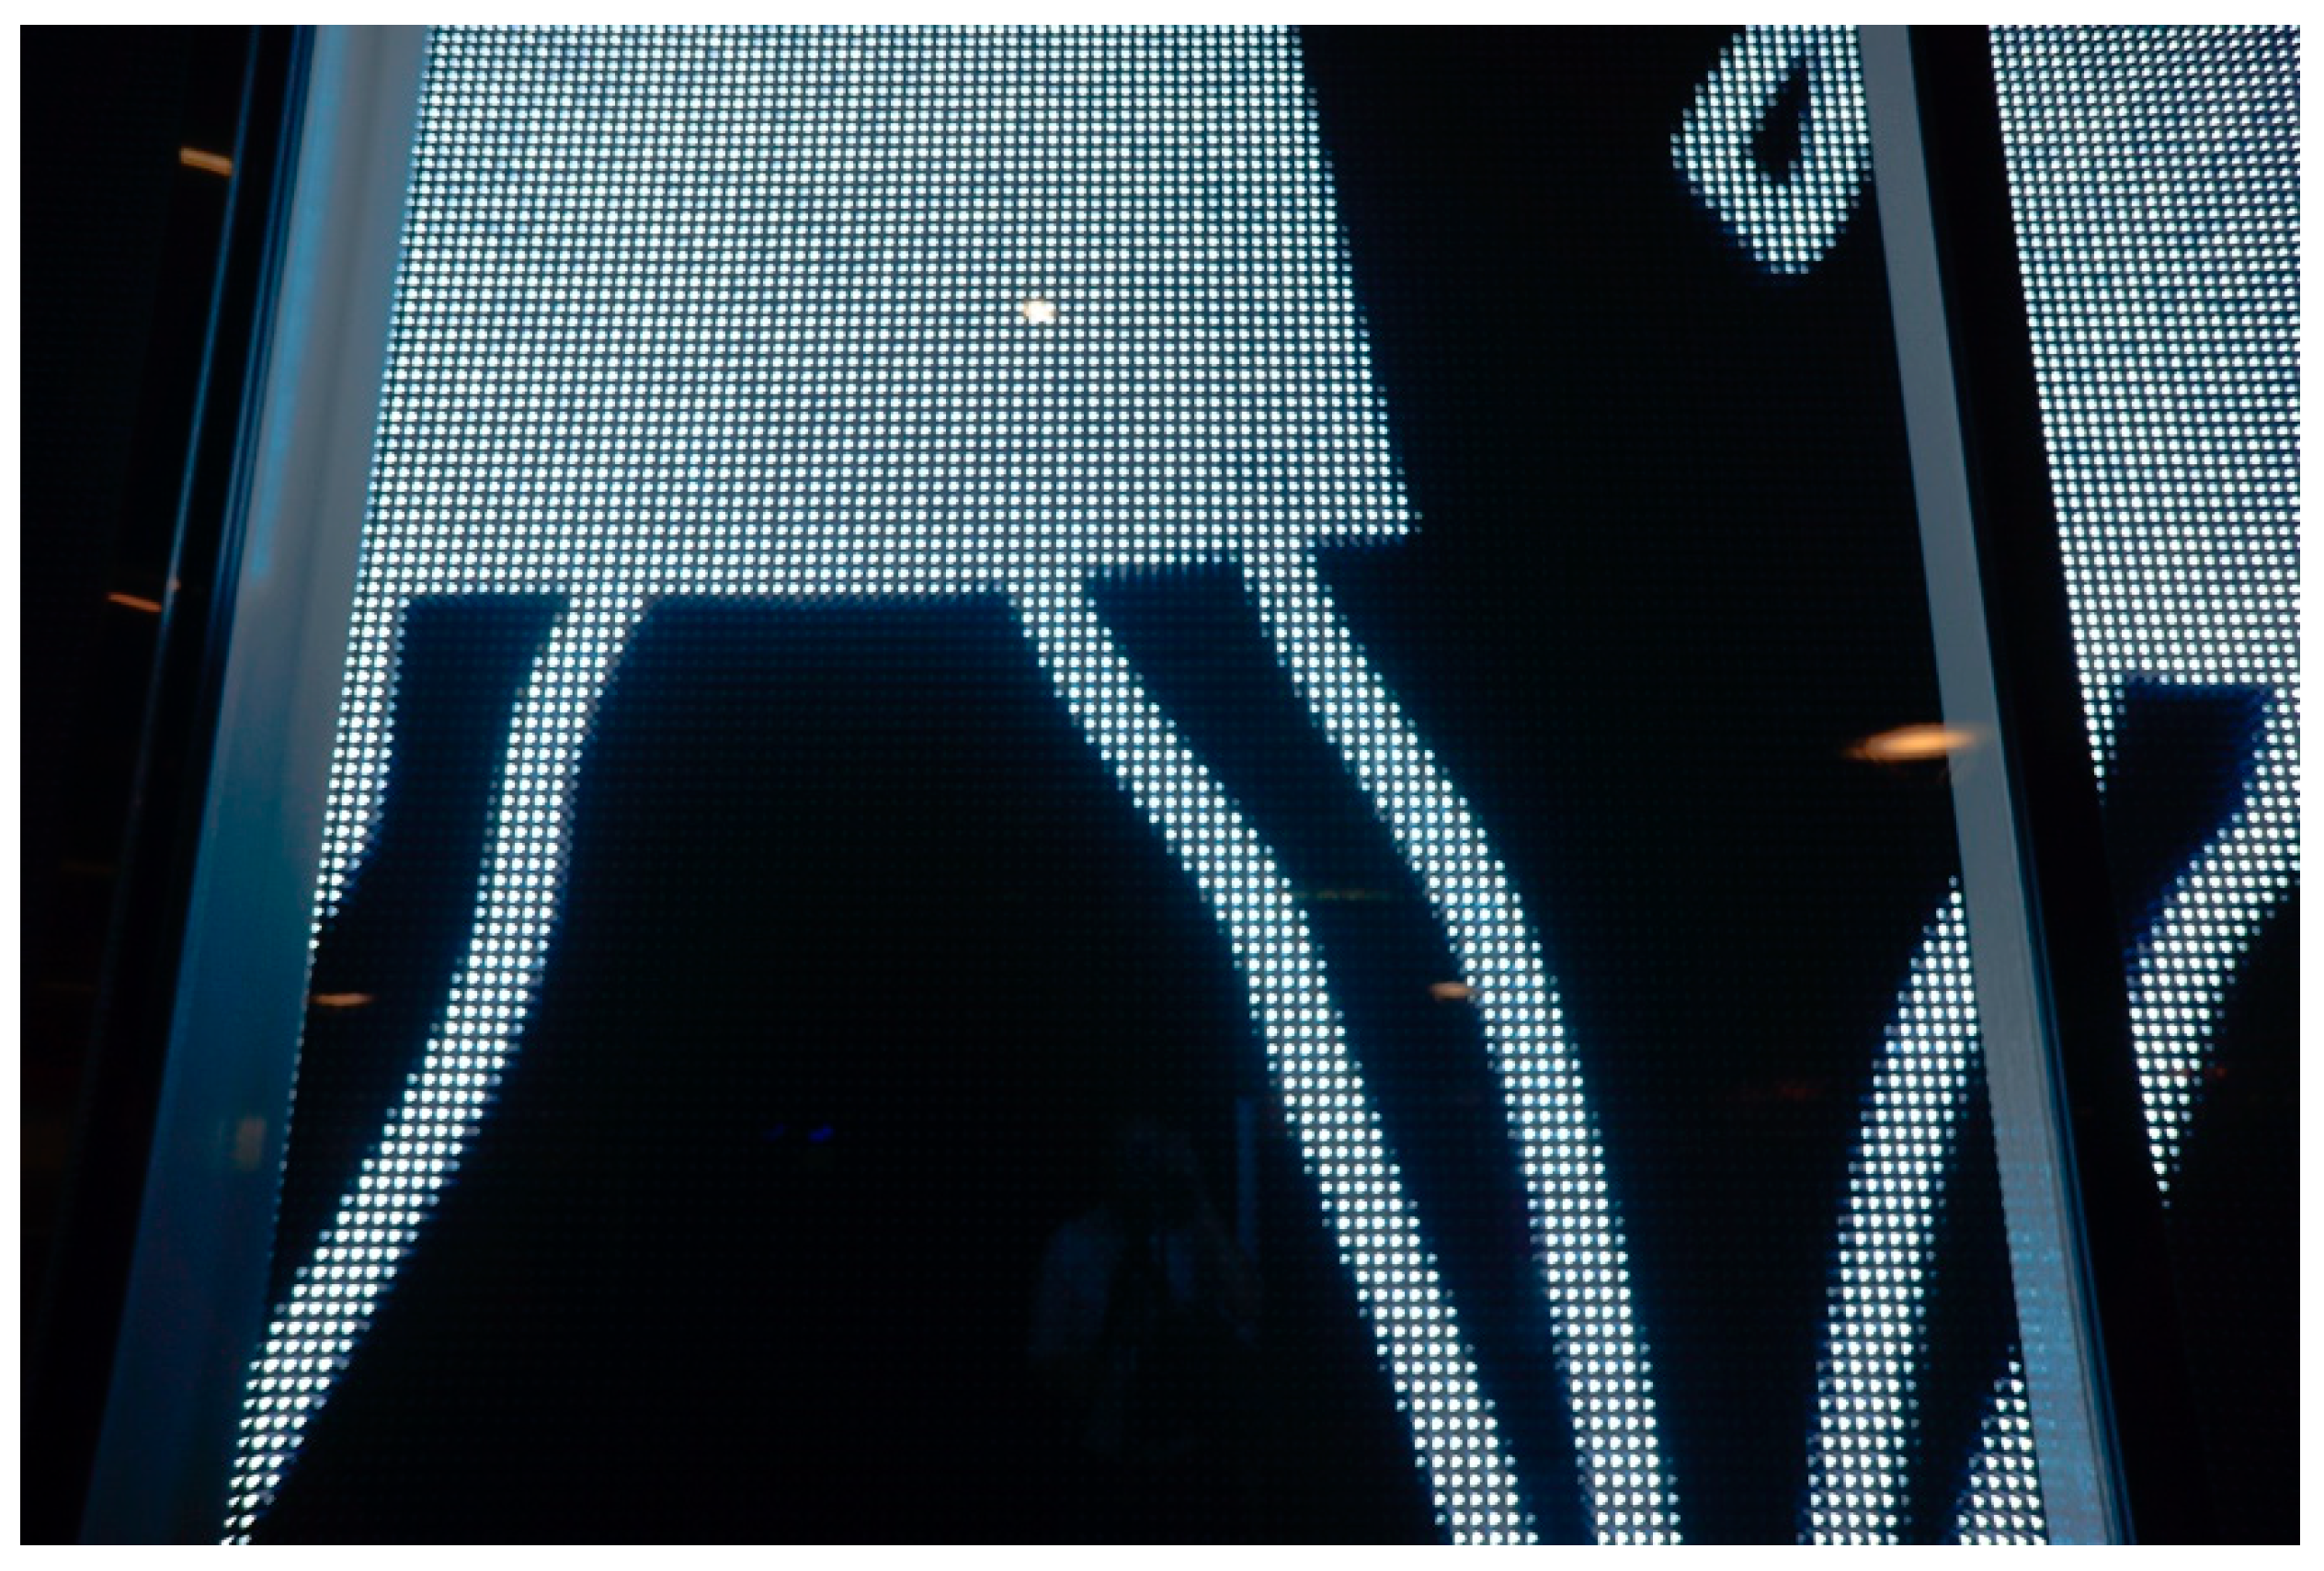
| Visual Light Clutter | Visual light clutter in the urban environment at night (Figure 3) is defined by the authors as the state in which too many items lead to a degradation of the performance of a visual task at night. This occurs when the human eye cannot rest, as it is constantly scanning, moving, and absorbing information from an environment with an excess of light sources, coupled with sudden changes in luminance levels and contrast. All of these factors can cause an extreme sense of chaos and disharmony in the urban realm. |
| Light Pollution | “…every form of artificial light in the wrong place at the wrong time which creates sky glow, glare, nuisance, and other relevant causes of environmental degradation including some properties of artificial light which emit non-environmentally friendly or inappropriate light” [40]. Typically, light pollution consists of four forms: sky glow, glare, over-lighting, and light trespass. |
| Environmental Zone | Light on Properties | Luminaire Intensity | Upward Light Ratio | Luminance | |||
|---|---|---|---|---|---|---|---|
| Ev (lx) | I (cd) | RUL (%) | Lb (cd/m2) | Ls (cd/m2) | |||
| Pre-Curfew | Post-Curfew | Pre-Curfew | Post-Curfew | Building Facade | Sign | ||
| E1 | 2 | 0 | 2500 | 0 | 0 | 0 | 50 |
| E2 | 5 | 1 | 7500 | 500 | 5 | 5 | 400 |
| E3 | 10 | 2 | 10,000 | 1000 | 15 | 10 | 800 |
| E4 | 25 | 5 | 25,000 | 2500 | 25 | 25 | 1000 |
| Lighting Zone | Nighttime | Daytime |
|---|---|---|
| LZ0 | 0 | 0 |
| LZ1 | 20 | 3500 |
| LZ2 | 40 | 3500 |
| LZ3 | 80 | 3500 |
| LZ4 | 160 | 3500 |
| Lighting Standard/ Guidelines | Year Published | Environmental Zone | Luminance at Night (cd/m2) | Curfew Times | |
|---|---|---|---|---|---|
| EN12464-2:2014 called Light and Lighting—Lighting of Work Places, Part 2: Outdoor Work Places | 2014 | E4 | 25 (Building facade) | 1000 (sign) | no |
| CIE 150: 2017, the Guide on the Limitation of the Effects of Obstructive Light from Outdoor Lighting Installations | 2017 | E4 | 25 (Building facade) | 1000 (sign) | yes |
| ILP’s Professional Lighting Guide (PLG 05): The Brightness of Illuminated Advertisement | 2014 | E4 | 600 (up to 10 m2 illuminated area) | 300 (over 10 m2 illuminated area) | no |
| ANSI/IES RP-39-19, Recommended Practice: Off-Roadway Sign Luminance | 2019 | LZ2 | 40 | no | |
| IDA’s Guidance for Electronic Message Centers (EMCs) | 2019 | LZ2 | 40 | yes | |
| Hypothesis | Subject Studied | Method |
|---|---|---|
| Hypothesis | Urban light pollution | Site-wide photographic survey (to identify over-lighting, light trespass, and discomfort glare impacting visual wellbeing) |
| A field measurement survey of nighttime visual luminance (Lv) to verify recommended levels | ||
| Comparison and evaluation of achieved results in relation to literature examples | ||
| Appropriate measuring tools | A field measurement survey of nighttime visual luminance (Lv) with a standard luminance meter | |
| Design standards and guidelines | Literature review (comparative and critical analysis of current research papers, standards, and technical legislation) |
| Category | Company | Model | No. of Items |
|---|---|---|---|
| Luminance Meter | Konica Minolta | LS-100 | 1 |
| Camera Photometer (Digital Reflex Camera for Luminance Photography) | Techno Team | LMK Mobile air | 1 |
| LMK LabSoft software | Techno Team | NA | 1 |
| Mobile Phone | Apple | Apple iPhone 5S Operating system iOS | 1 |
| Video Luminance Meter Mobile Phone Application (Figure 5) | Opticalight | Candela Smartphone App Version 4.2.1 | 1 |
| Photo Camera | Canon | Camera reflex Model CANON EOS D100D—DC 18-55 Manual settings (Aperture f/5.6, Shutter Speed 1/25s, ISO 400) | 1 |
| Location on Plan | Business Type/Name | Nighttime Photograph | Display Size | Lighting Control | Maximum/Minimum Vertical Luminance Values 1 (cd/m2) |
|---|---|---|---|---|---|
| 1 | Tobacco Shop | Broken Display | Broken Display | NA | Broken Display |
| 2 | Dosenbach Shoe Store |  | 160 cm × 300 cm | no | 375/15 |
| 160 cm × 300 cm | no | ||||
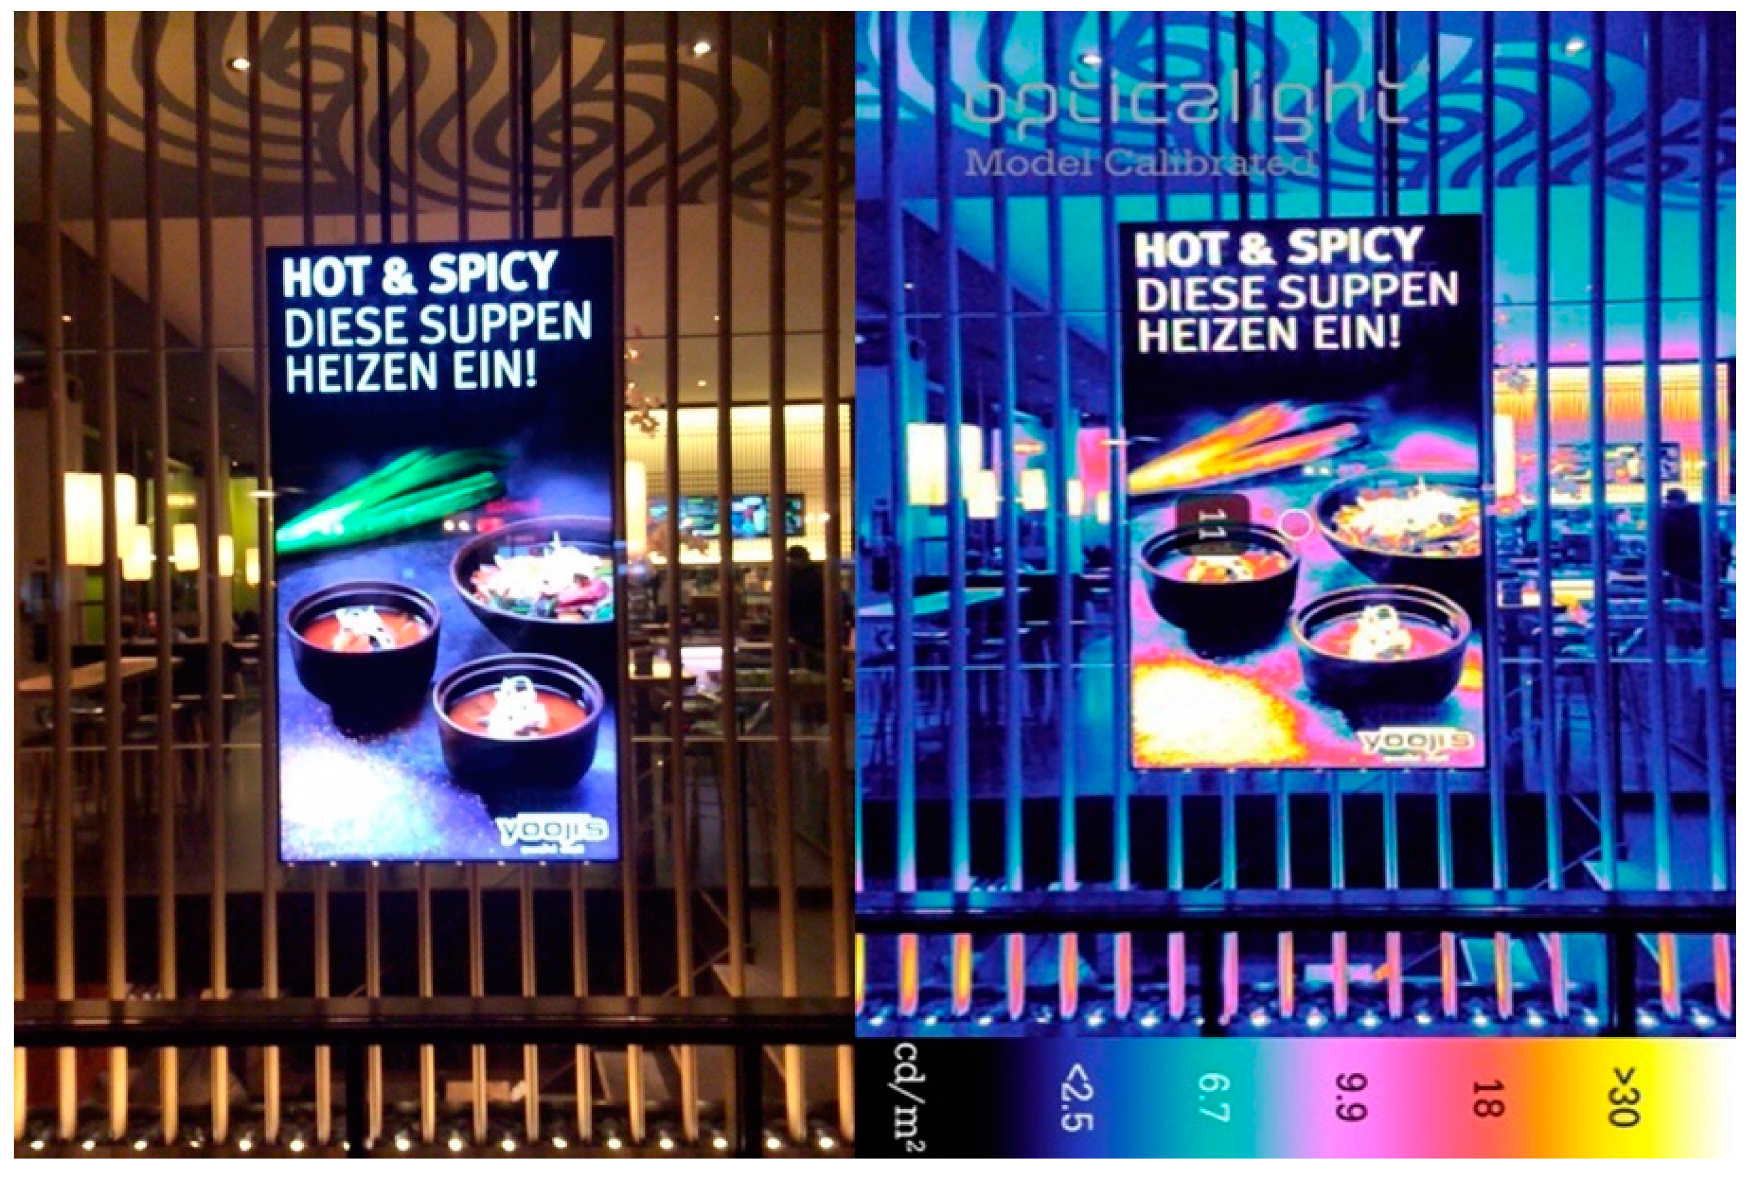
| 3 | Yooji’s Restaurant |  | 90 cm × 160 cm | no | 30/2 |
| 4 | Salt Mobile Device Store |  | 60 cm × 100 cm | no | 548/31 |
| 60 cm × 100 cm | no | ||||
| 5 | H&M Clothes Store | Broken Display | 200 cm × 250 cm | NA | Broken Display |
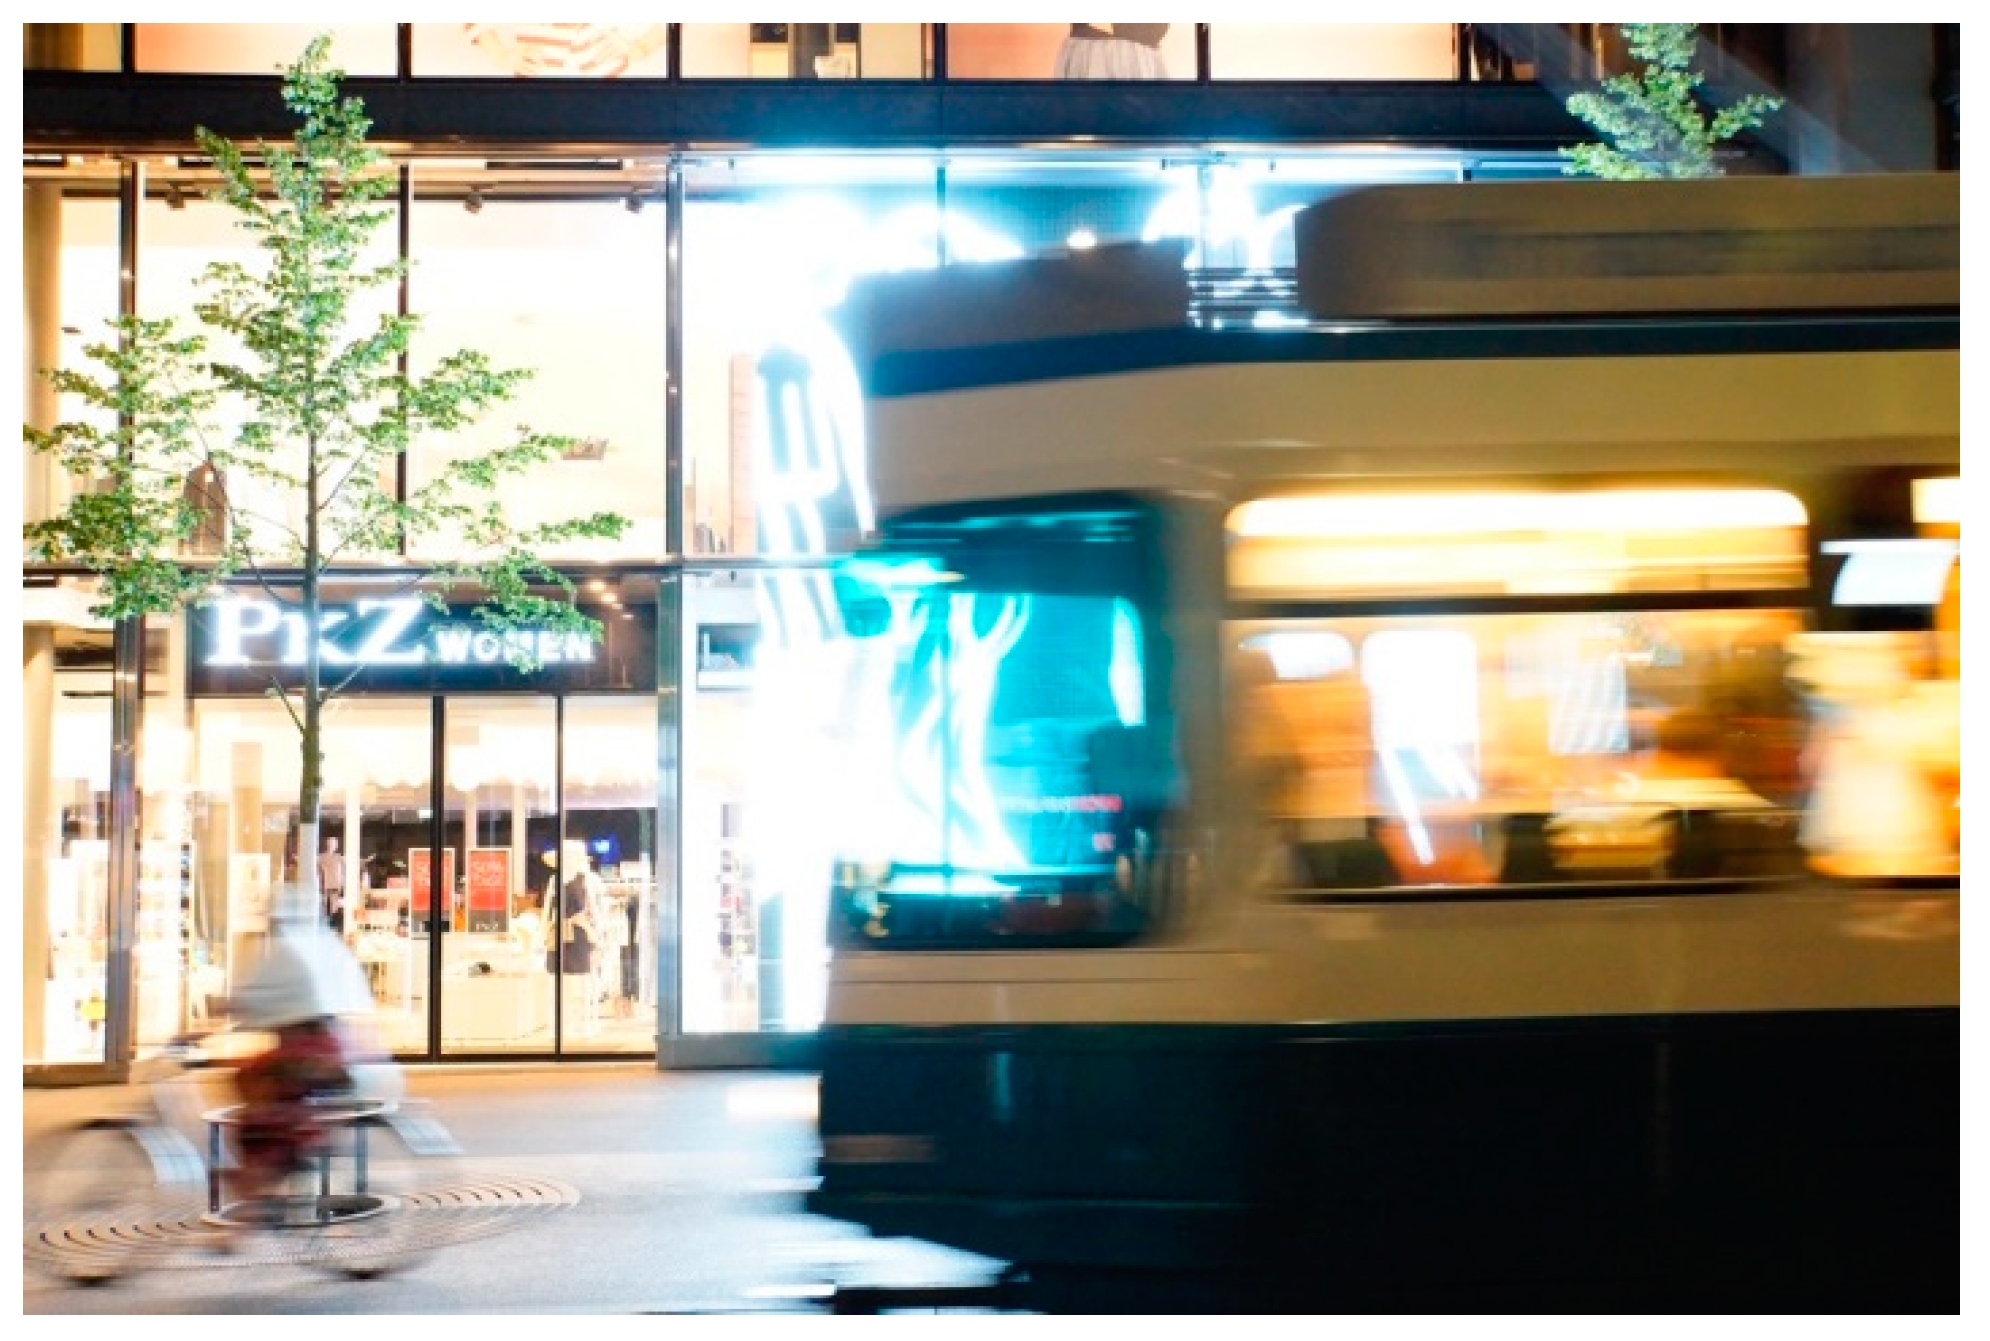
| 6a | PKZ Women Clothes Store |  | 720 cm × 720 cm | yes/no | 581/2 |
| 6b |  | 100 cm × 160 cm | 218/8 | ||
| 7 | Tally Weijl Clothes Store | Broken Display | 150 cm × 160 cm | NA | Broken Display |
| 8 | UBS Bank Branch |  | 80 cm × 160 cm | no | 465/20 |
| 80 cm × 160 cm | |||||
| 80 cm × 160 cm | |||||
| 9 | PKZ Men Clothes Store |  | 100 cm × 170 cm | no | 480/45 |
| 100 cm × 170 cm | |||||
| 10 | Grieder Clothes Store |  | 110 cm × 180 cm | no | 369/15 |
| 11 | Bachmann Bakery |  | 200 cm × 300 cm | no | 347/3 |
| 12 | Sunrise Mobile Device Store |  | 100 cm × 50 cm | no | 262/1 |
| 100 cm × 50 cm | |||||
| 100 cm × 50 cm | |||||
| 100 cm × 50 cm | |||||
| 13 | Beldona Lingerie and Sleepwear Store |  | 170 cm × 80 cm | no | 1353/20 |
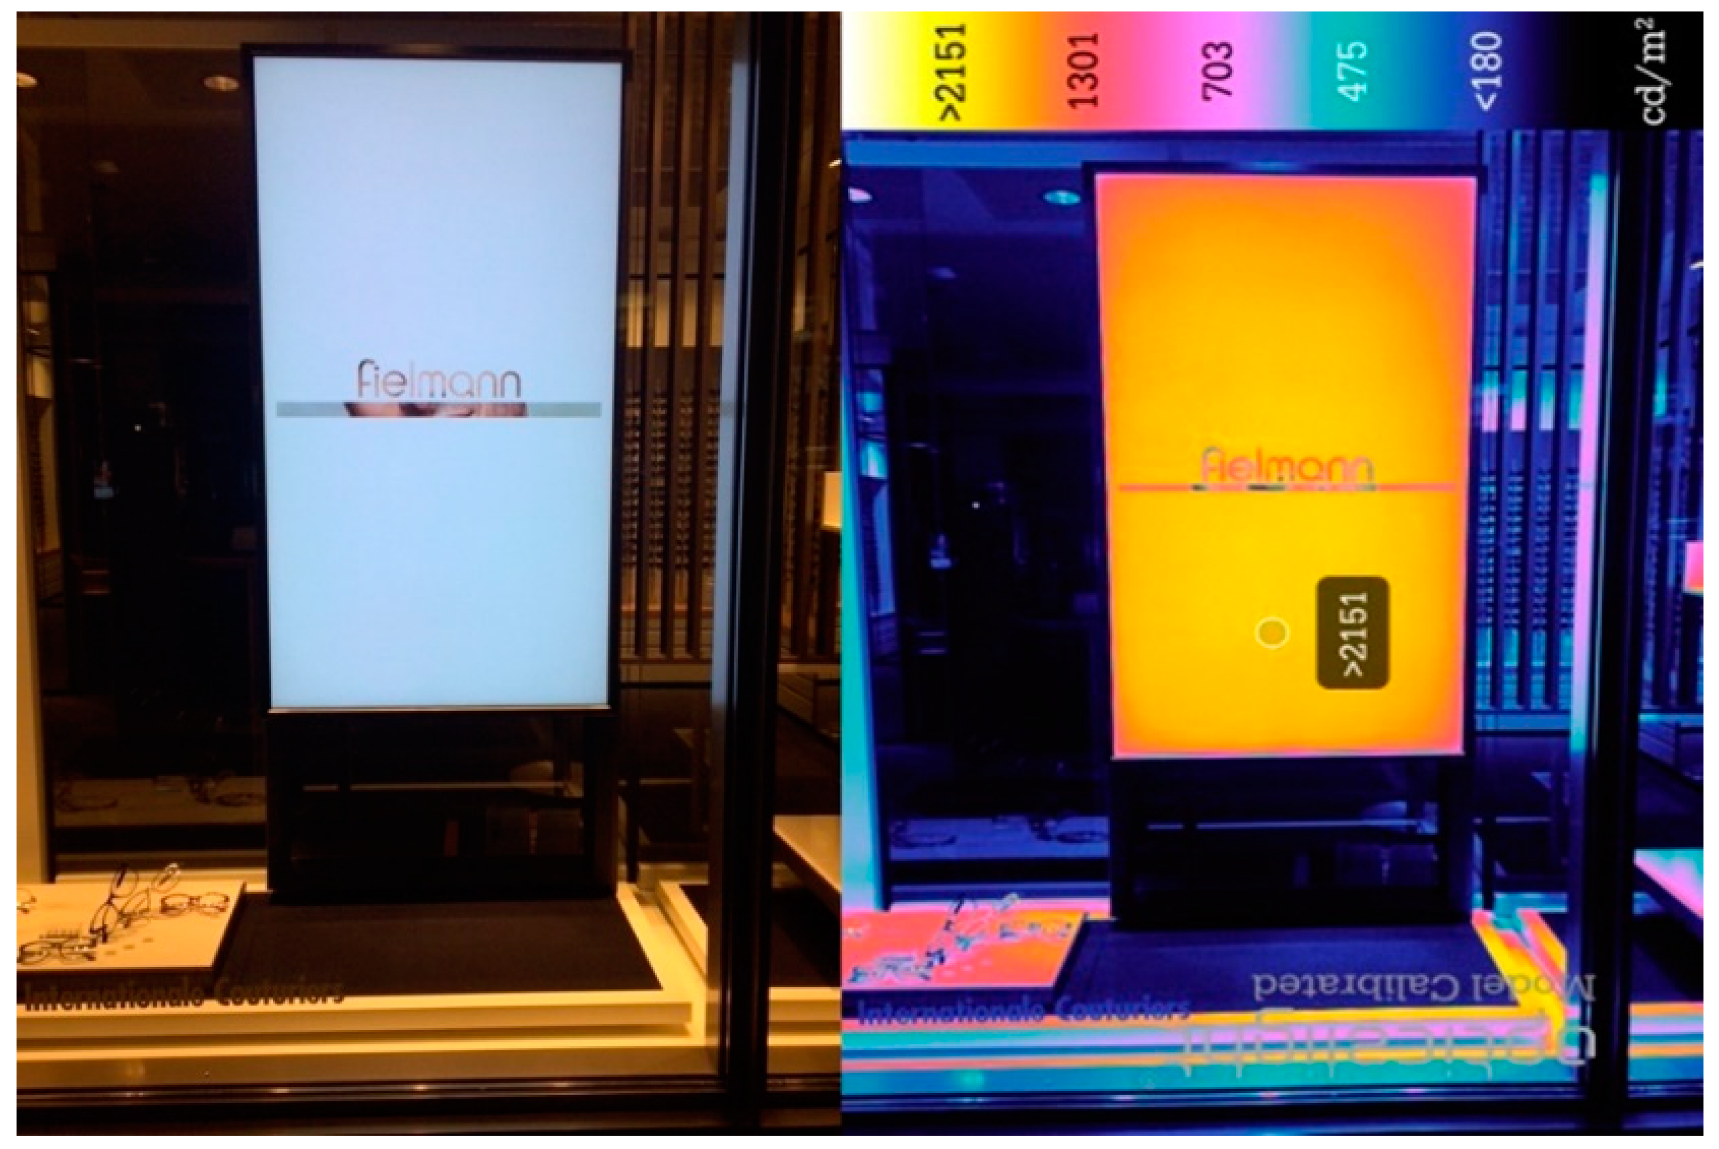
| 14 | Fielmann Eyewear Shop |  | 70 cm × 120 cm | no | 2151/12 |
| 15 | Ochsner Sport Sporting Goods Store |  | 100 cm × 170 cm | no | 195/15 |
| 16 | Manor Department Store | Broken Display | 90 cm × 50 cm | NA | Broken Display |
| 17 | Sunrise Mobile Device Store |  | 60 cm × 30 cm | no | 190/2 |
| 60 cm × 30 cm | |||||
| 60 cm × 30 cm | |||||
| 60 cm × 30 cm | |||||
| 18 | Visilab Zurich Eyewear Shop |  | 60 cm × 100 cm | no | 443/14 |
| 19 | UBS Bank Branch |  | 80 cm × 160 cm | no | 465/20 |
| 20 | Hugo Boss Clothes Store |  | 40 cm × 70 cm | no | 112/3 |
| 40 cm × 70 cm | |||||
| 40 cm × 70 cm | |||||
| 21 | Montblanc Boutique Store |  | 60 cm × 110 cm | no | 73/2 |
| 60 cm × 110 cm | |||||
| 22 | Beyer Clock and Watch Museum |  | 50 cm × 35 cm | no | 334/115 |
| 23 | Credit Suisse Bank Headquarter |  | 200 cm × 270 cm | no | 308/4 |
| 200 cm × 270 cm | |||||
| 200 cm × 270 cm | |||||
| 200 cm × 270 cm | |||||
| 200 cm × 270 cm | |||||
| 200 cm × 270 cm | |||||
| 200 cm × 270 cm | |||||
| 200 cm × 270 cm | |||||
| 200 cm × 270 cm | |||||
| 24 | USB Bank Headquarter |  | 160 cm × 80 cm | no | 221/8 |
| 160 cm × 80 cm | |||||
| 160 cm × 80 cm | |||||
| 160 cm × 80 cm | |||||
| 160 cm × 80 cm | |||||
| 160 cm × 80 cm | |||||
| 25 | Kochoptic Eyewear Shop |  | 70 cm × 120 cm | no | 60/3 |
| 70 cm × 120 cm | |||||
| 26 | Zuricher Kantonalbank Headquarter |  | 90 cm × 150 cm | no | 593/21 |
| 90 cm × 150 cm | |||||
| 27 | Buro Zuri Co-Working Space |  | 90 cm × 150 cm | no | 592/21 |
| 90 cm × 150 cm |
| Impact On | Proposal for Improvement |
|---|---|
| Human Health and Wellbeing (Residents/Building Occupiers, Visitors, Tourists) |
|
| Natural Environment |
|
| Traffic Situation/Transport System Users (Motorists, Cyclists, Pedestrians, etc.) |
|
| Step | Category | Description |
|---|---|---|
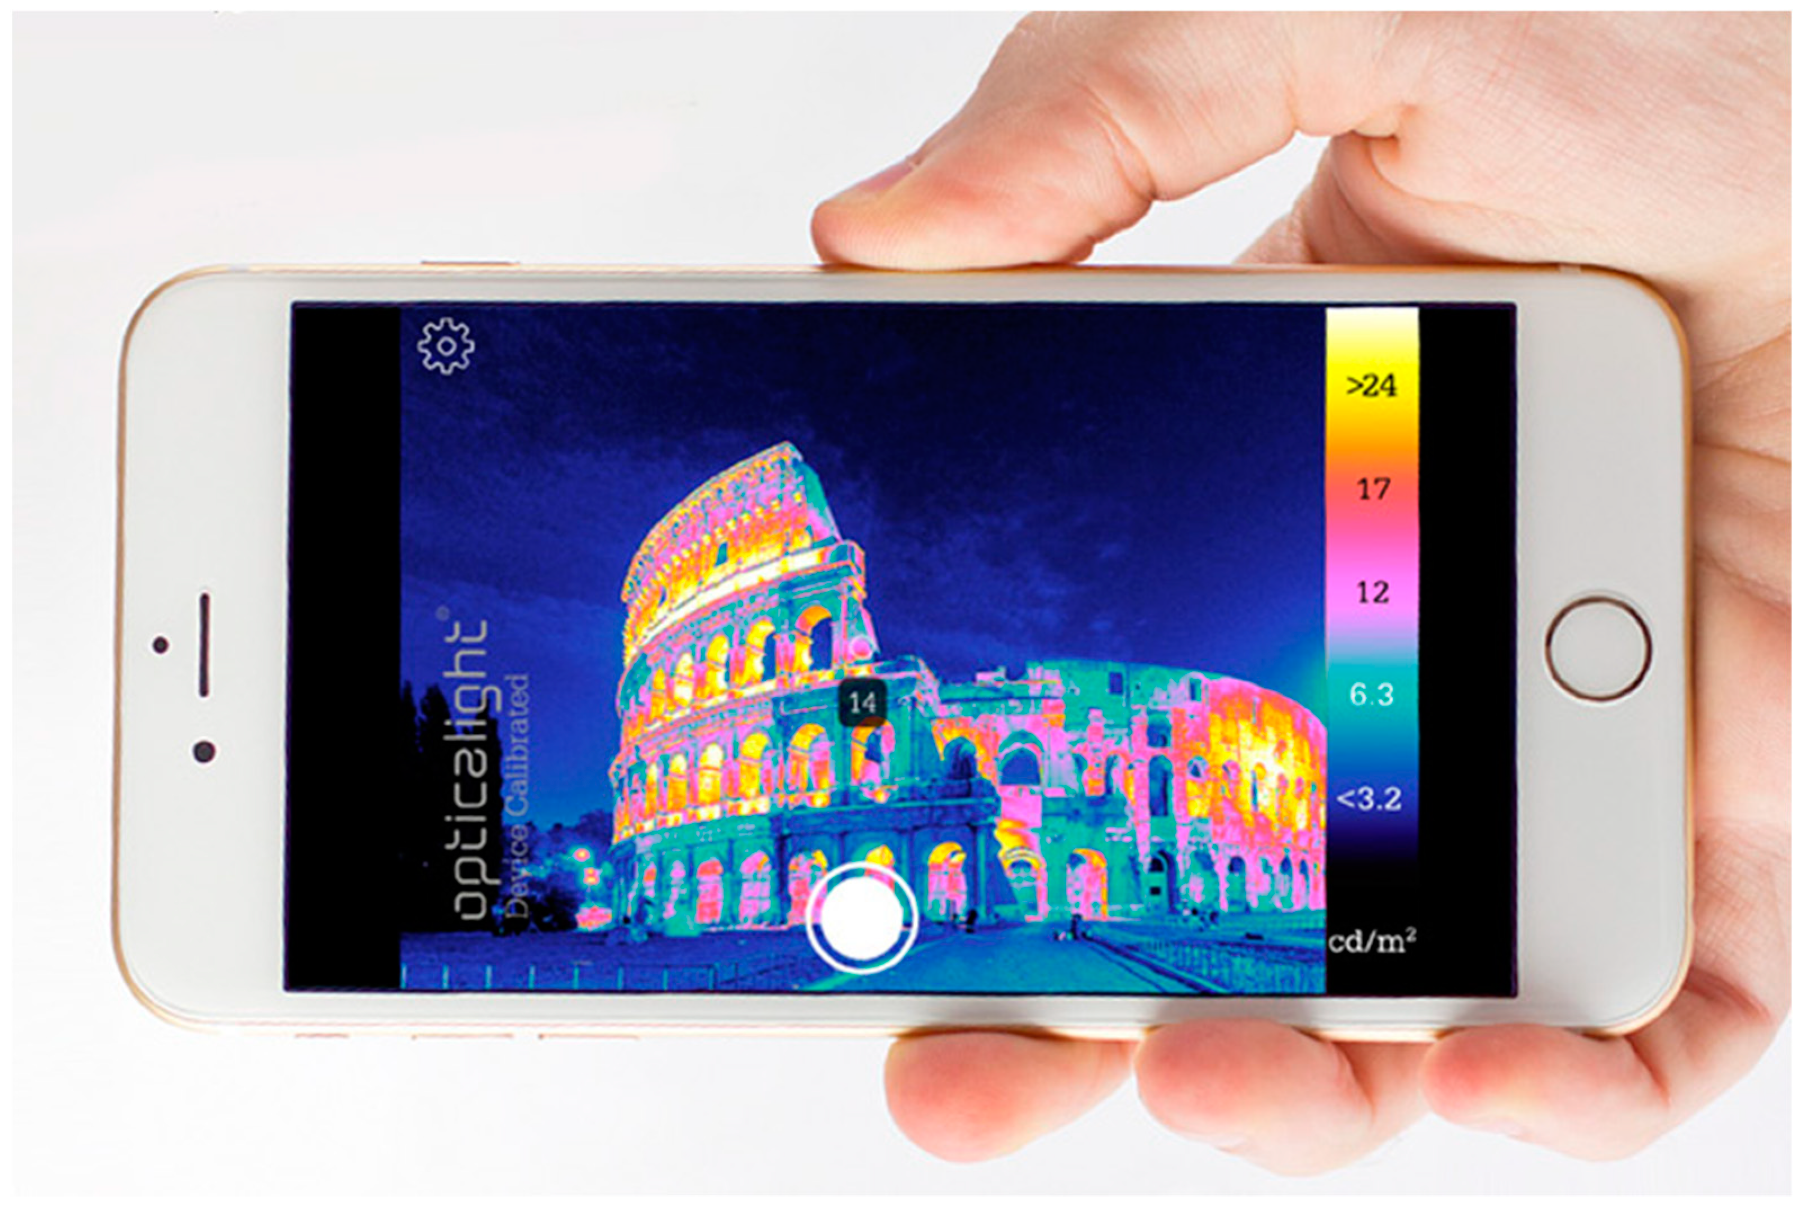
| Step 1 | Pre-Analysis with Candela Application | The authors propose the use of the Candela mobile phone application, (which operates on iOS devices such as iPhones and iPads) to help identify and evaluate possible exceeded luminance levels on site from non-static LED displays [63]. With the application, it is possible to record both surface and point measurements to determine the luminance outcome in cd/m2. The app will also display a 2D image in a false color rendering presentation with value ranges and definable color gradients. The app is calibrated for use at 10–1000 cd/m2, 3000 K with reliable precision. Accuracies of up to 10% are achieved depending on calibration status. By comparison, the human eye barely recognizes brightness differences when the light intensity is doubled. This makes the app a valuable tool for pre-analysis. It achieves sufficient accuracy as a design aid, but cannot be used for the verification of legally prescribed measured values. The application is free of charge and it can be relied on as a luminance meter on the go, for identifying any potential light nuisance. At least 5 individual measurements must be made and they need to be averaged. |
| Step 2 | Data Evaluation | After obtaining the luminance data, compare them with the allowed values. If they exceed them, move to step 3. |
| Step 3 | Gathering Measurements that Involve Municipality and Owners/Vendors | Contact your local municipality and request that the vendor/owner allow proper measurements to be taken of the non-static LED displays concerned. |
| Step 4 | Proper Analysis with Standard Luminance Meter | Perform the measurement by stopping the installation on a static image. The screen needs to be turned to the programmed night output white light (RGB) setting, and luminance values are to be measured with a standard luminance meter based on IDA recommendations [55]. For more information on the device and its calibration, refer to CIE ISO/CIE 19476:2014 Standard [64]. At least 5 individual measurements must be made and they need to be averaged. |
| Step 5 | Take Actions | Propose new values for luminance levels as well as the application of sensors and timeclock facilities to allow for changes in luminance levels according to the time of the day. Luminance measurements to be taken:
|
© 2019 by the authors. Licensee MDPI, Basel, Switzerland. This article is an open access article distributed under the terms and conditions of the Creative Commons Attribution (CC BY) license (http://creativecommons.org/licenses/by/4.0/).
Share and Cite
Zielinska-Dabkowska, K.M.; Xavia, K. Global Approaches to Reduce Light Pollution from Media Architecture and Non-Static, Self-Luminous LED Displays for Mixed-Use Urban Developments. Sustainability 2019, 11, 3446. https://doi.org/10.3390/su11123446
Zielinska-Dabkowska KM, Xavia K. Global Approaches to Reduce Light Pollution from Media Architecture and Non-Static, Self-Luminous LED Displays for Mixed-Use Urban Developments. Sustainability. 2019; 11(12):3446. https://doi.org/10.3390/su11123446
Chicago/Turabian StyleZielinska-Dabkowska, Karolina M., and Kyra Xavia. 2019. "Global Approaches to Reduce Light Pollution from Media Architecture and Non-Static, Self-Luminous LED Displays for Mixed-Use Urban Developments" Sustainability 11, no. 12: 3446. https://doi.org/10.3390/su11123446