Graph-Based Spatial Data Processing and Analysis for More Efficient Road Lighting Design


Department of Applied Computer Science, AGH University of Science and Technology, Al. Mickiewicza 30, 30-059 Kraków, Poland
*
Author to whom correspondence should be addressed.
Sustainability 2018, 10(11), 3850; https://doi.org/10.3390/su10113850
Submission received: 21 September 2018
/
Revised: 14 October 2018
/
Accepted: 16 October 2018
/
Published: 24 October 2018
(This article belongs to the Special Issue Sustainable Lighting and Energy Saving)
Abstract
:The efficiency and affordability of modern street lighting equipment are improving quickly, but systems used to manage and design lighting installations seem to lag behind. One of their problems is the lack of consistent methods to integrate all relevant data. Tools used to manage lighting infrastructure are not aware of the geographic characteristics of the lit areas, and photometric calculation software requires a lot of manual editing by the designer, who needs to assess the characteristics of roads, define the segments, and assign the lighting classes according to standards. In this paper, we propose a graph-based method to integrate geospatial data from various sources to support the process of data preparation for photometric calculations. The method uses graph transformations to define segments and assign lighting classes. A prototype system was developed to conduct experiments using real-world data. The proposed approach is compared to results obtained by professional designers in a case study; the method was also applied to several European cities to assess its efficiency. The obtained results are much more fine-grained than those yielded by the traditional approach; as a result, the lighting is more adequate, especially when used in conjunction with automated optimisation tools.
1. Introduction
With the ongoing improvement of lighting devices and light-emitting diode (LED) light sources, the potential to enhance the efficiency of lighting is becoming even greater. LED fixtures are more flexible than older high-pressure sodium (HPS) devices. They are available in various models, which include hundreds or thousands of variants offering different lighting intensities, optical modules, light distributions, and correlated colour temperatures. This allows fixtures to be precisely matched to fulfil virtually any lighting class on a road of any shape and layout.
Likewise, lighting standards and guidelines, such as the European EN 13201:2014 standard [1,2,3,4,5], define a wide spectrum of lighting classes to let the designers address the actual real-world requirements as accurately as possible.
However, existing IT systems, whose role is to manage existing lighting infrastructures or design new installations, tend to focus on the devices themselves (i.e., what provides light), while simplifying the data concerning the illuminated areas (i.e., what is being lit).
This forces designers to assume simplifications, thus reducing their workload, but also sacrificing the efficiency of the resulting lighting setup. For instance, two similar street sections are treated as one design task, even though they may differ with regard to certain nuances, such as the road width or lamp pole spacing.
Another factor contributing to this situation is that photometric calculation tools are based on the principle of letting the designer adjust the parameters manually in the GUI, and then verifying whether the norm requirements are fulfilled. This impedes their application in batch mode, making the design process more time-consuming as the precision of the input data increases.
As a result, calculations are performed on rather long road segments, where parameters like lamp spacing are averaged, even if they vary in reality.
A significant amount of research and development work is currently aimed at automating the process of photometric optimisation, as discussed in Section 3. However, any algorithm is only as good as the data it receives as input. In a perfect world, all the data necessary for photometric calculations—the road layout, the assigned lighting classes, the locations of poles, and fixture parameters—will be readily available. Unfortunately, in practice, the data is often incomplete, too general, aggregated (e.g., only the total number of lamps per street is known) or scattered across multiple datasets.
Therefore, in this paper, we propose a new class of IT systems, able to collect, combine, and process data regarding a certain lighting project and the area in which it is located. It can benefit management and evaluation of existing lighting infrastructures, it may aid the development of a city’s lighting master plan, but it can also be used to prepare input data for precise photometric calculations.
However, such data may come from numerous sources, such as maps, geodetic datasets, audit results, or even unstructured notes. Practice shows that these sets vary from city to city and from project to project. Integration of that data is a difficult task both regarding the actual processing, and the actual definition of the process for every project. Therefore, for such a system to be feasible in the real world, it must both allow for flexible processing of input data and provide a convenient user interface to support the process and perform operations which cannot (yet) be automated.
The remaining part of the article is organised as follows. Section 2 presents the current situation of lighting standards and provides a real-life view of problems faced by lighting designers. Section 3 provides an overview of the process of lighting design and research related to the topic of the paper. It is followed by Section 4, which defines the formal foundations of the proposed method and the system that supports it. Section 5 proposes a solution utilising this method and compares it to the process normally executed by a human designer. Results obtained using the proposed method are presented in Section 6: An example lighting modernisation project in Kraków, Poland is used to illustrate the differences between the outcome of the traditional approach and the proposed, automated method. Finally, Section 7 describes the directions of current research, and Section 8 summarises the paper.
2. Motivation
As mentioned in Section 1, current lighting standards encourage precise diversification of lighting parameters in various illuminated areas, also called lighting segments. Smaller granulation of such segments, along with precise representation of their shape, benefits the power efficiency of lighting installations [6] as well as the comfort of their users, reducing negative effects such as light pollution [7,8].
Moreover, these general guidelines are often accompanied by more specific local regulations. One notable example is the approach to illuminating pedestrian crossings. Due to the fact that this matter is not directly regulated by the CEN (European Committee for Standardization) 13201 standard, many countries have developed their own regulations. Such regulations have been published in Belgium [9,10], Czech Republic [11], Germany [12], Italy [13], Norway [14], Poland [15], Sweden [16,17], Switzerland [18], and the U.K. [19].
Although these regulations differ in some details, they share many similarities, such as the need to alter lighting levels for the area of the crossing itself as well as for transition zones aimed at avoiding sudden changes in light intensity for the drivers.
This greatly increases the complexity both for lighting designers and for city authorities or engineers trying to improve the management of lighting infrastructure. Analysis of road shapes and parameters performed by hand becomes infeasible. An attempt to take a global look at the infrastructure adds the problem of scale. Without proper tools, it is very possible for various designers to interpret certain situations differently, and therefore assign different lighting classes to identical road segments.
Practical experience in real-life lighting retrofit projects has shown that the only way of assuring consistency and high quality is by integrating georeferenced and inventory data in a semantically-coherent system. Some examples of such datasets include:
- road maps, which provide vital information about road connections, their categories and traffic parameters, but lack the actual shape of roads, pavements, etc.,
- geodetic/CAD maps, which contain very precise data regarding the shapes of objects (e.g., road kerbs), but do not usually add semantic meaning to them (e.g., there is no “street” object, only the area between the kerbs),
- utility infrastructure data, which includes information about power lines (which can be used to estimate the location of lamp poles) as well as gas or water lines (which are useful when placing newly-installed lamps),
- sensor data archives, which may provide vital information about traffic intensity—a crucial parameter for lighting class selection—but do not actually link it to streets; also, vehicle flow simulation may be required to estimate such data for places with no sensors,
- infrastructure inventory data, which provides information about lamp types and pole/arm geometries and may include geographic locations of lamps, but often only contains aggregate data about lamps illuminating a given street.
Often, the only common denominator of these datasets is that all objects are tagged with geographic locations, which can be transformed to a common spatial reference system, such as WGS-84 [20]. Therefore, the process of integrating these sets is complex and varies with every single location and lighting project. The data may lack the necessary coverage or values, an issue further described in Section 7.
3. State of the Art
To present the proposed methods in context, it is necessary to provide an overview of the design process itself and to introduce research relevant to the scope of the paper.
3.1. The Process of Lighting Design
The general workflow of a lighting modernisation project typically involves the following steps:
- analysing the project area street by streets,
- defining the lighting segments’ characteristics, including:
- lighting requirements, e.g., the lighting class,
- geometric/geographic parameters, e.g., road width, lamp spacing, etc.
- determining the desired lamp configuration,
- performing the photometric calculations,
- altering the configuration if the requirements are not met.
Traditionally, when preparing a lighting project, a human designer is responsible for the entire workflow. However, this manual approach has several drawbacks. Firstly, the process is time-consuming and does not scale well for large-area projects. Selection is partly subject to the designers’ intuition, which means the rules may be inconsistent.
Even more importantly, industry-standard tools like DIALux (https://www.dial.de/en/dialux/) or Ulysse (https://www.schreder.com) require the designer to set the parameters for each street individually and manually. To avoid being overwhelmed with thousands of configurations, designers tend to relax the similarity criteria, thus reducing the number of situations which need to be optimised.
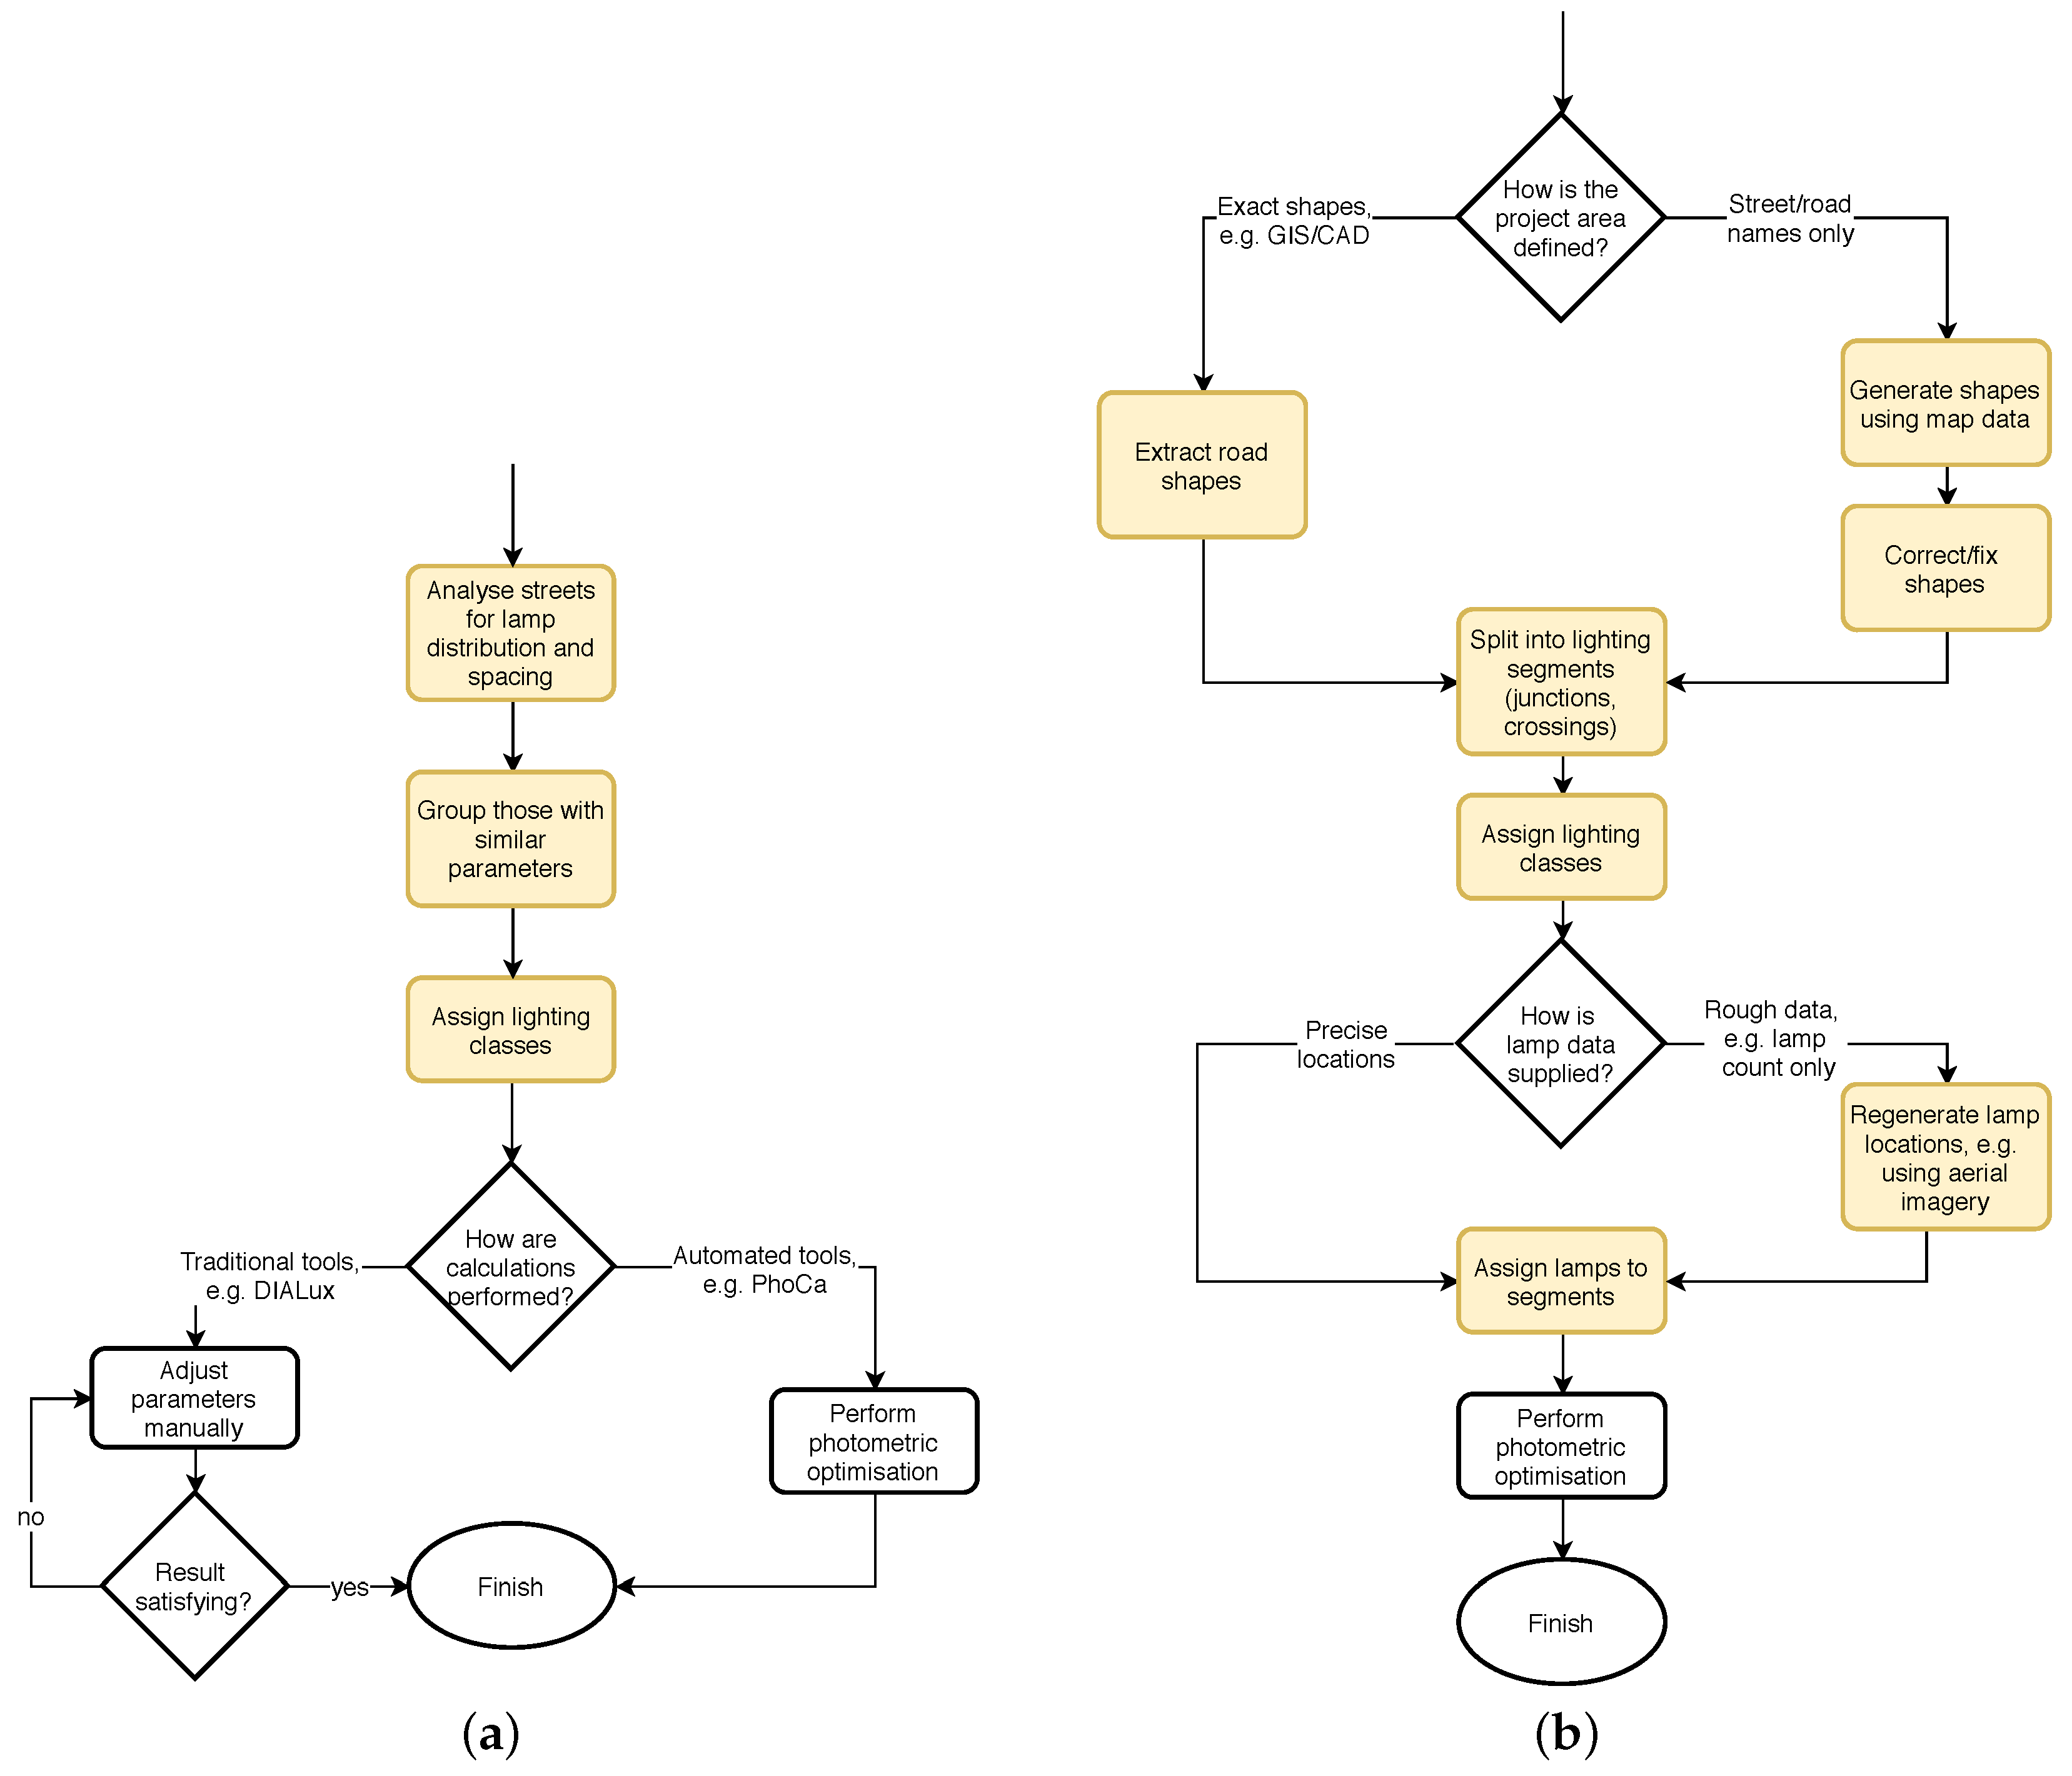
The outline of this process is presented in Figure 1a. One may argue that the traditional approach is in fact simplified. One benefit of this approach is that the input data does not need to be absolutely precise (e.g., average lamp distances can be used instead of actual lamp locations), as it is subjected to aggregation anyway. However, the simplifications may increase the risk of violating the norm requirements or the installation being suboptimal with regard to power consumption.
Research has shown that using exact data can reduce power consumption by 10–15% [21]. This problem may be solved by performing the calculations in a precise manner, using tools like gCalc (http://www.gradis.pl). Instead of relying on average, aggregated values, they use the exact shapes of roads and lamp locations to perform precise calculations. Since the input data to be more precise, as presented in Figure 1b, manual preparation of the data is almost impossible.
The steps marked in yellow in Figure 1 can be supported by the proposed tool. For the ‘simplified’ approach, data preparation is within reach of human designers. In this case, the benefits are visible mostly when used with an automated optimisation tool.
However, for the ‘precise’ approach, which requires exact data, the proposed tool actually enables precise photometric calculation solutions to be used in practical, real-life projects.
3.2. Related Research
Road and street lighting is a broad field, which is closely related to many other areas, including physics, power and energy, architecture, urban design and development, computer science and information technology.
One area which is very closely bound to the proposed work is the field of design optimisation by means of photometric calculations. This process is responsible for selecting the appropriate fixture models and variants for each light point and determining the optimal values for parameters such as the lumen flux ratio (LFR) and the geometry of the pole (height), arm (length, azimuth, mounting height), and the way the fixture is mounted (rotation, inclination). Recent research in this field tries to replace the aforementioned, mundane process executed by the designer with automated tools. Proposed solutions include using previously performed calculations to assess the relationships between parameters [22], the use of informed local optimisation methods such as evolutionary algorithms [23] and graph-based methods [24].
A field less directly related, but very important for the entire process and the efficiency of its results, is the design of fixtures themselves. It includes the improvement of light sources, constantly increasing the lumen-per-watt ratio, as well as tuning of luminaire construction, including models dedicated to certain applications, such as walkway lighting [25]. While the fixture characteristics are beyond the scope of the proposed systems, they are crucial for photometric calculation tools, which typically use data from files in the LDT or IES formats.
Another important aspect of improving the efficiency of lighting is related to dynamic alteration of the fixture power of the fixtures in time. The easiest solution is defining a schedule for lamp dimming using statistical or observed characteristics of the lit areas [26]. However, this approach may not guarantee compliance with norms in areas with varying or unpredictable parameters such as traffic intensity. Therefore, approaches based on real-time, sensor-based control are being developed [27,28]. The development of control scenarios is not directly related to the presented research; however, the proposed approach can easily accommodate additional statistical data and support this process by analysing all possible lighting classes to be assigned to each street.
4. Methods
Bringing the data originating from various sources to a coherent state requires very complex operations to be executed on the dataset. In order to maintain the deterministic character of this process while providing enough flexibility for various projects, a formal model must be defined together with the necessary transformations.
While it may be technologically tempting to express these procedures as scripts or SQL procedures, such hard-coded approach may require a significant amount of software developer work to be performed for every individual project. This may make the entire process infeasible and, perhaps more importantly, could cause errors which are hard to detect and validate.
4.1. The Semantic Environment Graph
To mitigate the aforementioned problems, we propose a coherent graph structure to maintain all data about the area designated for a lighting infrastructure modernisation (or construction) project. The structure is called a Semantic Environment Graph, abbreviated as SEG. Let us present the important aspects of SEG definitions. (The Subscript in SEG graph means that it is generated by the grammar, defined in more detail in Section 4.3.)
Definition 1.
SEG is defined as an attributed graph over the set of node labels and the set of edge labels such as:
where:
- is the set of nodes,
- is the set of edges,
- is the node labelling function,
- is the edge labelling function,
- is the set of node labels, where:
- -
- T represents streets,
- -
- S represents road lighting segments located on streets,
- -
- F represents freeform lighting segments, which are not located on streets (e.g., to represent a parking lot),
- -
- P represents pedestrian crossings, located on road segments,
- -
- O represents other objects, such as buildings, points of interest, etc.
- is the set of edge labels, where:
- -
- denotes that a point object (e.g., pedestrian crossing) is located at a given line object (e.g., road segment),
- -
- denotes that a line object is part of another line object,
- -
- denotes that there is a spatial relationship between two objects,
- -
- denotes that an object is equivalent to another object.
- is a node attributing function, such that for is a value of the attribute a,
- is an edge attributing function, such that for is a value of the attribute a,
- is the set of node attributes, where:
- -
- denotes the type of an object (e.g., the type of building for O nodes),
- -
- denotes the shape of an object and its geographic location; this can be expressed e.g., as a Well-Known Text (WKT) string,
- -
- is the name of an object, e.g., the street name or segment label,
- -
- is the lighting class assigned to a road or freeform segment,
- is the set of edge attributes, where:
- -
- denotes the metre within a line object on which a given point is located,
- -
- and mark the metres within a line object where another line object begins and ends,
- -
- denotes the distance (in metres) between two objects,
- -
- (yes, no) indicates that two objects spatially intersect.
It is important to stress that this initial set of labels and attributes can be freely extended as new operations are defined or new types of input data are encountered.
Also, the graph follows the “keep all data” principle, as some information (e.g., the type of a public building, such as a school or church) may prove useful even if it is not being used by any transformations at the moment (e.g., the city may wish to increase the lighting class in vicinity of such buildings). This justifies the presence of nodes labeled O, as described in Definition 1.
4.2. The Dual Nature of Geographic Data
A distinguishing characteristic of this approach, compared to traditional graph processing, comes from the fact that most elements of the graph represent geographic objects. Hence, a large part of the labels are semantic representations of geometric relationships.
Therefore, the data (as viewed by the proposed system) has a dual nature: It is spatial, as all elements are georeferenced, but it is also semantic, with a large part of semantic annotations coming from spatial analysis.
A spatially-enabled tool, such as PostGIS [29], is required to perform the geometric analytics and introduce the appropriate semantic edges and labels into the graph. These tools also allow for conversion between spheroidal and Cartesian reference systems, which make it feasible to define spatial operations using graph transformations, using metres (and simple arithmetics), instead of degrees. Therefore, a spatial analysis tool is, alongside a graph processing engine, another crucial element when it comes to practical implementation of the presented approach.
4.3. Graph Generation Using a Formal Grammar
The correctness of the proper graph generation is ensured by the graph transformation rules defined in a graph grammar. Such a grammar is defined as follows.
Definition 2.
A graph grammar Ω is a tuple:
where:
- is the set of node labels,
- , is the set of terminal node labels,
- is the set of edge labels,
- is the set of transformation rules,
- is the starting graph,
- is the validation graph grammar condition, that verifies the current state of the graph.
We use as the validation graph grammar condition, because sometimes it is necessary to execute a sequence of transformations and some of the intermediate states may be an incorrect graph—for example, the graph may have non-terminal nodes.
is a transformation rule that transform one graph onto the second one. is denoted as a set of two graphs, and . For a given graph G application of the transformation rule is defined as follows:
- the graph is removed from G creating ;
- the graph is added to (but at this moment these graphs are separated);
- all edges in G that contain one of the nodes belonging to and the second to are restored in ;
- all edges in G that contains removed nodes () are removed.
4.4. A Practical Example
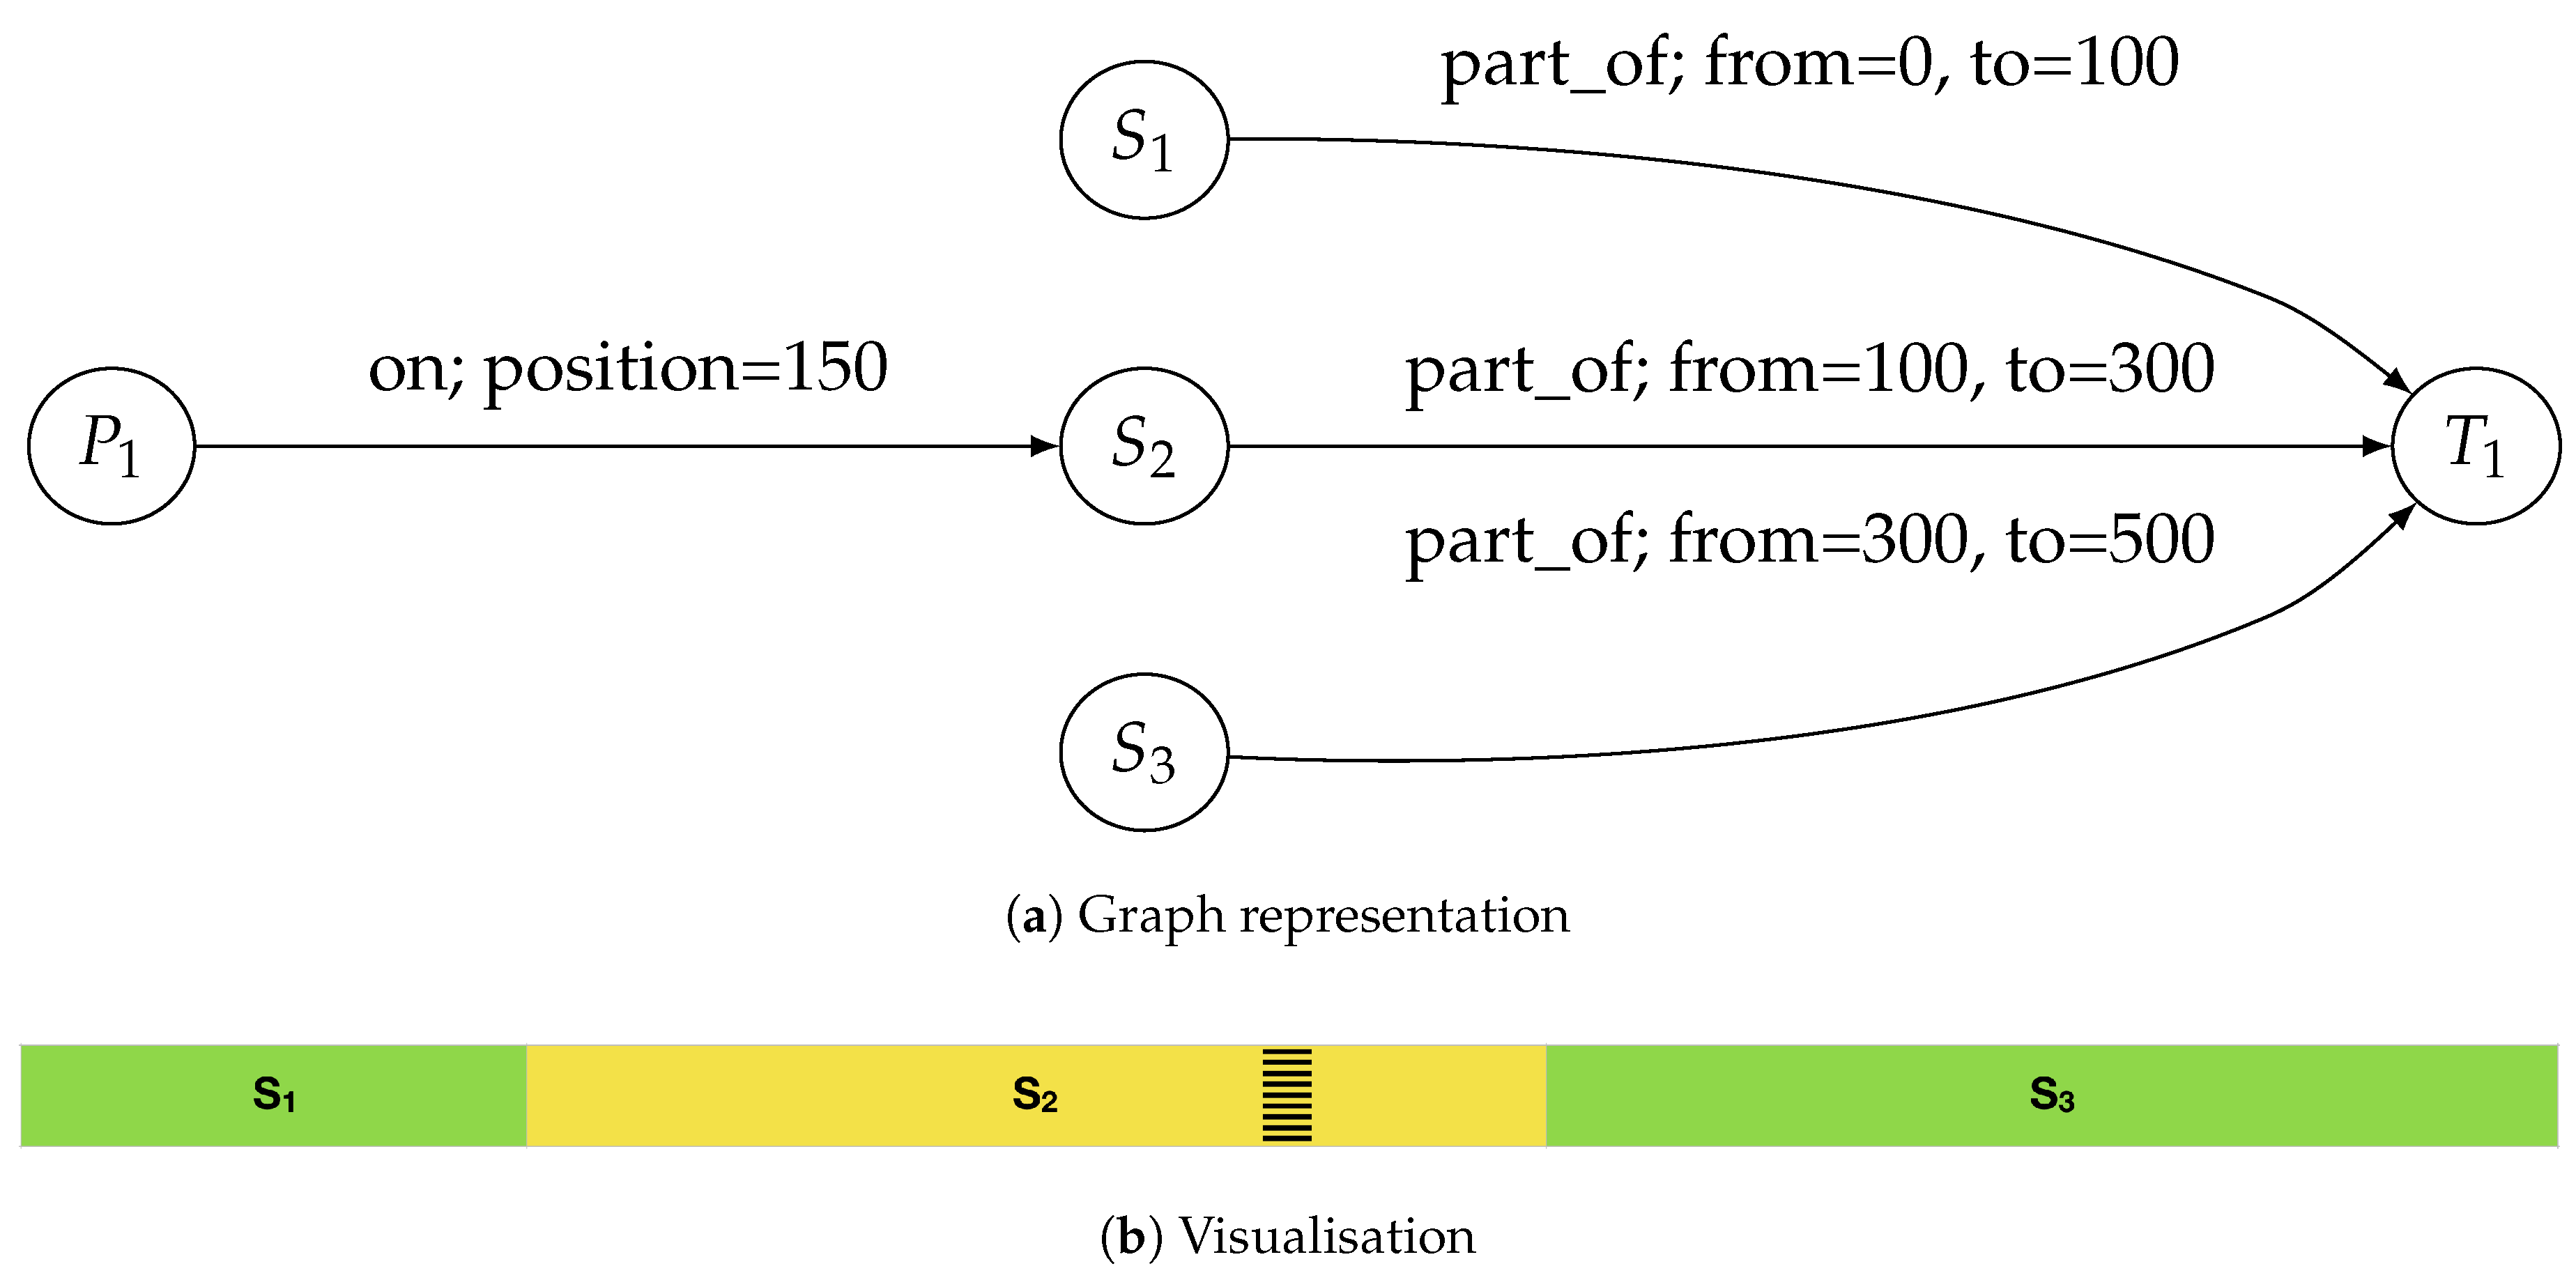
To illustrate the mechanism provided by the presented formalism, a simple example of a graph transformation used to define individual lighting segments for a pedestrian crossing and its surroundings will follow. To maintain clarity of presentation, certain simplifications have been made; for instance, no transition zone is defined for the pedestrian crossing. Therefore, the defined segments may not fully conform to the actual regulations. Let us assume that a street , 500 m long, is divided into three lighting segments:
- , occupying the initial 100 m of the street length, with lighting class M4,
- , occupying the following 200 metres, with lighting class M3,
- , occupying the final 200 m, with lighting class M4.
Additionally, on , there is a pedestrian crossing, with its centre located at the 150th metre of the segment (i.e., the 250th metre of the street). This initial situation has been presented in Figure 2. For clarity, attributes denoting the lighting classes are not shown in the graph.
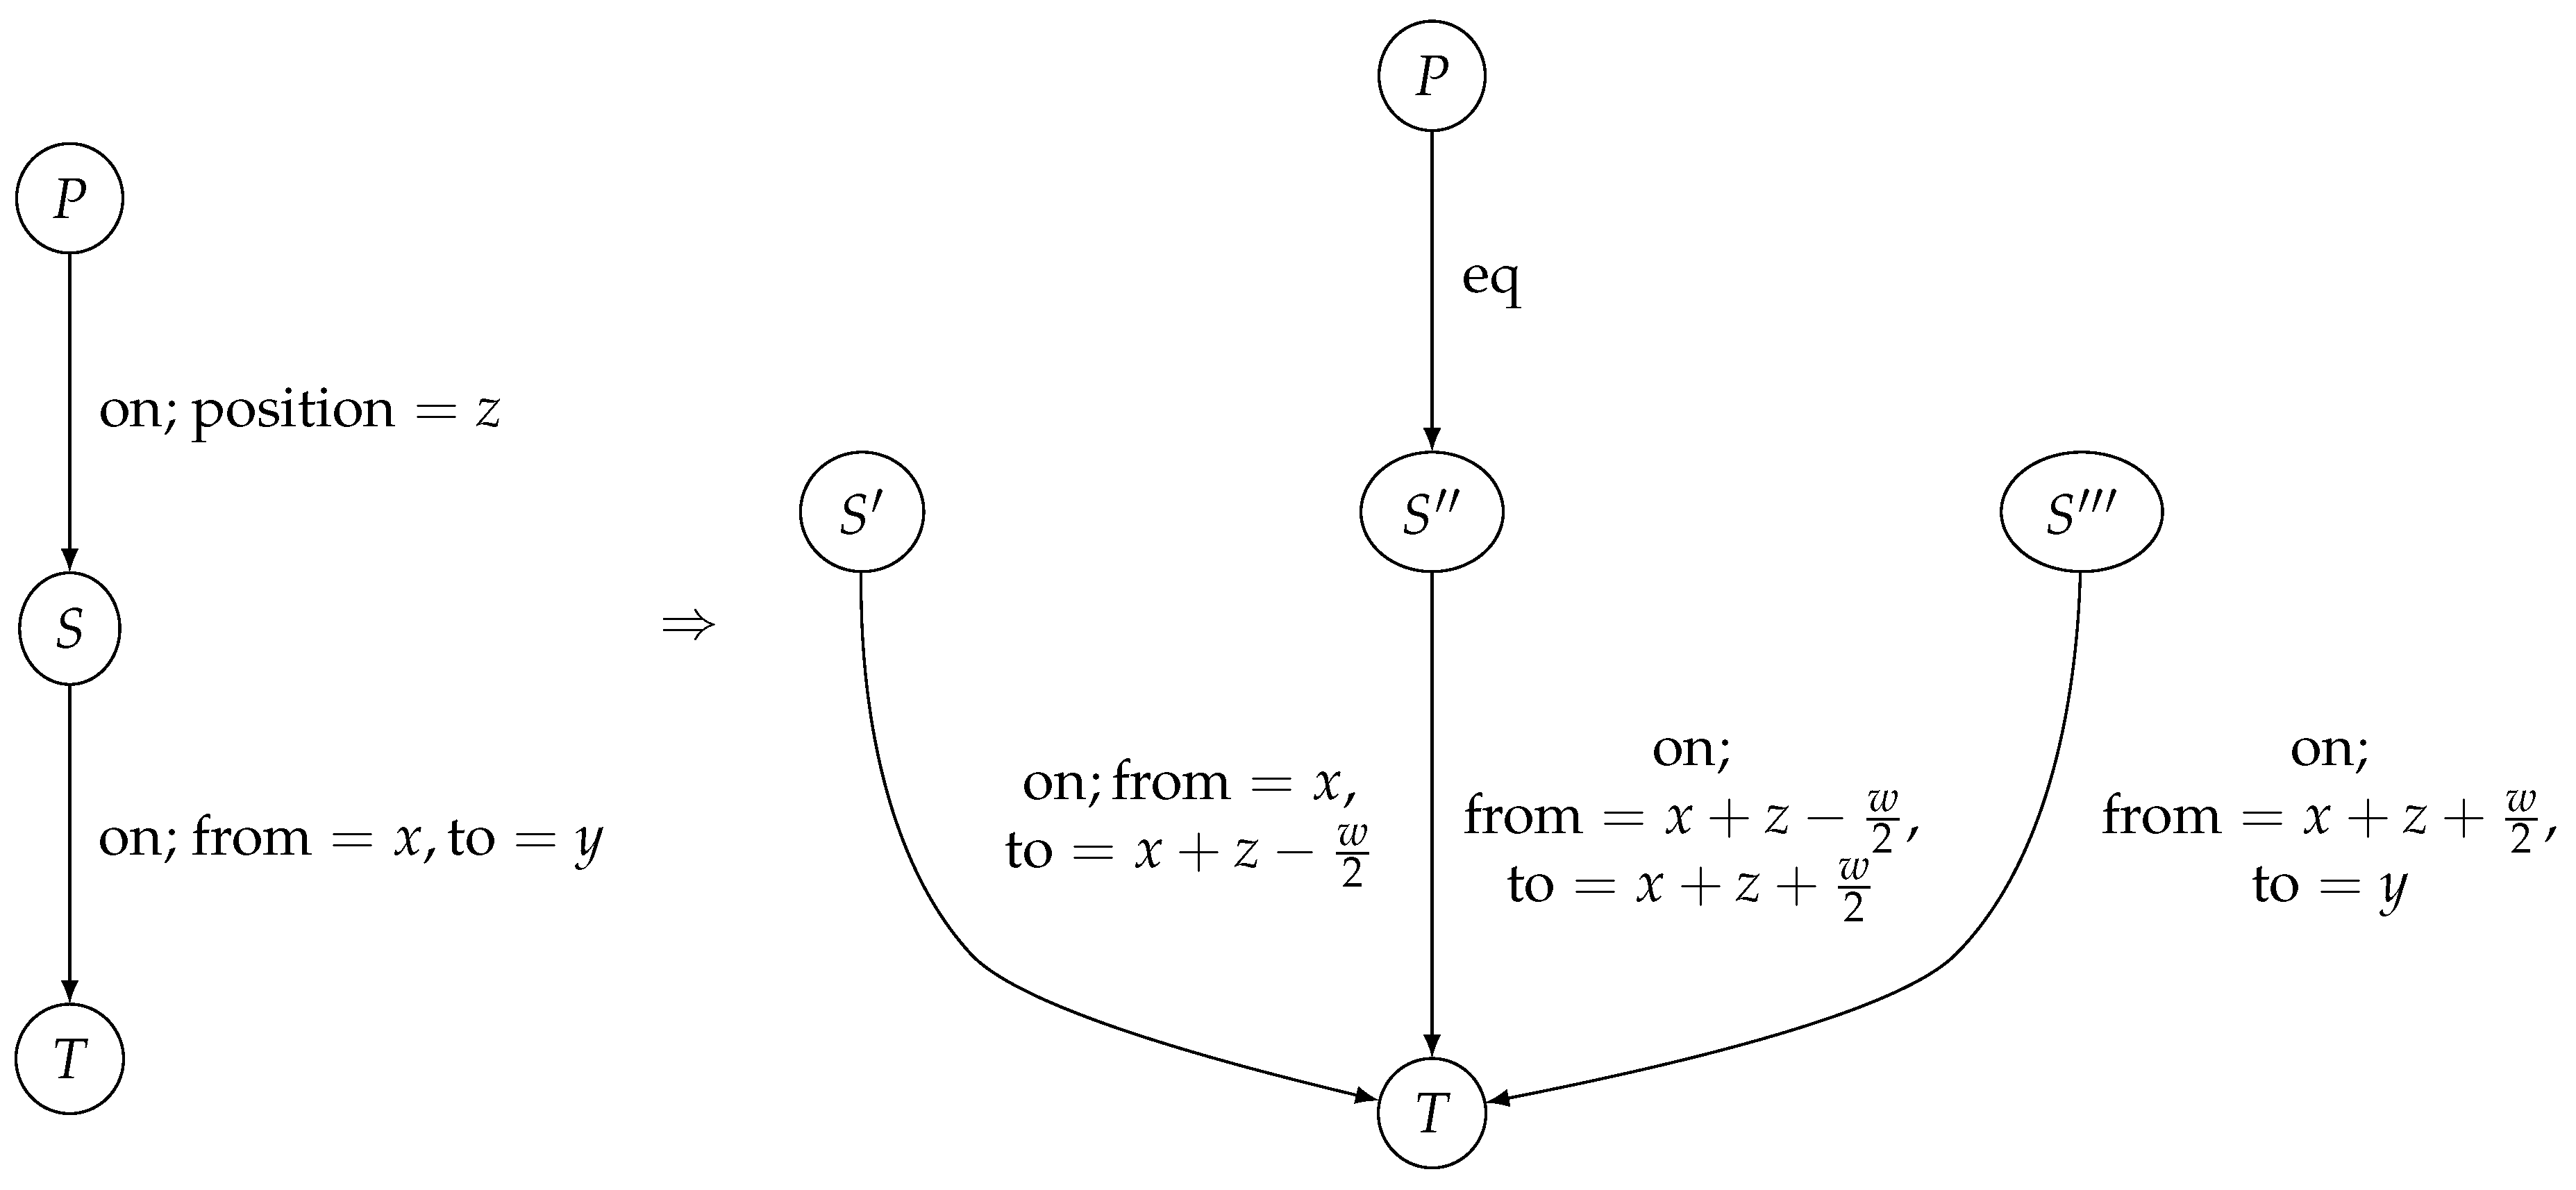
Now, the following production is applied: For every crossing (P node), split the underlying segment into three, defining a 10-metre long segment for the crossing itself, and two segments for the remaining parts of the original one.
A transformation rule which fulfils this task is presented visually in Figure 3. The meaning of the parameters is as follows:
- x and y denote the location of a lighting segment within the street,
- z denotes the location of a crossing within a segment,
- w denotes the desired width of the lighting segment to be created in the location of the pedestrian crossing.
The lighting class attributes for the segments in the of the production are as follows:
- segments and shall inherit class from segment S in ,
- segment will be assigned class C comparable to an M class two levels higher than that of S.
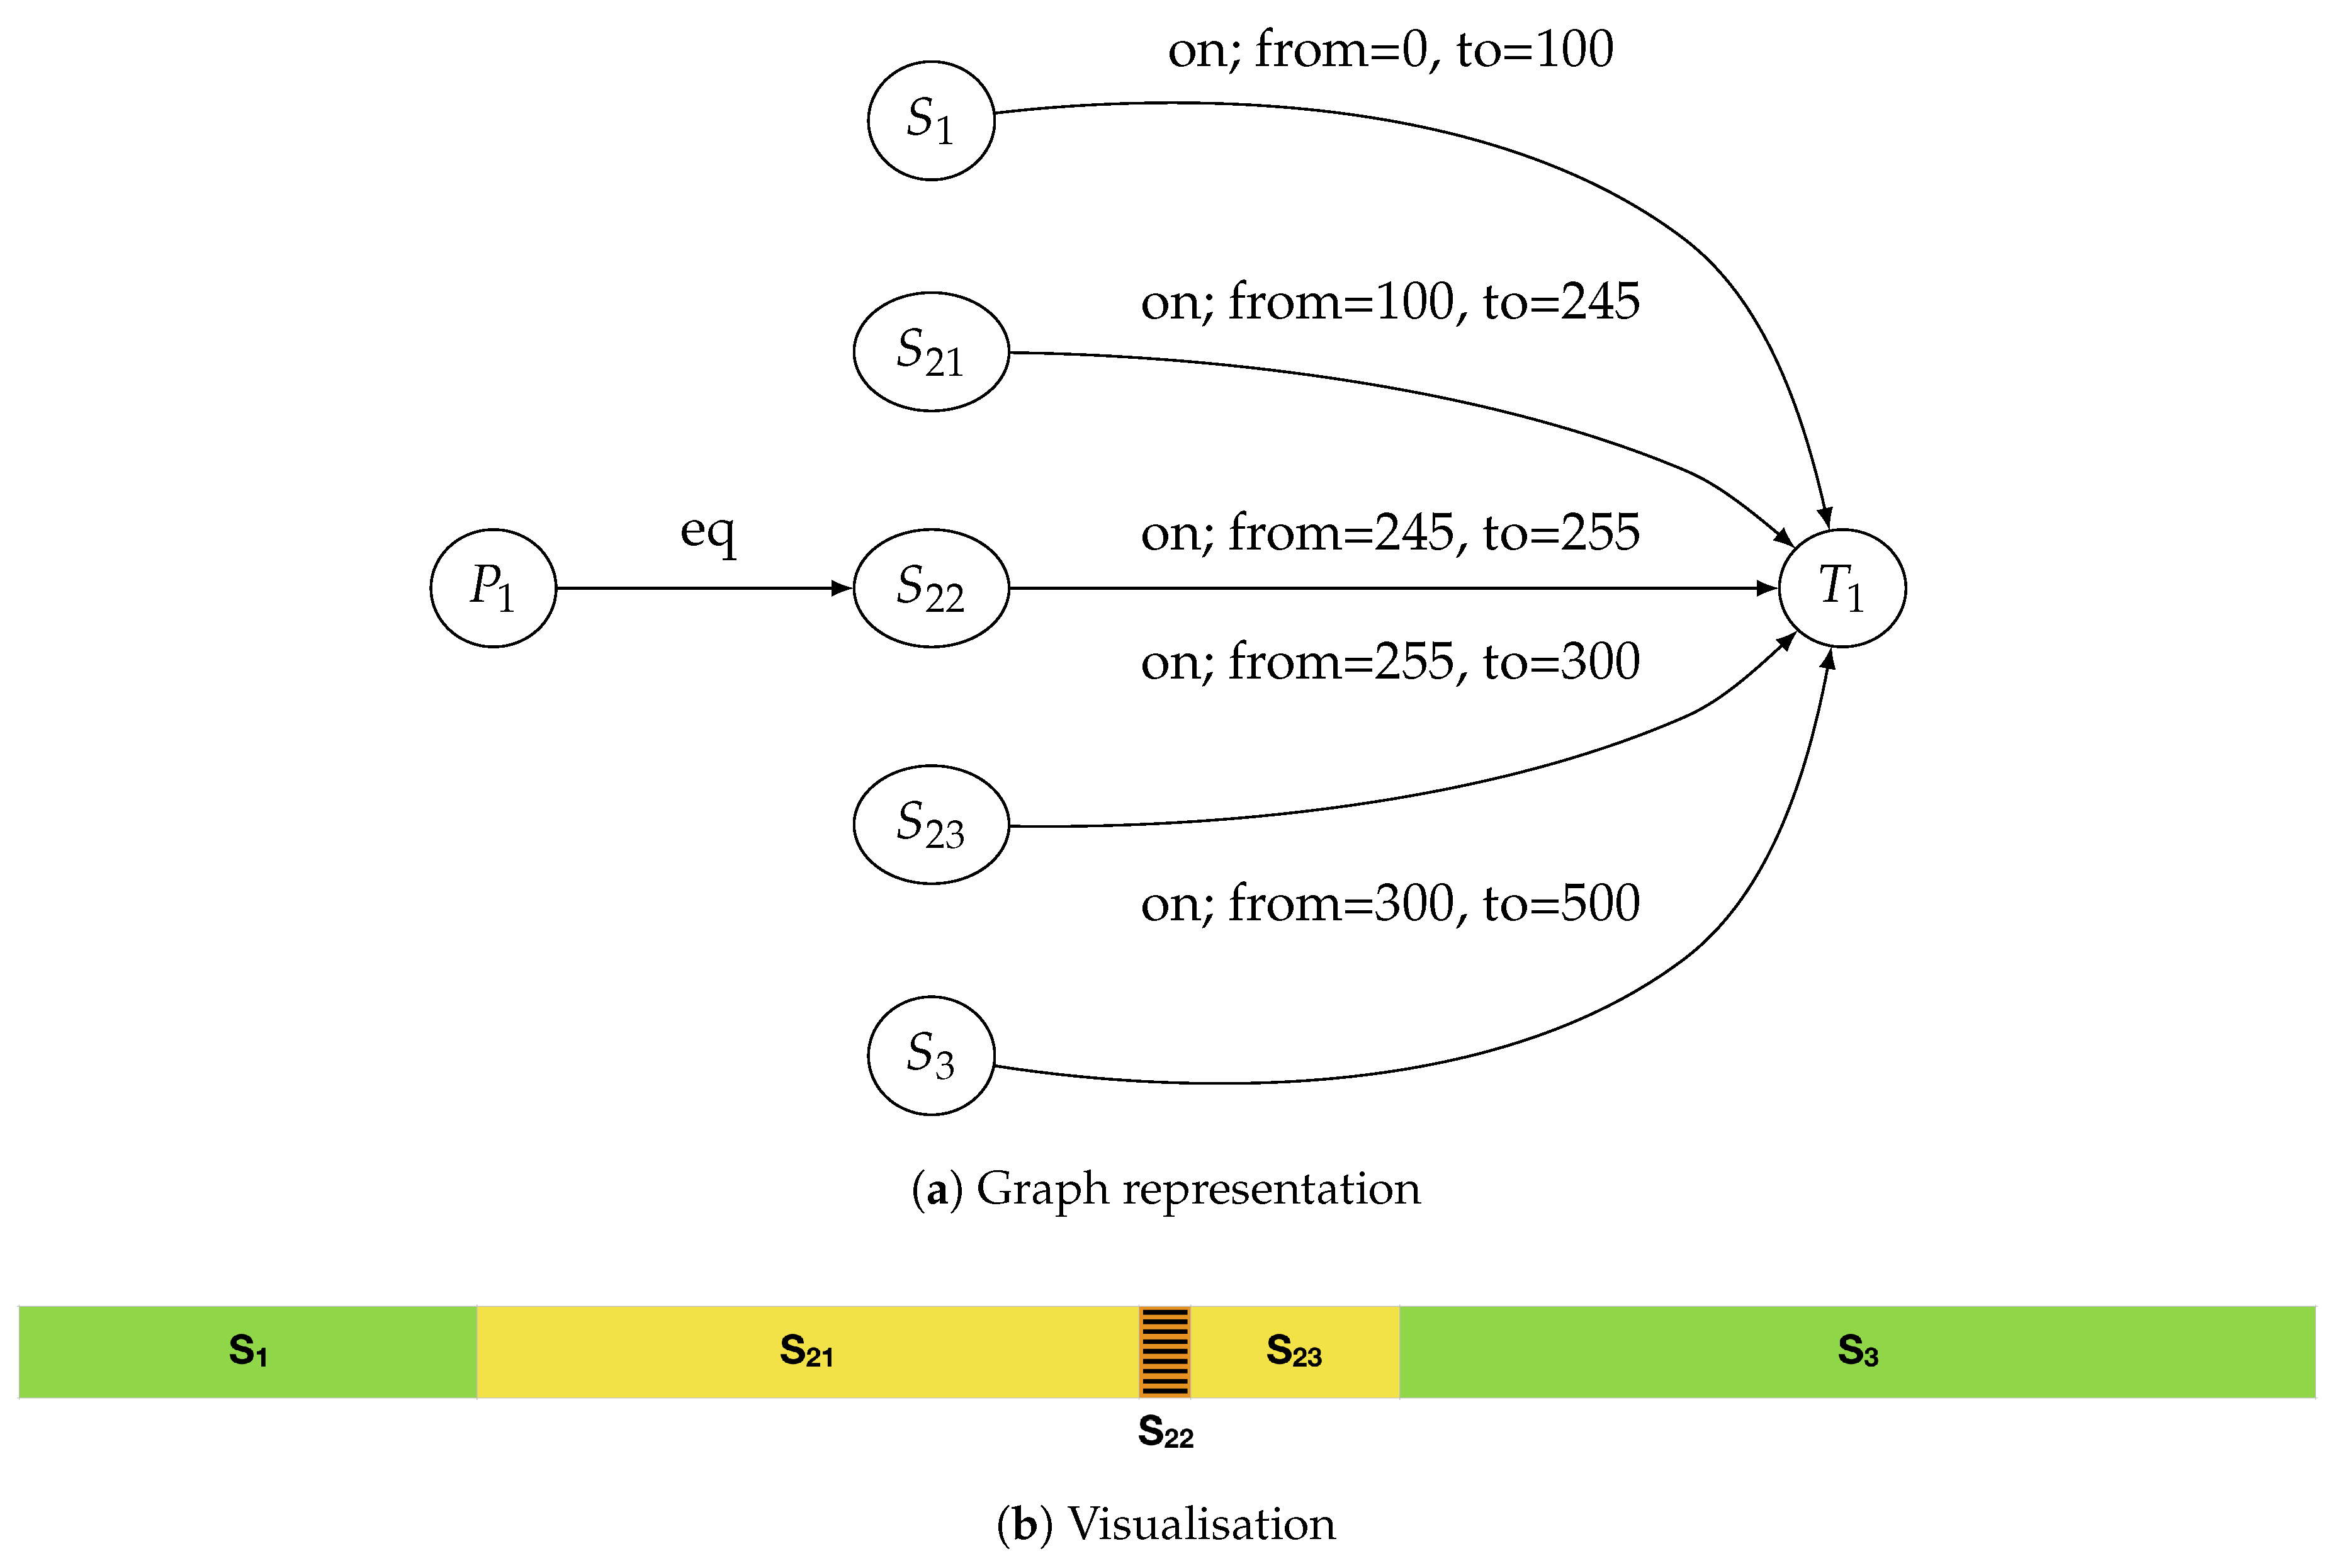
The state of segments after applying the transformation is shown in Figure 4. The attributes for the newly created segments are as follows:
- segments and will inherit class M3 from segment ,
- segment will be assigned class C1.
Defining a formal representation of all transformations applied to spatial (geographic) elements provides a flexible tool to control the complex process of transforming and integrating spatial data from various sources. As shown in Section 5, the spectrum of transformations is very wide, and they need to be applied in a controlled manner. Having a formal definition of these rules and a system able to apply them allows this.
5. Proposed Solution
In this section, we describe the traditional approach to assignment of lighting classes, the criteria that lighting standards define for this process and propose a solution for automatic processing of geospatial data, supported by the formal model defined in Section 4. Since lack of precise data may prohibit fully automatic processing, special attention is given to interaction with users.
5.1. Inclusion of Selection Criteria as Defined by Standards
Adhering to the example of the CEN 13201:2014 standard, we shall now refer to the criteria defined for the most common group of lighting classes—those applied to roads for motorised traffic (M). The standard defines 8 criteria used to select the appropriate class. Evaluation of these criteria is usually done by hand; the proposed approach aims at automating this process as much as possible. While the values have been estimated, the actual lighting class for each road segment can be determined using a very simple rule-based system. The following part of this section presents the criteria, along with possible data sources for automatic assessment.
5.1.1. Design Speed or Speed Limit
The standard defines four speed classes: Below 40 km/h, 40–70 km/h, 70–100 km/h, and over 100 km/h. This data is widely available from road maps, such as those used for navigation systems. Taking the OpenStreetMap (OSM) data for the Małopolskie Voivodeship in Poland as an example, data coverage is good. As shown in Table 1, the coverage is very good for higher-rank roads, where the value is significant given the aforementioned ranges. Also, since the average calculated values correspond well with the legal speed limits, it is easy to estimate the missing values, e.g., taking into account whether a road lies within a built-up area.
5.1.2. Traffic Volume
In the standard, there are three possible values for the traffic volume parameter: Low, high, and moderate. These parameters try to specify the average ratio of vehicles to maximum road capacity with regard to number of lanes. The maximum capacity is examined on motorways, multilane routes and two-lane routes. When the ratio drops below 35% on motorways and multilane routes or below 15% on two-lane routes, the traffic volume is considered to be low. The high traffic volume is true when the maximum capacity exceeds 65% on motorways and multilane routes, and 45% on two lane routes. Other values of traffic volume ratio are described as moderate.
It is not a trivial problem to estimate the traffic volume parameter. While it is possible to take advantage of historical data about traffic if they are available, often they are not and the data has to be added manually by the user or estimated using specialised algorithms.
5.1.3. Traffic Composition
Usually the traffic is composed of both motorised and non-motorised participants. The standard distinguishes three categories describing the traffic composition: Motorised only, mixed, and mixed with high percentage of non-motorised. The parameter can be inferred based on the road type; for instance, the motorways are exclusively used by motorised traffic participants. On the other hand, residential roads often tend to be used by pedestrians, therefore their traffic composition will consist of a high percentage of non-motorised users.
5.1.4. Junction Density
Another important parameter is the junction density. Its value can be labelled as either ‘high’ or ‘moderate’. The ‘high’ value is assigned when the following criteria are fulfilled: There are more than 3 intersections per kilometre or the average distance between bridges is less than 3 km. Otherwise, the junction density is considered to be moderate.
This data can be inferred only from spatial data. Therefore, as described in Section 4.2, such information needs to be calculated by the spatial analysis component (e.g., a PostGIS query) and added as a semantic attribute to the graph.
5.1.5. Ambient Luminosity
Ambient luminosity parameter describes the presence of the ambient source of light such as shopping windows, advertisements, sport fields, etc. The norm distinguishes three values: High, moderate, and low. The data can be inferred by the analysis of satellite photographs or by studying the building types i.e., in OpenStreetMap data. This is one example of when the “keep all data” principle may prove useful.
5.1.6. Navigational Task
The navigational task is another non-trivial parameter to estimate. The norm defines three values: Very difficult, difficult, and easy. Automatic of this value is not trivial, but automatic analysis of map content (i.e., road geometry and intersection structures) as well as user knowledge may be helpful in estimating this parameter.
5.1.7. Separation of Carriageway
This ‘Yes/No’ value can usually be inferred from map data. For instance, OpenStreetMap has a relevant parameter for most roads. However, in some cases, additional processing (such as aerial imagery analysis) may be necessary to fully automate the process.
5.1.8. Parked Vehicles
The presence of parked vehicles (‘Yes/No‘) also influences the selection of lighting class. Here, the data is rather sparse, as only parking restriction data is present in maps. Therefore, visual analysis needs to be performed to a larger extent here than in case of the carriageway separation parameter.
5.2. Automatic Processing of Geographic Data
The proposed solution is automatic, which means that to scale, it may require additional computer resources or processing time, but not human workload. This significantly improves cost efficiency and, given that processing performance is constantly improving and resources are easily available, it reduces the processing time as well.
Basing on a current approach to designing the lighting segments and the newly introduced formal model in previous section, we propose a practical solution. It takes into account numerous aspects of urban environment to determine the lighting segments such as crossings, intersections, roads parameters (i.e., signs and speed limits) etc. The information is gathered from maps, geodetic data, OpenStreetMap, lighting infrastructure, statistical data about traffic, and expert knowledge. Most data is tagged with geographical location, which makes it feasible to combine them.
Lighting segments are being defined in places where roads cross with pedestrian crossings, with other roads and where their significant parameters change. Also, the neighbourhood of public facilities such as school or spots with exceptionally high accident rate, are taken into consideration. However, we may come across the situation when data is unavailable or deficient. In such cases, it is necessary to somehow estimate the lacking information, what is broadly described in Section 7.
Information about some parameters can come from various sources with different levels of reliability. Therefore, an additional probability parameter for attributes with uncertain or estimated data. The flexible graph structure allows for such modification.
5.3. Interaction with Users
As shown in Section 5.1, automatic determination of some parameter values may not be trivial. While the proposed formal structure allows the system to be easily supplemented with analytic modules as they are developed, there still is a need for interaction with the user for places where corrections need to be made. Such interaction is crucial, because often the user is the main source of expert knowledge we want to obtain and use.
Working with spatial data is especially tightly connected with visualisation, because, as opposed to numeric data, it is literally incomprehensible in text form. The tools need to be tailored to the particular application of preparing lighting infrastructure data. Editing modes known e.g., from vector graphic software may prove infeasible for spatial data. The issues related to this problem have been described in more detailed in [30].
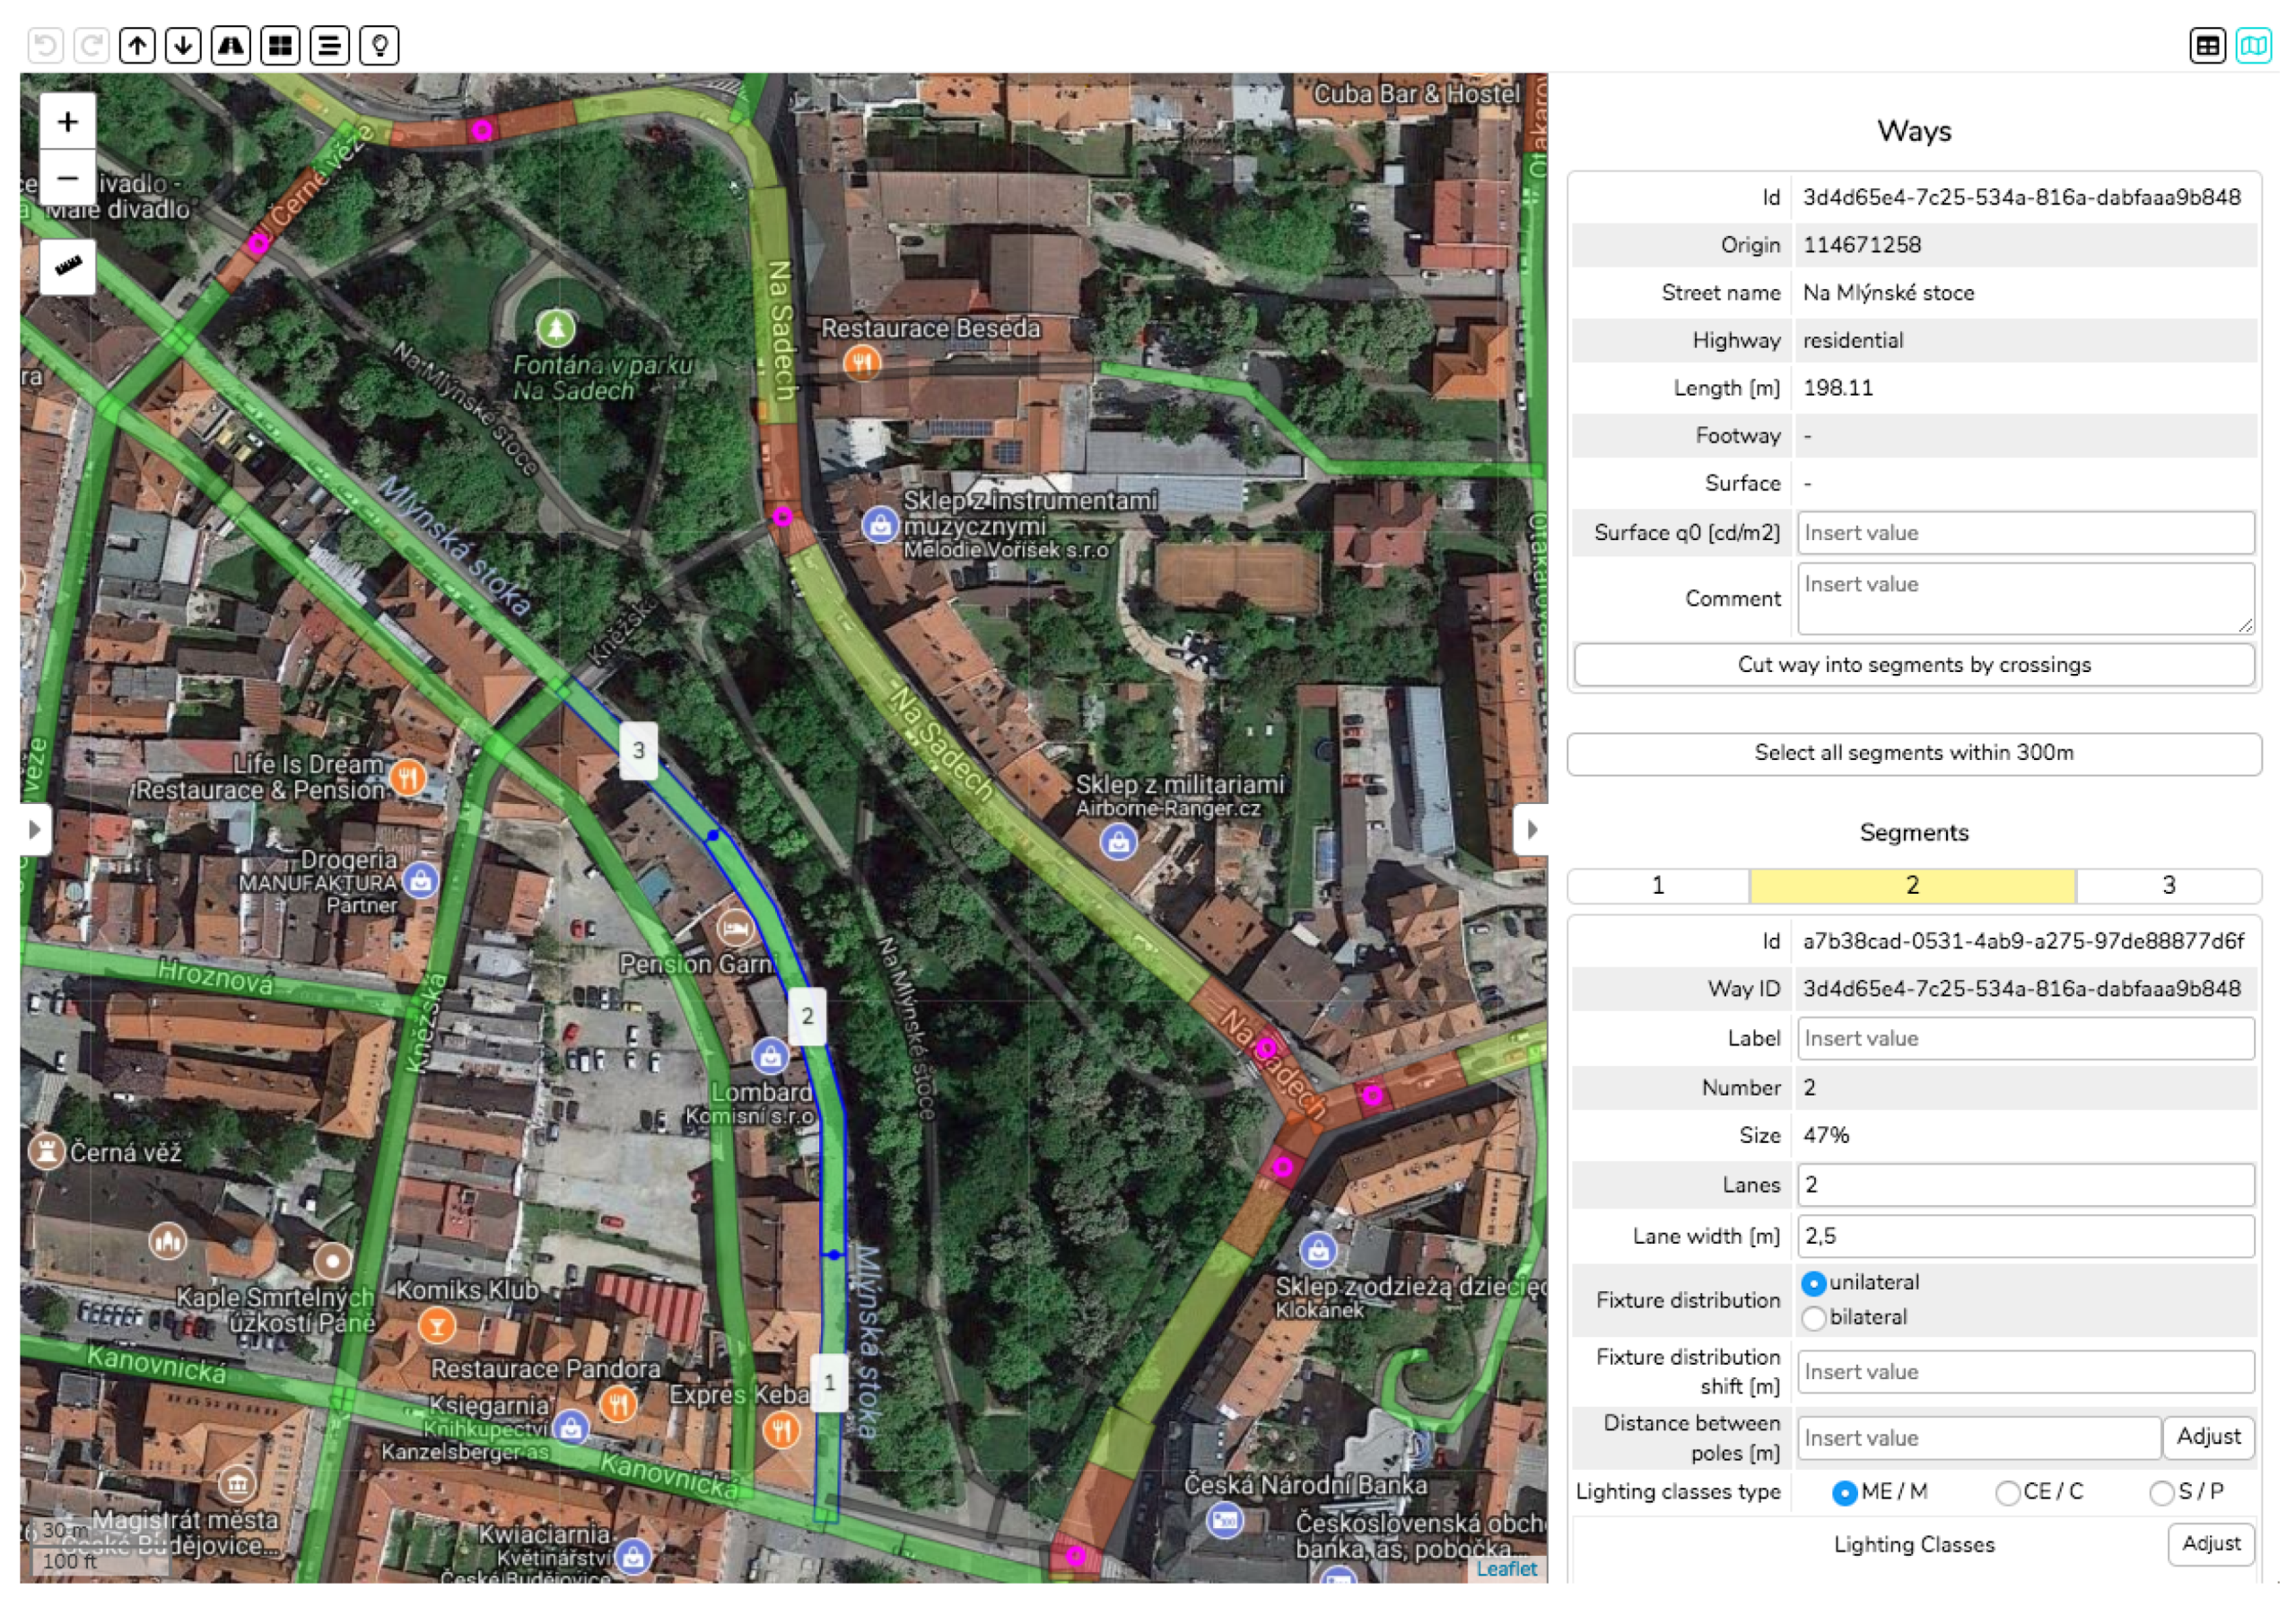
Therefore, we propose system which contains the necessary processing facilities, but also features a user front-end. An example view of the proposed tool is presented in Figure 5. It provides a map interface with all lighting segments, as well as customised editing tools.
6. Results
To illustrate the real-life efficiency and impact of the proposed approach, two comparative studies are presented. First, we present a case study based on an actual project in Kraków, Poland, to compare the number and structure of segments defined by a professional lighting designer using only supplied maps ‘manual’ tools, a designer using an automated design tool (but with manual segment definition) and our prototype system. Then, we will present the results of an experiment involving automatic processing of data regarding several European cities to provide some intuition regarding the actual results of the proposed approach.
6.1. Comparison of Different Approaches to Design in a Case Study in KrakóW
To compare the granulation of lighting segments generated using various methods, we have selected the area of a lighting project, carried out by the City of Kraków, Poland, in cooperation with the AGH University of Science and Technology. The project involved replacing almost 4000 lighting fixtures with LED ones, preparing an optimised photometric design and deploying a sensor-based control system to dynamically dim the individual fixtures as required by the standards [31,32,33]. The area in question is presented in Figure 6.
Using that area as a test, three different approaches were verified:
- A professional lighting designer analysed the area of the project, extracted the different lighting situations, and assigned them to streets in the area. Then, a photometric design was prepared using typical design software.
- A human designer used a dedicated web application to define lighting segments for an automatic photometric design tool, PhoCa [24]. Since the calculations were then carried out without user interaction, the increasing number of segments no longer posed the risk of making the calculations infeasible. However, manual definition of the lit areas was still prone to inconsistencies and human error.
The results of these experiments are presented in Table 2. They are in line with the observations made in Section 3. When using traditional tools (approach 1—DIALux, Ulysse, etc.), the designer ‘grouped’ similar road segments to reduce the amount of manual work needed to establish the configurations for each situation and optimise them. Not having that limitation (approach 2—using automated calculation tools), the designer allowed for more fine-grained division of lighting situations, but was still limited by having to define all of them on the map manually. That is why the proposed approach yielded over three times more individual segments—in a fully automated manner.
This means that the assignment of lighting requirements using the proposed method is more precise. The implications of this precision may be two-fold:
- more precise distribution of lighting segments may, in many cases, improve the energy efficiency of the installation, as the less precise approaches usually assume a worst-case scenario (e.g., a higher lighting class is used for an entire road even if only one part of it actually requires that),
- the lighting parameters better reflect the reality, providing more light where needed (e.g., for pedestrian crossings), and reducing the intensity where it is not required (which may effect in reduced light pollution).
6.2. Results for Various European Cities
To demonstrate the effects of the proposed approach on a broader scale, we have performed experiments with map data for several large European cities. Similarly to the case study 3 presented in Section 6.1, all of these results were obtained using an automated prototype, without any user intervention.
Table 3 and Figure 7b present the numbers of segments obtained using variants of the proposed method; the table also presents the area and population of the cities. Obviously, with an increase of the cities area, the number of citizens and streets increases as well. Street fragments refer to parts of streets that are characterised by the same set of parameters—the same speed limit, width, number of lanes, etc. The fifth column presents the number of segments that obtained by dividing street fragments at places where two roads intersect. The sixth column shows the number of segments if they are additionally split at indicated locations of pedestrian crossings (including transition zones).
The results support the observations from the case study presented in Section 6.1. Areas with higher lighting requirements, such as intersections and pedestrian crossings, are commonly encountered in cities, but often omitted in more coarse-grained approaches. To provide adequate lighting for these areas, it crucial to take them into consideration while designing the lighting segments.
Moreover, an interesting observation can be made in Figure 7b, which presents the number of streets and segments per 1000 citizens. Even though the analysed cities have very different characteristics and sizes, all show a significant and similar increase of the number of lighting segments after applying the proposed methods. This indicates that a systematic approach to determination of lighting segments and classes can yield significant improvements in most, if not all, urban environments.
7. Future Work
The presented research results are actually the basis for further work, which is very closely bound to practical experiments using real-world lighting modernisation project data. Since the presented formal background, as well as prototypes based on it, provide the necessary flexibility, a significant portion of this work will involve “teaching” the system to deal with problematic or inconsistent datasets. The data may be lacking in two respects:
- coverage—data for some areas may be lacking, and therefore may require appropriate estimation (interpolation, prediction) algorithms be used; this process requires a formal model to allow that, but does not require actual definition of new concepts,
- conceptual—where new concepts (and their relation to other elements) may become required to make design decisions; an example here could be the age structure of pedestrians crossing the street at a given location—given lack of such data, one may estimate it by analysing the types of surrounding buildings.
The latter issue—definition of new concepts—is an especially difficult one. A good example of such case is the requirement to assess the number of pedestrians crossing the street at a given point at different times of day, along with their age structure. Normally, such data is not available, as these values are very difficult to measure. However, thanks to the presence of diverse data in the SEG (following the “keep all data” principle described in Section 4.1), one may easily provide some estimation of the necessary parameters. For instance, knowing the types of buildings in the vicinity of the crossing, one may provide a good estimate of these values. Having these buildings, along with their type, shape and location, stored as O-labeled nodes and connected to the crossing with edges signifying physical closeness (e.g., ), it is possible to define graph productions which update the appropriate attributes based on certain patterns in the graph.
In a traditional software development approach, each such change may require alterations of the underlying database structure and software components. However, thanks to the proposed spatial/semantic graph representation and defined transformations, the modifications are moved to the transformation rule definition level.
8. Conclusions
In the paper, we have proposed a system which provides a formal model of areas designated for street lighting modernisation projects. Making the system aware of what is being lit, not only of the lighting infrastructure, allows for precise photometric calculations. These result in a configuration of lamps that is more efficient and better suited to the actual, real-world situation.
Automatic acquisition and integration of data from various sources, such as road maps, geodetic datasets, and various recorded sensor readings not only reduces the workload for human designers, but also guarantee consistency in an arbitrarily large area. This is especially useful when auditing the state of existing lighting installations with regard to compliance with standards and additional regulations on the illumination of pedestrian crossings.
The proposed graph structure, described in Section 4, is the formal basis of the system, giving it the flexibility to adapt to new types of data, as well as to define new processing rules in a consistent manner. At the same time, the proposed approach fully supports the spatial component in data, allowing for extraction of semantic relations between objects through geometric analysis.
The presented results have been obtained using a working prototype system which follows the principles of the presented approach. One study (Section 6.1) involved comparing the structure of lighting areas defined by professional designers in a project conducted earlier by AGH University of Science and Technology with the City of Kraków with the structure obtained automatically using the proposed approach. Another one (Section 6.2) presents the results of the proposed approach in various European cities, along with their significant parameters.
The obtained results are promising in that they offer much more precise analysis of the lighting requirements compared to the traditional, coarse-grained approach. Clearly, an automated system for photometric calculations is necessary to fully benefit from such precise lighting segments and class assignment.
However, systematic focus on the areas being lit can be beneficial for most cities, as it can be used not only to support design or optimisation of new lighting installations, but also to identify any deficiencies in the existing ones. That may support the officials in prioritising the planned modernisations, letting them adapt more precisely to the citizens’ needs.
Author Contributions
Conceptualization, S.E. and L.K.; Data curation, S.E., M.Ł. and K.Ś.; Formal analysis, S.E. and L.K.; Software, M.Ł. and K.Ś.; Supervision, L.K.; Validation, S.E., M.Ł. and K.Ś; Writing—original draft, S.E., M.Ł., K.Ś. and L.K.; Writing—review and editing, S.E., M.Ł., K.Ś. and L.K.
Funding
This research was supported by the AGH University of Science and Technology grant number 11.11.120.859 and co-financed by the Polish National Centre for Research and Development grant number POIR.01.01.01-00-0037/17 funded from European Funds and granted to GRADIS Ltd.
Conflicts of Interest
The authors declare no conflict of interest.
References
- European Committee for Standarization. CEN/TR 13201-1: Road Lighting—Part 1: Guidelines on Selection of Lighting Classes; Technical Report; European Committee for Standarization: Brussels, Belgium, 2014. [Google Scholar]
- European Committee for Standarization. EN 13201-2: Road Lighting—Part 2: Performance Requirements; Technical Report; European Committee for Standarization: Brussels, Belgium, 2014. [Google Scholar]
- European Committee for Standarization. EN 13201-3: Road Lighting—Part 3: Calculation of Performance; Technical Report; European Committee for Standarization: Brussels, Belgium, 2014. [Google Scholar]
- European Committee for Standarization. EN 13201-4: Road Lighting—Part 4: Methods of Measuring Lighting Performance; Technical Report; European Committee for Standarization: Brussels, Belgium, 2014. [Google Scholar]
- European Committee for Standarization. prEN 13201-5: Road Lighting—Part 5: Energy Performance Indicators; Technical Report; European Committee for Standarization: Brussels, Belgium, 2014. [Google Scholar]
- Sędziwy, A.; Basiura, A. Energy Reduction in Roadway Lighting Achieved with Novel Design Approach and LEDs. LEUKOS 2018, 14, 45–51. [Google Scholar] [CrossRef]
- Hölker, F.; Moss, T.; Griefahn, B.; Kloas, W.; Voigt, C.C.; Henckel, D.; Hänel, A.; Kappeler, P.M.; Völker, S.; Schwope, A.; et al. The Dark Side of Light: A Transdisciplinary Research Agenda for Light Pollution Policy. Ecol. Soc. 2010, 15, 13. [Google Scholar] [CrossRef]
- Hölker, F.; Wolter, C.; Perkin, E.K.; Tockner, K. Light Pollution as a Biodiversity Threat. Trends Ecol. Evol. 2010, 25, 681–682. [Google Scholar] [CrossRef] [PubMed]
- Bureau Voor Normalisatie. NBN L 18-002: Recommendations for Special Cases of Public Lighting; Technical Report; Bureau Voor Normalisatie: Brussels, Belgium, 1988.
- Vademecum Voetgangersvoorzieningen. Ministerie van de Vlaamse Gemeenschap Ministerie van de Vlaamse Gemeenschap. In Ontwerprichtlijnen Voor Voetgangersvoorzieningen; Vademecum Voetgangersvoorzieningen: Brussels, Belgium, 2003. [Google Scholar]
- Ministerstvo Dopravy. Osvětlení Pozemních Komunikací. In Technické Kvalitativní Podmínky Staveb; Ministerstvo Dopravy: Praha, Czech Republic, 2015. [Google Scholar]
- Deutsches Institut für Normung. DIN 67523-2:2010-06: Beleuchtung von Fußgängerüberwegen (Zeichen 293 StVO) Mit Zusatzbeleuchtung—Teil 2: Berechnung Und Messung; Technical Report; Deutsches Institut für Normung: Berlin, Germany, 2010. [Google Scholar]
- Automobile Club d’Italia. Linee Guida per La Progettazione Degli Attraversamenti Pedonali; Technical Report; Automobile Club d’Italia: Pavia, Italy, 2011. [Google Scholar]
- Statens Vegvesen. Håndbok N100: Veg-Og Gateutforming; Technical Report; Statens Vegvesen: Oslo, Norway, 2014.
- Jamroz, K.; Tomczuk, P.; Mackun, T.; Chrzanowicz, M. Wytyczne Prawidłowego Oświetlenia Przejść Dla Pieszych; Technical Report; Ministerstwo Infrastruktury: Warszawa, Poland, 2018.
- Trafikverket. Vägbelysningshandboken; Technical Report; Trafikverket: Borlänge, Sweden, 2014.
- Trafikverket, Sveriges Kommuner och Landsting. Krav För Vägars Och Gators Utformning; Technical Report Trafikverkets Publikation 2015:086; Trafikverket, Sveriges Kommuner och Landsting: Borlänge, Sweden, 2015.
- Schweizer Licht Gesellschaft. Beleuchtung von Fussgänger-Überwegen. In SLG Richtlinie 202:2016; Schweizer Licht Gesellschaft: Olten, Switzerland, 2016. [Google Scholar]
- Institution of Lighting Engineers. Technical Report 12: Lighting of Pedestrian Crossings; Technical Report; Institution of Lighting Engineers: Rugby, UK, 2007. [Google Scholar]
- NASA. The EGM96 Geoid Undulation with Respect to the WGS84 Ellipsoid. In EGM96. The NASA GSFC and NIMA Joint Geopotential Model, NASA/TP-1998-206861; NASA: Washington, DC, USA, 2002. [Google Scholar]
- Sędziwy, A. A New Approach to Street Lighting Design. LEUKOS 2016, 12, 151–162. [Google Scholar] [CrossRef]
- Rabaza, O.; Peña-García, A.; Pérez-Ocón, F.; Gómez-Lorente, D. A Simple Method for Designing Efficient Public Lighting, Based on New Parameter Relationships. Expert Syst. Appl. 2013, 40, 7305–7315. [Google Scholar] [CrossRef]
- Gómez-Lorente, D.; Rabaza, O.; Espín Estrella, A.; Peña-García, A. A New Methodology for Calculating Roadway Lighting Design Based on a Multi-Objective Evolutionary Algorithm. Expert Syst. Appl. 2013, 40, 2156–2164. [Google Scholar] [CrossRef]
- Sędziwy, A. Sustainable Street Lighting Design Supported by Hypergraph-Based Computational Model. Sustainability 2015, 8, 13. [Google Scholar] [CrossRef]
- Juntunen, E.; Tetri, E.; Tapaninen, O.; Yrjänä, S.; Kondratyev, V.; Sitomaniemi, A.; Siirtola, H.; Sarjanoja, E.; Aikio, J.; Heikkinen, V. A Smart LED Luminaire for Energy Savings in Pedestrian Road Lighting. Light. Res. Technol. 2015, 47, 103–115. [Google Scholar] [CrossRef]
- Beccali, M.; Bonomolo, M.; Ciulla, G.; Galatioto, A.; Lo Brano, V. Improvement of Energy Efficiency and Quality of Street Lighting in South Italy as an Action of Sustainable Energy Action Plans. The Case Study of Comiso (RG). Energy 2015, 92, 394–408. [Google Scholar] [CrossRef]
- Wojnicki, I.; Kotulski, L.; Sędziwy, A.; Ernst, S. Application of Distributed Graph Transformations to Automated Generation of Control Patterns for Intelligent Lighting Systems. J. Comput. Sci. 2017, 23, 20–30. [Google Scholar] [CrossRef]
- Wojnicki, I.; Kotulski, L. Intelligent Design and Control of Outdoor Lighting, Complexity Issues. 2014. Available online: https://www.scientific.net/KEM.572.494 (accessed on 4 October 2018).
- PostGIS 2.4 Documentation. Available online: https://postgis.net/docs/manual-2.4/ (accessed on 4 October 2018).
- Środa, K.; Łabuz, M.; Ernst, S. Improving the Responsiveness of Geospatial Web Applications through Client-Side Processing. Multimed. Netw. Inf. Syst. 2018, 833, 142–150. [Google Scholar] [CrossRef]
- Wojnicki, I.; Kotulski, L. Empirical Study of How Traffic Intensity Detector Parameters Influence Dynamic Street Lighting Energy Consumption: A Case Study in Krakow, Poland. Sustainability 2018, 10, 1221. [Google Scholar] [CrossRef]
- Wojnicki, I.; Kotulski, L. Improving Control Efficiency of Dynamic Street Lighting by Utilizing the Dual Graph Grammar Concept. Energies 2018, 11, 402. [Google Scholar] [CrossRef]
- Wojnicki, I.; Kotulski, L. Street Lighting Control, Energy Consumption Optimization. In Artificial Intelligence and Soft Computing; Lecture Notes in Computer Science; Springer: Cham, Germany, 2017; pp. 357–364. [Google Scholar] [CrossRef]
- Wikidata. Available online: https://www.wikidata.org (accessed on 4 October 2018).
Figure 1.
Flowchart presenting the stages and components of a lighting design or modernisation process; steps marked with yellow colour are supported by the proposed system. (a) Traditional lighting design process, with rough (simplified) data used for photometric calculations, (b) Precise process, using exact data for the calculations.

Figure 2.
Initial state of segments.

Figure 3.
Graph production to generate individual segments in presence of a street crossing.

Figure 4.
Road segments after applying the transformation.

Figure 5.
Example view of the user interface of the proposed system.

Figure 6.
Map of the area of the case study.

Figure 7.
Results of the proposed method in different European cities.


Table 1.
Coverage of OpenStreetMap speed limit data for roads in the Małopolskie Voivodeship, as of August 2018.
Table 1.
Coverage of OpenStreetMap speed limit data for roads in the Małopolskie Voivodeship, as of August 2018.
| Type Label | Total Number | Coverage | Average Value [km/h] |
|---|---|---|---|
| Motorway | 495 | 100% | 135.27 |
| Trunk road | 144 | 85% | 115.53 |
| Primary road | 4479 | 84% | 64.77 |
| Secondary road | 4123 | 60% | 57.53 |
| Tertiary road | 10,238 | 40% | 52.42 |
| Residential street | 40,773 | 11% | 38.51 |
| Service road | 52,080 | 2% | 30.81 |
| Unclassified | 6982 | 7% | 49.04 |
Table 2.
Number for segments defined in the project area.
| Approach | No. of Segments |
|---|---|
| Human designer, traditional tool | 99 |
| Human designer, PhoCa automated tool | 637 |
| Proposed approach, automatic map processing | 2268 |
Table 3.
Comparison of the number of segments in European cities with area and population
| Country | City | No. of Streets | No. of Street Fragments | No. of Segments Cut by Intersection | No. of Segments Cut by Intersection and Crossings | Area [km] [34] | Population [34] |
|---|---|---|---|---|---|---|---|
| Switzerland | Zurich | 1888 | 6491 | 8223 | 20,791 | 87.88 | 407,447 |
| Italy | Florence | 2317 | 6134 | 8262 | 18,946 | 102 | 382,258 |
| Poland | Kraków | 4336 | 10,672 | 12,985 | 23,632 | 327 | 761,900 |
| Poland | Warsaw | 8933 | 21,448 | 26,608 | 54,195 | 517.24 | 1,753,977 |
| Hungary | Budapest | 9015 | 24,711 | 34,326 | 45,117 | 525.14 | 1,744,665 |
| Spain | Madrid | 11,913 | 28,222 | 39,360 | 105,561 | 604.46 | 3,182,981 |
© 2018 by the authors. Licensee MDPI, Basel, Switzerland. This article is an open access article distributed under the terms and conditions of the Creative Commons Attribution (CC BY) license (http://creativecommons.org/licenses/by/4.0/).
Share and Cite
MDPI and ACS Style
Ernst, S.; Łabuz, M.; Środa, K.; Kotulski, L. Graph-Based Spatial Data Processing and Analysis for More Efficient Road Lighting Design. Sustainability 2018, 10, 3850. https://doi.org/10.3390/su10113850
AMA Style
Ernst S, Łabuz M, Środa K, Kotulski L. Graph-Based Spatial Data Processing and Analysis for More Efficient Road Lighting Design. Sustainability. 2018; 10(11):3850. https://doi.org/10.3390/su10113850
Chicago/Turabian StyleErnst, Sebastian, Marek Łabuz, Kamila Środa, and Leszek Kotulski. 2018. "Graph-Based Spatial Data Processing and Analysis for More Efficient Road Lighting Design" Sustainability 10, no. 11: 3850. https://doi.org/10.3390/su10113850
Note that from the first issue of 2016, this journal uses article numbers instead of page numbers. See further details here.