How Much Lighting is Required to Feel Safe When Walking Through the Streets at Night?


Department of Natural Resources and Environmental Management, University of Haifa, Mt. Carmel, Haifa 3498838, Israel
*
Author to whom correspondence should be addressed.
Sustainability 2020, 12(8), 3133; https://doi.org/10.3390/su12083133
Submission received: 17 March 2020
/
Revised: 30 March 2020
/
Accepted: 1 April 2020
/
Published: 13 April 2020
(This article belongs to the Section Sustainability in Geographic Science)
Abstract
:Public space lighting (PSL) is indispensable after the natural dark. However, little is known about how much PSL people actually need to feel sufficiently safe in different real-world urban settings. The present study attempts to answer this question by employing a novel real-time interactive approach, according to which, observers use a specially-designed mobile phone application to assess and report the perceived attributes of street lighting and the feeling of safety (FoS) it generates. To validate the proposed approach, a systematic survey was conducted in three cities in Israel—Tel Aviv-Yafo and Haifa, which lie on the Mediterranean coast, and Be’er Sheba, which lies inland. Additionally, instrumental PSL measurements were performed at the same locations. As the study reveals, the necessary level of illumination required by urban residents to feel safe differs by city and is significantly higher in Be’er Sheba, other factors held equal, in compare to Haifa and Tel Aviv-Yafo. This difference may be attributed to stronger daylight that the residents of the desert city of Be’er Sheba are accustomed to, and, therefore, may prefer stronger nighttime illumination. The difference could also be related to the relatively low socio-economic status and somewhat higher crime rates in the latter city. Findings also show a significant and positive association between FoS and instrumentally measured PSL levels, although this association exhibits diminishing returns. To the best of our knowledge, the present study is the first to use an interactive location- and time-based mobile phone technology, which can potentially provide more accurate and reliable assessments, compared to traditional “pen and paper” survey techniques.
1. Introduction
Public space lighting (PSL), if adequately designed, promotes the feeling of safety (FoS), increases comfort, defines spaces, and forms neighborhood identities [1]. However, if excessive or misdirected, PSL leads to energy waste, increases greenhouse gas emissions [2,3], and poses non-negligible threats to human health [4,5,6,7] and natural ecosystems [8,9,10]. The relation between urban residents and their physical environment is a major field of study in environmental psychology [11,12]. According to the Theory of Place (ToP), residential satisfaction results from gratification associated with living in a specific place [11], and involves cognitive, affectional and behavioral components [13,14,15,16,17]. An important component of this gratification is feeling safe outdoors. Studies have shown that the percent of people who feel safe drops significantly after dark, as fear increases when visibility is impaired, and fewer people are around [18,19]. This fear often stems from the fact that reduced visibility provides offenders with more opportunities for concealment and makes it harder to identify escape routes [20].
The essential contribution of artificial lighting to FoS in urban areas has been emphasized in several studies [21,22,23,24,25,26,27,28]. In particular, studies have shown that PSL may affect FoS by improving visibility and reducing concealment. As Peña-García et al. [25] conclude, well-illuminated streets, where lighting is uniform and illuminance levels are high, make people feel comfortable and safe.
Although it is well established that people’s concerns for personal safety increase at night, and good street lighting is a way of improving FoS [18,19,25,29], the relation between FoS and PSL needs further investigation. The main limitation of most previous studies is that they were carried out in controlled or laboratory conditions, thus, being unable to account for complex environmental conditions, such as the presence of traffic and other pedestrians, weather and vegetation [20,30,31,32]. Furthermore, most previous studies of FoS-PSL association involved a relatively small number of research subjects and evaluated a relatively small number of illumination sources, thus, falling short of representing diverse real-world urban settings, multiple lighting sources, larger populations and population subgroups [1,33].
This study attempts to address the above-mentioned drawbacks and, specifically, answer the following two main questions:
- (a)
- What levels of public space illumination do people actually need to feel sufficiently safe at nighttime in an urban environment?
- (b)
- Do these minimal illumination levels differ across different urban settings?
2. Materials and Method
The study employs an interactive, user-oriented, approach, according to which observers assess in-situ various PSL attributes and report their FoS using a specially-designed mobile phone application. In parallel, the same PSL attributes are instrumentally measured at the same sites. Next, the association between the reported FoS assessments and the measured lighting attributes is examined and modelled using multivariate statistical tools. These study phases are presented in Figure 1 and elaborated in the following subsections.
2.1. Selection of Survey Sites
The study was carried out in three cities in Israel—Tel Aviv-Yafo, Haifa and Be’er Sheba—which differ by population size, climatic conditions and socio-economic status (SES), but are similar in building typology and development patterns (Table 1). Tel Aviv-Yafo with about 450,000 residents, is the second largest city in Israel (after Jerusalem), followed by Haifa (285,000 residents) and Be’er Sheba (210,000 residents). Both Tel Aviv-Yafo and Haifa are onshore cities, located along the Mediterranean coast, which receives around 580–680 mm of annual rainfall. Concurrently, Be’er Sheba is an arid city, located inland and characterized by rainfall scarcity, rarely clouded sky and sparse vegetation (Table 1).
At each city, survey sites were selected using a 2 × 2 factorial design, to cover four most typical cases of outdoor illumination:
- (a)
- High illumination level with a predominant short wavelength (“blue”) light spectrum;
- (b)
- Low illumination level with a predominant short wavelength (“blue”) light spectrum;
- (c)
- High illumination level with a predominant long wavelength (“red”) light spectrum, and
- (d)
- Low illumination level with a predominant long wavelength (“red”) light spectrum.
Outdoor lighting with predominant emissions in the short wavelength (“blue”) part of the light spectrum may bring economic benefits, as it minimizes energy waste, while preserving visual performance in places where low-illuminance levels are needed [35]. Nevertheless, empirical evidence about the adverse impacts of such lighting on circadian rhythm and melatonin secretion in wildlife and humans cannot be ignored [36,37]. Concurrently, health and ecological impacts of exposure to the long wavelength (red) part of the light spectrum appear to be less severe [38,39].
In each city, site selection for the field survey was carried out using the latest satellite images, taken from the International Space Station by a Cannon still camera with a 200/400-mm focal length. This camera separately records light emissions in the red, green and blue (RGB) bands by using different color filters [40].
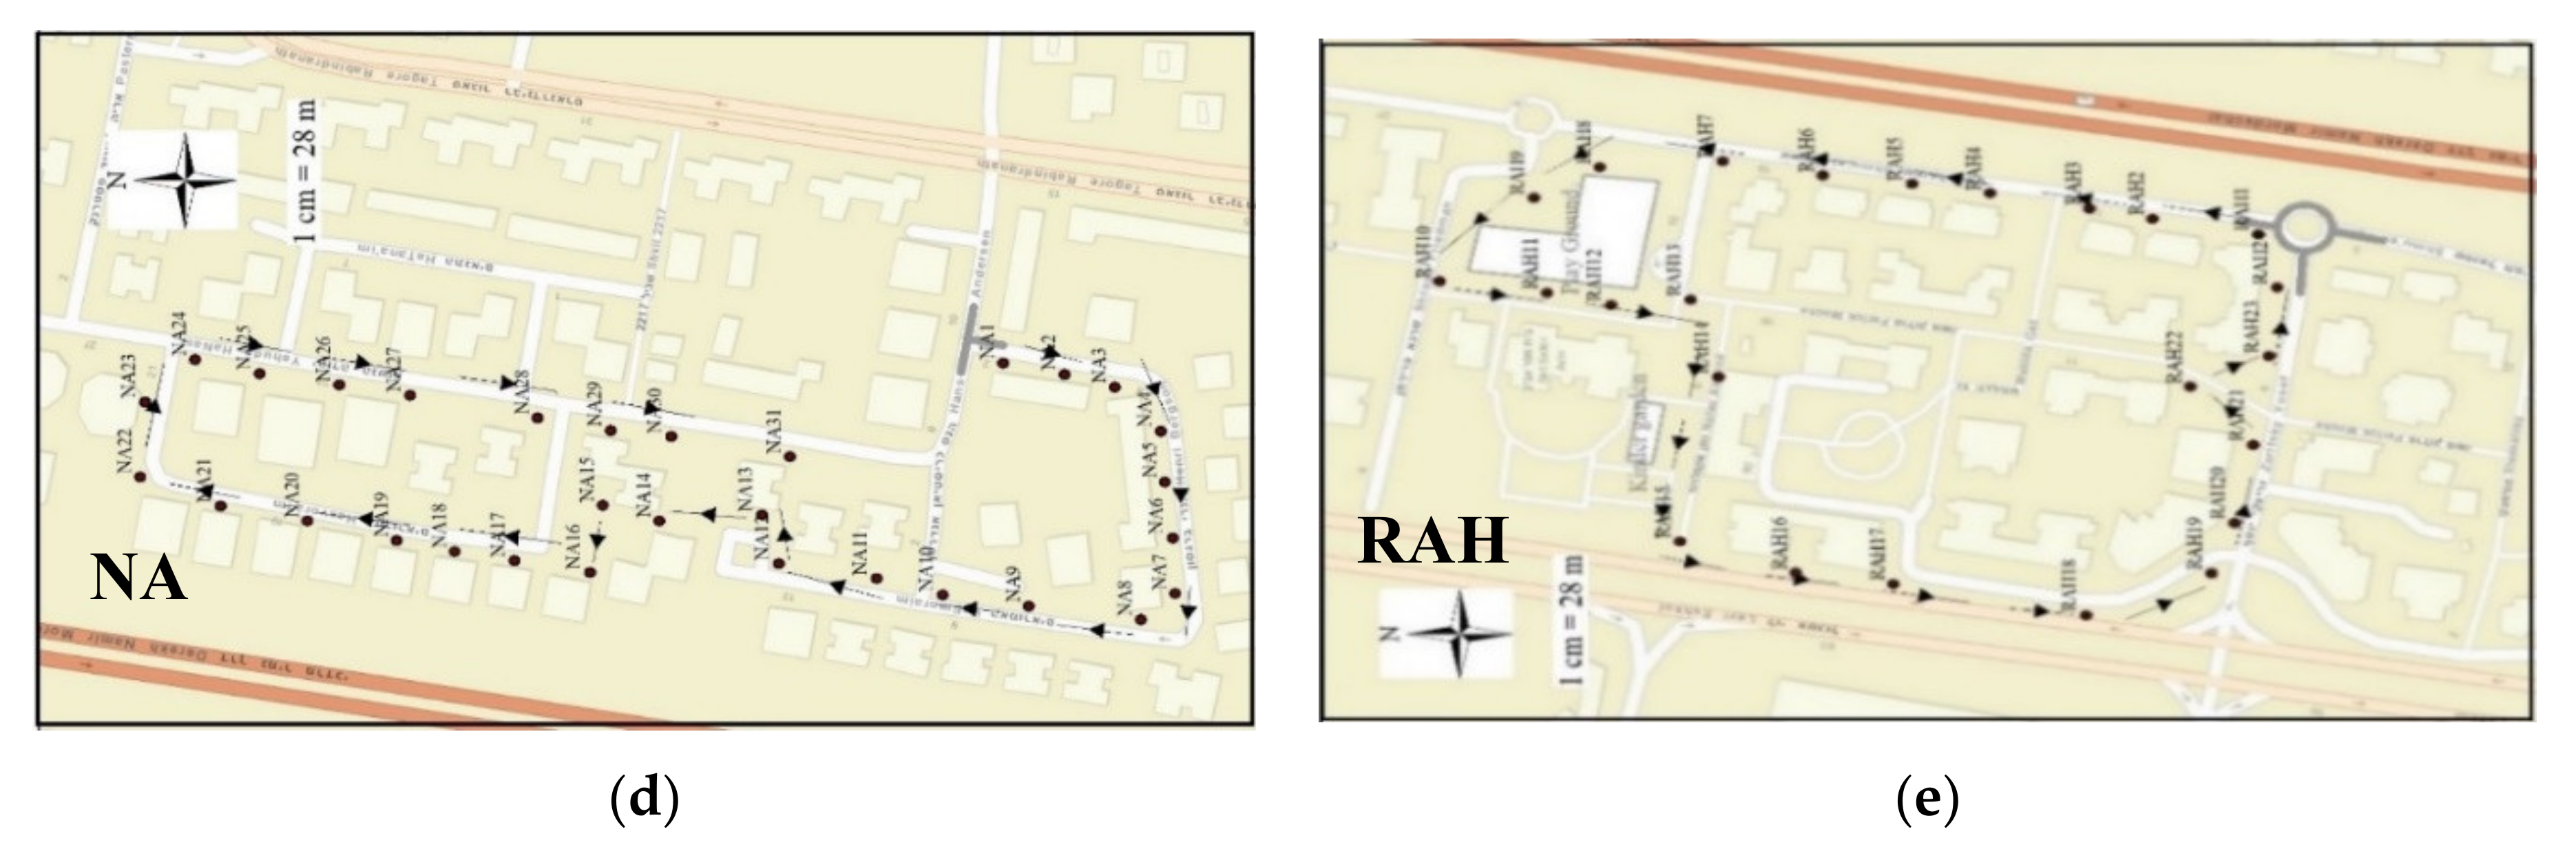
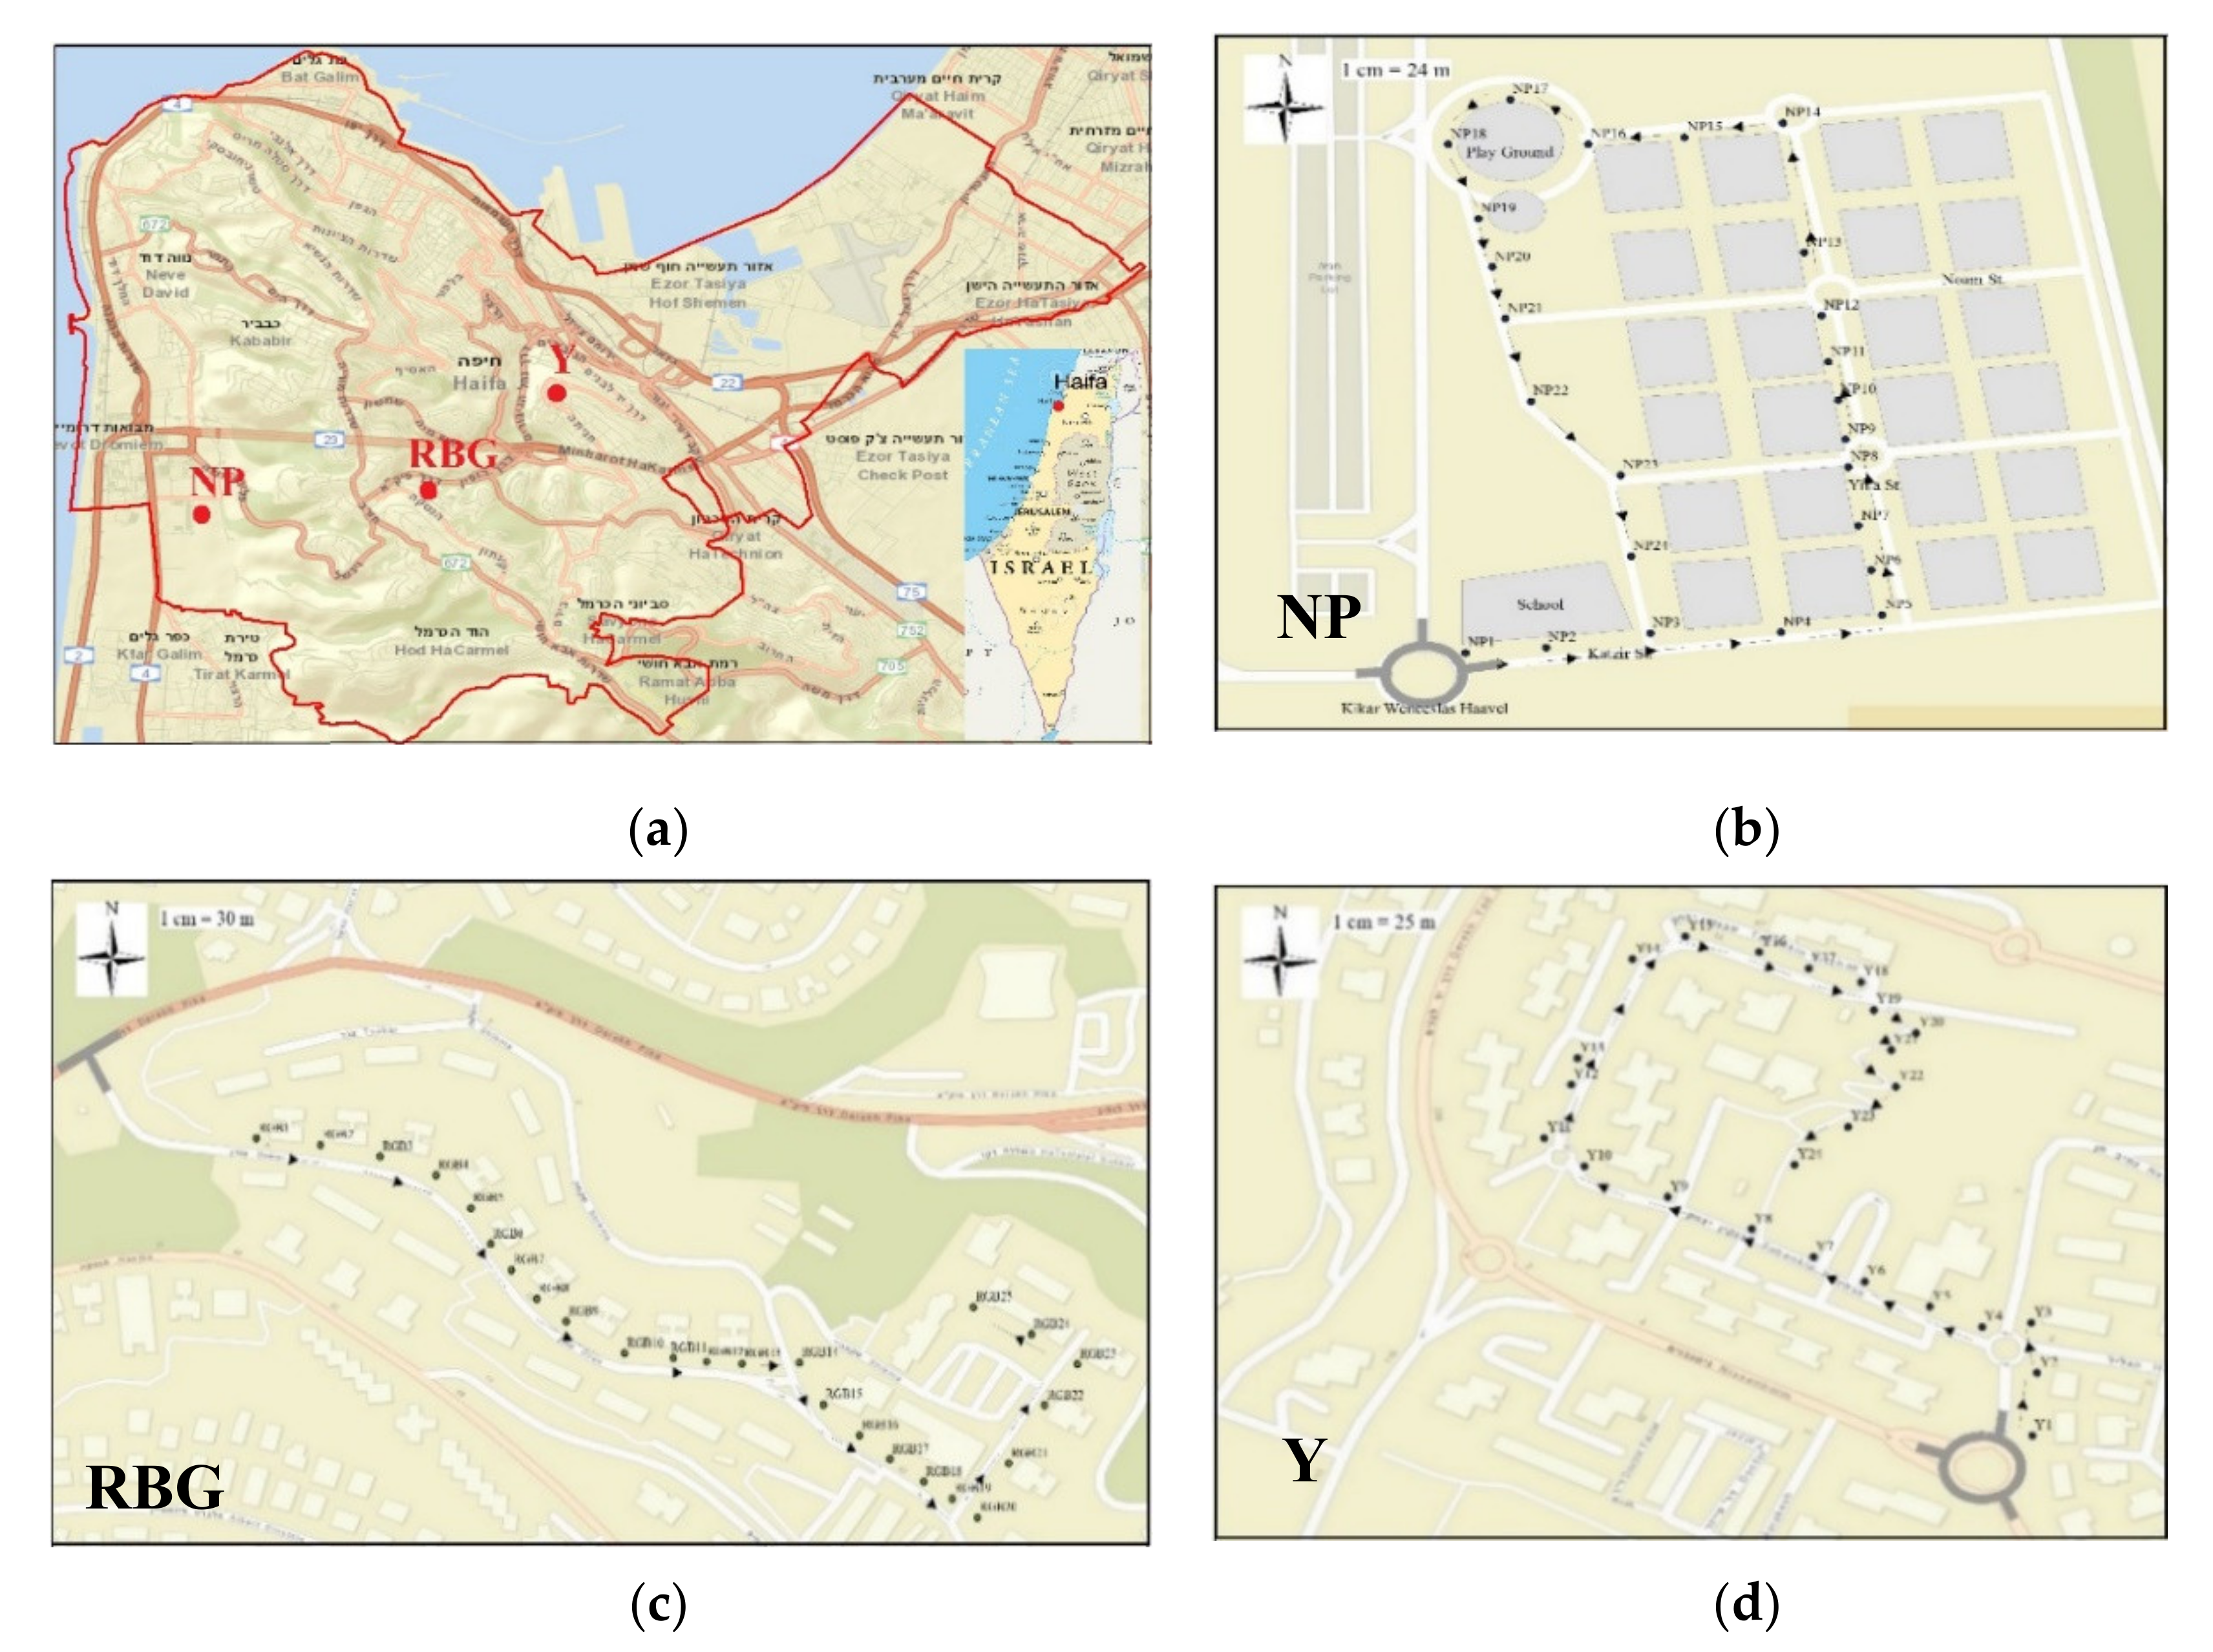
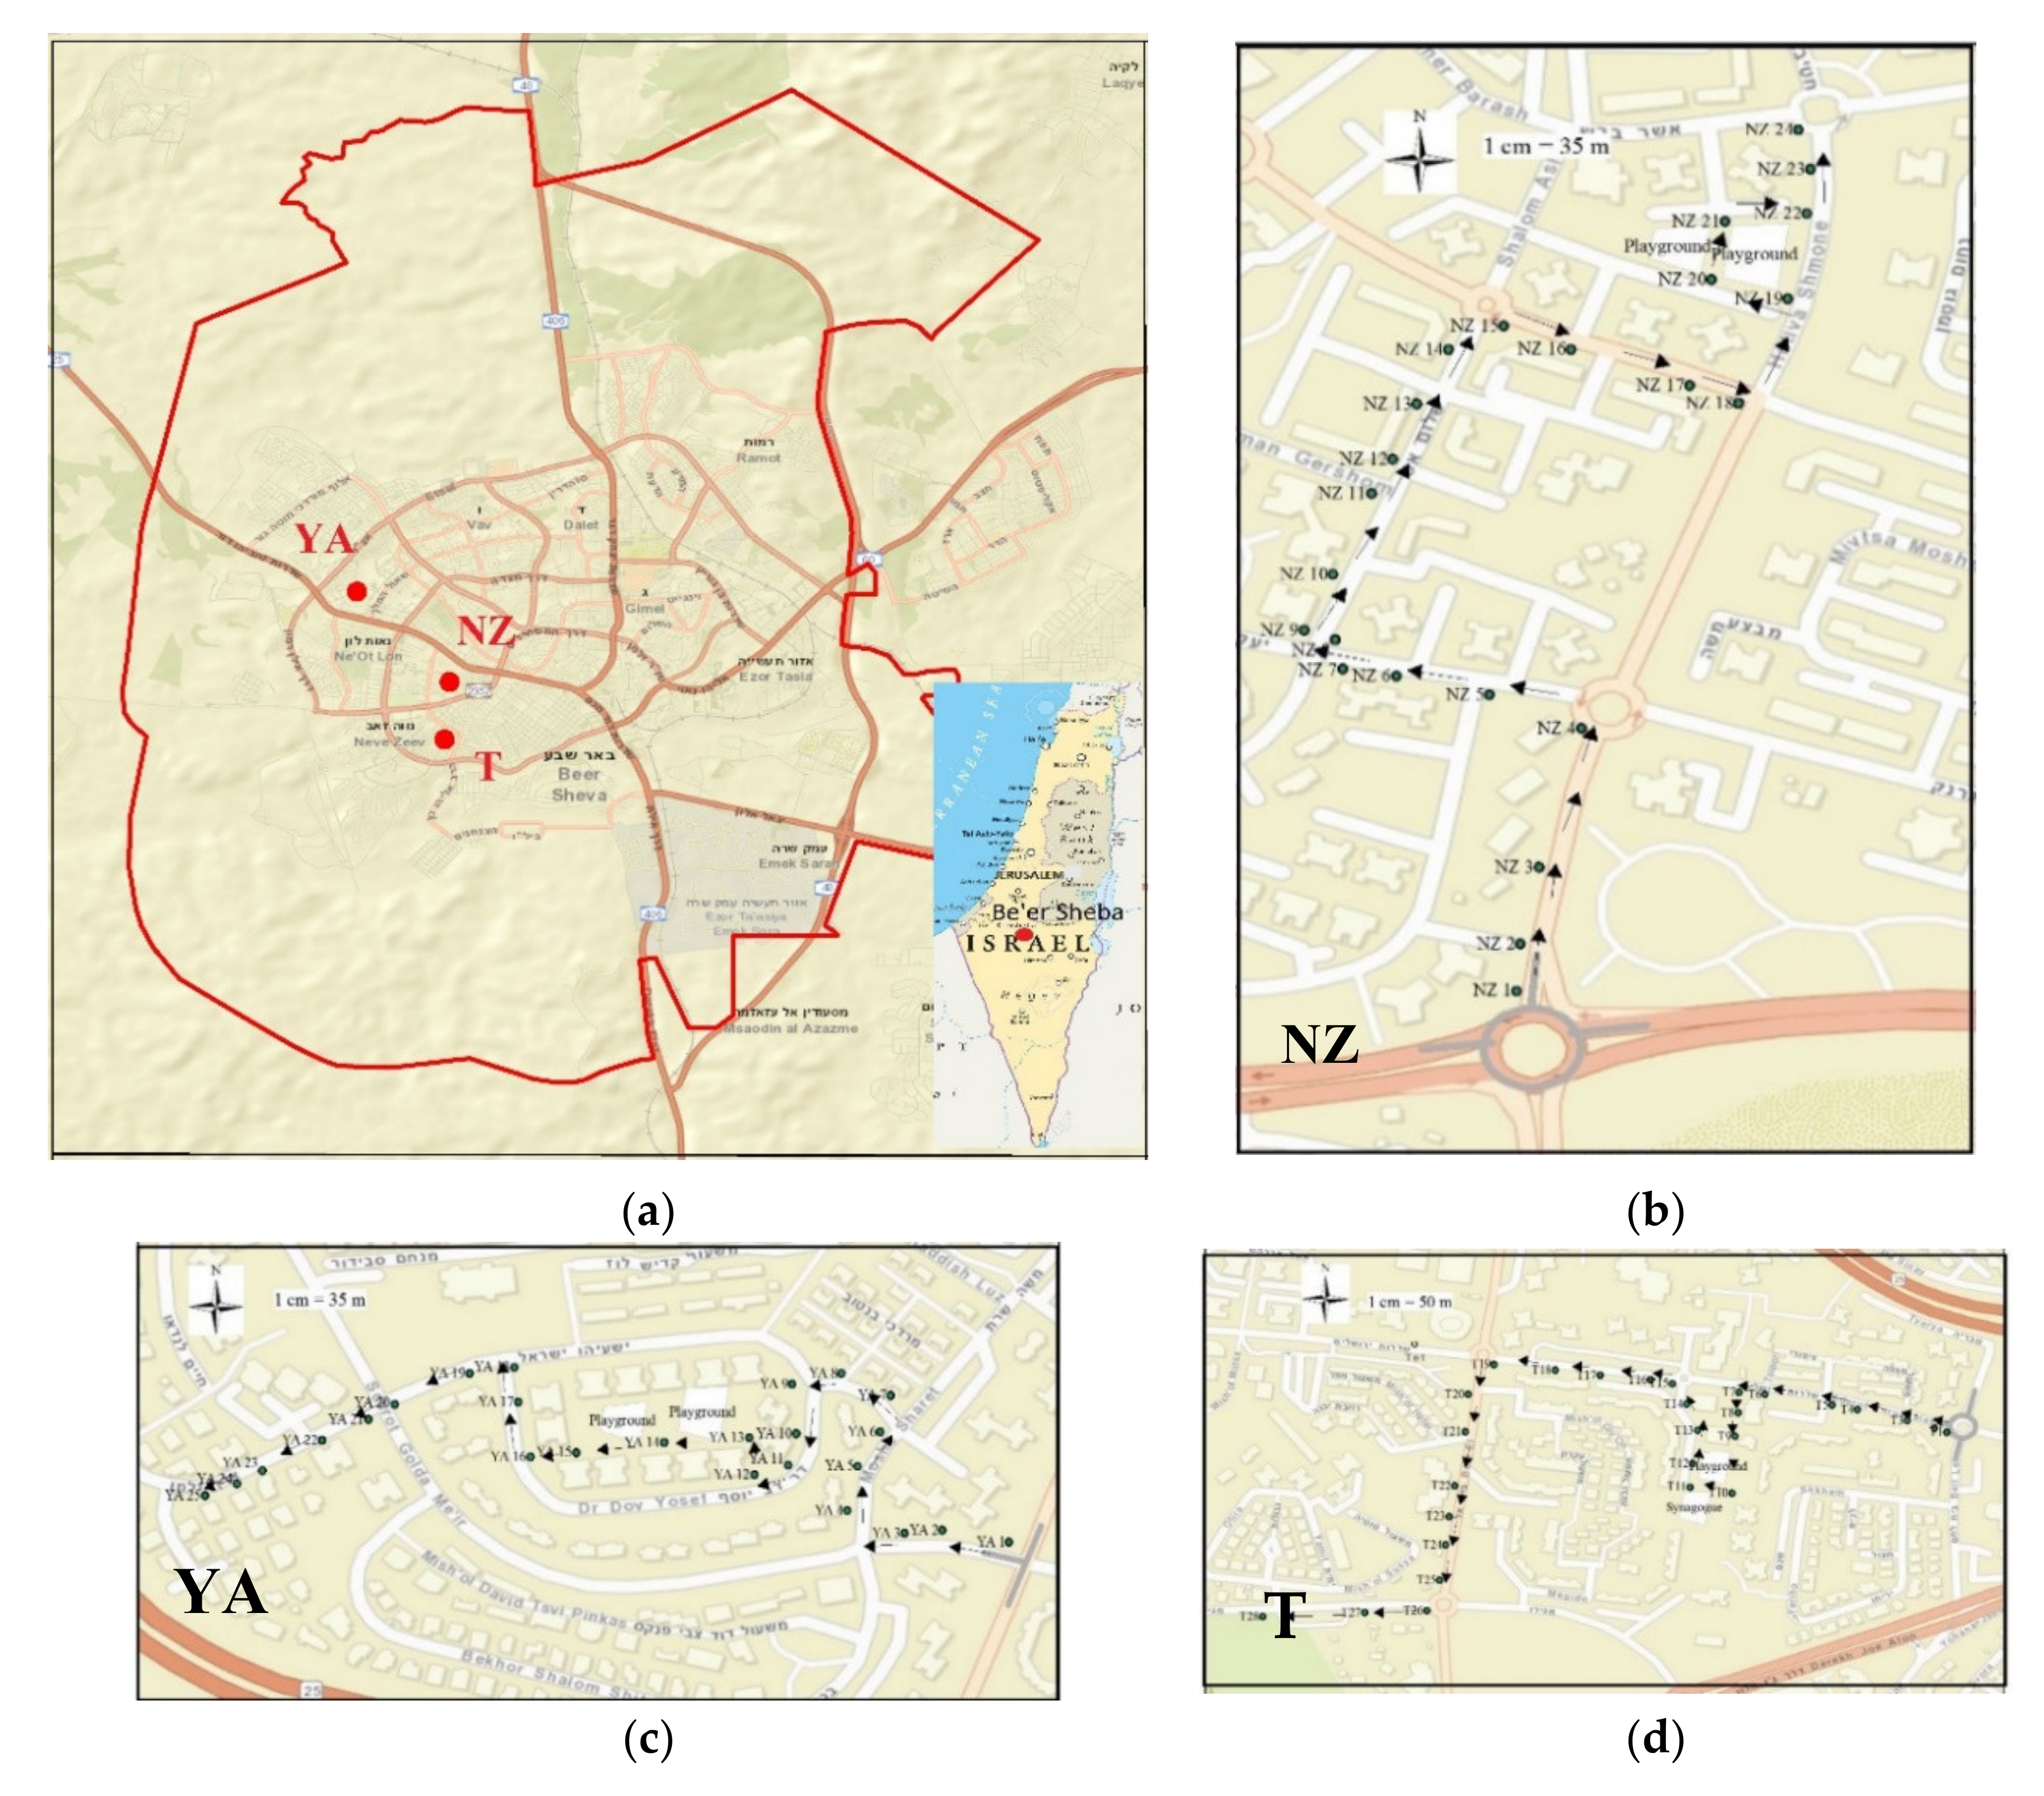
To ensure the applicability of the study results for future practices, we added several additional criteria for survey sites selection: urban area type, building typology, buildings’ age, SES, and main land use. First, we selected predominantly residential areas with multi-story buildings constructed in the past two decades, which represent typical examples of present-day urban housing typology in Israel. Next, we selected neighborhoods with as similar as possible SES, based on the latest available information (see Appendix A). We also excluded residential sites with large-scale, and/or heavily lit, commercial land uses, which may attract multiple visitors and consequently alter personal FoS. The screening process yielded 10 neighborhoods: Four neighborhoods in Tel Aviv-Yafo, three in Haifa, and three in Be’er Sheba. Appendix A reports basic development indicators and light characteristics of each neighborhood, while Figure 2, Figure 3 and Figure 4 present street maps of the neighborhoods and their geographic location in the cities’ boundaries. Additionally, Figure 5 illustrates the neighborhoods’ lighting environment during nighttime.
2.2. Selection of Survey Routes
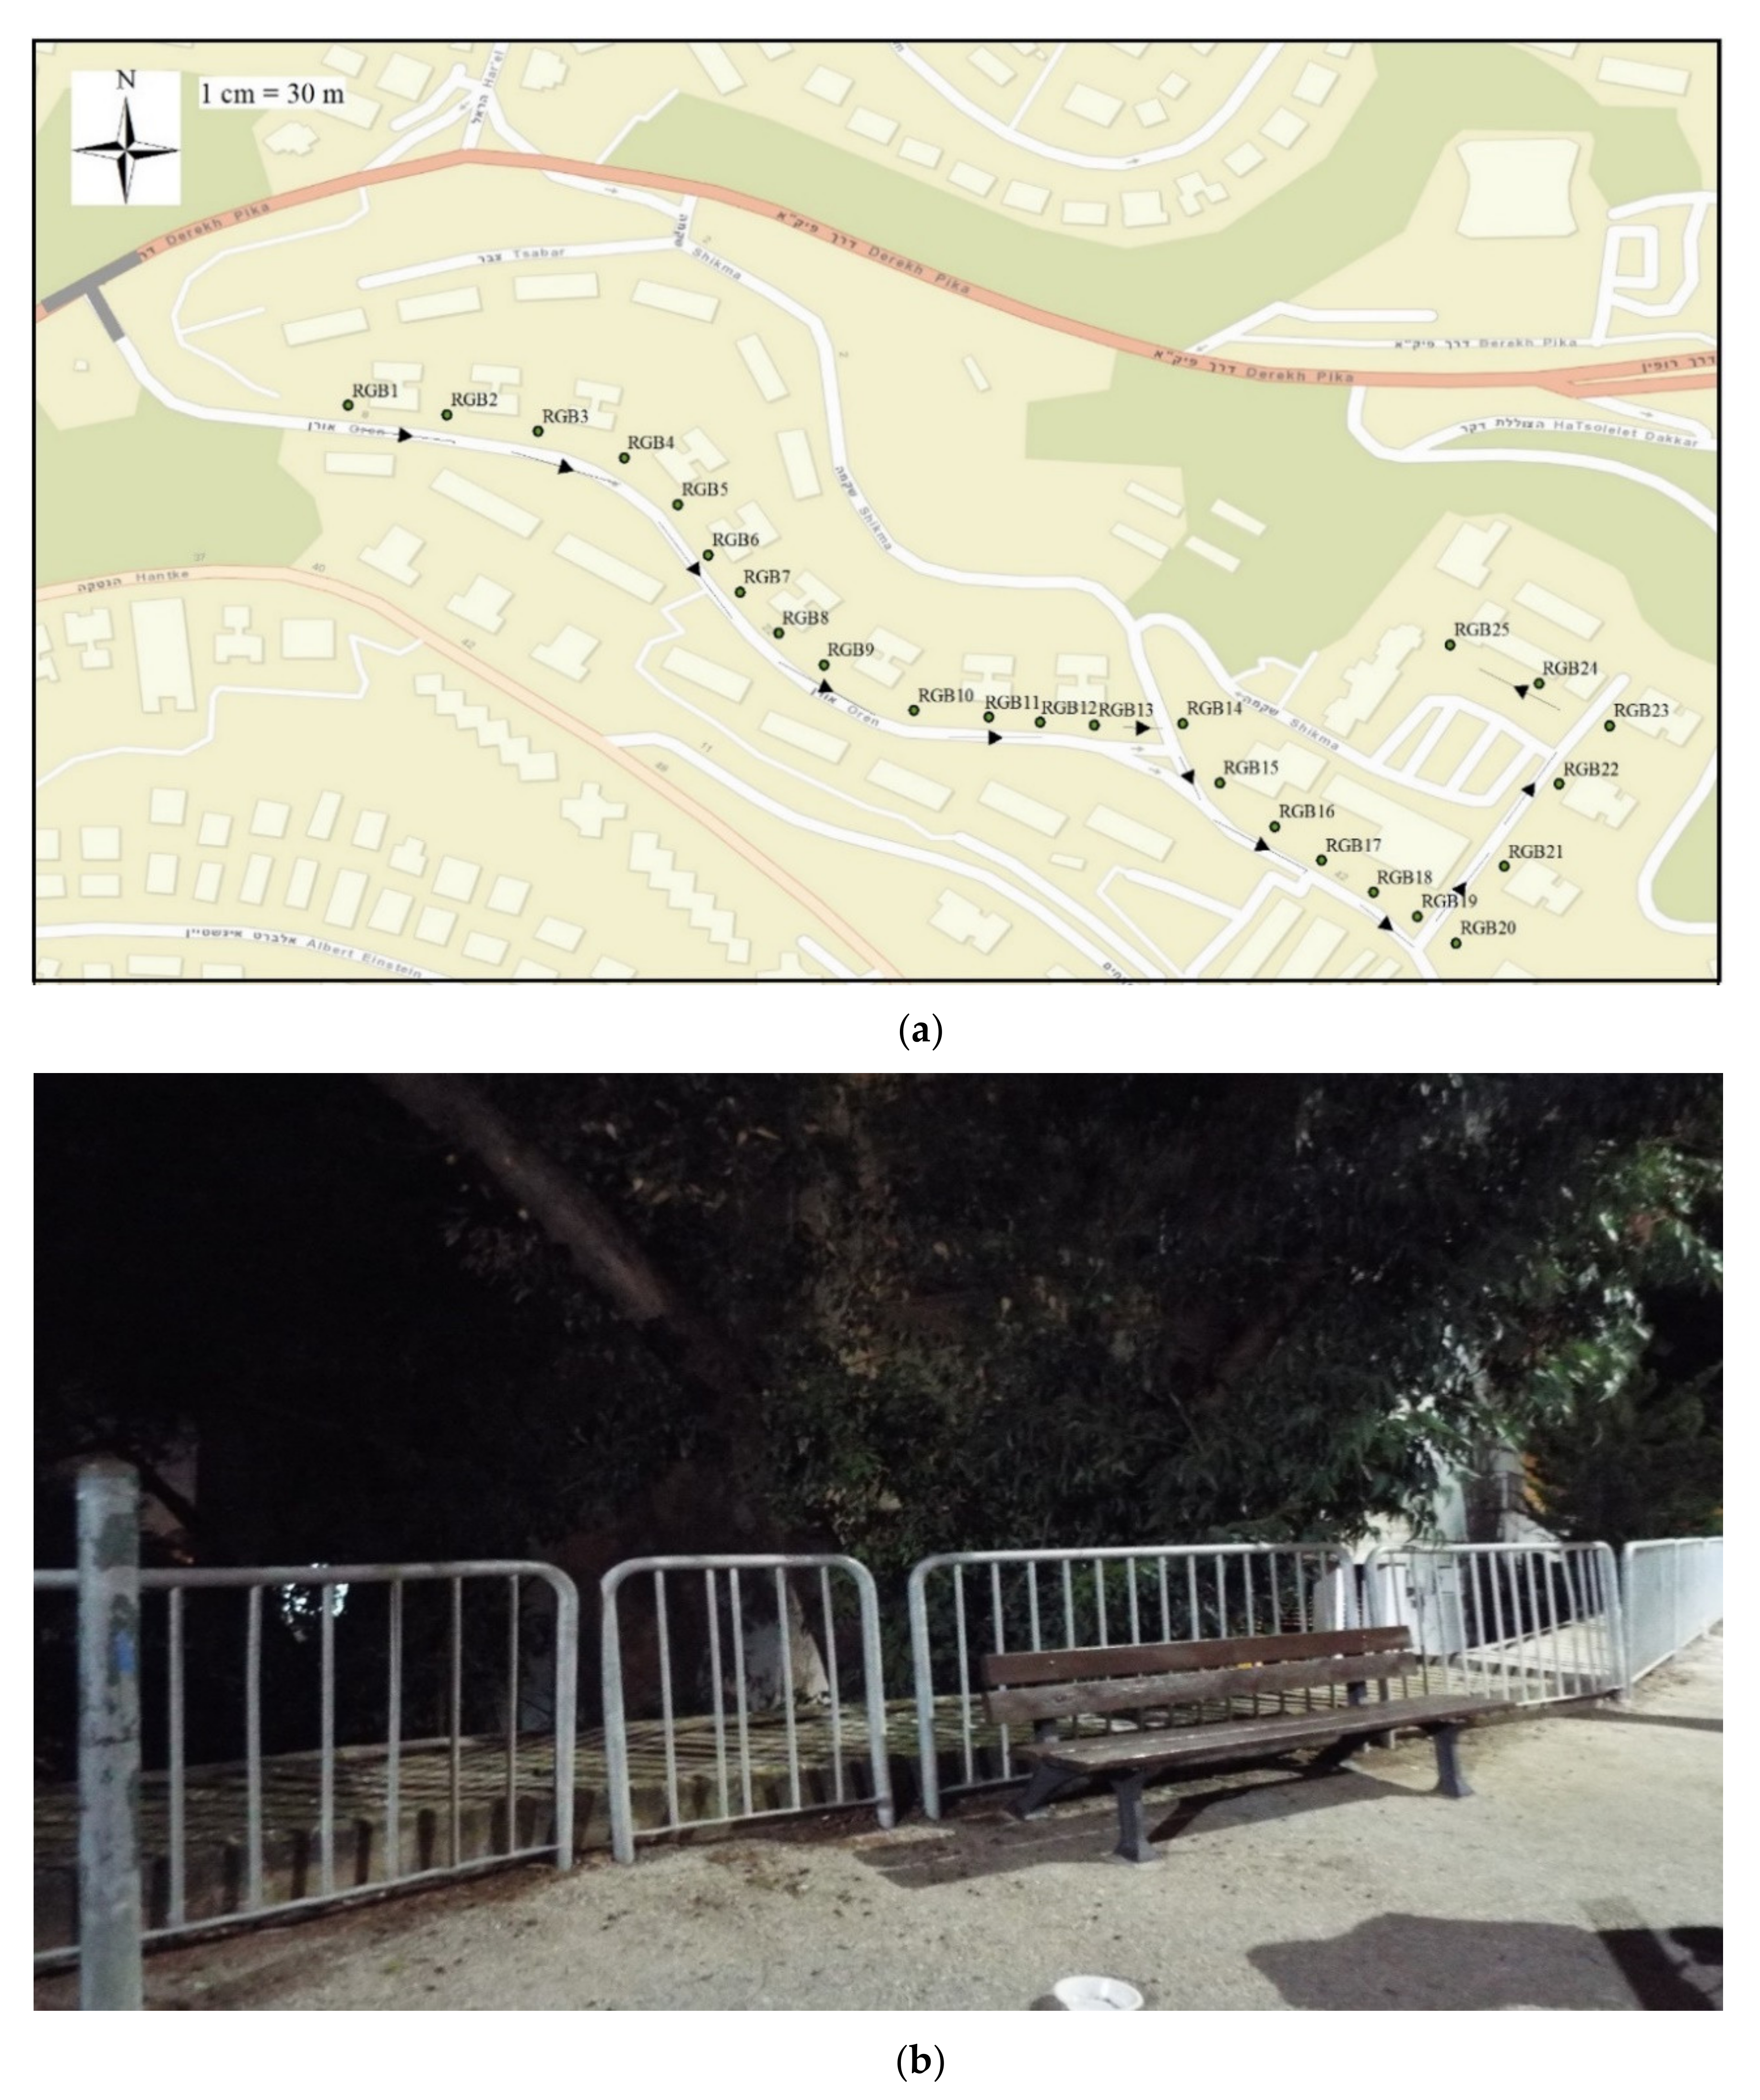
In each neighborhood, a pedestrian route, stretching for about 800–1000 m, was designed to cover main and secondary streets, as well as open spaces, such as children playgrounds and parks (if present). Along the sidewalks of each route, about 20–30 survey points were selected at intervals of 20–30 m from each other (see Figure 2, Figure 3 and Figure 4). Altogether, 257 reporting points were selected in 10 neighborhoods. To represent typical PSL along each route, survey points were located at least 10 m away from “atypical” local light sources, such as spotlights or color lamps found in private gardens and individual apartments. In order to facilitate the identification of survey locations by the observers (see Section 2.5), all points were located, where possible, next to local landmarks, such as road signs, lampposts, fire hydrants, staircases or garbage cans (see Appendix B for an example of a description of a typical survey route provided to the participants).
2.3. Instrumental Measurements
Following the International Commission on Illumination (CIE) nighttime illumination measurement methodology and the CIE13201-4 measurement guidelines [41], the following types of measurements (Lux) were performed at each survey location:
- Point horizontal measurements were taken at the ground level, while positioning the light-meter horizontally above the ground. It should be noted, that although during the measurements, the measurement device was kept close to the ground, it was elevated by up to 300 mm to a horizontal position, as ensured by a level.
- Point vertical directional measurements were taken in the walking direction towards the next measurement point along the survey route, at the height of 1.5 m above the ground, as a forward-facing vertical measurement of the illumination of the face of the observer.
- Point vertical panoramic measurements of lit surfaces facing the observer were taken at the walking direction to the next point along the survey route, at intervals of about 30°, to cover an angle of about 120°. Measured values were averaged into a single value of wide-angle directional illuminance to represent the level of panoramic illumination of the observer’s face at a given measurement point.
Measurements were performed using a Konica-Minolta CL 200A Chroma-meter [42]. To ensure comparability, all measurements were conducted under clear weather on weekdays, starting at least half an hour after dark and ending before 24:00.
2.4. Mobile Phone Application Used for the Survey
A mobile phone android application—CityLightsTM (Figure 6)—was developed ad hoc for the survey and uploaded on the Google Play Store. The application could only be accessed by participants who were recruited, registered and authorized by a professional survey agency (see Section 2.5). Authorized observers could use the application, as elaborated below, by first entering their nine-digit IDs into the entrance screen (Figure 6a).
To avoid a misalliance between the locations of instrumentally measured points and points assessed by the observers, the application was designed to operate only at the designated survey points (Figure 2, Figure 3 and Figure 4). To assist in locating the exact spot, we provided observers with detailed guiding instructions for each route (see Appendix B for an example of instruction pages for a selected survey route). The accuracy of the observer’s position was assured by the mobile phone’s GPS and automatically compared by the CityLightsTM app with the location of the designated point. If an observer was off a designated point, the application did not allow to perform the assessment. As confirmed by the post-survey assessments, the accuracy of the observers’ positioning was 12 ± 3.4m, which is within normal limits of mobile phones’ GPS accuracy [43], thus, indicating that the observers reported from the designated locations.
To enable the use of the application within the desired time-frame, it was designed to operate only from 30 min after sunset until 24:00 (Figure 6a). To avoid duplicate assessments, each observer was allowed to perform assessment only once at any given route, either before 20:00 or after 20:00, which represent early and late evening hours. To avoid interference, observers were instructed to arrive at a particular survey route and conduct the assessments alone, without being accompanied by any other person, and only at a particular time-frame designated in advance.
After entering the app, the observer was asked, at each survey point, to use a 4-point scale, also known as “forced” Likert scale, to assess four light attributes, FoS and overall comfort, using the following scales. The decision to use such a scale was based on accumulated knowledge which indicates that the absence of a “neutral” option forces an observer to make a definite assessment [44]. The particular scales used for assessing different parameters were as follows:
- (a)
- Illuminance (0- very weak;1—reasonable; 2—good; 3—too strong);
- (b)
- Light temperature (0—too cold;1—a bit cold; 2—a bit hot; 3—too hot);
- (c)
- Light uniformity (0—non-uniform; 1—slightly non-uniform; 2—quite uniform; 3—very uniform);
- (d)
- Light glare (0—not glaring; 1—slightly glaring; 2—quite glaring; 3—very glaring);
- (e)
- Feeling of safety (0—feel very unsafe; 1—feel little unsafe; 2—feel reasonable safe; 3—feel very safe).
- (f)
- Overall lighting quality (0—uncomfortable; 1—slightly uncomfortable; 2—quite comfortable; 3—very comfortable).
The application transmitted real time assessments to a designated cloud server, from which the information was subsequently downloaded for the analysis. In addition to reporting through the app (see Section 2.4), observers were requested to fill in a short questionnaire on their individual characteristics, such as age, gender, education, place of residence, and ethnic background.
Following our focus in this paper on FoS-PSL association, only illuminance (Question 1) and FoS parameters (Question 5) were used in the following analysis as independent and dependent variables, respectively. Other parameters, i.e., overall lighting quality, light temperature, glare and uniformity—are meant to be investigated in follow up studies.
2.5. Survey Participants
Observers were recruited by Dialog Ltd. agency, specializing in sociological surveys and research [45]. In each investigated city, the group of observers was comprised of residents and non-residents, representing the local population in terms of age and gender. A total of 106 observers participated in the survey, assessing 257 survey points, at different hours of the evening, in 10 neighborhoods. Thirty-six observers performed assessments in Tel Aviv-Yafo, forty-three in Haifa, and twenty-seven in Be’er Sheba. The survey started in August 2019, and its results (7255 individual assessments) were downloaded from the application server on October 29th, 2019, for future processing. Table 2 reports descriptive statistics of the research variables.
2.6. Statistical Analysis
For each point, FoS data were averaged (Total = 257) and matched with instrumentally measured PSL attributes (see Section 2.3). To reveal the association between FoS levels—used as a dependent variable—and instrumentally measured illuminations levels and several locational confounders (city, vegetation density and traffic intensity), the following generic equation was used:
where FoSi is an average FoS assessment of survey point i; ILji is a vector of j illuminance measurements (point horizontal, point vertical directional, and vertical panoramic), taken at point i (see Section 2.3); VDi—vegetation density, assessed by the researchers on a 3-point scale (0—trees and shrubs that do not obscure street lights; 1- trees and shrubs partially obscuring street lights; and 2—trees and shrubs significantly obscuring street lights); TIi—traffic intensity during experimental measurements assessed by the researchers on a 3-point scale (0—less than five vehicles in 15 min; 1—5-10 vehicles in 15 min; and 2—more than 10 vehicles in 15 min); and εi—random error term.
FoSi = b0 + b1 · ILji + b2 · VDi + b3 · TIi + εi,
It should be pointed out, that empirical literature comments on vegetation as a factor framing the view [46,47,48], while traffic is known to affect FoS in two ways: by car headlights contributing to dynamic street lighting, and by cars at night perceived by pedestrians as a source of danger [49]. Therefore, these two factors were considered in the present analysis as potential confounders.
To monitor the degree of multi-collinearity between the explanatory variables, we used the variance inflation factor (VIF), and did not simultaneously introduce into the model’s variables for which VIF exceeded a predefined threshold (VIF > 3.0) [50]. Although different combinations of control variables were tested, only the best performing models are reported in the following discussion. The analysis was performed in the SPSS 25.0TM software [51].
3. Results
3.1. General Trends
Table 2 shows that, on the average, the illumination levels in the survey neighborhoods are close to the illuminance level of 15 Lux, recommended by CIE (2010), reaching about 18.52 Lux for point horizontal measurements; 11.92 Lux for vertical panoramic measurements, and 11.37 Lux for vertical directional measurements. The reported average FoS level in the surveyed cities is also relatively high—1.89 points on a 4-point scale, in compare to the average on the adopted scale (1.5 points).
3.2. Association between FoS and Illumination Levels
Table 3 reports results of a non-parametric Mann–Whitney U-test that compares FoS across differently illuminated areas. As the table shows, significant differences in FoS levels are present in respect to both mean and median breakdowns of the illumination levels (M-W > 3200, p < 0.01), thus, indicating that FoS assessments tend to be significantly higher in well-illuminated locations than in poorly illuminated ones.
3.3. Multivariate Analysis
Table 4 and Table 5 report regression models linking different illumination measures with FoS. Table 4 reports bivariate regression, based on original and logarithmically transformed values of the illumination variable, while Table 5 features multiple regression models, into which city dummies, vegetation and traffic density are introduced as controls.
As Table 4 shows, among the models based on the three illumination measurements—point horizontal, point vertical directional, and point vertical panoramic—the model incorporating point-horizontal measurements provides the best results, as indicated by model fit and generality (R2 = 0.13, F = 36.65 in Model 1A vs. R2 = 0.05, F = 12.11 in Model 1B and R2 = 0.11, F = 30.14 in Model 1C). The logarithmic transformation of the original illumination scale further improves the model fit and generality, raising them to R2 = 0.32 and F = 117.73, respectively (see Model 1D). This model improvement indicates that the relationship between FoS and illumination is, in fact, non-linear.
Characteristically, in all models, FoS was found to be significantly and positively related to illumination (B = 0.02, t = 6.05, p < 0.01; Model 1A and B = 0.58, t = 10.85, p < 0.01; Model 1D), indicating that the observers perceive areas with higher illumination as safer. However, the observed improvement in the model fit, attributed to the logarithmic transformation of the illumination variable, indicates that there are diminishing FoS returns, as increasing illumination to high levels leads to smaller and smaller improvements in FoS.
Multiple regression models, reported in Table 5, leave the linkage between FoS and illumination generally unchanged (B = 0.53, t = 9.93, p < 0.01 in Model 3 vs. B = 0.51, t = 10.21, p < 0.01 in Model 4), but control variables in the latter model—city, traffic and vegetation density—emerge in this model as statistically significant (p < 0.01). In particular, as Model 4 shows, all else held equal, traffic increases the average FoS level by 0.23 points on a 4-point scale (B = 0.23, t = 3.18, p < 0.01; Model 4), while obscuring vegetation decreases it by of 0.28 points (B = −0.28, t = −3.96, p < 0.01; Model 3).
City dummies in Model 4 (see Table 5) are also statistically significant (p < 0.01), but appear to have different directions, being positive for Haifa (B = 0.32, t = 2.76, p < 0.01) and negative for Be’er Sheba (b = −0.42, t = −3.79, p < 0.01). This indicates that when all other factors held equal for a given level of illumination, the observers tend to feel safer by about 0.3 points in Haifa than in Tel Aviv-Yafo (the reference city in the analysis), and by 0.4 points less safe in Be’er Sheba than in Tel Aviv-Yafo.
3.4. Model-Response Test
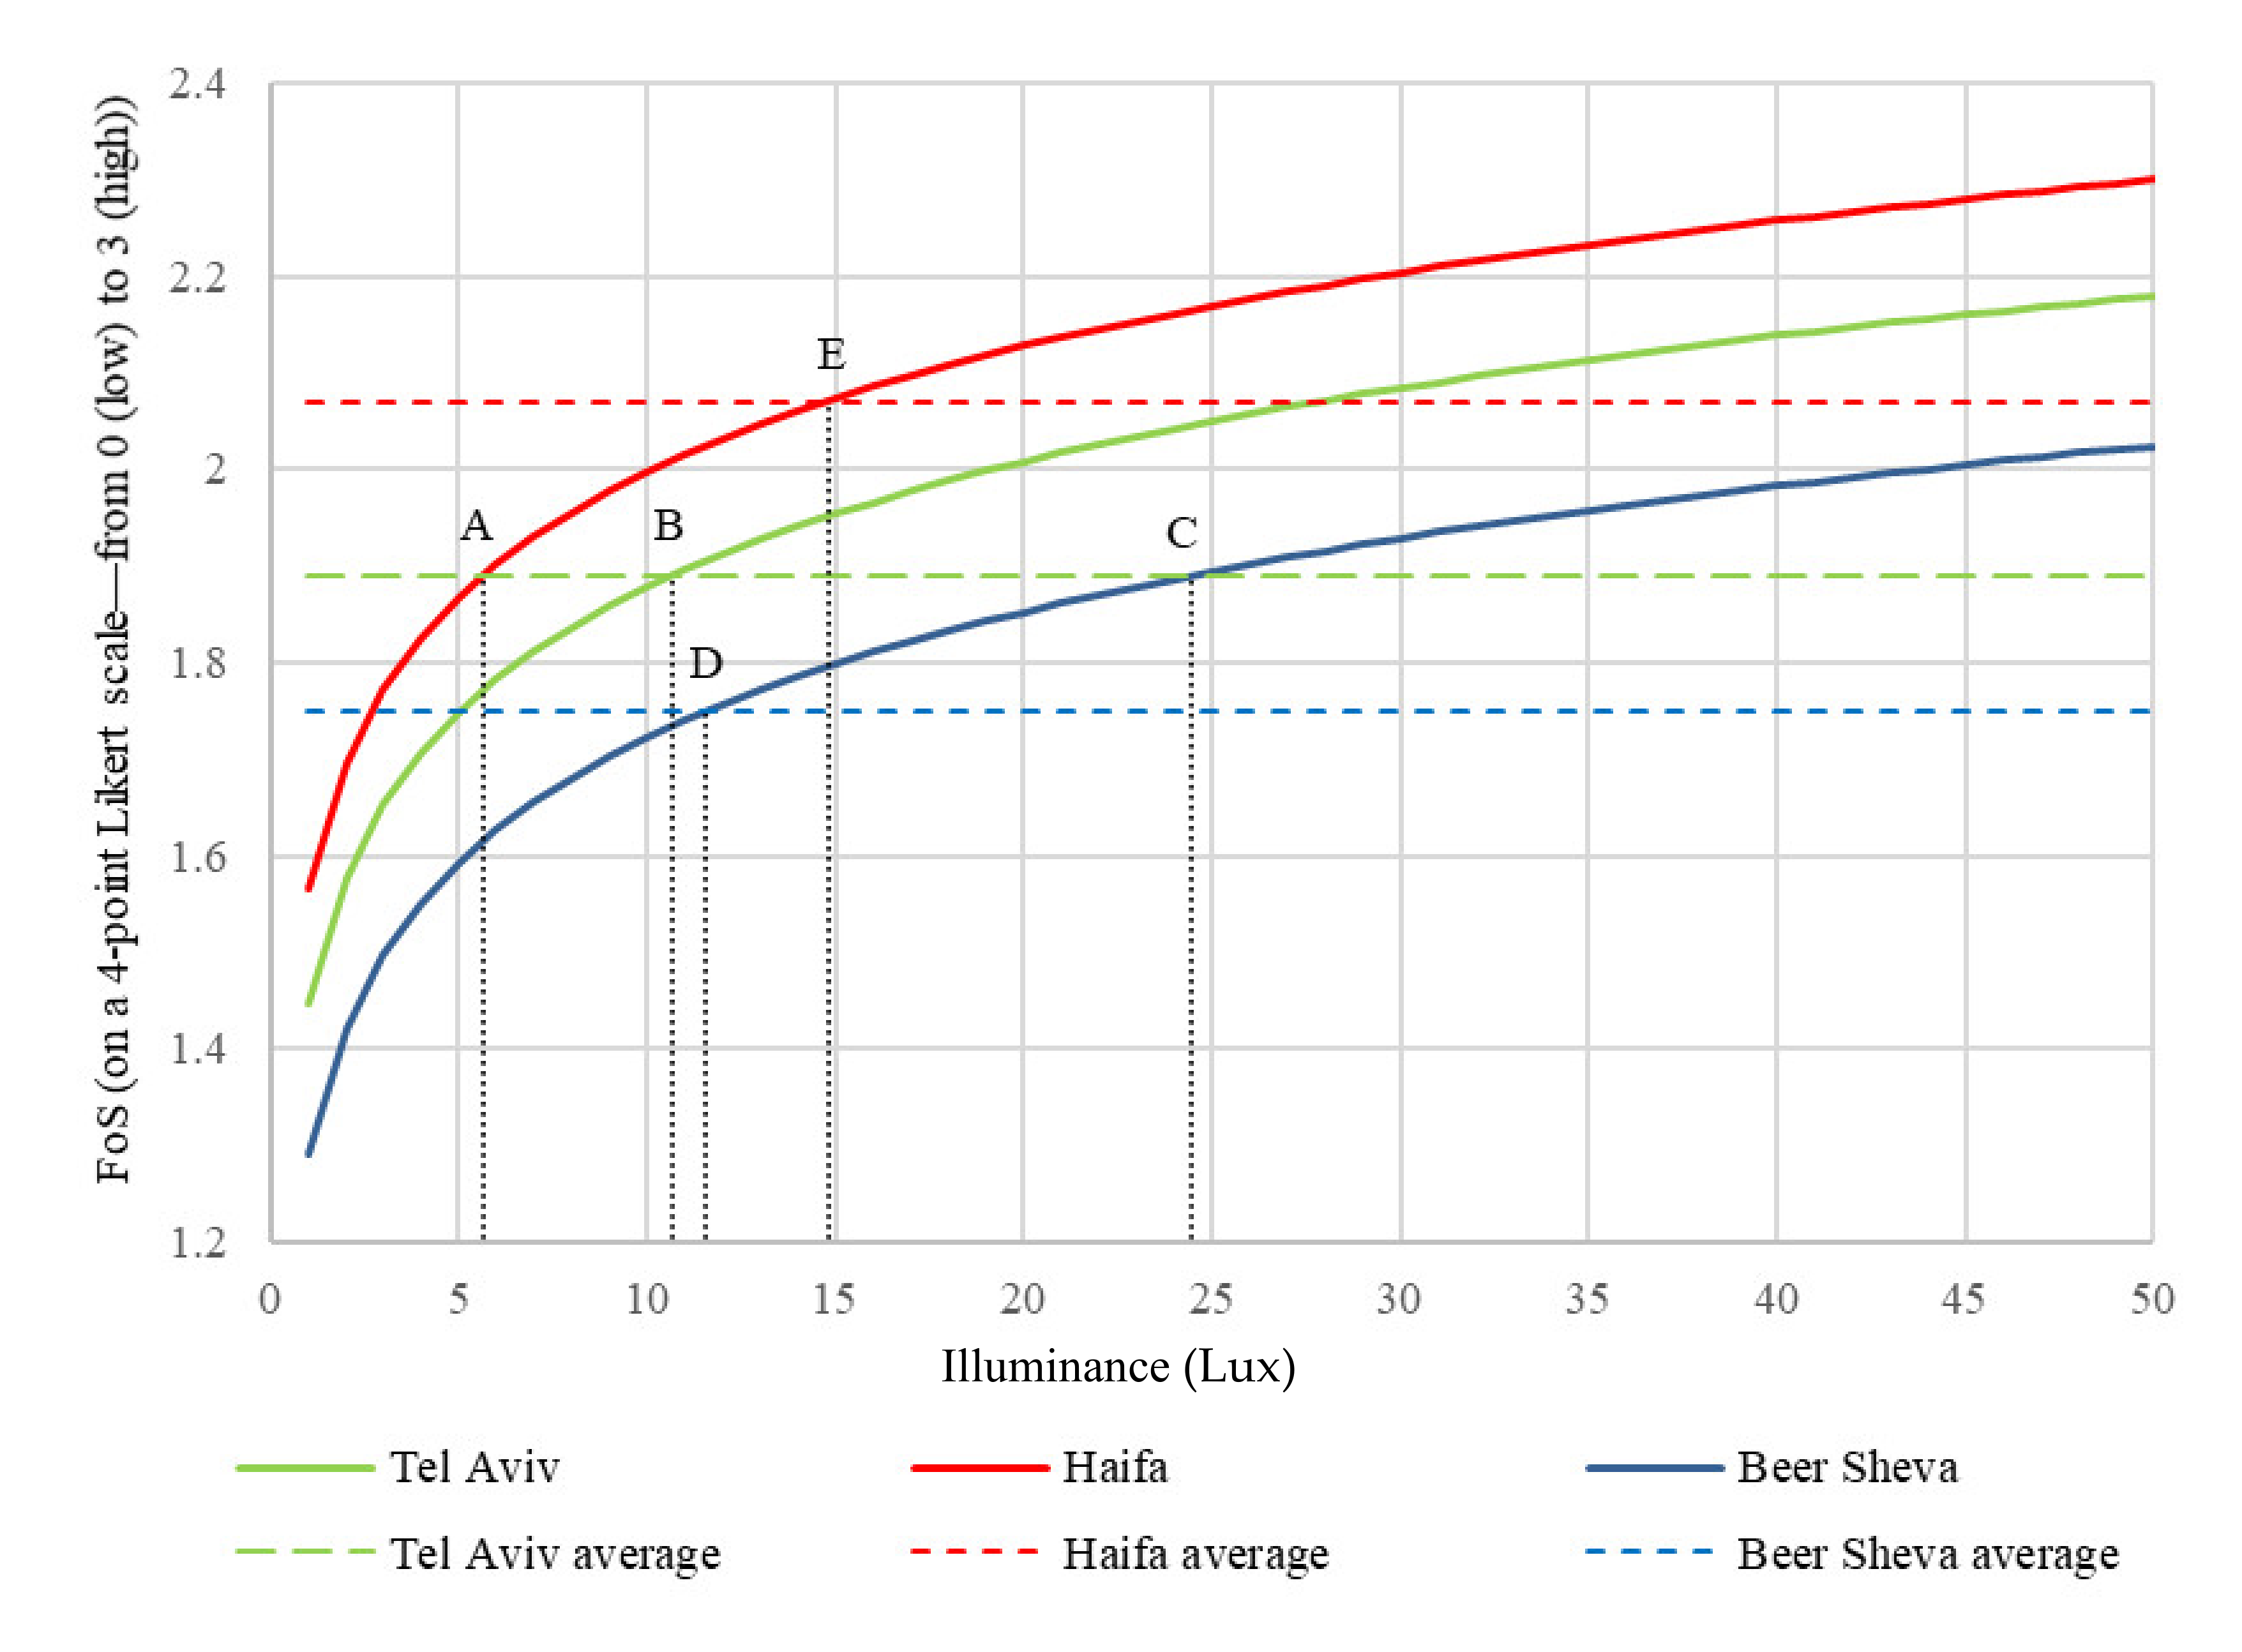
Figure 6 reports the results of model-estimated FoS-response test to plausible changes in illumination levels. This test is based on Model 4 in Table 5. To run this test, the values of all variables (except for illumination) were set to their average levels, while the level of illumination was allowed to vary in a plausible range, between 0 and 50 Lux.
As Figure 7 shows, to achieve the average FoS level of 1.89 observed in Tel Aviv-Yafo, the level of illumination, Eav, should reach 5.67 Lux in Haifa and 24.46 Lux in Be’er Sheba. Concurrently, to achieve the average FoS level of Haifa (FoS = 2.07), Eav in Tel Aviv-Yafo should reach 28 Lux and more than 50 Lux in Be’er Sheba. Characteristically, for all three cities, the simulation test shows leveling-off of the FoS response curves, which indicates declining FoS increments for higher levels of street illumination.
4. Conclusions and Discussion
Previous studies established that efficient and properly designed PSL can reduce energy waste, while making people feel safer [25,26,27,28]. However, as the present study shows, higher levels of illumination do not necessarily imply an equal rise in FoS. In particular, our analysis indicates that reasonably high assessment of FoS may occur at relatively low illumination levels of 5–10 Lux, and that increasing illumination levels beyond this threshold may result only in a minor rise in FoS levels.
This result confirms [52] that the conclusion “the brighter—the better” is a common misconception, which may lead to unnecessary energy waste. Various reports indicate that street lighting is one of the largest energy consumers, accounting for about 40% of outdoor energy consumption [53,54], and that energy efficient technologies and design can cut street lighting costs by 25–60% [55]. However, a tradeoff should be reached between a need to save energy and secure people’s FoS in urban areas, as poor lighting can create unsafe conditions, and consequently reduce the quality of life and residential satisfaction.
Differences between urban areas should also be considered. As the present analysis shows, the illumination level required by urban residents to feel safe after dark differs across urban areas. In particular, to achieve the same FoS level of 1.89 points on a 4-point scale, from 0 (Low) to 3 (High), observed in the entire sample, much higher levels of illumination appear to be required, other factors being equal, in the southern city of Be’er Sheba (24.46 Lux) than in the northern city of Haifa (5.67 Lux). These results correspond to recent findings of the ICBS’s [56] survey, according to which the percent of adults who feel unsafe while walking alone on the streets after dark is the highest in Be’er Sheba (24.6%), compared to 19.4% in Tel Aviv-Yafo and 15.7% in Haifa. These differences may be attributed to Be’er Sheba’s relatively low SES and somewhat higher crime rates (Table 1), and, possibly, also to stronger daylight that the residents of Be’er Sheba are accustomed to, and, therefore, may prefer higher nighttime illumination levels.
The differences in the required nighttime illumination, thus, indicate that the “one-size-fits-all” principle, when applied to nighttime lighting in various urban settings, is another misconception. Excessive lighting may lead to energy waste, while insufficient lighting may reduce FoS. The economic aspect is also important, since scale effects turn even small energy savings in different locations to a significant decrease in the total operational costs [49].
The research is novel in several respects. First and foremost, the study was conducted in real-world conditions and accounted for differences between urban settings. During the years, several attempts have been made to investigate the association between street lighting and FoS. However, these studies were mostly conducted in controlled or laboratory conditions, which do not allow accounting for complex environmental conditions. Additionally, the study covered a relatively large number of observation points (257), in 10 different neighborhoods, in three different cities—all of which contribute to higher generality. It should also be noted that previous studies involved relatively small numbers of research subjects, and evaluated relatively small numbers of lighting sources, thus, falling short of representing different urban settings, larger populations and population subgroups [1,29,33,57]. The present study effectively addresses these drawbacks and may lead the way for future studies to be conducted elsewhere. Last but not least, the present study developed and employed a mobile phone location- and time-based application through which pedestrians could report their assessments of perceived PSL attributes and safety. This interactive technology offers a more accurate, reliable and efficient alternative to the “pen and paper” methodologies used in most previous studies.
Several limitations of the present study should, nevertheless, be mentioned. First and foremost, the study reports aggregated values of FoS assessments, which may vary between observers according to their individual attributes, specifically gender, which is known to affect FoS [24]. As individual attributes were collected and stored in the research database, follow up studies should attempt to incorporate them into the analysis, by using models that are based on individual observations, instead of ordinary least square regressions based on average assessments, such as those used in this study. Furthermore, while the present analysis solely focuses on illuminance, follow up studies should look into other lighting attributes, such as glare, uniformity, light temperature, etc. Future studies, using the proposed methodology and carried out elsewhere, can also contribute to the understanding of the robustness and generality of this study’s results, and ultimately facilitate the development of guidelines for other cities.
Author Contributions
A.S. analyzed data and wrote the paper’s draft; T.T. helped with methodology development, guiding the study, paper writing and study conceptualization; B.A.P. guided the study, data analysis, results’ interpretation and assisted with paper writing. All authors have read and agreed to the published version of the manuscript.
Funding
The study was conducted in framework of the research project funded by the Israel Science Foundation under Grant Number 400/18.
Acknowledgments
The authors’ gratitude is due to Prof. Salvador Bara and Dr. Ing. Inna Nissenbaum for their assistance in carrying out the study.
Conflicts of Interest
The authors declare no conflict of interest.
Appendix A

Table A1.
Selected characteristics of the neighborhoods surveyed.
| Neighborhood (See Figure 2, Figure 3 and Figure 4 for Neighborhood Maps and Location) | Nighttime Illumination Group—Predominant Wavelength and Illuminance Level | Street Lighting Class (According to CIE 13201) | Population Density per SCA a | SES Index on a 20-Point Scale from 1 (Low) to 20 (High) a |
|---|---|---|---|---|
| Tel Aviv-Yafo | ||||
| Neve Avivim (NA) | RL, BL | P2 | 19.35 | 17.00 |
| Nahalat Yitshak (NY) | BH | P1, C0 | 30.00 | 14.00 |
| HaTsafon HaHadash Center (C) | RH | P1 | 20.49 | 17.00 |
| Ramat Aviv HaHadasha (RAH) | RL | P1 | n/a | n/a |
| Haifa | ||||
| Ramat Ben Gurion (RBG) | RL, BL | C3 | 11.19 | 17.00 |
| Yizra’eliya (Y) | RH | C2 | 16.59 | 12.00 |
| Neot Peres (NP) | BH | P1 | n/a | n/a |
| Be’er Sheba | ||||
| Yud-Alef (YA) | RL, BL | P1 | 10.85 | 8.00 |
| Tet (T) | BH | P1 | 10.50 | 12.00 |
| Never Ze’ev (NZ) | RH | P1, C3 | 20.31 | 10.00 |
RL = red low; BL = blue low; RH = red high; BH = blue high; n/a = not available; a. On an ordinary scale used by Reference [57] for small census areas—from 1 (Low) to 20 (High).
Appendix B
Example of instructions provided to the observers. Neighborhood name: Ramat Ben Gurion (SCA 4000911), Haifa; Main Street–Oren; Internal Streets–Oren.
Figure A1.
(a) Survey route with survey points marked; (b) survey point #1.

Table A2.
Description of the survey points along the survey route example.
| Point # | Description |
|---|---|
| RBG1 | A bench next to the corner of the Oren St, 5 building (the first house on the left side of the road), near an anti-dog poop sign. Across the street, there is a kindergarten located above the street level. |
| RBG 2 | Next to the utility box on the sidewalk, adjacent to the low fence, between Oren St. 5 and 7 |
| RBG 3 | On the entrance to the stairways going down into the empty lot between Oren St, 7 and 9, near the garbage cans and under the lamp post. |
| RBG 4 | Next to the utility box on the sidewalk, adjacent to the low fence, between Oren St, 9 and 11, under a lamp post, but dark because of overhanging trees; |
| RBG 5 | Next to the fire hydrant between Oren St, 11 and 13. |
| RBG 6 | Next to the entrance to Oren St, 13 |
| RBG 7 | Near a high voltage power line pole and to the entrance to the staircase going down to an empty lot; on the other side of the road there is a single very high light pole; |
| RBG 8 | At a bench left to the entrance to Oren St, 15 |
| RBG 9 | Next to the recycle point between Oren St, 15 and 17, under a lamp post |
| RBG 10 | Near the entrance to a stairway going down to an empty lot between Oren St, 17 and 19 |
| RBG 11 | Next to the entrance to Oren 19 |
| RBG 12 | Near the sign “Green Path” |
| RBG 13 | At a bench near the reserved parking for the car #5026132, at the entrance to Oren st, 21 |
| RBG 14 | Cross the road in the direction of the cage for collecting plastic bottles. The assessment spot is next to the cage |
| RBG 15 | Continue uphill for about 20 m. The measurement point is next to the fire hydrant to your left, near the corner of the first house encountered |
| RBG 16 | Next to the entrance to Oren st, 23 |
| RBG 17 | At a bench in the background the shopping promenade and an the “Oren Clinic” sign |
| RBG 18 | Next to the charging unit No 046 for electric cars (car-to-go) |
| RBG 19 | At the Shufersal shopping centre’s cart collection spot, near the entrance to the supermarket |
| RBG 20 | Near the “Neighborhood Billboard” stand, opposite to the shopping center’s blank wall |
| RBG 21 | Near the fire hydrant under a lamp post, opposite the shopping center building’s farer corner (do not cross street towards the parking lot, stay on the same pathway) |
| RBG 22 | A bench near before the entrance to Oren St, 31, near a small street level garden with upward directed color spotlights lighting young trees |
| RBG 23 | Near the ramp to the Oren St 31, building (two benches and a shack, before crossing the street) |
| RBG 24 | A bench to the left side of the school entrance, near a “Romema” library sign; the bench overlooks a parking lot |
| RBG 25 | A bench near the path leading to the kindergarten “Romema”, at the corner of the school neighboring the parking lot |
References
- Wu, S. Investigating Lighting Quality: Examining the Relationship between Pedestrian Lighting Environment and Perceived Safety. Blackburg, Virginia. 2014. Available online: https://vtechworks.lib.vt.edu/handle/10919/48170 (accessed on 20 October 2019).
- Gallaway, T.; Olsen, R.N.; Mitchell, D.M. The economics of global light pollution. Ecol. Econ. 2010, 69, 658–665. [Google Scholar] [CrossRef]
- Kyba, C.C.M.; Hanel, A.; Holker, F. Redefining efficiency for outdoor lighting. Energy Environ. Sci. 2014, 7, 1806–1809. [Google Scholar] [CrossRef]
- Obayashi, K.; Saeki, K.; Iwamoto, J.; Okamoto, N.; Tomioka, K.; Nezu, S.; Ikada, Y.; Kurumatani, N. Effect of exposure to evening light on sleep initiation in the elderly: A longitudinal analysis for repeated measurements in home settings. Chronobiol. Int. 2014, 31, 461–467. [Google Scholar] [CrossRef] [PubMed]
- Cho, Y.M.; Ryu, S.H.; Lee, B.R.; Kim, K.H.; Lee, E.; Choi, J. Effects of artificial light at night on human health: A literature review of observational and experimental studies applied to exposure assessment. Chronobiol. Int. 2015, 32, 1294–1310. [Google Scholar] [CrossRef] [PubMed]
- Rybnikova, N.; Portnov, B.A. Artificial light at night and obesity: Does the spread of wireless information and communication technology play a role? Int. J. Sustain. Light. 2016, 35, 16–20. [Google Scholar] [CrossRef] [Green Version]
- Keshet-Sitton, A.; Or-Chen, K.; Yitzhak, S.; Tzabary, I.; Haim, A. Light and the City: Breast cancer risk factors differ between urban and rural women in Israel. Integr. Cancer Ther. 2017, 16, 176–187. [Google Scholar] [CrossRef] [Green Version]
- Gaston, K.J.; Bennie, J.; Davies, T.W.; Hopkins, J. The ecological impacts of nighttime light pollution: A mechanistic appraisal. Biol. Rev. 2013, 88, 912–927. [Google Scholar] [CrossRef]
- Gaston, K.J.; Visser, M.E.; Hölker, F. The biological impacts of artificial light at night: The research challenge. Philos. Trans. R. Soc. Lond. B Biol. Sci. 2015, 370, 20140133. [Google Scholar] [CrossRef] [Green Version]
- Silva, E.; Marcob, A.; da Graçac, J.; Perezb, H.; Abellac, E.; Patino-Martinezb, J.; Martinsc, S.; Almeidaa, C. Light pollution affects nesting behavior of loggerhead turtles and predation risk of nests and hatchlings. J. Photochem. Photobiol. B Biol. 2017, 173, 240–249. [Google Scholar] [CrossRef]
- Bonaiuto, M.; Fornara, F.; Bonnes, M. Perceived residential environment quality in middle- and low-extension Italian cities. Revue Européenne de Psychologie Appliquée/Eur. Rev. Appl. Psychol. 2006, 56, 23–34. [Google Scholar] [CrossRef]
- Fornara, F.; Bonaiuto, M.; Bonnes, M. Cross-validation of abbreviated perceived residential environment quality (PREQ) and neighborhood attachment (NA) indicators. Environ. Behav. 2010, 42, 171–196. [Google Scholar] [CrossRef]
- Rosenberg, M.J.; Hovland, C.I.; McGuire, W.J.; Abelson, R.P.; Brehm, J.W. Attitude Organization and Change: An Analysis of Consistency among Attitude Components; Yale University Press: New Haven, CT, USA, 1960. [Google Scholar]
- Choi, A.S.; Kim, Y.O.; Oh, E.S.; Kim, Y.S. Application of the space syntax theory to quantitative street lighting design. Build. Environ. 2006, 41, 355–366. [Google Scholar] [CrossRef]
- Bullough, J.D.; Brons, J.A.; Qi, R. Predicting discomfort glare from outdoor lighting installations. Light. Res. Technol. 2008, 40, 225–242. [Google Scholar] [CrossRef]
- Morgan, P. Towards a developmental theory of place attachment. J. Environ. Psychol. 2010, 30, 11–22. [Google Scholar] [CrossRef]
- Unwin, J.; Fotios, S. Does lighting contribute to the reassurance of pedestrians at night-time in residential roads? Ing. Iluminatului 2011, 2, 29–44. [Google Scholar]
- Oc, T.; Tiesdell, S.A. Safer City Centres: Reviving the Public Realm; Paul Chapman Publishing Ltd.: London, UK, 1997. [Google Scholar]
- Dravitzki, V.K.; Cleland, B.S.; Walton, D.; Laing, J.N. Measuring commuting pedestrians’ concerns for personal safety and the influence of lighting on these concerns. In Proceedings of the 26th Australasian Transport Research Forum, Wellington, New Zealand, 1–3 October 2003. [Google Scholar]
- Wu, S.; Kim, M. The relationship between the pedestrians lighting environment and perceived safety. J. Digit. Landsc. Archit. 2006, 1, 57–66. [Google Scholar]
- Loewen, L.J.; Steel, G.D.; Suedfeld, P. Perceived safety from crime in the urban environment. J. Environ. Psychol. 1993, 13, 323–331. [Google Scholar] [CrossRef]
- Boyce, P.R.; Gutkowski, J.M. The if, why and what of street lighting and street crime: A review. Int. J. Light. Res. Technol. 1995, 27, 103–112. [Google Scholar] [CrossRef]
- Nasar, J.L.; Jones, K.M. Landscapes of fear and stress. Environ. Behav. 1997, 29, 291–323. [Google Scholar] [CrossRef]
- Blobaum, A.; Hunecke, M. Perceived danger in urban public space: The impact of physical features and personal factors. Environ. Behav. 2005, 37, 465–486. [Google Scholar] [CrossRef]
- Peña-García, A.; Hurtado, A.; Aguilar-Luzon, M.C. Impact of public lighting on pedestrians’ perception of safety and well-being. Saf. Sci. 2015, 78, 142–148. [Google Scholar] [CrossRef]
- Nasar, J.; Bokharaei, S. Lighting modes and their effects on impressions of public squares. J. Environ. Psychol. 2017, 49, 96–105. [Google Scholar] [CrossRef]
- Nasar, J.; Bokharaei, S. Impressions of lighting in public squares after dark. Environ. Behav. 2017, 49, 227–254. [Google Scholar] [CrossRef]
- Rijswijk, L.; Haans, A. Illuminating for safety: Investigating the role of lighting appraisals on the perception of safety in the urban environment. Environ. Behav. 2018, 50, 889–912. [Google Scholar] [CrossRef]
- Haans, A.; de Kort, Y.A.W. Light distribution in dynamic street lighting: Two experimental studies on its effects on perceived safety, prospect, concealment and escape. J. Environ. Psychol. 2012, 32, 342–352. [Google Scholar] [CrossRef]
- Boomsma, C.; Steg, L. Feeling safe in the dark: Examining the effect of entrapment, lighting levels and gender on feelings of safety and lighting policy acceptability. Environ. Behav. 2014, 46, 193–212. [Google Scholar] [CrossRef]
- Fotios, S.; Unwin, J.; Farrall, S. Road lighting and pedestrian reassurance after dark: A review. Light. Res. Technol. 2015, 47, 449–469. [Google Scholar] [CrossRef] [Green Version]
- Celluccii, L.; Bisegna, F.; Gugliermetti, F.; Navvab, M. Lighting Distribution Affects Pedestrians’ Sense of Security. In Proceedings of the IEEE 16th International Conference on Environment and Electrical Engineering (EEEIC), Florence, Italy, 7–10 June 2016. [Google Scholar]
- Johansson, M.; Rosén, M.; Küller, R. Individual factors influencing the assessment of the outdoor lighting of an urban footpath. Light. Res. Technol. 2011, 43, 31–43. [Google Scholar] [CrossRef]
- ICBS. Israel Central Bureau of Statistics. 2019. Available online: https://www.cbs.gov.il/en/publications/Pages/2019/Welfare-Statistical-Abstract-of-Israel-2019-No-70.aspx (accessed on 2 December 2019).
- Peña-García, A.; Sedziwy, A. Optimizing lighting of rural roads and protected areas with white light: A compromise among light pollution, energy saving and visibility. Leukos 2020, 16, 147–156. [Google Scholar] [CrossRef]
- Haim, A.; Portnov, B.A. Light Pollution as a New Risk Factor for Human Breast and Prostate Cancers; Springer: Dordrecht, The Netherlands, 2013. [Google Scholar]
- Garcia-Saenz, A.; De Miguel, A.S.; Espinosa, A. Evaluating the association between artificial light-at-night exposure and breast and prostate cancer risk in Spain (Mcc-spain study). Environ. Health Perspect. 2018, 126, 1–9. [Google Scholar] [CrossRef]
- Brüning, A.; Hölker, F.; Franke, S.; Kleiner, W.; Kloas, W. Impact of different colours of artificial light at night on melatonin rhythm and gene expression of gonadotropins in European perch. Sci. Total Environ. 2016, 543, 214–222. [Google Scholar] [CrossRef] [PubMed]
- Van Langevelde, F.; Grunsen, R.H.A.; Veenendaal, E.M.; Fijen, T.P.M. Artificial night lighting inhibits feeding in moths. Biol. Lett. 2017, 13, 20160874. [Google Scholar] [CrossRef] [PubMed] [Green Version]
- JSC. International Space Station’s (ISS) Database. 2018. Available online: https://www.nasa.gov/multimedia/imagegallery/index.html (accessed on 12 February 2018).
- CIE, 201. Methods of Measuring Lighting Performance; CEN-CENELEC Management Centre: Brussels, Belgium, 2015. [Google Scholar]
- Konica-Minolta. Giving Shapes to Ideas. 2019. Available online: https://www.konicaminolta.com/ (accessed on 2 February 2019).
- Merry, K.; Bettinger, P. Smartphone GPS accuracy study in an urban environment. PLoS ONE 2019, 14, e0219890. [Google Scholar] [CrossRef] [PubMed] [Green Version]
- Kulas, J.T.; Stachowski, A.A. Middle category endorsement in odd-numbered Likert response scales: Associated item characteristics, cognitive demands, and preferred meanings. J. Res. Personal. 2009, 43, 489–493. [Google Scholar] [CrossRef]
- DIALOG. 2019. Available online: https://dialogue.co.il/ (accessed on 12 December 2019).
- Jorgensen, A.; Hitchmough, J.; Calvert, T. Woodland spaces and edges: Their impact on perception of safety and preference. Landsc. Urban Plan. 2002, 60, 135–150. [Google Scholar] [CrossRef]
- Krenichyn, K. Women, Physical Activity, and the Urban Outdoor Environment: A Study of Prospect Park. Ph.D. Thesis, City University of New York, New York, NY, USA, 2004. Available online: https://search.proquest.com/openview/e7e3de5ed3192d5f2b8df8f07bb42e80/1?pq-origsite=gscholar&cbl=18750&diss=y (accessed on 15 December 2019).
- Hashim, N.H.M.; Thani, S.K.S.O.; Janaludin, M.A.; Yatim, N.M. A perceptual study on the influence of vegetation design towards women’s safety in Public Park. Soc. Behav. Sci. 2016, 234, 280–288. [Google Scholar] [CrossRef] [Green Version]
- Wojnicki, I.; Kotulski, L. Empirical study of how traffic intensity detector perimeters influence dynamic street lighting energy consumption: A case study in Krakow, Poland. Sustainability 2018, 10, 1221. [Google Scholar] [CrossRef] [Green Version]
- Kutner, M.; Nachtshein, C.J.; Neter, J. Applied Linear Regression Models; McGraw-Hill Irwin: Chicago, IL, USA, 2004. [Google Scholar]
- IBM. SPSS Statistics Desktop help 25. 2019. Available online: http://www.ibm.com (accessed on 1 December 2019).
- Unver, A. People’s Experience of Urban Lighting in Public Space. Ph.D. Thesis, Middle East Technical University, Ankara, Turkey, 2009. [Google Scholar]
- Ozadowicz, A.; Grela, J. Energy saving in the street lighting control system—A new approach based on the EN-15232 standard. Energy Effic. 2017, 10, 563–576. [Google Scholar] [CrossRef] [Green Version]
- EC (European Commission). Lighting the Cities. 2013. Available online: https://ec.europa.eu/digital-single-market/en/blog/lighting-cities-%E2%80%93-next-step (accessed on 10 February 2020).
- USAID. Energy Efficient Street Lighting: Guidelines; USAID: New Delhi, India, 2009. [Google Scholar]
- ICBS. Israel Central Bureau of Statistics. 2008. Available online: https://old.cbs.gov.il/webpub/pub/text_page.html?publ=100&CYear=2008&CMonth=1 (accessed on 2 October 2018).
- Viliūnas, V.; Vaitkevičius, H.; Stanikūnas, R.; Vitta, P.; Bliumas, R.; Auškalnytė, A.; Žukauskas, A. Subjective evaluation of luminance distribution for intelligent outdoor lighting. Light. Res. Technol. 2014, 46, 421–433. [Google Scholar] [CrossRef]
Figure 1.
Study layout.

Figure 2.
Location of the survey neighborhoods and survey routes in Tel Aviv-Yafo: (a) Neighborhoods surveyed: (b) “Nahalat Yitshak” (NY); (c) “HaTsafon HaHadash” (C); (d) “Neve Avivim” (NA); (e) “Ramat Aviv Ha-Hadasha” (RAH).
Figure 2.
Location of the survey neighborhoods and survey routes in Tel Aviv-Yafo: (a) Neighborhoods surveyed: (b) “Nahalat Yitshak” (NY); (c) “HaTsafon HaHadash” (C); (d) “Neve Avivim” (NA); (e) “Ramat Aviv Ha-Hadasha” (RAH).


Figure 3.
Location of the survey neighborhoods and survey routes in Haifa: (a) Neighborhoods surveyed; (b) “Neot Peres” (NP); (c) ”Ramat Ben Gurion” (RBG); (d) “Yizra’eliya” (Y).
Figure 3.
Location of the survey neighborhoods and survey routes in Haifa: (a) Neighborhoods surveyed; (b) “Neot Peres” (NP); (c) ”Ramat Ben Gurion” (RBG); (d) “Yizra’eliya” (Y).

Figure 4.
Location of the survey neighborhoods and survey routes in Be’er Sheba: (a) Neighborhoods surveyed; (b) “Never Ze’ev” (NZ); (c) “Yud-Alef” (YA); (d) “Tet” (T).
Figure 4.
Location of the survey neighborhoods and survey routes in Be’er Sheba: (a) Neighborhoods surveyed; (b) “Never Ze’ev” (NZ); (c) “Yud-Alef” (YA); (d) “Tet” (T).

Figure 5.
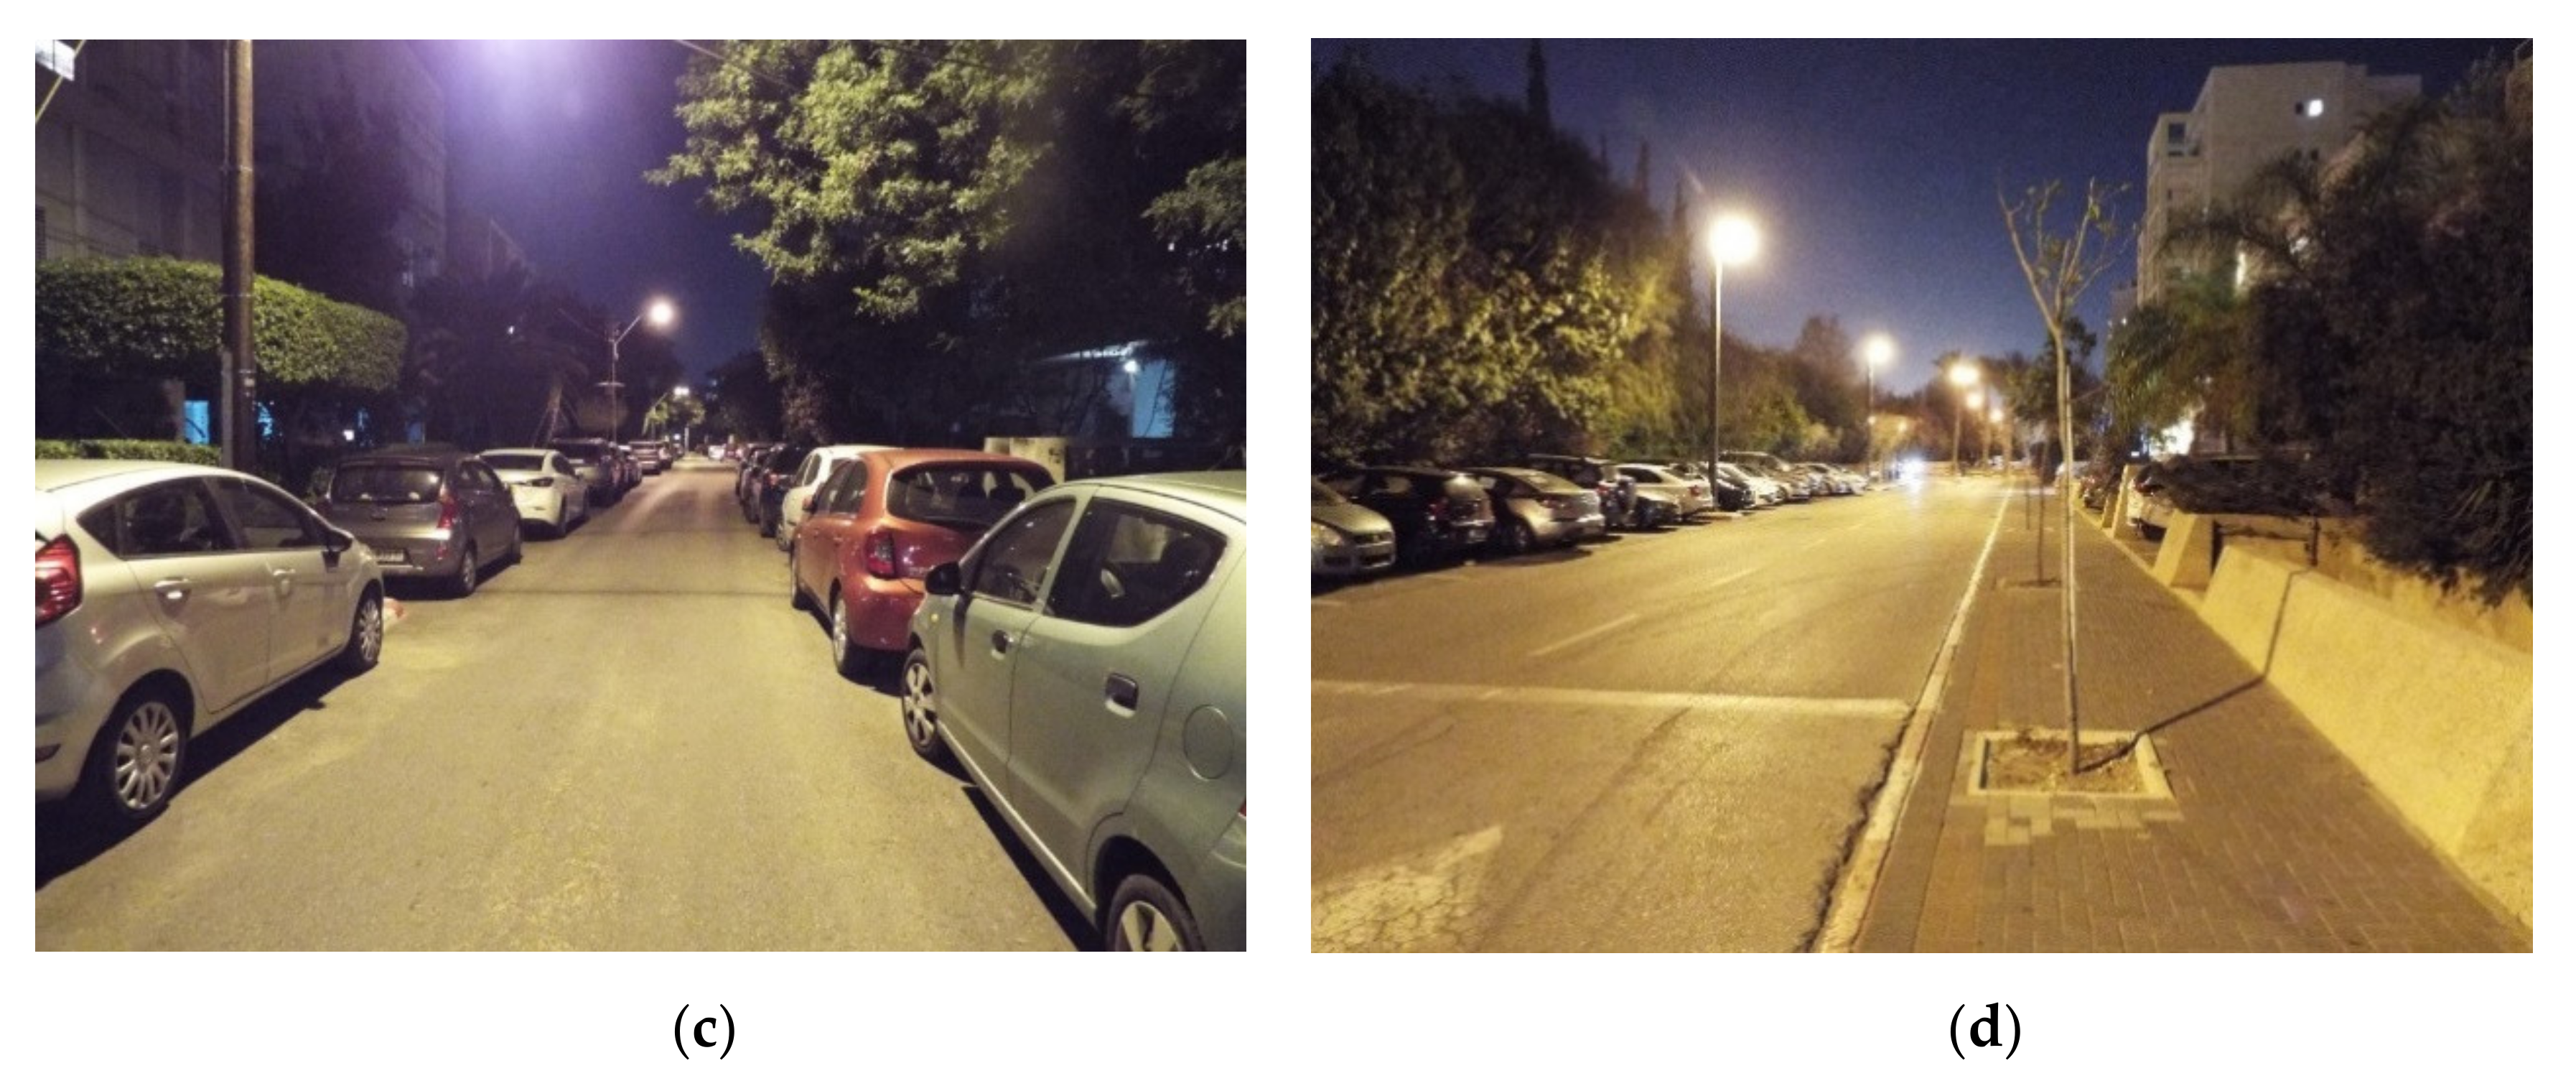
Nighttime lighting environment in selected neighborhoods under study. (a)—Neighborhood “Tet”, Be’er Sheba; (b)—neighborhood “Neot Peres”, Haifa; (c)—neighborhood “HaTsafon HaHadash Center”, Tel Aviv-Yafo; (d)—neighborhood “Ramat Aviv Ha-Hadasha”, Tel Aviv-Yafo.
Figure 5.
Nighttime lighting environment in selected neighborhoods under study. (a)—Neighborhood “Tet”, Be’er Sheba; (b)—neighborhood “Neot Peres”, Haifa; (c)—neighborhood “HaTsafon HaHadash Center”, Tel Aviv-Yafo; (d)—neighborhood “Ramat Aviv Ha-Hadasha”, Tel Aviv-Yafo.


Figure 6.
Mobile phone application “CityLights”—sample screens: (a) app enter screen, (b) survey questions screen, (c) survey point redirection screen. See text for a full range of assessment scales.
Figure 6.
Mobile phone application “CityLights”—sample screens: (a) app enter screen, (b) survey questions screen, (c) survey point redirection screen. See text for a full range of assessment scales.

Figure 7.
FoS model-response test to plausible changes in illuminance (see text for explanations). (A–C)—intersection points between average FoS (1.89 on a 0 to 3 four-point Likert scale), equal to that of Tel Aviv-Yafo (see dotted green line) and estimated PSL sufficiency curves for Haifa, Tel Aviv-Yafo and Be’er Sheba; (D)—intersection point between the estimated PSL sufficiency curve and average FoS level in Be’er Sheba (1.75 on a 0 to 3 four-point Likert scale); (E)—intersection point between the estimated PSL sufficiency curve and average FoS level in Haifa (2.07 on a 0 to 3 four-point Likert scale).

Table 1.
Physical, environmental and socio-demographic characteristics of the cities under study (as of 2018, unless stated otherwise) a.
Table 1.
Physical, environmental and socio-demographic characteristics of the cities under study (as of 2018, unless stated otherwise) a.
| Development Attribute | City | ||
|---|---|---|---|
| Tel Aviv-Yafo | Haifa | Be’er Sheba | |
| Population size (thousands) | 447.70 | 282.40 | 208.30 |
| Area (km2) | 52.00 | 63.67 | 117.50 |
| Population density (per km2) | 8354.70 | 4045.50 | 1733.20 |
| Climatic zone | Mediterranean | Mediterranean | Hot semi-arid with Mediterranean influences |
| Socio-economic status (SES)b | 8 | 7 | 5 |
| Average precipitation (mm) | 583.0 | 683.0 | 195.1 |
| Average precipitation (days) | 71.00 | 65.00 | 39.20 |
| Average relative humidity (%) | 67.00 | 69.00 | 42.00 |
| Ethnic makeup (%) | |||
| 91.80 | 82.00 | 88.00 |
| 8.20 | 18.00 | 11.00 |
| Place of birth (% for Jews) | |||
| 69.00 | 52.00 | 55.0 |
| 3.00 | 1.00 | 2.00 |
| 16.00 | 22.00 | 22.0 |
| 2.00 | 4.00 | 8.00 |
| Crime rates (per 1000) as of 2016, including: a | 3.60 | 3.05 | 4.76 |
| 0.62 | 0.63 | 0.86 |
| 0.05 | 0.05 | 0.07 |
| 0.67 | 0.70 | 0.74 |
a Assembled or calculated using data from Reference [34]. b Social-economic rating of Israel local authorities: from 1 (the lowest) to 10 (the highest).
Table 2.
Selected descriptive statistics of research variables.
| Variable/Units/Measurement Method | No. of Observation Points | Minimum | Maximum | Mean | SE |
|---|---|---|---|---|---|
| FoS on a 4-point Likert scale (from 0-low to 3-high) | |||||
| 107 | 1.15 | 2.43 | 1.89 | 0.03 |
| 73 | 1.42 | 2.62 | 2.07 | 0.03 |
| 77 | 0.86 | 2.42 | 1.75 | 0.05 |
| Illumination (Lux) | |||||
| A. Point horizontal | 257 | 0.47 | 199.96 | 18.52 | 1.58 |
| 107 | 0.47 | 199.85 | 20.08 | 2.40 |
| 73 | 0.78 | 97.36 | 18.02 | 1.79 |
| 77 | 0.50 | 64.91 | 16.84 | 1.58 |
| B. Point vertical panoramic | 257 | 0.43 | 284.46 | 11.92 | 1.24 |
| 107 | 0.43 | 284.46 | 13.05 | 2.78 |
| 73 | 0.82 | 21.45 | 8.95 | 0.62 |
| 77 | 0.54 | 52.48 | 13.17 | 1.24 |
| C. Point vertical directional | 257 | 0.61 | 183.19 | 11.37 | 1.04 |
| 107 | 0.61 | 183.19 | 12.34 | 1.92 |
| 73 | 0.69 | 26.83 | 8.62 | 0.79 |
| 77 | 0.69 | 37.43 | 12.64 | 1.04 |
Table 3.
Differences in FoS between differently lit areas (Method—Mann-Whitney U-test for differences, based on mean and median levels of illumination [lux]).
Table 3.
Differences in FoS between differently lit areas (Method—Mann-Whitney U-test for differences, based on mean and median levels of illumination [lux]).
| Value Breakdown/Measurement Method/Illumination Range | Average FoS Assessment on a 4-Point Likert Scale—from 0 (Low) to 3 (High) | Mann-Whitney U-test and Significance Level |
|---|---|---|
| A. Mean values | ||
| Point horizontal | ||
| 1.77 | 3205.50 * |
| 2.12 | |
| Point vertical panoramic | ||
| 1.80 | 4096.00 * |
| 2.07 | |
| Point vertical directional | ||
| 1.80 | 4344.00 * |
| 2.07 | |
| B. Midian values | ||
| Point horizontal | ||
| 1.71 | 3364.50 * |
| 2.08 | |
| Point vertical panoramic | ||
| 1.75 | 4440.50 * |
| 2.04 | |
| Point vertical directional | ||
| 1.78 | 5185.50 * |
| 2.01 |
* indicates a 0.01 significance level.
Table 4.
Association between illuminance levels measured by different methods (Lux) and FoS (method –bivariate OLS regression; dependent variable—average values of FoS on a 4-point Likert scale—from 0 (low) to 3 (high)) a.
Table 4.
Association between illuminance levels measured by different methods (Lux) and FoS (method –bivariate OLS regression; dependent variable—average values of FoS on a 4-point Likert scale—from 0 (low) to 3 (high)) a.
| Illumination Level/Measurement Method | B b | Beta c | t-Stat d | B b | Beta c | t-Stat d | B b | Beta c | t-Stat d |
|---|---|---|---|---|---|---|---|---|---|
| A. Explanatory variables measured on original continuous scales (Lux) | |||||||||
| Model 1A | Model 1B | Model 1C | |||||||
| −0.34 | - | −4.17 * | −0.13 | - | −1.81 * | −0.44 | - | −4.42 * |
| 0.02 | 0.35 | 6.05 * | - | - | - | - | - | - |
| - | - | - | 0.01 | 0.21 | 3.48* | - | - | - |
| - | - | - | - | - | - | 0.03 | 0.33 | 5.49 * |
| 0.13 | 0.05 | 0.11 | ||||||
| 36.65 * | 12.11 *** | 30.14 * | ||||||
| B. Explanatory variables are logarithmically transformed | |||||||||
| Model 1D | Model 1E | Model 1F | |||||||
| −1.45 | - | −10.12 * | −0.93 | −7.50 * | −0.86 | - | −6.33 * | |
| 0.58 | 0.56 | 10.85 * | - | - | - | - | - | - |
| - | - | - | 0.47 | 0.47 | 8.40 * | - | - | - |
| - | - | - | - | - | - | 0.43 | 0.40 | 6.70 * |
| 0.32 | 0.21 | 0.16 | ||||||
| 117.73 * | 70.37 * | 48.56 * | ||||||
a z-score normalized (µ = 1.90, SD = 0.37); b unstandardized regression coefficient, c standardized regression coefficients, d t-statistic and its significance value, *, **, *** indicates a 0.01, 0.05 and 0.1 significance levels, respectively.
Table 5.
Factors affecting FoS (Method—multiple OLS regression) a.
| Predictors | Model 2 | Model 3 | Model 4 | |||||||
|---|---|---|---|---|---|---|---|---|---|---|
| B b | Beta c | t-stat d | B b | Beta c | t-stat d | B b | Beta c | t-stat d | VIF e | |
| (Constant) | −1.45 | - | −0.12 * | −1.20 | - | −8.30 * | −1.17 | - | −7.67 * | - |
| Illuminance (ln) (Lux) | 0.58 | 0.56 | 10.85 * | 0.53 | 0.51 | 9.93 * | 0.51 | 0.49 | 10.21 * | 1.11 |
| Vegetation density (0–2) f | - | - | - | −0.34 | −0.23 | −4.67 * | −0.282 | −0.19 | −3.96 * | 1.12 |
| Traffic intensity (0–2) g | - | - | - | 0.20 | 0.14 | 2.64 * | 0.228 | 0.16 | 3.18 * | 1.12 |
| City dummies (reference = Tel Aviv-Yafo): | ||||||||||
| - | - | - | - | - | - | 0.323 | 0.15 | 2.76* | 1.33 |
| - | - | - | - | - | - | −0.421 | 0.19 | −3.79* | 1.24 |
| R2 | 0.32 | 0.39 | 0.47 | |||||||
| Adjusted R2 | 0.31 | 0.39 | 0.46 | |||||||
| F | 117.73 * | 54.55 * | 45.02 * | |||||||
| R2 Change | - | 0.08 | 0.08 | |||||||
| F Change | - | 16.02 * | 19.02 * | |||||||
a z-score normalized (µ =1.90, SD = 0.37); b unstandardized regression coefficient, c standardized regression coefficients, d t-statistic and its significance value, * indicates a 0.01 significance levels, e variance inflation factor (multi-collinearity text), f vegetation density codding: 0—trees and shrubs do not obscure street lights; 1—trees and shrubs partially obscure street lights; 2—trees and shrubs significantly obscure street lights; g traffic intensity codding: 0—small number of vehicles during experimental measurements (less than 5 per 15 min); 1—average number of vehicles during experimental measurements (5–10 vehicles per 15 min); 2—large number of vehicles during experimental measurements (more than 10 per 15 min). Model 2: Horizontal ground-level illumination as explanatory variable only; Model 3: vegetation density and traffic intensity assessments added; Model 4: city dummies added.
© 2020 by the authors. Licensee MDPI, Basel, Switzerland. This article is an open access article distributed under the terms and conditions of the Creative Commons Attribution (CC BY) license (http://creativecommons.org/licenses/by/4.0/).
Share and Cite
MDPI and ACS Style
Svechkina, A.; Trop, T.; Portnov, B.A. How Much Lighting is Required to Feel Safe When Walking Through the Streets at Night? Sustainability 2020, 12, 3133. https://doi.org/10.3390/su12083133
AMA Style
Svechkina A, Trop T, Portnov BA. How Much Lighting is Required to Feel Safe When Walking Through the Streets at Night? Sustainability. 2020; 12(8):3133. https://doi.org/10.3390/su12083133
Chicago/Turabian StyleSvechkina, Alina, Tamar Trop, and Boris A. Portnov. 2020. "How Much Lighting is Required to Feel Safe When Walking Through the Streets at Night?" Sustainability 12, no. 8: 3133. https://doi.org/10.3390/su12083133
Note that from the first issue of 2016, this journal uses article numbers instead of page numbers. See further details here.