Article

Improved Usability of Pedestrian Environments After Dark for People with Vision Impairment: an Intervention Study

1
Department of Architecture and Built Environment, Lund University, SE-22100 Lund, Sweden
2
Hinderfri Design AB, Skarpskyttevägen 12G, SE-226 42 Lund, Sweden
3
Department of Work Science, Business Economics and Environmental Psychology, The Swedish University of Agricultural Science, SE-230 53 Alnarp, Sweden
4
Division of Transport and Roads, Department of Technology and Society, Lund University, SE-22100 Lund, Sweden
*
Author to whom correspondence should be addressed.
Sustainability 2020, 12(3), 1096; https://doi.org/10.3390/su12031096
Submission received: 2 January 2020 / Revised: 26 January 2020 / Accepted: 28 January 2020 / Published: 4 February 2020

Abstract

:
Walking is an important transport mode for sustainable cities, but the usability of pedestrian environments for people with impaired vision is very limited after dark. This study compares the usability of a walkway, operationalized in terms of (i) the pedestrian’s ability to orient themselves and detect infrastructure elements, and (ii) the perceived quality of lighting in the environment (evaluated in terms of the perceived strength quality and perceived comfort quality). The study was performed in a city in southern Sweden, along a pedestrian route where observations and structured interviews had previously been conducted and after an intervention involving installing new lighting systems with LED lights. A mixed method analysis involving participants with impaired vision (N=14) showed that the intervention generally improved the walkway’s usability: observations indicated that the participants’ ability to orientate themselves and detect infrastructure elements increased, and the interviews showed that the intervention increased the perceived strength quality of the lighting along the walkway. However, the effects on the perceived comfort quality were unclear. It is therefore important to carefully evaluate new lighting systems to reduce the risk of creating an inappropriate lighting design that will limit walking after dark by people with impaired vision.

1. Introduction

Sustainable cities should provide opportunities for all people, including vulnerable groups in society, to access transportation [1]. This includes walking, a transport mode which is known to be beneficial to humans’ health, well-being, social participation, and engagement in the community [2,3,4] while also possibly benefiting the environment by reducing car use [5,6].
Efforts to support walking in urban environments require consideration of pedestrians during planning, design, and maintenance. The accessibility and usability of the built environment has been highlighted in recent decades as an important factor affecting the welfare of people with disabilities and older people in many countries around the world [7,8]. Despite this, the urban built environment continues to impose restrictions on people with diverse impairments, including those with vision impairment, limiting their opportunities for social participation and mobility [9].

1.1. Outdoor Environment and Vision Impaired People

Sweden has a long tradition of regulating the built environment to meet the needs of all citizens, including people with disabilities, as exemplified by the Planning and Building Act of 1987 (Revised 2011) [10]; regulation BFS 2018:4 of the national board of housing, building, and planning (Boverket) [11], and the mandatory provisions and general recommendations of Boverket’s building regulations (BBR). Specific and detailed regulations governing the design of public spaces such as the outdoor environment were introduced at the start of the 21st century (BFS 2003:19 HIN1; BFS 2004:15 ALM1 [12,13]). These regulations have been revised continuously; the latest ones include BFS 2013:9 HIN3 and BFS 2011:5 ALM2 [14,15]. The regulations and general recommendations on the removal of easily eliminated obstacles to and in premises (HIN regulations) govern the rebuilding of the environment to remove existing barriers. These regulations [12,14] state that to support people with vision impairment, “…Lighting where people move around should be even and arranged so that partially sighted people and people with limited mobility can see what the floor surface looks like…”. To achieve this objective, it is necessary to find ways of designing outdoor lighting to be useful to people with vision impairment.
Pedestrians with impaired vision orient themselves using guidelines in the environment, which may be natural (curbs, grass, white lines, walls, etc.) or artificial (guidance surfaces and warning surfaces). They can orient themselves in the environment by using their sight to some degree but often experience problems with balance due to difficulties in surveying their surroundings and perceiving changes along the path [16,17]. To overcome these difficulties, it is important for them to be able to clearly detect features of the environment. Blind people use the long white cane as the primary assistive tool for detection, while the most important environmental features for people with reduced vision are contrast and outdoor lighting. Besides reduced visual acuity, people with vision impairment often have difficulty distinguishing important sounds in noisy environments, and may need to concentrate intensely on the aforementioned details, which may limit their opportunities to take relaxed walks without becoming exhausted and to experience the built and social environments [18,19,20].
In everyday life, walking is the most important mode of transport for people with vision impairment. However, few existing environments comply with current regulations designed to make the built environment accommodate vision-impaired pedestrians. This shortcoming has been highlighted by several studies, which have revealed that the pedestrian environment lacks (among other things) walkways in adequate condition, resting places, crossings, refuges, and street lighting, and both natural and artificial guidelines such as guidance and warning surfaces [9,16,17,18,20,21,22,23]. Key characteristics of walkways that promote equal opportunities for walking in the urban environment for people with vision impairment include accessible, obstacle-free, and smooth surfaces, and readily identifiable, continuous, and unambiguous routes and/or walkways [24,25]. Additionally, features such as curbs/dropped curbs, warning surfaces, tactile guidance paths, and tonal or color contrast between surface materials should be used to meet the needs of pedestrians in this group [17,26]. The surface patterns should be simple because complex patterns can cause disorientation [25,27].
Detailed studies on how such features should be designed to create continuous guiding routes in the pedestrian environment to benefit both blind people and people with reduced vision have been conducted in several countries [16,17,18,20,28,29,30,31]. These findings have been used by working groups within the European Union (CEN/TS278/WG3) [17] and the International Organization for Standardization (ISO/TC 173/WG8) [32] that have been meeting for decades to debate and decide how artificial features of the pedestrian environment such as guidance and warning slabs should be constructed and designed to create effective artificial guiding routes.
The usability of the pedestrian environment for people with vision impairment is further limited by difficulties in detecting environmental barriers or obstructions after dark. During hours of darkness, public outdoor lighting plays an important role in making the urban environment accessible, enhancing visibility, and strengthening the perception of safety among pedestrians [33]. This is important in all countries but is particularly relevant in Northern countries that only have a few hours of daylight during winter. Inadequate outdoor lighting in urban environments has been identified as a risk factor for health and well-being [34] because damaged areas of walkways such as cracks or uneven pavements are major obstacles in darkness [35]. The most common direct risk due to such obstacles is the risk of injuries caused by falling; indirect risks include an increased likelihood that people will avoid going outside and participating in activities that contribute to well-being.

1.2. Outdoor Lighting and Urban Walking

According to the Illuminating Engineering Society of North America (IESNA) lighting handbook [36], outdoor lighting in pedestrian environments should provide good brightness and general comfort while also being perceived as pleasant by pedestrians and facilitating obstacle detection, visual orientation, and facial recognition. Lighting that achieves all these objectives would promote safety, security, and social ease when encountering others. Modern standards such as EN 13201 define minimum average illuminance levels for pedestrian walkways and bicycle tracks, which range from 2 to 15 lux depending on lighting class (The lighting classes are defined based on the characteristics of the expected users of different kinds of roads [37]). Previous studies have also suggested that white light sources improve brightness perception [38,39], visibility of colored targets [40], and perceived safety [39,41] to a greater degree than yellow light sources. However, a recent study on public outdoor lighting found that yellow light is preferred by pedestrians and produces lower levels of light pollution [41].
In Northern European countries in particular, it has been found that whiter or cooler light from light emitting diode (LED) light sources reduces the perceived pleasantness of lighting and its comfort quality [42,43]. Nevertheless, the adoption of modern smart designs and energy-efficient LED light sources could yield annual energy savings of about 41–76% [44]. While these energy savings have attracted considerable interest [43], research on the impact of a transition to LED-based lighting applications has primarily focused on energy reduction and the environment rather than users’ experiences of such lighting. Consequently, there is a clear need to better evaluate the impact of introducing such outdoor lighting on different user groups, and particularly vision-impaired people, who are most affected by the perceived quality of the lit environment [33]. Previous studies on users’ experiences of outdoor lighting have primarily focused on the general population without considering the needs of people with vision impairment [39,40,45]. While previous studies on walking have considered vision-impaired and elderly pedestrians to some extent, most such studies have been conducted primarily under daylight conditions [3,46].
Consequently, there is a research gap relating to how the interaction between outdoor lighting and the urban environment supports a secure and safe walking experience, which is extremely important for vision-impaired pedestrians [47]. A key requirement for a secure and safe walking experience during hours of darkness is that pedestrians must be able to orientate themselves in the pedestrian environment and detect its features. An additional knowledge gap relates to the impact of LED lighting, which has only been tested on the general population [43], mostly in laboratory environments [45,48]. Additionally, only a few studies have taken users’ perceptions and experiences of the new light sources into account [49]. Thus, to the best of the authors’ knowledge, no studies on the impact of different outdoor lighting systems on people with vision impairment have been performed in real urban settings. To support a transition to energy-efficient light sources while still upholding the goals of equity, accessibility, and usability for pedestrians with different needs, there is a need for knowledge that will enable the design of energy-efficient lighting systems that strengthen the quality of the walking environment. This study provides such knowledge by clarifying the influence of public outdoor lighting on walking by vision-impaired pedestrians.

1.3. Conceptual Framework

Walking has been defined as a dynamic and highly transformative activity that is shaped by the individual through the interplay of external and internal factors [50]. This interplay in turn forms the walking experience [51]. The analysis presented here builds on the Human–Environment Interaction (HEI) model [52] and the operationalized version of this model for walking in urban neighborhoods by people with disabilities [53].
The operationalized model treats the experienced usability of the urban environment for walking as an interplay between the activity to be performed (i.e., walking), the setting’s physical and social characteristics (external factors), and the characteristics and needs of individuals with disabilities (internal factors). More specifically, the operationalized model posits that four dimensions are involved in the interaction. The activity dimension in this case is walking along an urban pedestrian path after dark. This activity is considered in relation to the physical environment dimension, which is conceptualized as consisting of molecular aspects (individual micro-level infrastructure elements such as surface materials and their quality, crossing design, light sources, landmarks, signs, etc.) and molar aspects that relate to the way in which individual molecular aspects coexist within the overall environmental setting.
The social environment dimension relates to the social situation, which is associated with the perceived safety of the environment. The individual resources dimension relates to the characteristics of the individual—in this case, pedestrians with vision impairment. These four dimensions, through a basic emotional process, constitute the foundation of individuals’ response to their environment and its outcomes; the outcomes of interest in this work were those relating to the perceived usability of a pedestrian environment. The study presented here focuses on how the environmental characteristics of outdoor lighting applications influence the usability of the pedestrian environment (specifically, a walkway) for people with vision impairment. Usability is here operationalized as the ability to orientate oneself and detect features along the walkway after dark, and the perceived quality of the lit environment. The latter is considered to be defined by i) the perceived strength of the lighting, evaluated in terms of perceived brightness; and ii) the perceived comfort quality of the lighting, which relates to its pleasantness, softness, and hedonic tone, which was previously shown to be important to the walking experience after dark [42].

1.4. Aim

The study’s overarching aim was to determine whether (and to what extent) an intervention that focused on improving outdoor lighting could support urban walking for people with vision impairment. More specifically, the study aimed to investigate the usability of a walkway, operationalized as:
  • The ability for vision-impaired pedestrians to orientate themselves and detect infrastructure elements in the walking environment;
  • The perception of the lighting applications in terms of the perceived strength and comfort quality of the light.

2. Materials and Methods

2.1. Study Context and Setting
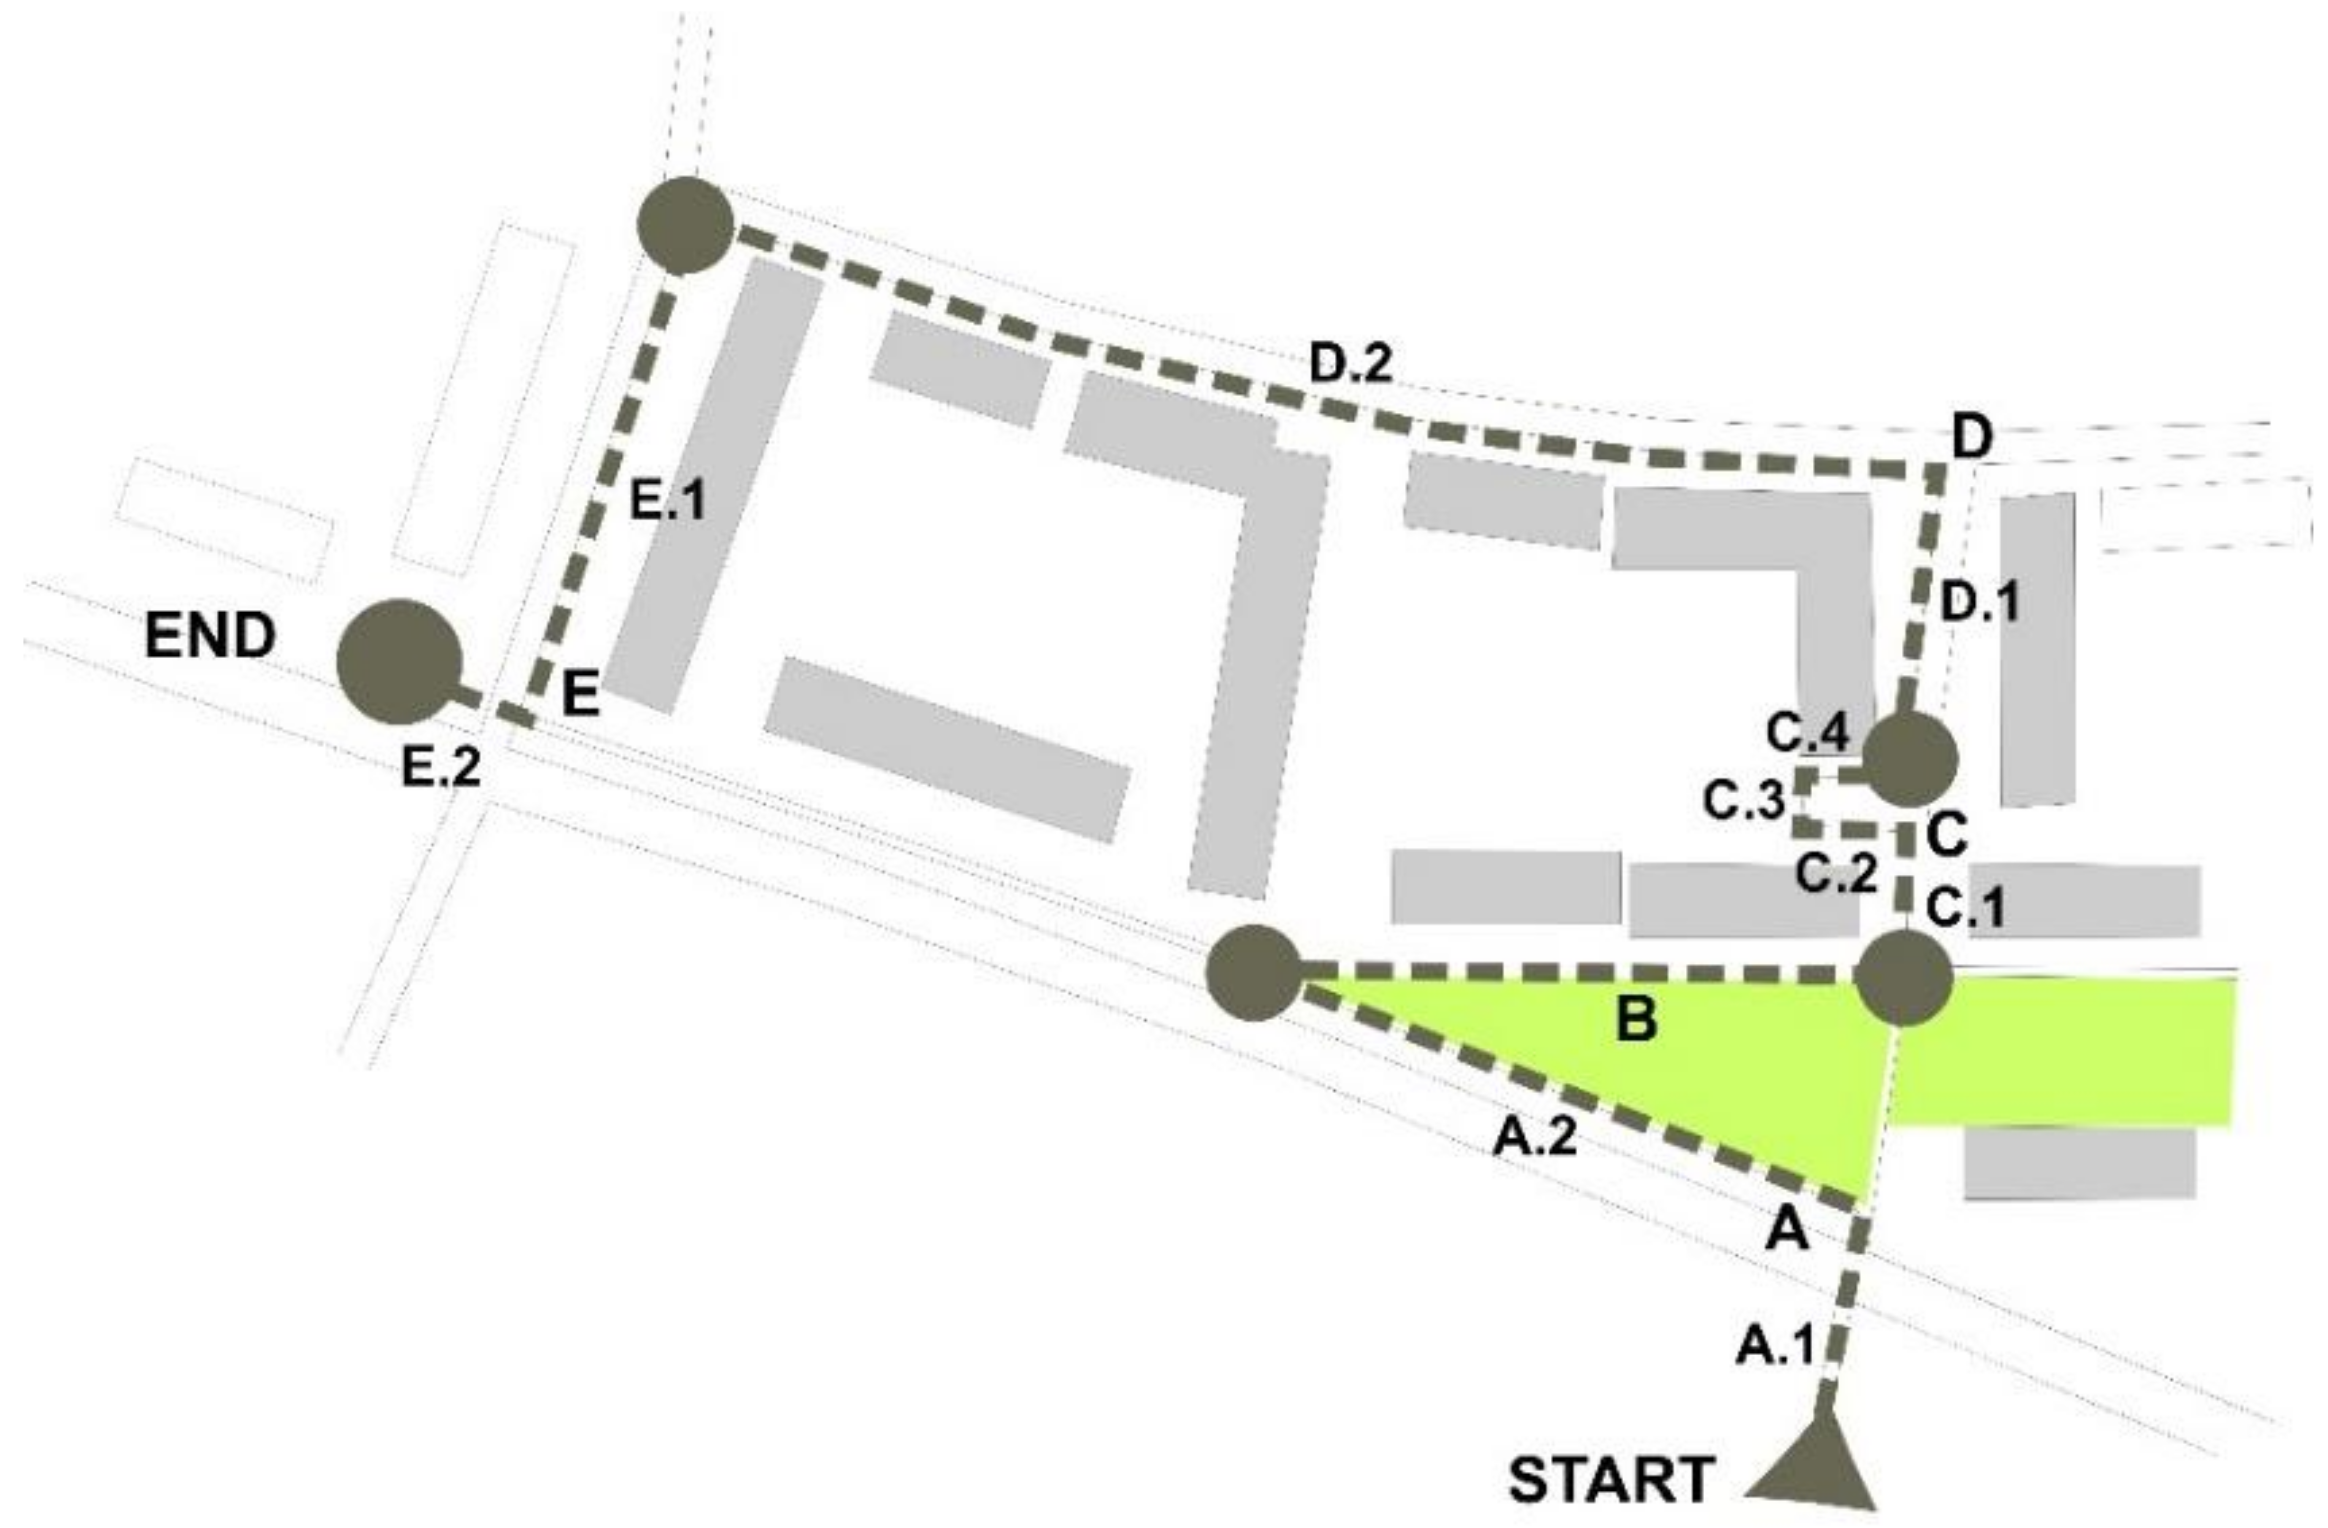
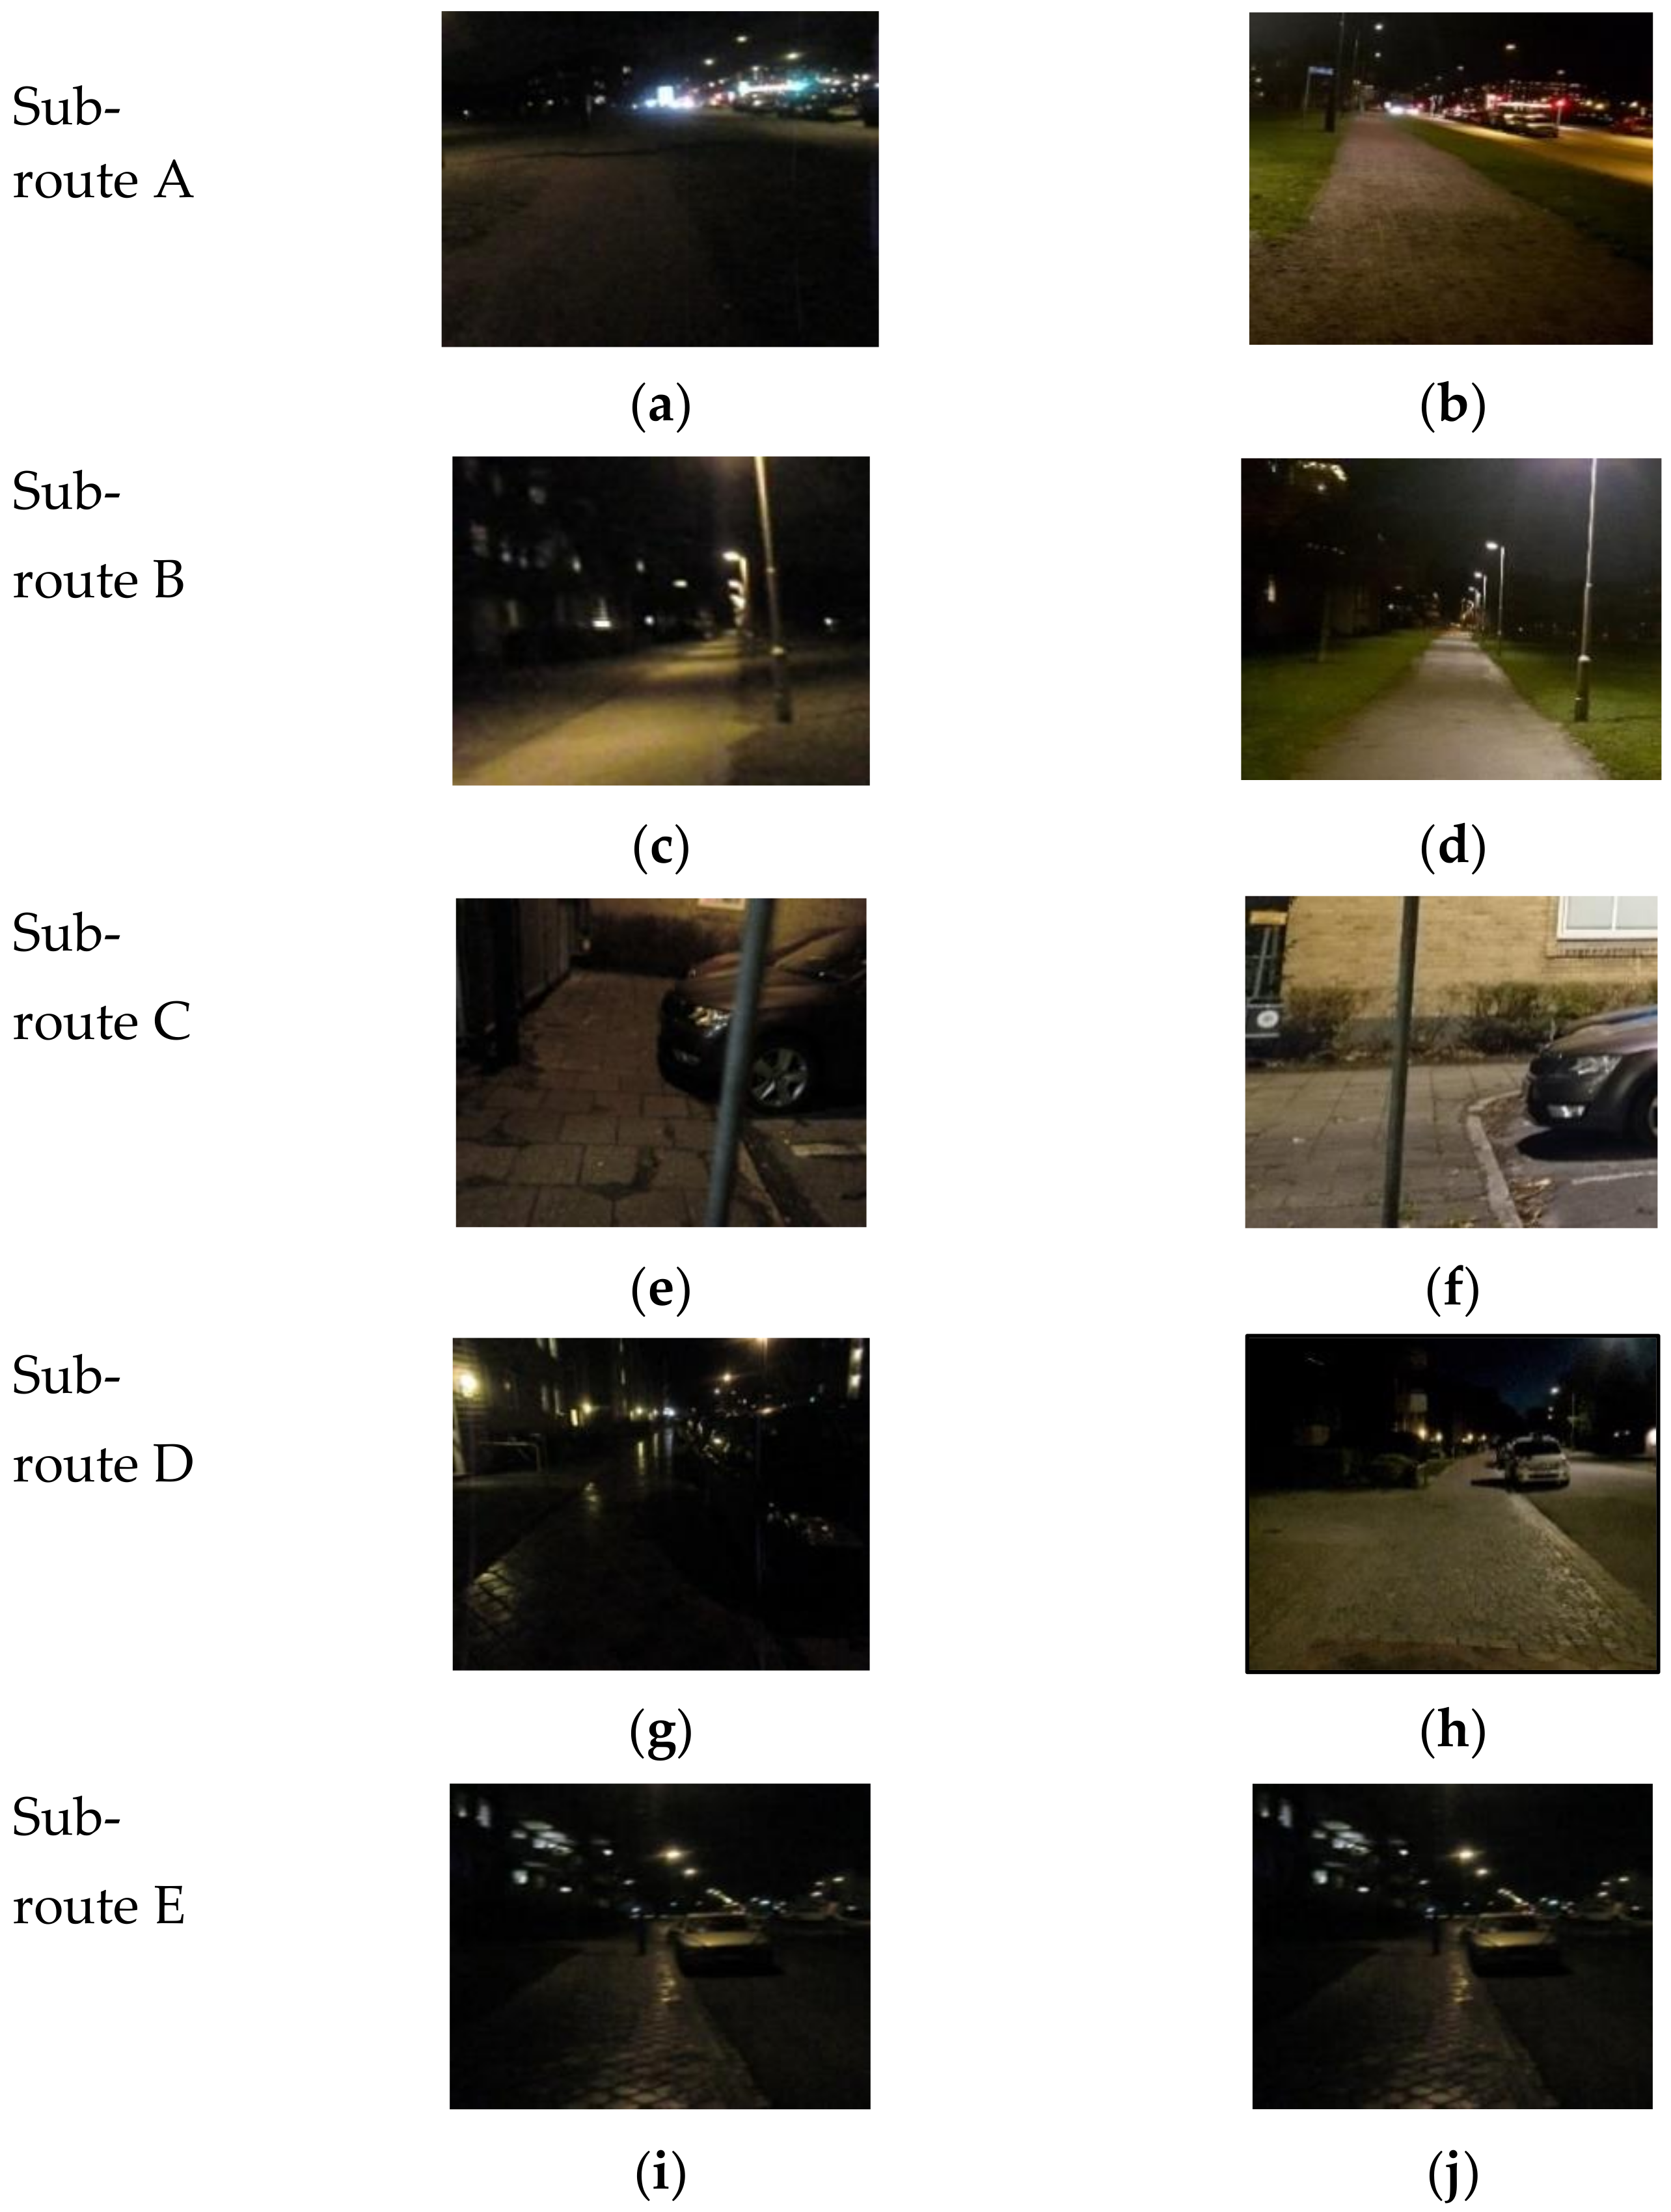
This study was conducted as a pilot study in an interdisciplinary cooperation between researchers specializing in environmental psychology and traffic planning. These disciplines both hold that the environmental setting and its features have important effects on individuals’ experiences of an environment when engaging in activities such as urban walking. The study was implemented as a before–after study designed to evaluate the impact of an outdoor lighting intervention on urban walking among people with vision impairment.
The study was conducted in a neighborhood in a suburban residential area of a city with about 340,000 inhabitants in southern Sweden. The neighborhood is dominated by a number of 4–6 story free residential buildings that line the streets and were mostly built during the 1950s. It also has a few street-level commercial premises. The test site included typical features of the physical environment in such neighborhoods, including entrances to residential buildings and shops, intersections, pedestrian crossings, pavements, pedestrian paths, greenery, and landmarks. The type and locations of its outdoor lighting units were also typical of those found in such neighborhoods. According to the criteria of Persson [54], the neighborhood’s street network is semi-integrated. The test site was chosen based on expert evaluations and the fact that the municipal authority was willing to revise the area’s outdoor lighting based on an assessment of the existing lighting.

2.2. The Test Route

The test route was about 500 meters long. It began on a pavement at the intersection of a four-lane street with a controlled pedestrian crossing and continued along a pedestrian path passing through an area with a lawn. It then extended over a pavement running alongside a parking area, a number of apartment buildings, a public primary school, and a grocery shop. It ended after a new intersection with an uncontrolled pedestrian crossing.
The pedestrian path featured both natural and artificial guidance surfaces, as well as warning surfaces indicating a cycle path and street crossings; the surface materials included asphalt, concrete slabs, gravel, cobblestones, and brick tiles. The route was divided into 5 sub-routes (A–E; see Figure 1) with different physical characteristics (i.e., shape, pavement materials, surroundings) and lighting types; each route was between 50 and 150 meters long. Each sub-route was further divided into one or more parts depending on its existing lighting units and/or environmental characteristics.

2.3. Outdoor Lighting Intervention

The lighting intervention was implemented by the city’s Traffic and Property Management Department [56] and based on preliminary findings about the participants’ responses to the existing lighting prior to the intervention (i.e., the positive responses to the warm white lighting with regard to lighting quality). The intervention in all instances adhered to the Swedish Transport Administration’s street and road design guide (vägar och gators utformning, VGU a document developed in accordance with the Swedish laws and regulations to guide city planners in the planning of outdoor environments). The intervention was also based on past experiences with street lighting within the city (e.g., lighting units, lighting types, and users in similar areas), practical feasibility and the available budget.
One of the main purposes of the intervention was to provide evenly distributed illumination, which is considered crucial for the mobility of people with vision impairment [18,20]. The intervention involved replacing the existing lighting along sub-routes C and D by removing old high-pressure sodium lamps (80 watt) and installing new LED lamps (83 watt). The old lamps had a Correlated Color Temperature (CCT) of about 1900 Kelvin (K) and a Color Rendering Index (CRI) of Ra8.4, while the LED replacements have a CCT of 3000 K and a CRI of about Ra84. The LED lamps were placed on the existing poles and the luminaire overhang was increased to 2.50 m. In sub-route A, three additional LED lamps were hung along a gravel section (A.2). The original LED lights (LED lamps, 75 watt with a CCT of 3000 Kelvin and CRI of Ra75) along sub-route B were kept but were raised to a height of around 5 meters to reduce glare. For sub-route E, we decided to keep the existing lighting units (HPS lamps, 80 watt, with a CCT of 1900 K and a CRI of Ra8.4) as a reference.
Figure 2 shows the outdoor lighting for sub-routes A–E before and after the intervention. Measurements of horizontal illuminance along each sub-route were conducted by the researchers (P.M.; T.L.). Before the intervention, the average horizontal illuminance (Eh) value on the ground was highest along sub-route B (26.9 lux); the average Eh values for the other sub-routes ranged from 0 to 22.05 lux. The intervention increased the average Eh values of sub-routes A–D to between 6.41 and 35.42 lux; again, sub-route B had the highest illuminance. The average Eh values for sub-route E before and after the intervention were rather similar. The properties of the lighting units before and after the intervention are summarized in Table 1.

2.4. Participants

Participants were recruited by the traffic planning researchers (M.A.; A.S.) as a snowball sample, in cooperation with organizations for people with impaired vision in the Scania region of Sweden. The intention with the sample was to give a broad picture of vision-impaired pedestrians and their possibilities to move around by themselves in the environment without any technical aids. Detailed information about the study was sent to individuals who expressed interest in participating; they were also informed that participation was voluntary and that they could withdraw at any time without giving any reason and/or suffering any consequence. Participants were given more detailed information by phone before giving their final agreement to participate by signing an informed consent form.
The sample consisted of 17 individuals (12 males and 5 females, with a mean age of 57 years) with different types and causes of vision impairment, who agreed to participate in the study before the lighting intervention in 2016. After the intervention, three participants dropped out of the study due to personal or external factors. The final sample thus comprised 14 individuals (11 male and 3 female) with ages ranging from 17 to 72 years (mean: 52 years). Six of the participants reported having vision impairment since birth, 2 since childhood, and 6 said they had had their impairment for between 6 and 17 years. The causes of the impairment varied, but all participants stated that the degree of their impairment caused difficulties when walking outdoors in darkness. No participants used a long white cane; one participant reported hearing impairment; all participants walked outdoors in daylight but not very much in darkness. In particular, they avoided walking alone or in unfamiliar areas.

2.5. Data Collection

A mixed methods approach [57] was used for data collection: observations were made using a structured study-specific form, and structured interviews were conducted with the participants. The focus was on infrastructure elements and the physical environment dimension of the operationalized HEI model.

2.5.1. Observation

To characterize molecular aspects of the environment, traffic planning researchers have developed techniques for capturing the usability of a walking environment [26,58] based on a detailed and meticulous place-specific protocol for evaluating possible human–environment interactions occurring in place. The observation protocol was developed by experts in the field of accessibility/usability in infrastructure settings and captures all features of the walking environment. It is used to evaluate the presence and quality of certain infrastructure elements and to observe how people with different physical abilities cope with these elements in the environment, i.e., to assess the environment’s usability [58].
For the purposes of this study, the protocol relating to the molecular aspects of the physical environment dimension was adapted to specifically capture the orientation and detection of infrastructure elements with important effects on the test route’s usability for people with vision impairment. The observation protocol was place-specific and was developed by performing the following steps:
  • Experts in accessibility/usability issues conducted an inspection walk along the test route to detect and record all infrastructure elements that might affect the safety and security of walking for the group of pedestrians in focus, i.e., people with vision impairment [11,15,59].
  • Based on these records, a form-based protocol was developed in which each important element in the environment was treated as a specific item that was assessed in terms of orientation or detection: for each item, the observer enters a “Yes” on the form if the participant either orally expresses noticing it or is clearly seen to register it. Otherwise, the observer enters a “No” for the item.
  • The protocol was validated by two external accessibility experts and then evaluated in a pilot test involving two persons with vision impairment, who walked along the test route and gave important comments that prompted some changes to the protocol.
The observation process of the final protocol featured 226 items in total along the five sub-routes, 91 of which were assessed with respect to orientation and 135 of which were assessed with respect to detection (Table 2).

2.5.2. Structured Interview

Interviews were conducted using the Perceived Lighting Quality (POLQ) instrument [42] to assess the participants’ perceptions of the outdoor lighting. This instrument is an observer-based environmental assessment tool designed for the assessment of outdoor lighting, and is based on the work of Küller and Wetterberg [60,61]. It uses semantic differentials with a five-point scale (ranging from 1 to 5) to capture individuals’ perceptions of outdoor lighting in the terms of the Perceived Strength Quality (PSQ) and Perceived Comfort Quality (PCQ). PSQ is evaluated using the bipolar adjective pairs: Subdued–Brilliant, Weak–Strong, Dark–Light, Unfocused–Focused, and Drab–Clear, while PCQ is evaluated using the adjective pairs: Hard–Soft, Warm–Cool, Unnatural–Natural, Glaring–Shaded, and Sharp–Mild. Additionally, the adjective pairs: Unevenly distributed–Evenly distributed and Flicker–No flicker were used separately to capture perceptions of lighting. The participants were also asked “How well could you see under the lighting along this route?”, which was answered on a five point scale ranging from “Bad” to “Good”. To evaluate participants’ experiences of walking along the route, the participants were also asked “Where did you look when you walked along this route”? Three responses were possible for this question: “Down, close to my feet”, “Down and ahead”, and “Far ahead”. The interview questions were developed based on past research experience [18,42].

2.6. Procedure

Data were collected on two occasions, first before the intervention in the autumn/winter of 2016/2017 and then after the intervention in the autumn/winter of 2017/2018. In both cases, data were collected in the evening between 18:30 and 20:00 by an observer (P.M.) and an assistant. On each data collection evening, one participant visited the area. The weather was generally calm but on some occasions it was slightly windy or there was light precipitation. The temperature was between −4 and 14 °C. None of the participants had walked the route before, and only a few of them were familiar with the area.
On arriving, the participant was first informed about the schedule for the test evening. The participant then took an introductory walk with the observer and the assistant. During this walk, the observer pointed out the different environmental features along the route that were included in the observational study, along with the different surroundings of the route. This was done because the environment was unfamiliar to the participant and because people with vision impairment rarely walk alone in unfamiliar areas before having them described. The participant was also able to ask questions before starting the test walk.
During the test walk, the observer registered in the protocol whether or not the items were identified by the participants. This was done in two ways: (i) what the observer actually observed to capture how the participant walked and oriented him or herself, and if or how s/he detected the infrastructure elements classified as observation items in the protocol; and (ii) what the participants orally informed on what element they noticed and commented on while walking. The observer followed the participant, watching and listening to the participant, and filled the protocol. The assistant walked beside the participant for safety reasons. The participant was asked to stop at the end of each sub-route for an interview about his/her perception of the lighting quality.

2.7. Data Treatment and Analysis

Before the analysis, each observation item was categorized as either an orientation item or a detection item (see Table 3) by two of the authors (M.A.; A.S.) who have expertise in accessibility and usability. Additionally, the items were assigned values of 0, +1, or +2 based on their perceived importance for safe and secure walking for people with vision impairment. All orientation items were assigned values of +1. Conversely, detection items were assigned different values reflecting their perceived importance for safe and secure walking. Items whose detection was considered “very important” were assigned a value of +2; such items included “Detect warning surface”, “Detect white line indicating boundary of bicycle path”, “Notice end of walkway”, “Notice driveway to garage to the left”. Items considered “important” were assigned values of +1; such items included “Notice end of white line”, “Detect building entrances”, and “Detect bicycle parking”. Items considered merely “beneficial” for safe and secure walking were assigned values of 0; these items included “Notice car park ticket machine to the right” and “Notice concrete pavement”. (For the complete coding list, see Appendix A).
Of all 226 items, a total of 21 items were discarded because (i) the items were rather inconsequential considering the overall data analysis, or (ii) environmental elements corresponding to the items were changed or removed after the intervention (see Appendix A). The observation data were then summarized stepwise (by M.A.; A.S.) by multiplying the number of participants by the numbers of observation items associated with different groups of sub-routes (Table 3). Summarizations were performed in this way for each sub-route individually and for sub-routes A to D together (i.e., the entire route over which the lighting intervention was implemented), first by summarizing all items together (i.e., both orientation and detection items), then by summarizing the orientation and detection items separately, and finally by summarizing the detection items assigned values of +2, +1, and 0 separately. The statistical significance of differences in the summed scores before and after the intervention was evaluated using McNemar’s Chi-squared test.
The interview data on perceived lighting quality were analyzed using Wilcoxon signed rank tests to test for differences before and after the lighting intervention. The data were first analyzed at an aggregated level, i.e., in terms of (i) Perceived Strength Quality (PSQ) and (ii) Perceived Comfort Quality (PCQ). The data were also analyzed based on the bipolar adjectives corresponding to PSQ and PCQ separately. Pearson’s Chi squared test was used to analyze the data on where the participants looked during the walk and to determine whether it differed before and after the lighting intervention. As for the observation data, analyses of the interview data were performed for each sub-route individually and for sub-routes A–D as a combined route.
All statistical analyses were performed using IBM SPSS Statistics 24 software. In addition, test values for McNemar’s Chi squared test were calculated using a formula [62]. Calculations were also made for effect sizes of Wilcoxon signed rank tests [63]. These calculations were performed separately because they were not included in the SPSS outputs.

2.8. Ethical Considerations

Before the study was conducted, ethical approval was sought from and granted by the Regional Committee for Research Ethics in Lund.

3. Results

3.1. The Impact of the Lighting Intervention for Sub-routes A,B,C,D

3.1.1. Observation Data

The lighting intervention increased the overall usability of the environment along sub-routes A to D: analyses using McNemar’s Chi squared test (Table 4) showed that the intervention significantly increased the participants’ ability to orientate themselves and detect different infrastructure elements along the entire route.
The lighting intervention caused no statistically significant change in the participants’ ability to orientate themselves. However, it did significantly increase their ability to detect infrastructure elements. There was no significant change in the detection of elements categorized as “very important” (i.e., those assigned a value of +2) or “beneficial” (value 0) for safe and secure walking, while there was a significant increase in detection of elements categorized as important (value +1) after the intervention.
Analyses of the individual sub-routes revealed that the intervention increased the participants’ ability to orientate themselves in the middle of the walkway and make a left turn when walking along the gravel path after crossing the street on sub-route A (A.2): X2(1) = 5.14, p < 0.05 (2-sided). The odds ratio in this case was infinite, and ‘Yes’ scores before and after the intervention were 18 (64.3%) and 25 (89.3%), respectively. A similar result was obtained for sub-route D: the intervention significantly increased the participants’ ability to orientate themselves in the middle of the walkway: (X2(1) = 9.19, p < 0.005 (2-sided), odds ratio = 3.74, score = 105 (53.6%) before the intervention and 131 (66.8%) after. This was achieved at the expense of orientation along grassy edges, curbs, hedges, and railings, for which X2(1) = 7.68, p < 0.01 (2-sided), odds ratio = 3.40, and the score was 100 (47.6%) before the intervention and only 75 (35.7%) afterwards. Likewise, the intervention increased the participants’ detection of infrastructure elements along sub-route D: X2(1) = 34.59, p < 0.001 (2-sided), odds ratio = 5.28, and the score increased from 428 (49.3%) to 526 (60.6%). The change was particularly pronounced for the elements regarded as “important” (value +1): X2(1) = 28.94, p < 0.001 (2-sided), odds ratio = 4.33, score 197 (46.9%) before the intervention and 263 (62.6%) afterwards.
Along sub-route A, the intervention strongly increased the participants’ ability to detect the white lines at the island when crossing the street, raising the score for this element from 1 (3.6%) to 10 (35.7%): X2(1) = 5.82, p < 0.05 (2-sided), odds ratio = 0. Additionally, the intervention increased the ability to detect the lighting poles along sub-route B, raising the score for this element from 37 (66.1%) to 47 (83.9%): X2(1) = 4.05, p < 0.05 (2-sided), odds ratio = 1.71. Other items exhibiting significant score increases after the intervention were the ability to notice entrances to apartment buildings and to detect bicycle parking areas along sub-route D. The score for the former item went from 73 (47.4%) to 106 (68.8%): X2(1) = 16.79, p < 0.001 (2-sided), odds ratio = 3.05, while the score for the latter item went from 72 (46.8%) to 99 (64.3%): X2(1) = 14.38, p < 0.001 (2-sided), odds ratio = 7.54.

3.1.2. Interview Data

Table 5 shows the POLQ results and the outcomes of Wilcoxon signed rank tests for sub-routes A–D. The Perceived Strength Quality (PSQ) of the lighting and the scores for each of the five PSQ items (i.e., Brilliant, Light, Strong, Focused, Clear) were found to increase after the intervention. However, the intervention had no significant effect on the Perceived Comfort Quality (PCQ). The intervention also increased the score for the “evenly distributed” item and improved the participants’ experience in terms of how well they could see along the route.
The intervention significantly increased the PSQ along sub-routes A, B, and D. In the case of sub-route A, Mdn rose from 2.00 to 3.80; Z = 2.59, p < 0.01 (2-tailed), r = 0.51. For sub-route B, Mdn rose from 3.60 to 4.00; Z = 2.04, p < 0.05 (2-tailed), r = 0.40. For sub-route D, Mdn increased from 2.40 to 3.50; Z = 2.81, p < 0.01 (2-tailed), r = 0.53. Additionally, the “evenly distributed” item scores increased significantly for sub-routes A, C, and D. For sub-route A, the intervention raised the Mdn for this item from 3.00 to 4.00; Z = 2.12, p < 0.05 (2-tailed), r = 0.40. For sub-route C, Mdn rose from 1.00 to 3.50; Z = 2.12, p < 0.01 (2-tailed), r = 0.52. For sub-route D, Mdn rose from 1.50 to 4.00; Z = 2.54, p < 0.05 (2-tailed), r = 0.48. The scores for the participants’ experience in terms of how well they could see along the route also increased significantly after the intervention for all four sub-routes. For sub-route A, Mdn rose from 2.00 to 4.00; Z = 3.00, p < 0.005 (2-tailed), r = 0.57. For sub-route B, Mdn rose from 4.00 to 4.75; Z = 2.44, p < 0.05 (2-tailed), r = 0.46. For sub-route C, Mdn rose from 2.00 to 4.00; Z = 3.36, p < 0.005 (2-tailed), r = 0.64. For sub-route D, Mdn rose from 2.00 to 3.50; Z = 3.00, p < 0.005 (2-tailed), r = 0.57).
When analyzing where the participants looked during the walk before and after the intervention, the scores for “looked downwards and ahead” and “looked ahead” for sub-routes A–D collectively rose from 23 to 25 and from 9 to 13, respectively, while the score for “looked down, close to my feet” fell from 22 to 15. A similar pattern was found for each of the four sub-routes. These changes were not statistically significant: X2(2, n = 107) = 2.13, p = 0.345 (2-sided), Cramer’s V = 0.141.

3.2. Reference Area (sub-route E)

3.2.1. Observation Data

For the reference area (sub-route E), McNemar’s Chi-squared tests indicated that there was no significant difference in the participants’ ability to orientate themselves and detect different infrastructure elements along this sub-route after the intervention (Table 6).

3.2.2. Interview Data

The Wilcoxon signed rank test revealed that the participants’ perception of the lighting quality in the reference area after the intervention differed significantly from that before the intervention (Table 7): the PSQ scores decreased significantly, but the PCQ scores increased significantly. The values for three PSQ items (Light, Focused, and Clear) decreased significantly after the intervention, while the values of two PCQ items (Warm and Shaded) increased significantly. Additionally, there was a decrease in the scores for how well participants experienced that they could see under the lighting along the sub-route.
There was no significant change in where the participants looked while walking along sub-route E: X2(2, n = 28) = 0.19, p = 0.910 (2-sided), Cramer’s V = 0.082. Of 14 participants, the score for “looked down, close to my feet” was 4 before the intervention and 5 afterwards; the corresponding values for “looked down and ahead” were 7 and 6, while those for “looked ahead” were 3 on both occasions.

4. Discussion

This study investigated the impact of an outdoor lighting intervention on urban walking for people with impaired vision. Uniquely among studies of this kind, it was conducted in a real-world environment rather than a laboratory [3,45,46]. The intervention’s overall effect was positive because it increased the usability of the walkway over which it was implemented by increasing users’ ability to orientate themselves and detect infrastructure elements in the pedestrian environment.
More specifically, the study showed that after the installation of the new lighting, pedestrians with impaired vision were better able to detect details of the environment. The intervention involved multiple measures, including adding new LED lamps (along sub-route A: A.2), replacing HPS lamps with LED ones with a longer luminaire overhang of 2.50 meters (along sub-routes C and D), and increasing the mounting height of existing LED lamps (along sub-route B). Consequently, the results obtained cannot be attributed exclusively to the introduction of LED lighting. The participants experienced the changes to be beneficial because they increased the Perceived Strength Quality (PSQ) of the lighting along the route and resulted in a more positive experience when walking along the route, which is encouraging. Taken together, these results indicate that the lighting intervention improved the usability of the urban pedestrian environment by increasing the ability of individuals with impaired vision to orientate themselves and detect infrastructure elements, and also by increasing the perceived lighting quality of the pedestrian environment to some extent.
A pleasing outcome of the intervention is that the participants’ ability to orientate themselves and detect environmental features increased strongly along the two sub-routes where new lighting units have been applied (A and D), resulting in both higher total scores for the observation items and increases in scores for particularly important individual items. Specifically, the participants’ ability to detect infrastructure elements considered important for safe and secure walking (i.e., items assigned importance values of +1) exhibited the strongest increases. For example, the intervention significantly increased the participants’ ability to detect the white lines at the island in the middle of the road (i.e., the contrast markings) in sub-route A, which is very important for safe crossing. Additionally, there were significant improvements in the detection of building entrances and bicycle parking areas along sub-route D. The intervention also caused the participants to orientate themselves differently in terms of where on the pavement they walked and where they were looking while walking along sub-routes A and D.
The increased ability for vision-impaired pedestrians to orientate themselves and detect infrastructure elements in the pedestrian environment was confirmed by the results of the structured interviews which showed that the participants experienced that the lighting was more evenly distributed along the sub-routes with new LED lighting. This is particularly important because people with vision impairment often refer to uneven lighting as a major barrier [18,29]. The importance of evenly distributed light is also stressed by Swedish legislation and recommendations [11,15,59]. After the intervention, participants had a greater tendency to look ahead while walking rather than focusing on their feet, which may indicate that the improved lighting enabled pedestrians with impaired vision to have more relaxed and less tiring walks. The importance of this was highlighted by previous studies [19,21,25]. However, this change was not statistically significant.
Taken together, the results of the observations and the structured interviews indicate that it is possible to improve the ability of people with vision impairment to move around outdoors during hours of darkness by implementing measures beneficial to all pedestrians. It should be noted that the intervention was not restricted to replacing and adding light sources. For example, along sub-routes B and D, the mounting height of the streetlights and the luminaire overhang were increased, respectively. As a result of these changes, participants became more able to detect details of the environment such as lampposts, entrances to apartment buildings, and bicycle parking areas along these sub-routes. In addition, the participants reported that the intervention improved their ability to see while walking along these sub-routes. This suggests that when planning for outdoor lighting in an environment, it is important to apply a combination of changes based on consideration of the environment’s molecular aspects to create a supportive environment (i.e., one with favorable molar aspects) rather than focusing on a single solution.
The results presented here also raise some questions about the benefits of LED lighting. Along sub-routes with newly installed LED lights, participants experienced a greater perceived strength quality and a more even distribution of light, and also reported that they could see better. However, there was no corresponding increase in lighting quality in terms of perceived comfort along any of the sub-routes. Interestingly, the perceived comfort quality of the lighting from HPS lamps on sub-route E was significantly higher after the intervention even though the lighting units of this sub-route were left unchanged. However, the perceived strength quality of the lighting on this sub-route was significantly lower than it was before the intervention, and the participants reported that their ability to see was reduced. These findings are interesting because they suggest that participants may have responded more favorably to the lighting on sub-route E than to the LED lighting on the preceding sub-routes, and that the yellow light (with a CCT of about 1,900 K) of the HPS lamps may have provided more perceived comfort quality than the white light (with a CCT of 3,000 K) from the LED lamps. Similar results showing a mismatch between perceived strength quality and perceived comfort quality have been reported for pedestrians without vision impairment [45].
These findings also indicate that differences in illuminance level and color temperature can strongly affect the perception of lighting quality in areas with combined outdoor lighting. This is important when planning for a usable pedestrian environment and particularly for people with vision impairment, because it suggests that any analysis of the possible types of lighting in an area where new outdoor lighting designs are to be introduced should be combined with a similar analysis of nearby areas. This is because the eyes usually take time to adapt, especially to darker lighting conditions, and this process is slower among people with impaired vision [64].
The study design based on within-subject analysis and mixed methods proved to be sufficiently sensitive to capture variations in the behavior (i.e., orientation and detection) of people with vision impairment while walking alone in an urban environment [57]. The intention with this study was to give a broad picture of people with vision impairment and how improved outdoor lighting may impact their perception and real possibilities to move around after dark. A small sample may limit the possibility to generalize from the obtained results. Further studies including a larger sample, with a particular focus on different causes or diagnoses, would thus be desirable. Additionally, the mixed methods approach strengthened the study’s findings because the results of the structured interviews clarified and shed further light on the observational results. Several aspects of the study’s design merit some discussion—notably, the fact that it was conducted in real urban environments during hours of darkness, using a specific protocol. A major strength of this work is that it was conducted along a route with diverse environmental characteristics and lighting design considerations. It is challenging to make observations during hours of darkness, but all of the authors have extensive experiences with study designs of this type, and the researcher who conducted the observations (P.M.) was given training by highly experienced accessibility advisors both in daylight and in darkness in the study area before the study began. Furthermore, the study protocol was designed by two accessibility experts (M.A.; A.S.) and tested by two external accessibility experts. It can therefore be considered valid and reliable. Importantly, it encompasses the environmental aspects and features regulated by Swedish Building Law and the regulations for rebuilding public areas [59,65]. The study design and methods used in this work may thus be generally applicable in assessments of pedestrian environments having both uniform lighting systems and mixed lighting systems.

5. Conclusions

This study showed that improved outdoor lighting can increase the usability of the pedestrian environment and thereby support urban walking after dark for people with vision impairment. It is essential that such lighting was perceived as providing sufficient strength quality and being evenly distributed in the pedestrian environment. It was found that LED outdoor lighting applications support urban walking by people with vision impairment by improving the usability of the pedestrian environment. However, the introduction of LED lights did not improve the comfort quality of the studied area’s lighting, suggesting that there is a need to find ways to improve in this respect and to better support the ability of vision-impaired pedestrians to detect details of the walking environment that may be crucial for secure and safe walking. Therefore, during the ongoing transition to LED light sources for outdoor applications on larger scales, it is important to ensure that new lighting systems and implementations are tested to confirm that they adequately support the usability of pedestrian environments so as to reduce the risk of inappropriate lighting design. A combination of changes based on the molecular aspects of the environment should also be taken into consideration to create a supportive environment that provides opportunities for the pedestrians to take relaxed walks without becoming exhausted and thereby increasing their mobility. In urban environments with many different types of pedestrians and road users, it is important for public lighting systems to support all users to the greatest degree possible.

Author Contributions

Conceptualization, A.S., M.J., M.A., and E.M.; Methodology, A.S., M.J., M.A., E.M., and T.L.; Formal analysis, P.M., A.S., and M.A.; Investigation, P.M., M.A., and T.L.; Writing—original draft preparation, P.M. and A.S.; Writing—review and editing, A.S., P.M., M.J., M.A., T.L., and E.M.; Visualization, P.M.; Supervision, A.S., M.J., M.A., and T.L.; Project administration, P.M. and E.M.; Funding acquisition, E.M. and M.J. All authors have read and agreed to the published version of the manuscript.

Funding

The intervention study was supported by a grant from the Swedish Energy Agency, grant number: P42469–1 “Energy effective lighting solutions and urban walking among vulnerable groups in society”. The intervention study was also part of a larger project titled “Lighting Metropolis” in the EU Interreg Öresund–Kattegat–Skagerrak program as well as an overarching project on design of the outdoor environment for people with vision impairment from the Swedish Transport Administration.

Acknowledgments

We thank all the participants who, with high commitment, walked along the route and shared their experience. We would also like to thank the Center for Aging and Supportive Environments (CASE) at Lund University for supporting us during the development of the conceptual framework for this study and the Traffic and Property Management Department, City of Malmö for the lighting installations, Maria Wemme and Märit Lundwall for comments and feedback on the observation protocol in this study, and Catharina Hansson who assisted with data collection in the field.

Conflicts of Interest

The authors declare no conflict of interest. The funders had no role in the design of the study; in the collection, analyses, or interpretation of data; in the writing of the manuscript, and in the decision to publish the results.

Appendix A

  • Orientation items assigned value +1:
    For sub-route A “Walk in the middle of walkway”, “Turn 45 degrees left with help of guidance surface”, “Turn 90 degrees left”; For sub-route B “Walk in the middle of walkway”, “Turn 180 degree”; For sub-route C “Walk in the middle of walkway”, “Walk along curbs/edges of walkway”, “Turn 90 degrees left”, “Turn 90 degrees right”; For sub-route D “Walk in the middle of walkway”, “Walk along curbs, near the road”, “Walk near grassy edges, hedges, and railing, close to the buildings”, “Turn 90 degrees left”; For sub-route E “Walk on the walkway”, “Walk along, near the road”, “Walk near grassy edges, close to the buildings”, “Turn 90 degrees left”
  • Detection items assigned a value of +2:
    For sub-route A “Detect guidance surfaces”, “Detect warning surfaces”, “Detect edges of traffic island”, “Detect white line for the edges”, “Detect bicycle path via warning surfaces”, “Detect benches”; For sub-route B “Detect unevenness on walkway”, “Detect white line indicating boundary of bicycle path”; For sub-route C “Notice end of walkway”, “Detect cobblestone pavement”, “Hit parked cars”; For sub-route D “Detect cobblestone pavement”, “Notice changes in pavement materials”, “Notice speed bump and manhole cover”, “Detect sign posts on walkway”, “Detect sign posts to the right”, “Notice driveways to garage to the left”, “Notice pedestrian crossing”, “Notice parking spot to the left”; For route E “Detect lamp posts on walkway”, “Notice driveway to garage to the left”, Notice no step before and after pedestrian crossing”, “Detect cobblestone pavement and manhole cover”, Detect grass to the right”.
  • Detection items assigned a value of +1:
    For sub-route A “Detect guidance surfaces”, “Notice end of white line”, “Notice bench”, Notice change in surface material to gravel”, “Notice outdoor lighting on the walkway nearby”; For sub-route B “Notice change in surface material to asphalt”; For sub-route C “Notice change in surface material to asphalt”, “Notice hedge, bicycle parking and fence”, Detect lamp post on walkway”; For sub-route D “Detect building entrances”, “Detect bicycle parking”, “Detect basement entrances”, “Detect sign posts on walkway”, “Notice grocery shop and shopfront”, “Notice vent pipe, pole, stone, soil surface newspaper box and mail box”; For sub-route E “Notice electrical cabinet on walkway”.
  • Detection items assigned a value of 0:
    For sub-route A “Notice concrete pavement and pole”, “Notice lamp posts”, Notice car park ticket machine to the right”; For sub-route B “Notice lamp posts to the right”, “Notice hedge to the right”; For sub-route C “Detect sign post to the left”, Notice white door and tree”; For sub-route D “Notice poles and sign posts to the left”, “Notice electrical cabinet and newspaper box”, “Notice walkway to the left”; For sub-route E “Notice concrete pavement”.
  • Discarded items:
    For sub-route A “Walk along edges on the left/right”, “Wiggle”; “Cross the street”, “Use the control panel”, “Listen to the sound signal”, “Detect white line far ahead”, “Detect unevenness on the walkway”, “Cope with the unevenness”, “Notice commercial sign”; For sub-route B “walk along edges to the left/right”, “Wiggle”; For sub-route E “Cross the road”.

References

  1. United Nations. Goal 11: Make cities inclusive, safe, resilient and sustainable. Retrieved from Sustainable development goals. Available online: https://www.un.org/sustainabledevelopment/cities/ (accessed on 29 December 2018).
  2. Handy, S.; Cao, X.; Mokhtarian, P.L. Self-selection in the relationship between the built environment and walking: empirical evidence from Northern California. J. Am. Plan. Assoc. 2006, 72, 55–74. [Google Scholar] [CrossRef]
  3. Van Cauwenberg, J.; Van Holle, V.; Simons, D.; DeRidder, R.; Clarys, P.; Goubert, L.; Nasar, J.; Salmon, J.; De Bourdeaudhuij, I.; Deforche, B. Environmental factors influencing older adults’ walking for transportation: A study using walk-along interviews. Int. J. Behav. Nutr. Phys. Act. 2012, 9, 85. [Google Scholar] [CrossRef] [PubMed] [Green Version]
  4. Van Cauwenberg, J.; Van Holle, V.; De Bourdeaudhuij, I.; Clarys, P.; Nasar, J.; Salmon, J.; Maes, L.; Goubert, L.; Van De Weghe, N.; Deforche, B. Physical environmental factors that invite older adults to walk for transportation. J. Environ. Psychol. 2014, 38, 94–103. [Google Scholar] [CrossRef] [Green Version]
  5. Xia, T.; Zhang, Y.; Crabb, S.; Shah, P. Cobenefits of replacing car trips with alternative transportation: A review of evidence and methodological issues. J. Environ. Public Heal. 2013, 2013, 797312. [Google Scholar] [CrossRef]
  6. Rafiemanzelat, R.; Emadi, M.I.; Kamali, A.J. City sustainability: the influence of walkability on built environments. Transp. Res. Procedia 2017, 24, 97–104. [Google Scholar] [CrossRef]
  7. The Organization for Economic Co-operation and Development, OECD. Ageing and Transport - Mobility Needs and Safety Issues; OECD Publishing: Paris, France, 2001; ISBN 92-64-19666-8. [Google Scholar]
  8. The European Conference of Ministers of Transport, ECMT. Improving transport accessibility for all: Guide to good practice (PDF file). 2006. Available online: https://www.itf-oecd.org/sites/default/files/docs/06tphguide.pdf (accessed on 1 November 2019).
  9. Stafford, L.; Baldwin, C. Planning walkable neighborhoods: Are we overlooking diversity in abilities and ages? J. Plan. Lit. 2018, 33, 17–30. [Google Scholar] [CrossRef] [Green Version]
  10. The Swedish National Board of Housing, Building and Planning, Boverket. The planning and building act, 1987 [revised 2011]. Available online: https://www.riksdagen.se/sv/dokument-lagar/dokument/svensk-forfattningssamling/plan--och-bygglag-198710_sfs-1987–10 (accessed on 1 August 2019).
  11. Boverket. Building regulations – mandatory provisions and general recommendations BFS 2018:4 (PDF file). 2018. Available online: https://rinfo.boverket.se/BBR/PDF/BFS2018–4-BBR-26.pdf (accessed on 1 August 2019).
  12. Boverket. Regulations and general recommendations on the removal of easily eliminated obstacles to and in premises to which the public has access and in public spaces BFS 2003:19 HIN1 (PDF file). 2003. Available online: https://www.boverket.se/globalassets/publikationer/dokument/2008/hin1_removal_of_easily_eliminated_obstacles_bfs_2003_19.pdf (accessed on 1 November 2019).
  13. Boverket. Regulations and general recommendations on accessibility and usability for people with limited mobility or orientation capacity in public spaces and in areas for constructions other than buildings BFS 2004:15 ALM1 (PDF file). 2004. Available online: https://www.boverket.se/globalassets/publikationer/dokument/2008/alm1_english.pdf (accessed on 14 August 2019).
  14. Boverket. Regulations and general recommendations on the removal of easily eliminated obstacles to and in premises to which the public has access and in public spaces BFS 2013:9 HIN3 (PDF file). 2013. Available online: https://rinfo.boverket.se/HIN/PDF/BFS-2013–9-HIN3.pdf (accessed on 14 August 2019).
  15. Boverket. Regulations and general recommendations on accessibility in public places BFS 2011:5 ALM2 (PDF file). 2011. Available online: https://rinfo.boverket.se/ALM/PDF/BFS2011–5-ALM2.pdf (accessed on 15 August 2019).
  16. Ståhl, A.; Almén, M.; Wemme, M. Orientation using guidance surfaces – blind tests of tactility in surfaces with different materials and structures (PDF file). The Swedish Road Administration: Borlänge, Sweden. 2004. Publication 2004:158E. Available online: https://trafikverket.ineko.se/Files/sv-SE/11127/RelatedFiles/2004_158E_orientation_using_guidance_surfaces_blind_tests_of_tactility_in_surface_with_different_materials_and_structures.pdf (accessed on 15 August 2019).
  17. Almén, M.; Ståhl, A. Dimensional Functional Ability. In European Committee for Standardization, CEN. 2007. Available online: https://its-sweden.se/wp-content/uploads/2013/07/ifopt_english_v2.0.pdf (accessed on 15 August 2019).
  18. Ståhl, A.; Almén, M.; Wemme, M. Ljushetskontrast: Studie med personer med synnedsättningar avseende sambandet mellan ljushetskontrast och skiljelinjes bredd; The Swedish Transport Administration: Borlänge, Sweden, 2010. [Google Scholar]
  19. Lid, I.M.; Solvang, P.K. (Dis)ability and the experience of accessibility in the urban environment. Alter 2016, 10, 181–194. [Google Scholar] [CrossRef]
  20. Almén, M.; Ståhl, A. Planering och utformning för fotgängare med fokus på personer med synnedsättningar; The Swedish Transport Administration: Borlänge, Sweden, 2016; p. 107. [Google Scholar]
  21. Ståhl, A.; Newman, E.; Dahlin-Ivanoff, S.; Almén, M.; Iwarsson, S. Detection of warning surfaces in pedestrian environments: The importance for blind people of kerbs, depth, and structure of tactile surfaces. Disabil. Rehabil. 2010, 32, 469–482. [Google Scholar] [CrossRef]
  22. Newman, E. Att vara blind på passage och perrong: som en resa utan skyltar och signaler; LTH Institutionen för teknik och samhälle: Lund, Sweden, 2010. [Google Scholar]
  23. Ståhl, A.; Almén, M.; Wemme, M.; Åkesson, G. Pollaremedtaktilabilder-Kan sådana utformningsdetaljer underlätta för personer med synnedsättningar att hålla riktningen när de korsar en körbana? The Swedish Transport Administration: Borlänge, Sweden, 2014. [Google Scholar]
  24. World Health Organization. Global Age-Friendly Cities: A Guide; World Health Organization: Geneva, Switzerland, 2007. [Google Scholar]
  25. Norgate, S.H. Accessibility of urban spaces for visually impaired pedestrians. Proc. Inst. Civ. Eng. Munic. Eng. 2012, 165, 231–237. [Google Scholar] [CrossRef] [Green Version]
  26. Ståhl, A.; Almén, M. Kontinuerligt ledstråk i Borlänge. Studie av fyra personer som är blinda och deras promenader längs stråket; The Swedish Transport Administration: Borlänge, Sweden, 2013; p. 94. [Google Scholar]
  27. Dtf. Local Transport Note 1/11 – Shared Space (PDF File); Dft: London, UK, 2011. Available online: https://www.gov.uk/government/publications/local-transport-note-ltn-1–11-shared-space (accessed on 20 June 2018).
  28. Jenness, J.; Singer, J. Visual Detection of Detectable Warning Materials by Pedestrians with Visual Impairments; Final Report: Prepared for Federal Highway Administration, Washington, DC; Westat: Rockville, MD, USA, 2006. [Google Scholar]
  29. Mitani, S.; Yoshida, T.; Minato, H.; Fujisawa, S.; Sueda, O. Measurement of luminance contrast sensitivity of persons with low visual capability in order to secure the visibility of tactile walking surface indicators. Assist. Technol. Res. Ser. 2007, 20, 326–330. [Google Scholar]
  30. Mitani, S.; Yoshida, T.; Kobayashi, S.; Fujisawa, S. Study on illuminance dependency of color identification characteristics for persons with low visual capacity. Assist. Technol. Res. Ser. 2009, 25, 468–472. [Google Scholar] [CrossRef]
  31. Mitani, S.; Yoshida, T.; Kobayashi, S.; Fujisawa, S.; Sueda, O.; Tauchi, M. Study on background illuminance and color conspicuity characteristics for persons with low visual capacity. Assist. Technol. Res. Ser. 2009, 25, 473–477. [Google Scholar]
  32. ISO 23599:12 Assistive products for blind and vision impaired persons – tactile walking surface indicators. Available online: https://ec.europa.eu/eip/ageing/standards/healthcare/personal-autonomy/iso-235992012_en (accessed on 1 November 2019).
  33. Johansson, M.; Rosén, M.; Küller, R. Individual factors influencing the assessment of the outdoor lighting of an urban footpath. Light. Res. Technol. 2011, 43, 31–43. [Google Scholar] [CrossRef]
  34. Balfour, J.L.; A Kaplan, G. Neighborhood environment and loss of physical function in older adults: evidence from the Alameda County study. Am. J. Epidemiology 2002, 155, 507–515. [Google Scholar] [CrossRef] [PubMed] [Green Version]
  35. Chaudhury, H.; Mahmood, A.; Michael, Y.L.; Campo, M.; Hay, K. The influence of neighborhood residential density, physical and social environments on older adults’ physical activity: an exploratory study in two metropolitan areas. J. Aging Stud. 2012, 26, 35–43. [Google Scholar] [CrossRef]
  36. Rea, M.S. IESNA Lighting Handbook: Reference and Application, 9th ed.; Illuminating Engineering Society of North America: New York, NY, USA, 2000. [Google Scholar]
  37. Fors, C.; Carlson, A. Revision for Selection of Road Lighting Class—A Pre-Study; LiU Tryck: Linköping, Sweden, 2015. [Google Scholar]
  38. Rea, M.; Bullough, J.D.; Akashi, Y. Several views of metal halide and high-pressure sodium lighting for outdoor applications. Light. Res. Technol. 2009, 41, 297–320. [Google Scholar] [CrossRef]
  39. Knight, C. Field surveys of the effect of lamp spectrum on the perception of safety and comfort at night. Light. Res. Technol. 2010, 42, 313–329. [Google Scholar] [CrossRef]
  40. Li, F.; Chen, Y.; Liu, Y.; Chen, D. Comparative in situ study of LEDs and HPS in road lighting. LEUKOS 2012, 8, 205–214. [Google Scholar]
  41. Peña-García, A.; Hurtado, A.; Aguilar-Luzón, M. Impact of public lighting on pedestrians’ perception of safety and well-being. Saf. Sci. 2015, 78, 142–148. [Google Scholar] [CrossRef]
  42. Johansson, M.; Pedersen, E.; Maleetipwan-Mattsson, P.; Kuhn, L.; Laike, T. Perceived outdoor lighting quality (POLQ): A lighting assessment tool. J. Environ. Psychol. 2014, 39, 14–21. [Google Scholar] [CrossRef]
  43. Juntunen, E.; Tetri, E.; Tapaninen, O.; Yrjänä, S.; Kondratyev, V.; Sitomaniemi, A.; Heikkinen, V. A smart LED luminaire for energy savings in pedestrian road lighting. Light. Res. Technol. 2015, 47, 103–115. [Google Scholar] [CrossRef]
  44. Kuhn, L.; Johansson, M.; Laike, T.; Govén, T. Residents’ perceptions of following retrofitting of residential area outdoor lighting with LEDs. Light. Res. Technol. 2013, 45, 568–584. [Google Scholar] [CrossRef]
  45. Rahm, J.; Johansson, M. Assessing the pedestrian response to urban outdoor lighting: A full-scale laboratory study. PLoS ONE 2018, 13, e0204638. [Google Scholar] [CrossRef] [Green Version]
  46. Parkin, J.; Smithies, N. Accounting for the needs of blind and visually impaired people in public realm design. J. Urban Des. 2012, 17, 135–149. [Google Scholar] [CrossRef]
  47. Fotios, S. LRT Digest 1 Maintaining brightness while saving energy in residential roads. Light. Res. Technol. 2013, 45, 7–21. [Google Scholar] [CrossRef]
  48. Pedersen, E.; Johansson, M. Dynamic pedestrian lighting: effects on walking speed, legibility and environmental perception. Lighting Res. Technol. 2018, 50, 522–536. [Google Scholar] [CrossRef]
  49. Patching, G.R.; Rahm, J.; Jansson, M.; Johansson, M. A new method of random environmental walking for assessing behavioral preferences for different lighting applications. Front. Psychol. 2017, 8, 499. [Google Scholar] [CrossRef] [PubMed] [Green Version]
  50. Kärrholm, M.; Johansson, M.; Lindelöw, D.; Ferreira, I. Interseriality and different sorts of walking: Suggestions for a relational approach to urban walking. Mobilities 2017, 12, 20–35. [Google Scholar] [CrossRef]
  51. Johansson, M.; Sternudd, C.; Kärrholm, M. Perceived urban design qualities and affective experiences of walking. J. Urban Des. 2016, 21, 256–275. [Google Scholar] [CrossRef]
  52. Küller, R. Environmental assessment from a neuropsychological perspective. In Environment, Cognition and Action: An Integrated Approach; Gärling, T., Evans, G., Eds.; Oxford University Press: Oxford, UK, 1991; pp. 111–147. [Google Scholar]
  53. Marcheschi, E.; Ståhl, A.; Almén, M.; Johansson, M. A theoretical model for urban walking among people with disabilities. Front. Psychol. 2020. (manuscript accepted for publication). [Google Scholar]
  54. Persson, R. Segregation, Education and Space, a Case Study of Malmö. Doctoral Dissertation, Lund University, Lund, Sweden, 19 December 2008. [Google Scholar]
  55. Länmateriet. Available online: https://www.lantmateriet.se/en/maps-and-geographic-information/maps/ (accessed on 12 June 2017).
  56. Traffic and Property Management Department, City of Malmö. Personal communication, 14 August 2017.
  57. Creswell, J.W.; Plano Clark, V.L. Designing and Conducting Mixed Methods Research; Sage Publications: Thousand Oaks, CA, USA, 2007; ISBN 1-4129-2791-9. [Google Scholar]
  58. Iwarsson, S.; Ståhl, A. Accessibility, usability and universal design--positioning and definition of concepts describing person-environment relationships. Disabil. Rehabil. 2003, 25, 57–66. [Google Scholar] [CrossRef]
  59. Boverket. Regulations and general recommendations on the removal of easily eliminated obstacles to and in premises to which the public has access and in public spaces BFS 2011:13 HIN2 (PDF file). 2011. Available online: https://rinfo.boverket.se/HIN/PDF/BFS2011-13-HIN2.pdf (accessed on 15 August 2019).
  60. Küller, R.; Wetterberg, L. Melatonin, cortisol, EEG, ECG and subjective comfort in healthy humans: Impact of two fluorescent lamp types at two light intensities. Light. Res. Technol. 1993, 25, 71–80. [Google Scholar] [CrossRef]
  61. Kuller, R.; Wetterberg, L. The subterranean work environment: impact on well-being and health. Environ. Int. 1996, 22, 33–52. [Google Scholar] [CrossRef]
  62. Adedokun, A.A.; Burgess, W.D. Analysis of paired dichotomous data: A gentle introduction to the McNemar test in SPSS. JMDE 2012, 8, 125–131. [Google Scholar]
  63. Field, A. Discovering Statistics Using IBM SPSS Statistics: And Sex and Drugs and Rock ’n’ Roll, 4th ed.; SAGE: Los Angeles LA, USA, 2013. [Google Scholar]
  64. CIBSE–the Society of Light and Lighting. Lighting for people who are visually impaired. Factfile, 2012, 8 (PDF file). Available online: https://www.cibse.org/getmedia/a69b8cdf-3e8f-4962–925e./Lighting (accessed on 30 December 2018).
  65. Boverket. Legislation - Planning and Building Act (2010:900), Planning Ordinance (2011:388); Boverket: Karlskrona, Sweden; ISBN 9789175634067.
Figure 1. Illustration of test route and sub-routes as well as stops for interviews (modified from the source [55]).
Sustainability 12 01096 g001
Figure 2. Photos illustrating the outdoor lighting for sub-routes A–E before and after the intervention. Photos: M.A.; P.M. (a) Sub-route A before the intervention; (b) sub-route A after the intervention; (c) sub-route B before the intervention; (d) sub-route B after the intervention; (e) sub-route C before the intervention; (f) sub-route C after the intervention; (g) sub-route D before the intervention; (h) sub-route D after the intervention; (i) sub-route E before the intervention; (j) sub-route E after the intervention.
Sustainability 12 01096 g002
Table 1. Lighting units along the test-route before and after the intervention.
Sub-RouteBefore InterventionAfter Intervention
Ehavg. at Ground LevelEhmin. at Ground LevelMain Light SourcePlacementMounting HeightLuminaire OverhangEhavg. at Ground LevelEhmin. at Ground LevelMain Light SourcePlacementMounting HeightLuminaire Overhang
A
A.1
A.2
6.30 lux
4.08 lux
1.20 lux
1.60 lux
HPS lampsThe lamps hung over the main street8.00 m-19.39 lux
23.10 lux
0.00 lux
16.00 lux
3 LED lamps (A.2)Hang over walkway (A.2)8.00 m-
B126.59 lux4.50 lux4 LED lampsThe lamp’s poles were along the right side of the path4.50 m0.00 m35.42 lux10.00 lux4 LED lampsAs before5.00 m0.00 m
C
C.1
C.2
C.3
C.4
22.05 lux
1.73 lux
8.73 lux
0.00 lux
0.00 lux
1.60 lux
8.50 lux
0.00 lux
1 HPS lampsThe lamp’s pole was on the sidewalk (C.3)8.00 m0.00 m27.73 lux
20.67 lux
23.33 lux
9.97 lux
14.00 lux
19.00 lux
20.00 lux
9.40 lux
1 LED lampAs before8.00 m2.50 m
D
D.1
D.2
0.74 lux
2.29 lux
0.00 lux
0.00 lux
2 HPS lamps
7 HPS lamps
The lamp’s poles were along the sidewalk on the other side of the road8.00 m0.00 m6.41 lux
16.94 lux
0.00 lux
3.00 lux
2 LED lamps
7 LED lamps
As before8.00 m2.50 m
E
E.1
E.2
5.07 lux
9.46 lux
0.00 lux
3.80 lux
3 HPS lamp
1 HPS lamp
The lamp’s pole was on the sidewalk8.00 m0.00 m4.63 lux
6.48 lux
0.00 lux
5.00 lux
The lights present before the intervention were left in place.
1 The light sources were not changed during the intervention but were raised to a height of around 5 m.
Table 2. Description of sub-routes and number of observation items.
RouteDescription of the Environment No. of ItemsItems Assessed for OrientationItems Assess for Detection
Sub-route APavement with asphalt surface separated from the bicycle path by a white line; bench to the left; artificial guidance and warning surfaces on both sides of an intersecting bicycle path; controlled crossing with an island (A.1); pedestrian path with gravel surrounded by grass on both sides (A.2)521240
Sub-route BPedestrian path with asphalt surrounded by grass on both sides1358
Sub-route CPedestrian path with an asphalt surface with grass on the left side, separated from a bicycle path by a white line (C.1); left turn, walkway with concrete slabs, bicycle parking to the left (C.2); right turn, pavement with cobblestones followed by asphalt (C.3); right turn, pavement with concrete slabs followed by brick tiles (C.4)291712
Sub-route DPavement with brick tiles; street to the right with parked cars along the whole street; entrances, bicycle parking, and plantings with edge supports along the pavement (D.1); left turn, pavement with brick tiles; street to the right with parked cars; entrances, bicycle parking and plantings with edge supports; driveways to garages under the buildings along the pavement; grocery shop to the left at the end of the pavement (D.2)1074562
Sub-route EPavement with brick tiles; street to the right; plants and grass beside the pavement; driveway to loading area under the building (E.1); right turn; uncontrolled crossing; pavement with concrete slabs at the other side of the street (E.2)251213
Total 22691135
Table 3. Summarized scores for all observation items and for orientation and detection items separately, N = 14.
RouteOrientation + Detection ItemsOrientation ItemsAll Detection Items+2 Detection Items+1 Detection Items0 Detection Items
A35 × 14 = 4904 × 14 = 5631 × 14 = 43417 × 14 = 2385 × 14 = 709 × 14 = 126
B10 × 14 = 1402 × 14 = 288 × 14 = 1122 × 14 = 281 × 14 = 145 × 14 = 70
C29 × 14 = 40617 × 14 = 23812 × 14 = 1683 × 14 = 426 × 14 = 843 × 14 = 42
D107 × 14 = 1,49845 × 14 = 63062 × 14 = 86815 × 14 = 21030 × 14 = 42017 × 14 = 238
E24 × 14 = 33612 × 14 = 16812 × 14 = 16810 × 14 = 1401 × 14 = 141 × 14 = 14
A to D181 × 14 = 2,53468 × 14 = 952113 × 14 = 1,58237 × 14 = 51842 × 14 = 58834 × 14 = 476
Total205 × 14 = 2,87080 × 14 = 1,120125 × 14 = 1,75047 × 14 = 65843 × 14 = 60235 × 14 = 490
Table 4. Summed ‘Yes’ scores and percentages for observation protocol items for sub-routes A–D and statistical differences between scores recorded before and after the intervention.
Observed CategorySummed Scores (%)Test Value
(X2)
DfEstimated Odds Ratio
BeforeAfter
Orientation and detection1,229 (48.5%)1,349 (53.2%)18.63 ***15.58
Orientation407 (42.8%)417 (43.8%)0.34 n.s.118.53
All detection822 (52%)932 (58.9%)21.60 ***14.25
Detection (+2)251 (48.5%)274 (52.9%)2.70 n.s.13.65
Detection (+1)300 (51%)368 (62.6%)22.67 ***14.21
Detection (0)271 (56.9%)290 (60.9%)2.23 n.s.14.95
***p < 0.001 (2-tailed); 1 not statistically significant.
Table 5. Mean and median of Perceived Lighting Quality (POLQ) along sub-routes A–D before and after the intervention, and Wilcoxon signed rank tests comparing pre- and post-intervention results. PSQ: Perceived Strength Quality; PCQ: Perceived Comfort Quality.
BeforeAfterzr
MSDMdnMSDMdn
PSQ2.770.402.703.620.723.642.81 **0.56
Brilliant2.880.632.883.690.674.002.32 *0.45
Light2.840.472.883.800.804.003.02 **0.57
Strong2.780.592.753.790.653.883.07 **0.58
Focused2.710.682.753.310.843.502.45 *0.47
Clear2.570.542.503.690.703.753.20 **0.60
PCQ2.900.642.953.060.662.900.27 n.s.10.06
Warm2.880.742.883.040.713.250.28 n.s.0.06
Natural2.540.682.503.020.933.001.62 n.s.0.31
Soft3.060.713.252.830.692.88−1.81 n.s.−0.37
Shaded3.251.103.253.630.994.001.42 n.s.0.28
Mild2.881.102.882.850.882.75−0.54 n.s.−0.10
Single item
No flicker3.940.954.004.270.634.250.62 n.s.0.12
Evenly distributed2.540.732.633.680.984.003.12 **0.60
Good2.540.632.633.850.884.133.30 **0.63
*p < 0.05; ** p < 0.01 (2-tailed); 1 not statistically significant.
Table 6. Summed ‘Yes’ scores and percentages for observation protocol items for sub-route E and statistical differences between scores recorded before and after the intervention.
Observed CategorySummed Scores (%)Test Value
(X2)
dfEstimated Odds Ratio
BeforeAfter
Orientation and detection145 (43.2%)158 (52.0%)1.73 n.s.119.36
Orientation70 (47.1%)70 (47.1%)0.03 n.s.120.29
All detection75 (44.6%)88 (52.4%)2.72 n.s.15.00
Detection (+2)66 (47.1%)79 (56.4%)3.35 n.s.15.59
Detection (+1)8 (57.1%)6 (42.9%)0.16 n.s.12.00
Detection (0)1 (7.1%)3 (21.4%)0.25 n.s.10
1 not statistically significant.
Table 7. Mean and median of Perceived Lighting Quality (POLQ) along sub-route E before and after the intervention, and Wilcoxon signed rank tests comparing the results.
BeforeAfterzr
MSDMdnMSDMdn
PSQ2.500.972.701.830.761.60−2.56 *−0.48
Brilliant2.361.082.501.861.031.50−1.39 n.s.1−0.26
Light2.711.143.001.860.862.00−2.28 *−0.43
Strong2.210.892.001.710.831.50−1.65 n.s.−0.31
Focused2.791.183.002.141.032.00−2.71 **−0.51
Clear2.431.282.001.570.761.00−2.24 *−0.42
PCQ3.030.573.203.630.673.601.97 *0.39
Warm3.000.883.003.920.794.001.98 *0.40
Natural2.290.832.002.571.222.500.61 n.s.0.12
Soft3.140.663.003.420.794.000.32 n.s.0.06
Shaded3.501.343.004.430.945.001.97 *0.37
Mild3.211.053.053.770.734.001.21 n.s.0.23
Single item
No flicker3.711.204.004.001.134.001.15 n.s.0.23
Evenly distributed2.711.333.002.141.232.00−0.11 n.s.−0.02
Good2.711.073.001.930.922.00−2.21*−0.42
*p < 0.05, ** p < 0.01 (2-tailed); 1 not statistically significant.

