Review

Light Pollution, Circadian Photoreception, and Melatonin in Vertebrates

1
Leibniz-Institute of Freshwater Ecology and Inland Fisheries, 12435 Berlin, Germany
2
Department of Biology, Chemistry and Pharmacy, Institute of Biology, Freie Universität Berlin, 14195 Berlin, Germany
3
The Israeli Center for Interdisciplinary Research in Chronobiology, University of Haifa, 31905 Haifa, Israel
4
Department of Electrical Engineering and Automation, Aalto University, 02150 Espoo, Finland
5
Institute of Biodiversity, Animal Health and Comparative Medicine, University of Glasgow, Glasgow G128QQ, UK
6
Institute for Clinical Epidemiology and Biometry, University of Würzburg, 97080 Würzburg, Germany
7
Remote Sensing, GFZ German Research Centre for Geosciences, 14473 Potsdam, Germany
8
Department of Physical Oceanography, Israel Oceanography and Limnology Research, Tel Shikmona, 31080 Haifa, Israel
9
University Research Office, Leeds Beckett University, Leeds LS1 3HE, UK
10
Clinical and Population Studies Department, Faculty of Medicine and Health, University of Leeds, Leeds LS29JT, UK
11
The Centre for Environment, Fisheries & Aquaculture Science, Lowestoft Laboratory, Lowestoft, Suffolk NR33OHT, UK
12
Department of Animal Physiology and Ethology, Faculty of Natural Sciences, Comenius University, 84215 Bratislava, Slovakia
13
Dutch Butterfly Conservation, 6700 AM Wageningen, The Netherlands
*
Author to whom correspondence should be addressed.
Sustainability 2019, 11(22), 6400; https://doi.org/10.3390/su11226400
Submission received: 30 September 2019 / Revised: 9 November 2019 / Accepted: 10 November 2019 / Published: 14 November 2019

Abstract

:
Artificial light at night (ALAN) is increasing exponentially worldwide, accelerated by the transition to new efficient lighting technologies. However, ALAN and resulting light pollution can cause unintended physiological consequences. In vertebrates, production of melatonin—the “hormone of darkness” and a key player in circadian regulation—can be suppressed by ALAN. In this paper, we provide an overview of research on melatonin and ALAN in vertebrates. We discuss how ALAN disrupts natural photic environments, its effect on melatonin and circadian rhythms, and different photoreceptor systems across vertebrate taxa. We then present the results of a systematic review in which we identified studies on melatonin under typical light-polluted conditions in fishes, amphibians, reptiles, birds, and mammals, including humans. Melatonin is suppressed by extremely low light intensities in many vertebrates, ranging from 0.01–0.03 lx for fishes and rodents to 6 lx for sensitive humans. Even lower, wavelength-dependent intensities are implied by some studies and require rigorous testing in ecological contexts. In many studies, melatonin suppression occurs at the minimum light levels tested, and, in better-studied groups, melatonin suppression is reported to occur at lower light levels. We identify major research gaps and conclude that, for most groups, crucial information is lacking. No studies were identified for amphibians and reptiles and long-term impacts of low-level ALAN exposure are unknown. Given the high sensitivity of vertebrate melatonin production to ALAN and the paucity of available information, it is crucial to research impacts of ALAN further in order to inform effective mitigation strategies for human health and the wellbeing and fitness of vertebrates in natural ecosystems.

1. Introduction

Melatonin is an ancient molecule that appears to be ubiquitous in organisms, and the presence of artificial light at night (ALAN) could be affecting melatonin production across a wide range of organisms [1]. Melatonin was first detected in the pineal gland of mammals and was since found in bacteria, unicellular eukaryotes, macroalgae, fungi, plants, and animals [2,3,4,5]. During evolution, it adopted multiple biological functions: antioxidant protection (which appears to be an ancient role, starting from unicellular organisms), environmental tolerance in fungi and plants, immunomodulation and chemical expression of darkness in vertebrates, and regulation of seasonal reproduction in photoperiodic mammals [5,6]. It is, therefore, considered a “jack of all trades” that acts, among others, as a key component of circadian systems and a main signal for the temporal organization of organs, tissues, and cells in vertebrates. During recent decades, chronobiology developed as an interdisciplinary field of research, advancing our understanding of melatonin involvement as a daily and annual time-keeping hormone in the temporal organization of the vertebrate physiological and behavioral functions, specifically in relation to daily and seasonal environmental changes [7].
Circadian systems exist in almost all living beings, allowing them to anticipate daily changes in the environment and adapt physiological and behavioral processes to exploit changed conditions optimally as soon as change takes place. In order to provide selective advantage, circadian systems need to be entrained, i.e., synchronized with the environment via reliable time cues or “zeitgeber” [8]. As cycles of light and darkness are one of the most predictable cues in the environment, light is the dominant environmental synchronizer in most organisms, including vertebrates. Most organisms evolved to use changes in light conditions at twilight as zeitgeber in the process of photo-entrainment, as systematic changes in irradiance, spectral composition, and direction of light during dawn and dusk provide a reliable indicator of the time of day [9].
Circadian systems detect light and transform it into a timed signal that synchronizes many biochemical, physiological, and behavioral processes with the environment [10]. Such a system is generally composed of (1) a pacemaker, circadian clock, or circadian oscillator that endogenously generates rhythms with a period close to 24 hours, (2) an entrainment pathway that entrains the clock daily by detecting 24-h light/dark cycles via photoreceptors, and (3) an output signal that is rhythmically produced and serves as a signal of environmental time to the rest of the organism. In vertebrates, a major output of circadian clocks is melatonin, which is produced during the dark period of the light/dark cycle and acts as a signal for “darkness” to regulate circadian rhythms and photoperiodic responses [5,11]. In vertebrates, melatonin is produced in the retina and pineal organs, which both play central roles in circadian regulation and seem to be ancient melatonin sources [12]. Retinal melatonin is released and acts locally as a neuromodulator of retinal function, which controls retinomotor movements, modulation of neurotransmitter release, and sensitivity to light [13]. In contrast, pineal melatonin is released in the cerebrospinal fluid and blood, thereby facilitating time-keeping in the rest of the organism. Pineal melatonin not only controls circadian activities, but also regulates seasonal reproduction, sleep rhythms, rhythmicity of locomotor activity, and immune responsiveness [13].
The presence of ALAN introduces light of an intensity and spectral composition that does not correspond to natural nocturnal light and, therefore, profoundly alters the natural light environment [14]. On an evolutionary scale, the resulting light pollution presents a novel stressor, and it is unclear how organisms that evolved in stable cycles of light and darkness are affected by such changes. ALAN is hypothesized to alter biological (circadian) rhythms with a variety of physiological effects, through interference with nocturnal melatonin production. In many animals (including humans), nocturnal melatonin production is sensitive to light [7], even at low levels of light [1], thereby disrupting the circadian rhythm. This disruption can be either in the form of reductions in melatonin levels or in shifts in rhythms [15]. As the melatonin pathway has peak sensitivity in the blue region [16], exposure to ALAN rich in blue wavelength has a higher potential of melatonin suppression. The increasing use of energy-efficient lighting technology rich in short-wavelength light [17], therefore, poses significant ecological concerns for wildlife and health challenges for humans. In addition to intensity and spectral composition, the timing and duration of light exposure also has an effect on suppressing melatonin [18,19]. Sensitivity to ALAN can differ between taxa depending on the thresholds for circadian entrainment, but an overview of the sensitivity of different organisms to disruption of melatonin cycles by ALAN is currently lacking.
This paper aims to summarize the existing literature about effects of ALAN on melatonin production across historical vertebrate classes, i.e., fishes, amphibians, reptiles, birds, and mammals (including humans). Firstly, we discuss how diel changes in photic environments in terrestrial and aquatic habitats are perceived by the photoreceptor systems in vertebrates, and how these changes can be masked by ALAN. Next, we summarize how circadian organization varies across vertebrate classes and how light information acts on the melatonin rhythm in different vertebrates. Lastly, we summarize available knowledge and assess whether differences in melatonin suppression under ALAN exist between different vertebrate classes, and whether these differences connect to evolutionary history of the different groups. In addition, we identify research gaps and give recommendations for future experiments assessing the effects of ALAN on melatonin suppression in vertebrates.

2. Natural Light and Light Pollution

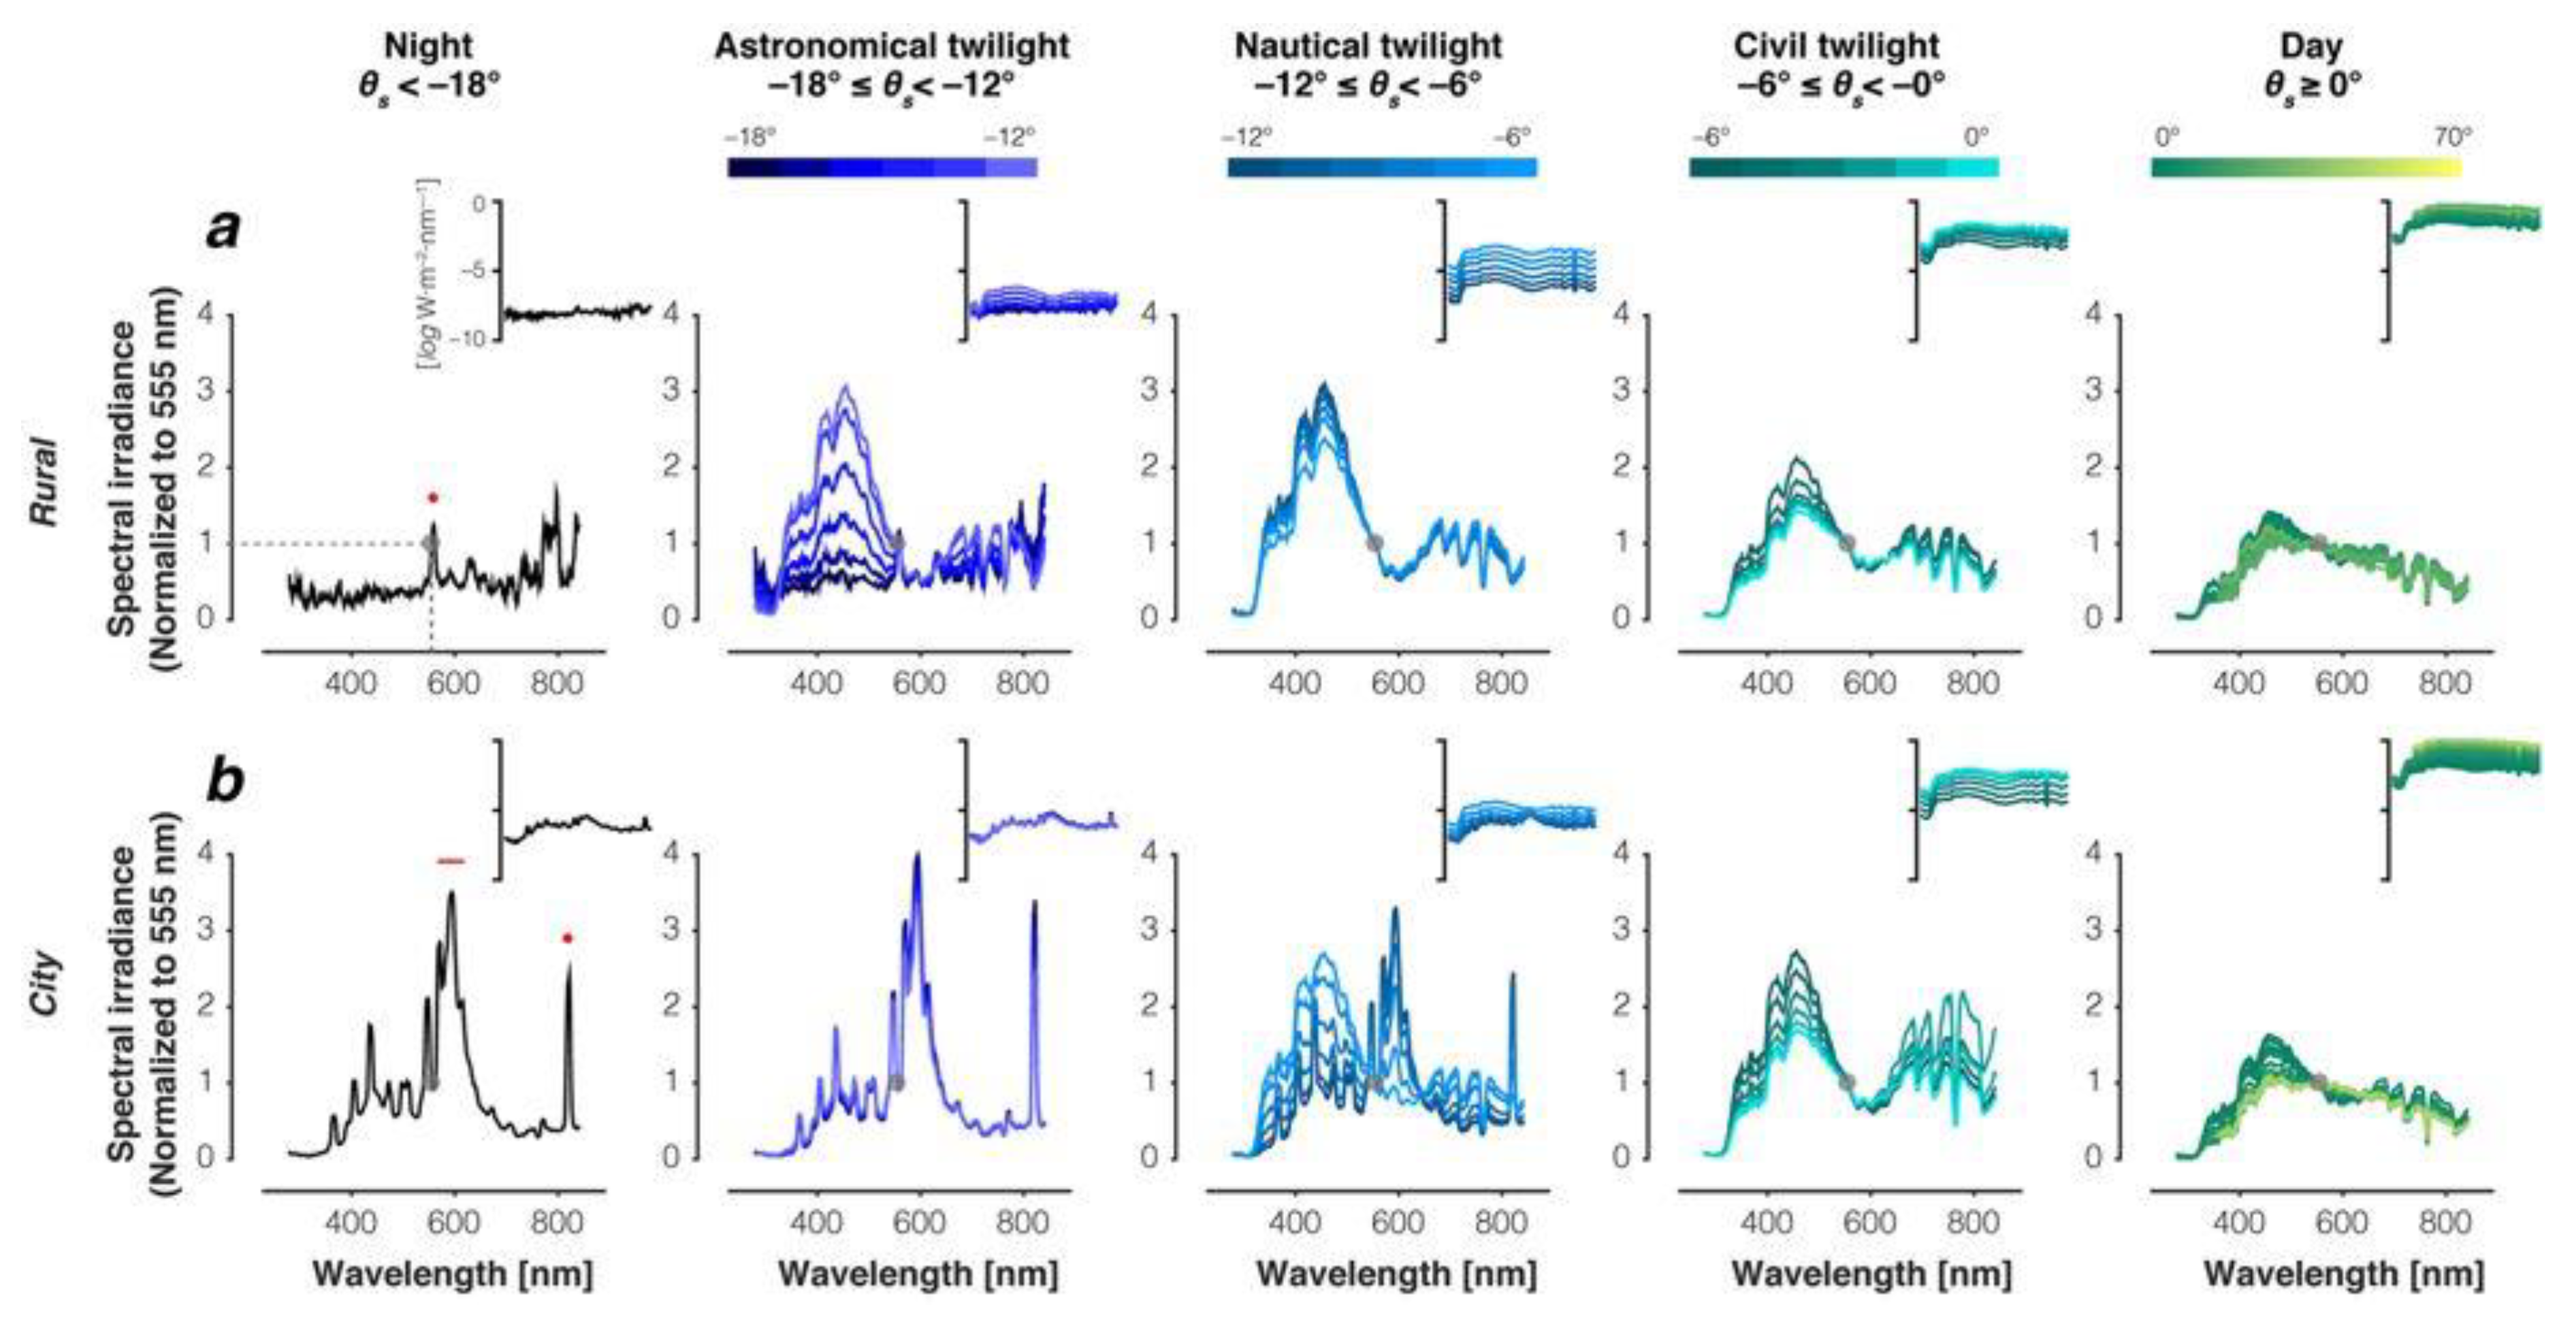
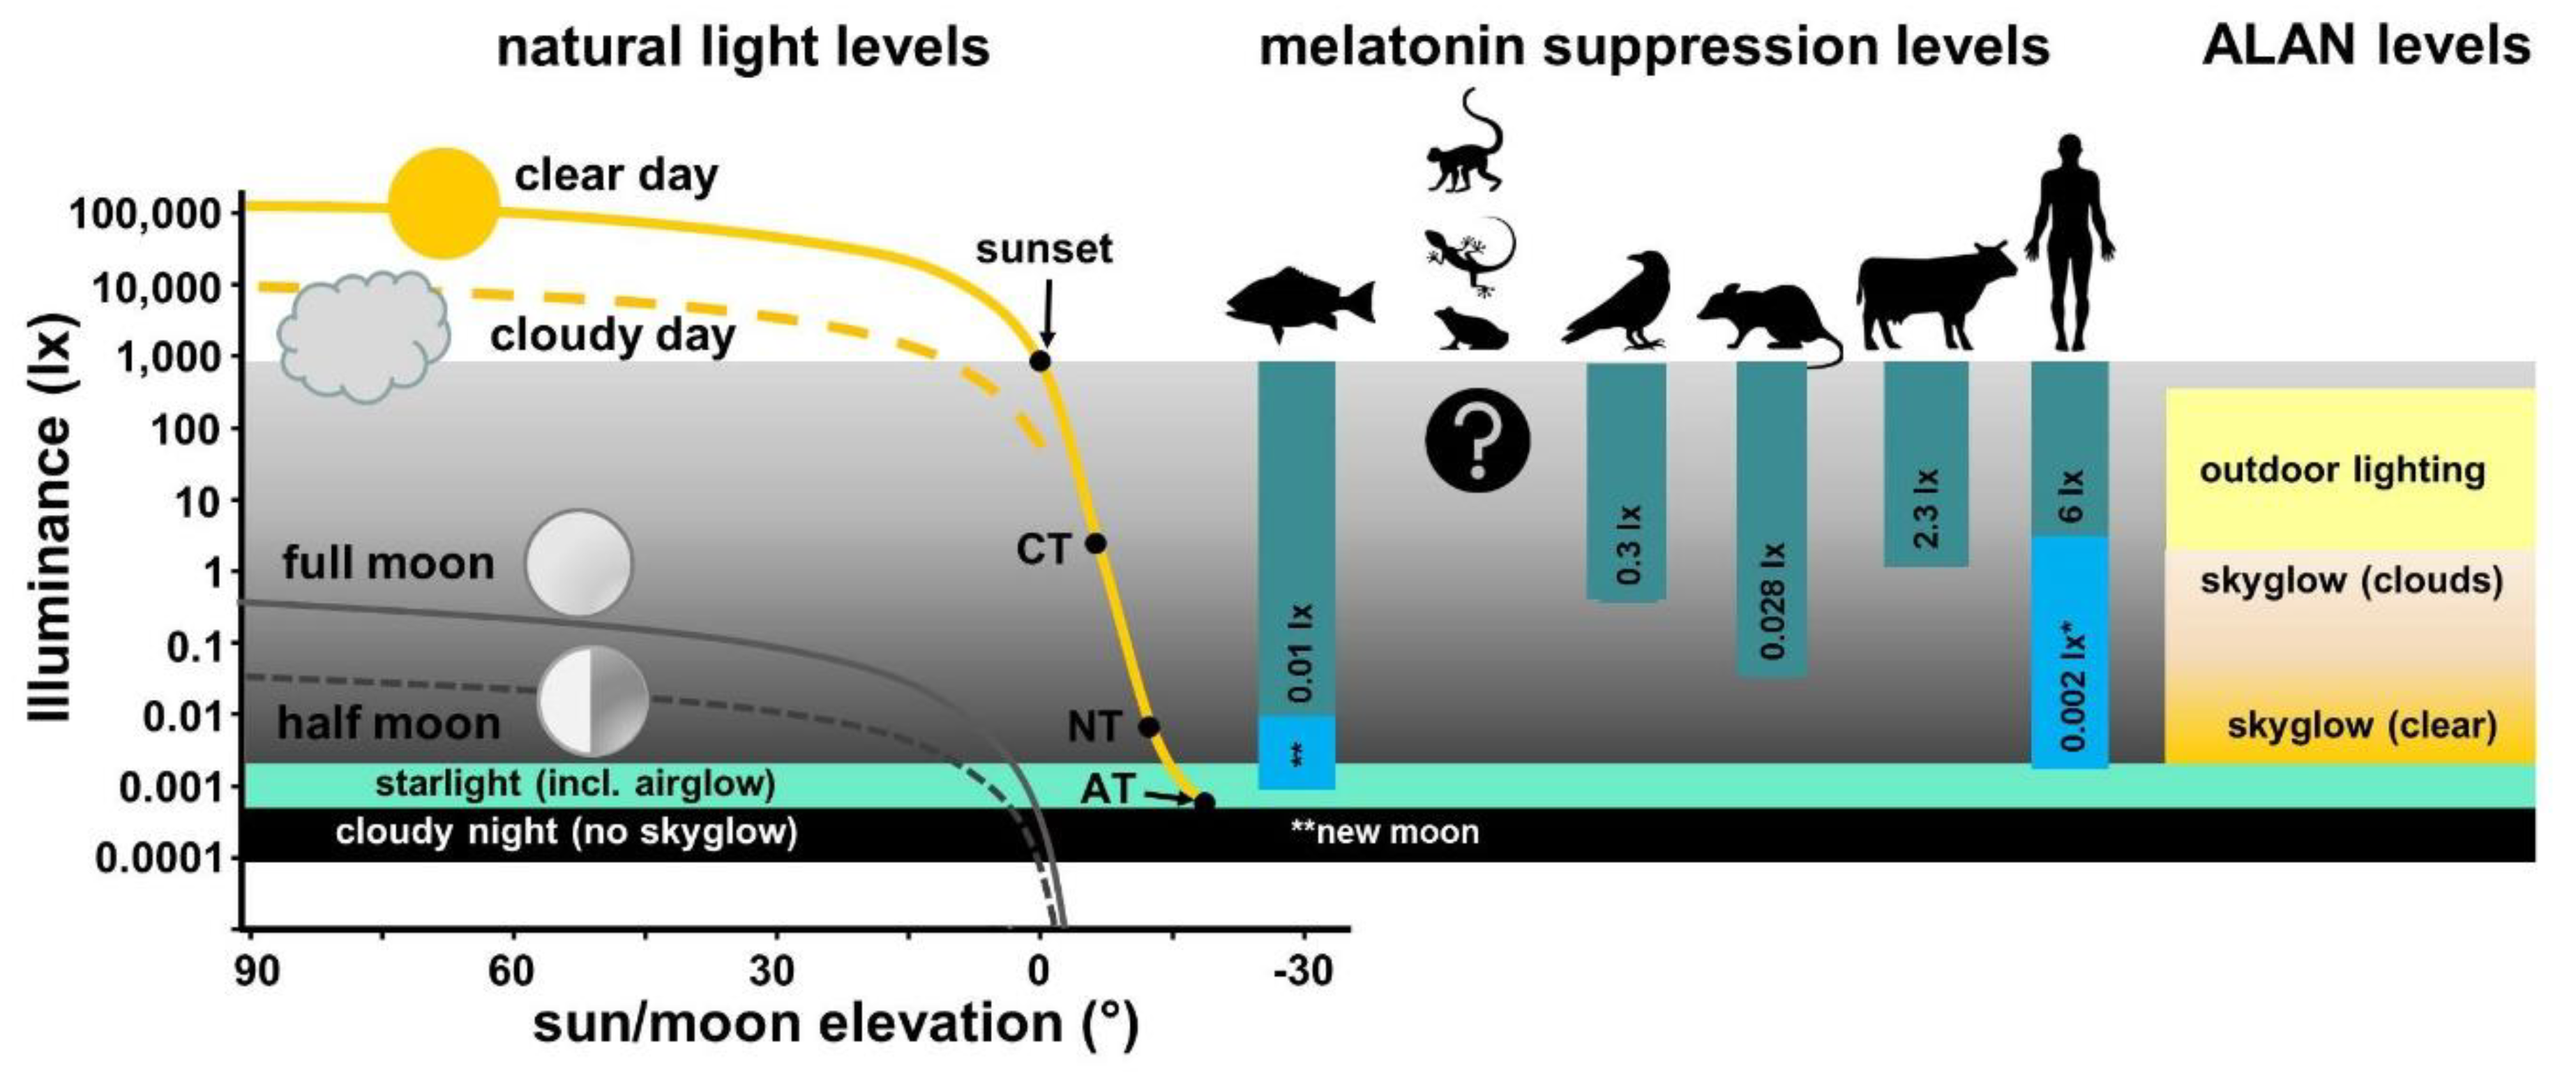
2.1. Illuminance and Spectral Composition of Natural Light

Light in nature mainly originates from extra-terrestrial sources, such as the sun, moon, and stars, or emission from the upper atmosphere like airglow or aurora [20]. The illuminance on Earth’s surface (see Appendix for discussion on photometry and radiometry) from natural light covers a large dynamic range of about nine orders of magnitude. During a clear day, the illuminance reaches a maximum of about 120,000 lx and decreases to about 800 lx at sunset [21].The sunset is the start of civil twilight (when the sun is 0–6° below the horizon), which has a minimum of 3.4 lx. Nautical twilight (sun 6–12° below horizon) has a minimum of 0.008 lx just before the start of astronomical twilight (sun 12–18° below horizon). At night, the maximum illuminance reaches about 0.3 lx on a full-moon night [22], which decreases to about 0.001 lx on a moonless clear night [23] and even further for cloudy conditions [24].
In addition to these changes in net illuminance, the spectrum of the light incident at the Earth’s surface varies dramatically and depends on several factors such as sun or moon elevation angle, atmospheric properties (aerosols, humidity, ice crystals), cloud cover, etc., during both day and night. The changes in spectral composition throughout day and night were recently measured at two sites [25], one without and one with ALAN (Figure 1), thus depicting the spectral irradiance (see Appendix) for different solar elevation angles at a rural site (Figure 1a) and in a city (Figure 1b). During twilight, a strong blue peak arose just after sunset and remained pronounced for the non-light-polluted rural site throughout civil and nautical twilight, subsequently fading during astronomical twilight and vanishing during night. This was partially due to the Chappuis effect [26]; as the sun’s rays pass through a thicker layer of the atmosphere when the sun is lower in the sky, the absorption of green-yellow light by ozone (500–650 nm) results in a relative enrichment of shorter-wavelength light (around 480 nm) at twilight. Importantly, in the data obtained in the city, the blue peak was only apparent during civil twilight. It vanished during nautical twilight, and a secondary peak from ALAN arose (in this case, probably caused by sodium vapor lamps with emission at a wavelength around 580 nm).
In aquatic systems, water is an additional “optical filter” that alters the wavelength (color), direction, and polarization of the incident light [26]. While terrestrial organisms are exposed to sunlight with a maximum in the blue/green part of the spectrum, marine organisms are exposed to blue-shifted light, especially in deep water. In ocean waters, blue and green wavelengths penetrate deeper. Downwelling light in deep ocean waters is essentially monochromatic, composed of wavelengths around 480 nm, which are detectable down to about 1000 m in clear water. In coastal waters and in freshwater systems, the spectral composition is further altered by additional optically active constituents that absorb or scatter light. For example, colored dissolved organic matter mainly absorbs short-wavelength light, which leads to a domination of longer wavelengths in coastal waters and in freshwater systems; this results in brown, yellow, or even reddish water color [27]. In the case of high phytoplankton concentration, water color is dominated by green wavelengths [26] (see Appendix for more information).

2.2. Light Pollution

Humans extended their activity and productivity into the night thanks to ALAN; however, ALAN results in light pollution—unnaturally high nocturnal light levels and a disruption of natural light/dark cycles (see Figure 1). First recognized by astronomers [27], ALAN has significant ecological implications for flora, fauna [28], and human health [29], and the ecological consequences [30] encompass a wide range of species, communities, and ecosystem effects in both terrestrial and aquatic habitats and, thus, light pollution is recognized as a potential threat to biodiversity [31]. Recent studies discovered that effects of ALAN are even recognizable during the day, for example, in microorganisms [32], pollinators [33], and fish behavior [34]. ALAN is increasing exponentially worldwide, in terms of lit area and brightness, at rates >2% per annum on average [17,35], with peaks at rates >40% in the developing world.
Light pollution is commonly categorized into direct and indirect. Direct light pollution originates from light emission that is directly incident on a land or water surface. In urban areas, such direct ALAN can reach light levels up to 150 lx [36], which is 1000-fold brighter than a clear full-moon night [23] and of markedly different spectral signature than natural light. Indirect light pollution originates from light that is scattered within the atmosphere and occurs as skyglow [37], which is visible over large distances; therefore, 80% of the world population and >99% of populations in the United States of America (USA) and Europe live under light-polluted skies [38]. Skyglow changes with atmospheric and weather conditions [39], potentially resulting in night-sky brightness (luminance) levels hundreds of times brighter than natural, and surface illuminance levels brighter than a full moon [24]. Skyglow can also mask the blue peak present during twilight (Figure 1), which plays an important role in the circadian entrainment. The spectral composition of skyglow depends on the type of lamps dominating ALAN (see Appendix) [25]. For artificial light sources, correlated color temperature (CCT) is a measure of spectral distribution of light, with higher CCTs usually meaning a higher content of short-wavelength light. CCT may have a considerable influence on the melatonin suppression, which is particularly sensitive to short wavelengths.

3. Photoreception and Circadian Systems in Vertebrates

3.1. Diversity of Photoreceptive Organs and Different Photoentrainment Pathways

The relevant photoreceptors for the vertebrate circadian system include retinal and extraretinal photoreceptors (pineal, deep brain, iris, dermal, and tissue) (Table 1). In mammals, multiple photoreceptors are concentrated in the retina, whereas non-mammalian vertebrates additionally possess a range of anatomically diverse extraretinal photoreceptors that mediate various physiological and behavioral processes, including circadian and seasonal rhythms [40]. Extraretinal photoreceptors likely represent the most basal form of light reception. Different photoreceptor classes, such as pineal (found in almost all vertebrates) and deep-brain photoreceptors (found in all non-mammal vertebrates) may have specialized roles in circadian entrainment and photoperiodic responses [41,42], whereas dermal photoreceptors of fishes and amphibians mediate color changes and locomotor activity [43]. The parapineal organ of ectotherms is specialized for perception of ultraviolet (UV) and/or polarized light; this organ is intracranial in fishes and extracranial, termed “frontal organ” in frogs (Anura) and “parietal eyes” in some lizards (Squamata) or “third eye” in tuatara (Sphenodon punctatus, Rhynchocephalia) [42]. The retina of the lateral eyes is the most familiar photoreceptive site in vertebrates, and its general organization is conserved across vertebrate classes. In addition to image-forming rods and cones, a subset of intrinsically photosensitive retinal ganglion cells (ipRGCs), which contain melanopsin, mediates a range of non-image-forming functions, including photoentrainment [18]. Rods, cones, and ipRGCs all seem to participate in circadian photoreception. In addition, the retina in bony fishes (teleosts) contains photosensitive horizontal cells that may signal environmental irradiance and modify outputs from rods and cones [43].
The structure of the pineal organ and photoentrainment pathways dramatically changed from early vertebrates/ectotherms to mammals [10,44]. Structural changes in the pineal organ are notable at the anatomical, cytological, and molecular levels and result in a replacement of direct photosensitivity in non-mammal vertebrates with an indirect one in mammals [44]. Despite these dramatic changes, the vertebrate pineal is characterized by the presence of daily rhythms in enzyme activities and biochemical concentrations, including melatonin. The nocturnal pattern of melatonin production is maintained in all investigated vertebrates.
Ectotherms possess multi-oscillator circadian systems with direct photoperiodic control, i.e., photoreceptor cells located in the retina, pineal, and possibly those in brain contain all components of the circadian systems and are interconnected and synchronized by melatonin. In mammals, however, the components of the circadian system are physically separated and located in specialized tissues; photoreceptive units are in the eyes, the pacemaker is in the suprachiasmatic nucleus (SCN) of the hypothalamus, and the melatonin-producing units are in the pineal. Intermediate situations are found in sauropsids [10]. In mammals, the entrainment pathway involves ipRGCs that form the retinohypothalamic tract (RHT), which conveys light information to SCN and the pineal organ.
The pineal organ of ectotherms functions directly as an illuminance detector. It is located below the skull, near the surface of the brain, in the area where bone is thinner and surrounding tissues are less pigmented, thereby facilitating light entry [10]. In fishes (bony fishes and cyclostome species), ~10% of the incident light reaches the pineal. In amphibians, reptiles, and birds, such a structure is either less pronounced or absent; however, a considerable amount of light is still able to penetrate the overlying tissues, amounting to 0.1–0.3% of the incident light [45]. Far more incident light reaches extracranial parapineal organs, e.g., 50% in amphibians and 20% in reptiles. Even in birds and mammals, measurable quantities of incident light penetrate the skull into the hypothalamus [46,47]; for example, the light intensity of a full moon is sufficient to stimulate the deep-brain photoreceptor in the house sparrow (Passer domesticus) [48]. In mammals, the pineal retains only a secretory function serving as a primary source of melatonin [10], and it detects changes in light/dark cycles indirectly, through nocturnal secretion of melatonin. Rhythmic synthesis of melatonin, in both the pineal organ and the retina, relies mainly on rhythmic activity of the enzyme arylalkylamine N-acetyltransferase (AANAT), which is responsive to light [49]. In all vertebrates, AANAT responds to the photoperiodic information; in ectotherms, it also responds to temperature changes. In this regard, bony fishes are special because they possess several AANAT genes, which display tissue-specific expression [50].

3.2. Evolutionary Aspects of Diverse Photoreceptive Organs

Circadian photoentrainment involves a variety of photoreceptive pigments, i.e., opsins, such as cone opsins, rod opsins, and melanopsins, characterized by a wide range of absorption spectra [42]. Many photoreceptors involved in non-image-forming tasks appear to peak close to 480 nm, with a spread ranging from 460 to 530 nm. Melanopsin seems to be a common feature of all vertebrates (Table 1) that mediates non-visual retinal photoreception, which is dominated by blue light both in aquatic and terrestrial vertebrates [51]. Photoreceptive pigments generally evolved to mediate specific photoreceptive tasks in different photic environments [26]. Therefore, this blue-shifted photosensitivity is postulated to be a conserved adapted feature of all vertebrates, which evolved as an adaptation to the blue-rich photic environment in oceans and later facilitated the move of vertebrates into a terrestrial environment, where blue wavelengths are dominant during twilight [51]. “Twilight detectors”, which are spectrally tuned to the blue part of the spectrum, could allow increased photon capture and, hence, an increase in signal-to-noise detection also in terrestrial environments.
Animals use changes in irradiance during twilight as a zeitgeber, but it was recently shown that chromatic discrimination provides more reliable information for tracking time at twilight, and that irradiance and chromatic discrimination interact to inform circadian clocks [52]. The pineal and parapineal organs of fishes, amphibians, and reptiles are capable of a chromatic response, discriminating blue–yellow color, presumably able to influence melatonin production directly based on chromatic signals. The majority of mammalian species retained the short- and mid-/long-wavelength sensitivity needed for blue–yellow discrimination in cone opsins, in order to detect changes in spectral composition associated with twilight. In pineal and deep-brain photoreceptors, the light that reaches the receptors is affected by the transmission of the overlying tissues, primarily by processes of scattering and absorption, which shift the light spectrum toward the longer wavelengths. Short wavelengths (400–450 nm) are scattered more than long wavelengths, resulting in the light of long wavelengths (700–750 nm) penetrating ~1000-fold more effectively to reach intracranial photoreceptors [47]. Furthermore, light is modified by light-absorbing pigments, the most important being hemoglobin (transmission between 460 and 540 nm, peak around 490 nm) and melanin (430 nm), both of which absorb short wavelengths to a greater degree than long wavelengths.
It is postulated that vertebrates evolved such a great variety in photoreceptive tissues in order to provide a more precise estimate of environmental time by integrating signals from (largely diurnal) photic environments over multiple photoreceptors, where each is tuned to different wavelengths and operates over different integration times and environmental regions [41,43]. Circadian photoreceptors are relatively insensitive to light, requiring high-intensity and long-duration stimuli for photoentrainment in contrast to highly sensitive visual receptors that are able to adapt and integrate short signals rapidly (see Reference [41] and references therein). Systematic changes in light intensity, spectral composition, and direction during twilight could all provide input to circadian systems, but they are also subject to large sensory noise (depending on the organism and its environment). This signal-to-noise ratio may be improved by the multiplicity of receptors in the non-mammalian vertebrates, which potentially integrate light information from the retinal, pineal, and deep-brain photoreception; this is known to be the case in birds [40,41]. In mammals, which possess only one photoreceptive tissue, the detection of twilight is either less precise or the ipRGCs themselves show heterogeneity in their responses to light, which is also supported by evidence. The loss of extraretinal photoreceptors in mammals may be explained by the “nocturnal bottleneck hypothesis”, which postulates that the nocturnal lifestyle of early mammals, from which modern mammals developed 100 million years ago, acted as a selective pressure to keep only the most sensitive photoreceptors in the most exposed locations, i.e., those able to receive enough light to induce a response in dim photic environments of nocturnal animals [40]. Loss of photoreceptors in different anatomical locations, which would detect different intensities of incident light, avoids maladaptive reception of conflicting messages and generation of inappropriate phase relationships.

4. Effects of Artificial Light at Night on Melatonin Production in Different Vertebrate Classes: A Systematic Review of the Literature

4.1. Search and Eligibility Criteria

A systematic literature search was performed for each vertebrate class separately (Table 2). In the class of mammals, three separate searches were performed to maximize the chances of identifying relevant studies: one for rodents and ungulates (common model animals in chronobiological research), one for primates, and one for humans. We searched the literature indexed in Scopus and Web of Science using the following keywords: light AND melatonin AND (level* OR concentration*) AND class name*, adapted for each vertebrate class as follows: fish*, amphibian*, reptile*, and bird*. For mammals, instead of the class name, the first search included terms rodent* OR ungulate*, the second included the term primate*, and the third included the term human*. The terms were searched in titles, abstracts, and keywords of the papers. The searches were refined to include peer-reviewed research articles and articles in press, short surveys, book chapters, books, and letters available in English. Reviews, conference papers, editorials, and notes were not considered. All literature searches were performed between June and August 2019.
Our aim was to identify studies that investigated typical light pollution scenarios, which was defined as a light regime of alternating daylight illumination (higher than 250 lx) with nocturnal illumination (not higher than 250 lx). Studies that applied continuous 24-h illumination at one intensity were excluded. Only studies that presented original data were selected. We considered only studies that were conducted on living organisms; hence, in vitro experiments with isolated cells and tissues were not considered. Studies that lacked a control group or those that investigated different responses to ALAN than melatonin suppression (e.g., behavior) were also excluded from the review. For fishes, we considered studies reporting on effects of light at night on both ocular and blood melatonin. We followed PRISMA guidelines [53] in evaluating the search results. All studies were screened by title and abstract to assess whether they satisfied the eligibility criteria, in which case full texts were examined. The number of studies included in the review based on the eligibility criteria is presented in Table 2. We present the results separately for fishes, amphibians, and reptiles, whereas non-human mammals (rodents, ungulates, and primates) are grouped and presented separately from humans.
Most studies included in the review provided light intensities in photometric units (illuminance in lx), some in the photosynthetically active radiation (PAR) band (400–700 nm, in photon flux per unit area), and some in radiometric units (irradiance in µW/cm2 or µW/cm2·nm). Whenever possible, the radiometric or PAR values were converted, at least approximately, to photometric units (lx). However, such a conversion is not always precise and has to be treated with caution (see Appendix for details). There was some inconsistency when both radiometric and photopic units were reported, in which cases we refer to the originally published photopic values e.g. [54]. Some studies provided information on the spectrum (CCT or maximum wavelength λmax) and/or the type of lamp that was used. Some studies did not specify light levels used, and many did not give reference to the light spectrum. Some studies used moonlight as a control or as a treatment without measuring illuminance; in these cases, we relied on illuminance values reported in the literature: full moon—0.3 lx; half-moon (first- and last-quarter moon)—0.03 lx; new moon—0.001 lx [55]. We note that full-moon light was reported as 10 to 12 lx in some studies [56,57,58], which is not possible at sites without light pollution [22].

4.2. Result Summary

4.2.1. Fishes

(a) Taxonomy of Fish Species
The 15 relevant studies that were identified in the literature search (Table 3) were performed on a total of 11 fish species. All species are bony fishes (teleosts) and are distributed across eight taxonomic families (Table 3). The habitats of those species range from freshwater (e.g., Cyprinidae) to marine waters (e.g., Moronidae, Labridae), as well as from temperate cold waters (e.g., Salmonidae) to tropical warm waters (e.g., Siganidae, Pomacentridae, Cichlidae), including species that tolerate a wider range of temperature and occur from subtropical to temperate regions, such as the cyprinids tench (Tinca tinca) and roach (Rutilus rutilus), or the Eurasian perch (Perca fluviatilis, Percidae).
(b) Effects of Nocturnal Light on Plasma Melatonin in Fishes
Most of the selected studies dealt with the effects of broad-spectrum white light and how it affects nocturnal production of plasma melatonin at different intensities (Table 3A). Plasma melatonin was reduced under different intensities of white light in eight studies, five dealing with permanent illumination of the scotophase [56,57,59,60,61] and three dealing with the effects of acute light pulses of 1–2 h before or at midnight [54,55,62]. Only one of the nine studies on plasma melatonin under white nocturnal illumination showed no change in plasma melatonin levels under ALAN (in Eurasian perch), and even an increase of melatonin levels at 15-lx ALAN exposure for one month in roach; however, this increase was not statistically significant [63].
For most fish species, white light of 1 lx was enough to reduce plasma melatonin to <70 % of the dark control levels [54,55,56,57,59,60], except for Atlantic salmon (Salmo salar) [61] and European sea bass (Dicentrarchus labrax) [62], where production was <90 % of the control level around 1 lx with no statistically significant difference (Table 3A). Atlantic salmon displayed the overall weakest melatonin suppression under exposure to ALAN [61]. The strongest responses to light at night were measured in tropical species. In these species, full-moon light (estimated as 0.3 lx) was enough to reduce mean plasma melatonin to <45% of the dark control levels. Another damselfish, the gold-lined spinefoot (Signaus guttatus), had plasma melatonin concentrations at full moon of 60% of concentrations at new moon [60]. Tench had melatonin levels of ca. 43–45% of the dark control at different levels of illuminance [54]. Likewise, melatonin was dose-dependently reduced in European sea bass and Arctic charr (Salvelinus alpinus) [59,62] (Table 3A). Water-based measurements of secreted melatonin also showed strong reductions of nocturnal melatonin at all measured illuminances. In these studies, rhythmicity of melatonin production was detectable at 1-lx nocturnal illumination but completely depleted at 10 lx and 100 lx in Eurasian perch and roach [64,65]. Another recent study, which did not show up in the literature search since it is still under review, showed that, below 1 lx, nocturnal melatonin production was significantly reduced at 0.01 lx and 0.1 lx, but rhythmicity was maintained in Eurasian perch [66] (Table 3A).
Three of the selected studies examined the effects of colored illumination during the scotophase on plasma melatonin (Table 3B). In roach, illumination of all applied colors (blue, green, red) reduced melatonin, measured from tank water, to a similar extent [65]. In Eurasian perch, green and red light-emitting diodes (LEDs) similarly reduced melatonin in the tank water, whereas blue LEDs reduced melatonin to a lesser extent than red or green light at the same photon flux [67]. In European sea bass, low intensities of 2.4 µW/cm2 suppressed plasma melatonin for green light (544 nm, ca. 11 lx) and blue light (454 nm, ca. 2 lx), whereas red light (640 nm, ca. 3 lx) was least suppressive and did not differ from the control. At higher intensities of 6 µW/cm2, however, red light (ca. 7 lx) and blue light (ca. 5 lx) were most suppressive, and green light (ca. 28 lx) was least suppressive, but all colored treatments had significantly lower plasma melatonin than the dark control [62] (Table 3B).
(c) Effects of Nocturnal Light on Ocular Melatonin in Fishes
Four of the selected studies assessed changes in ocular melatonin levels at nocturnal illumination by white light (Table 3C), and only one study investigated the effects of different light colors [62] (Table 3D). The expression of sgAanat1 was reduced under full-moon illumination compared to new moon in the gold-lined spinefoot [68]. Likewise, in another siganid, the seagrass rabbitfish, and in the wrasse (Halichaoeres tenuispinnis, Labridae), ocular melatonin was reduced at different intensities of white light [58,69]. In the wrasse, reduction of mean ocular melatonin was not statistically significant at 0.13 lx, but it was at all intensities >1.3 lx [69]. In European sea bass, however, mean ocular melatonin increased with increasing intensity of white light during the scotophase [62]. This increase was statistically significant at 6 lx and at 14 lx, but not at 1.4 lx or 140 lx [62]. For colored light, in European sea bass, blue light at high intensities increased ocular melatonin the most, compared to red and green light. At lower intensities, red, green, and blue light resulted in a similar increase of ocular melatonin levels compared to the dark controls [62] (Table 3D).
(d) Melatonin Rhythmicity in Fishes
Several studies determined the peak of a circadian melatonin profile in order to determine the timing of exposure to light pulses [55,68,69]. Studies on lunar effects used culmination time of the moon as a sampling time [68], whereas other studies sampled at a fixed point in time, e.g., midnight [60], 2:00 a.m. [56], or throughout the entire night, neglecting culmination of the moon or peak of nocturnal melatonin production [63]. Multiple samplings throughout the night can reveal not only changes in amplitude, but also changes of other rhythmic parameters. For example, cosinor analyses of melatonin profiles of the Eurasian perch showed that the period was shortened and acrophase was earlier in the night at illumination of 1 lx [66]. The shift was also visible in the modeled curves for 10-lx and 100-lx white light and 0.15-lx blue light in Eurasian perch [64,67]. In Atlantic salmon, melatonin peaked at the same time in the night in all analyzed treatments, but the peak was delayed by 4 h at high intensities of 400 lx [61]. In Arctic charr, the peak of plasma melatonin in the night seemed to be delayed by 4 h at low nocturnal illuminance of 0.1–0.3 lx, but not at 50–60 lx [59]. If melatonin suppression by nocturnal light treatment is very strong, it is not possible to determine a period or shift in acrophase [57,58,65]. For comparability, in Table 3, the melatonin suppression was analyzed at the time where melatonin peaked in the control, but a shift of the melatonin peak under ALAN could lead to over- or underestimation of melatonin suppression.

4.2.2. Amphibians

None of the studies from the literature searches for amphibians fulfilled the eligibility criteria. Few reviews on ALAN effects on amphibians are available [70,71,72], and several recent studies investigated the effects of ALAN on amphibians. ALAN decreased metamorphic duration and juvenile growth in American toads (Anaxyrus americanus) [73], and reduced activity and altered energy allocation in common toads (Bufo bufo) [74]. Furthermore, a shift and shortening of the calling season of male Brazilian anurans was measured in a light-polluted wetland as compared to a similar site without light pollution [75]. Mate choice behavior was found to be unaltered under light pollution in Eastern gray treefrog (Hyla versicolor) females [76]. Melatonin was, however, not subject to these studies.
The results from studies of continuous illumination and prolonged photoperiod (18-h light/6-h dark) indicate that ALAN can potentially reduce nocturnal melatonin production of amphibians. In tadpoles of the American bullfrog (Rana catesbeiana), constant light reduced plasma and ocular melatonin but rhythmicity was maintained, although shifts of the acrophase were noted [77,78]. Moreover, tadpoles of American bullfrog also had a lowered melatonin amplitude in the scotophase under an 18-h light/6-h dark cycle compared to a 12-h light/12-h dark photoperiod [79]. However, with increased scotophase under a 6-h light/18-h dark cycle, the melatonin concentrations did not further increase, but only the peak of melatonin production was shifted toward the beginning of scotophase.
In frogs, melatonin facilitates multiple processes, from color change and lowering body temperature to gonadal development and reproduction. Therefore, potential melatonin suppression by ALAN may have various physiological consequences [70], although our search indicates that this is yet to be assessed under a typical light pollution scenario. Natural light/dark cycles drive a rhythmic change in skin coloration in tadpoles of African clawed frog (Xenopus laevis), which stops with their disruption, likely due to melanopsin-mediated interference with melatonin production [80,81]. Even one minute of light exposure during scotophase was shown to suppress production of melatonin precursors, although it is unknown which light intensities are needed for this effect [82]. Altered light regime may affect amphibians already in embryonic and larval development; for example, X. laevis embryos develop a functional, photosensitive circadian clock in the eyes and pineal after just four days of development [83].
Many anurans have complex life cycles and undergo metamorphosis that involves profound changes in morphology, a transition from aquatic (often turbid) to terrestrial environments, and a change in activity patterns from diurnal to nocturnal. These changes are accompanied by alterations of the eye that likely change its spectral sensitivity as the adaptation to altered photic environments. In developing anurans, the frontal organ is most sensitive to light of around 520 nm (green light) [84], probably as an adaptive feature that allows maximum sensitivity to the underwater photic environment [85]. Experiments on in vitro cultured eyecups of X. laevis showed a high sensitivity toward light at different (monochromatic) colors, with the highest sensitivity in the shorter (blue and green) wavelengths and less sensitivity toward red wavelengths [86]. It is unknown whether sensitivity to ALAN differs between pre- and post-metamorphosis anurans.

4.2.3. Reptiles

No studies were identified in the literature search for reptiles that fulfilled the eligibility criteria. Despite the increase of research on the impact or light pollution on ecosystems and the research on reptiles in this perspective [70], there are very few studies on the impact of ALAN on melatonin levels. Those available focus primarily on different day lengths or illuminated periods during the night. Studies that were representative for light-polluted conditions (high light levels during the day and low light levels during the night) were not found.
The literature on melatonin rhythms and their zeitgebers does, however, provide insight into the potential sensitivity for the different groups of reptiles. All four reptile orders (Squamata, Testudines, Sphenodontia, and Crocodilia) were shown to have a circadian rhythm of melatonin [87], and this is, at least partly, regulated by exposure to light, while ambient temperature can be an important zeitgeber as well. In the American alligator (Alligator mississippiensis), melatonin levels seem to be rather constant, without a circadian cycle, and not related to a circadian rhythm [88]. An overview of the literature on the clock system in lizards is given in Reference [89].
For some reptile species, the effect of light exposure on melatonin levels was tested. Changing the photoperiod can affect the melatonin production in both timing of the peak and amplitude of the fluctuation, but this varies between species and environmental conditions. The best-studied species in this perspective is the sub-tropical green anole (Anolis carolinensis), for which short photoperiods were found to reduce the height and width of the melatonin peak during the scotophase [90]. Exposure to light (300 lx) for 1 h late in the scotophase shifted the melatonin peak earlier and vice versa [91]. This does show that melatonin cycles in this species are at least partly regulated by light exposure. In reptiles, however, as temperature is also an important zeitgeber, the melatonin cycle can be maintained when lighting is continuous, but temperature shows daily fluctuations. This is true both in dim light (1 lx) [90] and in continuous light (80 lx) or in dark conditions [92]. Temperature seems to be dominant when light (80 lx for scotophase) and temperature (20–32 °C) contradict each other; for example, when lizards are exposed to a warm scotophase and cold photophase, the melatonin cycle peaks during the photophase. Interestingly, when light and temperature show contrasting patterns, the peak in melatonin is not reduced compared to synchronized patterns in the sub-tropical green anole [90]. However, the light level during photophase was very low in these experiments (80 lx) and, therefore, it is unclear whether this result is representative for natural conditions where light levels in the photophase are ~1000-fold higher. In Tiliqua rugosa (Scincidae), light and temperature interact in the sense that, when the scotophase and cryophase are simultaneous, the amplitude of the melatonin rhythm in blood plasma is larger than when they are not. When the cryophase is in the middle of the photophase, melatonin becomes arrhythmic [93]. However, this was tested with a light level of 2800 lx, which might explain the contrasting results.
In most organisms, exposure to light during the scotophase quickly depresses melatonin levels, while this does not seem to be the case in sub-tropical green anole. Exposure to 300 lx during scotophase did result in shifts in the melatonin cycle, but not in a decrease in melatonin levels [91]. Exposure to light levels of 27,250 lx (i.e., direct sunlight), for 1 h in the middle of the scotophase did not result in a decrease in melatonin level in the pineal gland, nor did 2 h of exposure to 7600–12,500 lx (i.e., indirect sunlight) [90]. Anolis species do, however, respond with increases in activity when exposed to light during the scotophase; in particular, the species from shaded habitats seem to increase activity with increasing intensity of the light (from 0.0037–450 µW/cm2, ca. 0.01–1600 lx), making them sensitive to typical ALAN levels [94]. However, the control darkness was not defined and possibly was an unnatural complete darkness that might reduce activity compared to natural conditions.
The box turtle (Terrapene carolina) shows similar patterns to the sub-tropical green anole. Under constant temperature, the circadian rhythm of melatonin is entrained by light, with a longer duration of the melatonin peak under short days in both pineal gland and plasma. Exposure to light (300 lx) for 1 h during the night did not result in decreased levels of melatonin in either plasma or pineal gland [95].

4.2.4. Birds

Out of 10 studies included in the review, only five were explicitly designed to test the hypothesis that ALAN suppresses melatonin in birds (Table 4). These studies used five different Passeriformes species: Eurasian blackbird (Turdus merula) [96], western scrub-jay (Aphelocoma californica) [97], great tit (Parus major) [15], Indian weaver bird (Ploceus philippinus) [98], and Eurasian tree sparrow (Passer montanus) [99]. The other five studies used an experimental dim illumination at night in the context of circadian rhythms research [100,101,102] and/or photoperiodism [103,104]. These additional studies used different avian species, from songbirds and pigeons to penguins. One study used chickens. All 10 of these experiments were conducted in a laboratory; thus, there is a clear need to expand on this research and promote more investigations in the field, at least for ecology-related questions. The effects of ALAN on melatonin might be season-dependent, but only one study tested this hypothesis. In this experiment, constant illumination throughout the night was used, and it was found that the effect is stronger in winter than in summer, likely because of the longer nights in winter [96].
The intensity and exposure of ALAN varied greatly between studies. The experiments that were explicitly designed to test for the effects of ALAN on behavior and physiology of birds used a light intensity that ranged from 0.3 lx [96] to 2 lx [98], 3.2 lx [97], 5 lx [15], and 8 lx [99]. Two studies used a single level of light intensity applied constantly throughout the night [96,97]. One study used different treatment groups where birds were exposed to light at night for the entire night or at specific 4-h time periods in the early, mid, or late night [98]. One study used a dose–response approach by exposing different groups of great tits to different levels of light intensity, from 0.05 to 5 lx, throughout the night [15]. The dose–response approach was also used in two non-ALAN studies [101,102], although with slightly different experimental set-ups. For instance, Reference [102] exposed pigeons to light of increasing intensity at midnight and collected blood samples at different times until 80 min after the initial light exposure. They revealed that, after only 12 min, suppression of melatonin was reduced by 50% of its initial value during the previous scotophase. The studies, intended to test questions related to circadian rhythms and photoperiodism, used an intensity of light that extended up to 100 lx, but also utilized a constant illumination approach. The only two exceptions were the experiments of Reference [102] and of Reference [100], which exposed pigeons to a 30-min light pulse just after midnight.
Similarly, the type of night-time illumination used varied among the studies. Warm white incandescent light was used in Reference [96] on Eurasian blackbirds and in Reference [97] on western scrub-jays. White LED light was used in Reference [15] and covered the entire visible spectrum with peaks at both mid and relatively long wavelengths. Reference [98] used a compact fluorescent lamp with a high concentration of blue light. Some studies used fluorescent cool light [99,101,104] or even natural light in the summer Antarctic [100]. Studies not designed to test for ALAN effects used mostly fluorescent light sources [102,104]. However, in these studies, the light source used in the experiment, as well as how it was used, was not described in detail.
Overall, this work shows four major findings that were generally common between the studies, although with a few exceptions and subjected to interpretation biases depending on the type of experimental set-up and aim of each individual experiment.
Firstly, ALAN suppresses melatonin release at night. When a significant suppression effect was detected, the effect size was large, as light at night reduced melatonin by one-half to one-third of the value in the control groups. This suppression is very fast: only 12 min of exposure to ALAN is able to suppress melatonin levels [102]. In general, melatonin responds to ALAN during the first night of exposure and even short pulses are able to lower melatonin production and release [100]. The only exception to this pattern was a study in which melatonin levels increased under light at night in western scrub-jays [97].
Secondly, the degree of suppression is dependent on the light intensity used in the study. Melatonin levels seem to be affected by light intensity as low as 0.3 lx in the Eurasian blackbird [96], but only above 1 lx in the Indian weaver bird [98,101], suggesting that species-specific thresholds may exist. Dose–response effects were clearly shown by experiments that exposed the same species to different levels of ALAN [99,101]. The shape of the response is, however, mostly unclear, and it is impossible at present to state whether any specific thresholds exist, or whether melatonin is suppressed in a linear or curvilinear manner by ALAN. Future studies should use more light intensity levels to properly identify the shape of the melatonin response to ALAN.
Thirdly, ALAN exposure in the early part of the night seems to phase-delay the melatonin rhythm, while late-night ALAN exposure usually advances it [98,101]. However, constant night illumination usually had different effects. In the blackbirds, for instance, it suppressed melatonin throughout the night but with larger effects right after dusk or right before dawn, compared to midnight [96]. Since part-night lighting could be a highly effective mitigation method, more studies are needed to confirm that illuminating only the first half of the night (the more likely solution that city councils may adopt) can considerably minimize the impact of ALAN on melatonin.
Fourthly, the suppressive effect of blue-rich light sources, such as fluorescent light bulbs, was stronger than that of warm white lamps. However, and quite surprisingly, no proper experiment was designed so far to assess wavelength-dependent effects of ALAN on melatonin in birds. This is a clear research gap.

4.2.5. Non-Human Mammals (Rodents, Ungulates, and Primates)

Although many studies were done on the topic of melatonin in rodents and ungulates, as species belonging to these groups are often used as model animals in chronobiological research, only 11 studies were identified as relevant to this review (Table 2 and Table 5A,B). These records included seven rodent studies and four ungulate studies, which were performed on four rodent species (mice [105], rats [106,107,108], Siberian hamster (Phodopus sungorus) [109,110], and fat sand rat (Psammomys obesus) [111] and four ungulate species (cow [112], goat [113], sheep [114], and horse [115]). These records included nocturnal and diurnal species (the four ungulate and one rodent species, the fat sand rat). Ten of these studies mentioned melatonin suppression by light at night in their aims, two of which assessed melatonin suppression by dim light at night in accordance with cancer development [107,108]. One study used dim nocturnal light in the context of circadian rhythm research [105]. In the search for non-human primates, only two studies were identified that fulfilled the eligibility criteria (Table 2 and Table 5C), and they involved squirrel monkey (Saimiri sciureus) and mouse lemur (Microcebus murinus).
The studies on rodents and ungulates included in the review used a wide range of irradiance levels and spectral compositions, but only four studies provided quantitative information regarding the ALAN spectral composition and irradiance used in the study [106,109,112,115]. The other seven studies specified either the irradiance level or the light type and/or spectral composition. The minimum illuminance levels assessed were 0.003 lx [109], up to 200 lx [105,107,110], whereas studies with nocturnal light levels >250 lx were excluded from the analysis. Only four studies used more than one light level. The reviewed studies used incandescent [107], fluorescent [110,111,113], and LED illumination types [109,115] during the daytime and for ALAN exposures during the night. The spectral wavelength ranged from 360 nm to 700 nm, and the most commonly applied was at the short end of the spectrum (blue light, about 450 nm) or cool white light, rich in short wavelengths [109,111,112,113,115]. The duration of the light exposure at night also varied between the studies, ranging from 1 min [107,110] to 15 min [105,109,111], 30 min [111], and 1 h per night [113,114,115], as well as continuous exposure throughout the night [106,108,112]. The frequency and timing of the light exposure during the scotophase differed markedly between the studies, starting from a single exposure [105,109] to repeated light pulses (e.g., References [107,111]), in the early, middle, or late scotophase. In non-human primates, no studies were found that assessed melatonin suppression by nocturnal light under irradiance <50 lx.
Overall, in rodents and ungulates, almost all exposures to ALAN showed significant melatonin suppression, starting from very low irradiance of short-wavelength (blue) light (~0.028 lx at 480 nm, applied as a 15-min pulse half into the scotophase in Siberian hamsters, resulted in 60% suppression) [109] and low irradiance of long-wavelength (red) light (~8 lx at >620 nm, applied throughout the entire scotophase in rats, resulted in 95% suppression) [106], to the highest irradiance applied within the eligibility criteria (200 lx) in mice and Siberian hamsters (70–85% suppression) [105,110]. Dim light of 0.2 lx (throughout the entire scotophase) suppressed melatonin levels in rats by 88% relative to control [108]. In ungulates, illumination of 2.3 lx for 1 h suppressed melatonin levels by 43% in goats [113], but similar illuminance levels (3 lx) and exposure duration did not affect melatonin levels in horses [115]. Melatonin suppression showed a significant positive dose-dependent suppression with irradiance [113]. The strongest suppression of melatonin levels often occurred ~30 min after the light exposure, and substantial suppression was induced already by 1-min light pulse. A 1-min light pulse (200–800 lx) in the middle of the scotophase was also able to mimic a long photoperiod in Siberian hamsters acclimated to short photoperiods [110]. With regard to phase shift and acrophase, only two studies reported a phase shift in acrophase occurrence and morning melatonin decline [105,107], whereas the other studies did not assess phase shifting at all.
In non-human primates, exposure of squirrel monkey to 200 lx of fluorescent light for 2 h in the middle of the scotophase suppressed urinary levels of the melatonin metabolite 6-sulfatoxymelatonin (aMT6s) on average by 54.8% [116]. Surprisingly, in one individual, concentrations of urinary aMT6s increased after ALAN exposure by 46.8%, indicating high inter-individual variability of response to ALAN in this species, similar to that demonstrated in humans [117] (see below). A more recent study on mouse lemurs [118] found that exposure to 50 lx for 3–5 h at the beginning of the scotophase suppressed urinary aMT6s by more than 50% relative to control (0.3 lx).

4.2.6. Mammals (Humans)

(a) Description of Studies and Participants
We identified 34 studies relevant to this review, from 1450 records screened (Figure 2, Table 6). The selected studies analyzed the impact of light exposure during the night, whereas only one study was specifically focused on light pollution [119]. The studies were performed on a total of 1315 participants. The number of participants in each study ranged from four to 116, with one population study even evaluating 528 men and women. Most studies (n = 19) included both sexes. One study was focused only on women [120], with nine studies only on men [121,122,123,124,125,126,127,128,129], and, in five studies, the sex was not specified [130,131,132,133,134]. Excluding 179 persons, for which sex or number of participants in each sex group was not specified, the majority of the remaining 1136 participants was male (n = 611, 53.8%). The participants’ age ranged from childhood (nine years) [135] to senior citizen (mean ± SD: 72.8 ± 6.5 years) [119]. Two studies evaluated adolescents (age 13–18 years) and compared the results with adult participants [136,137]. Mean age of participants was 25 years in eight studies [123,124,126,127,128,129,133,138], with a range of 18 to 30 years in eleven studies [117,121,122,127,131,139,140,141,142,143,144]. Participants with an age range to 40 years were included in six studies [125,132,145,146,147,148], those with an age range to 50 years were included in three studies [134,136,149], and those with an age range from 18 to 60 years were included in four studies [120,137,150,151].
(b) Intensity and Spectrum of Lighting in Selected Studies
Illuminance between 10 and 50 lx was most often used in selected studies [117,120,122,123,126,128,130,133,135,139,140,143,149,150,151]. Illuminance <1 lx was analyzed in one study [139], illuminance <5 lx was analyzed in four studies [119,129,131,134], and illuminance <10 lx was analyzed in five studies [127,130,142,145,147]. Illuminance up to 100 lx was used in four studies [120,121,138,150] and illuminance up to 250 lx was used in several studies [120,124,127,128,129,131,135,136,137,140,143,145,147,151]. More than one illuminance was tested in several studies [117,120,123,124,128,131,134,135,139,143,145,147,149,150,151]. Few studies used pupil dilation drugs [138,144]. The predominantly measured light intensity unit was illuminance (lx) at the level of participants’ eyes. Some studies included information on both illuminance and irradiance (µW/cm2), and some studies reported photon flux (photons/cm2·s).
Polychromatic light was used in most studies [117,122,124,126,127,129,131,134,138,139,141,142,143,145,146,147,149,150,151]. Some studies examined effects of monochromatic light [120,144], LED monochromatic light [123,132,148], or LED polychromatic light [136,137]. Two studies used incandescent light [122,128]. The impact of lighting from different electronic devices (i.e., cathode ray tube monitor, eBook, LED display) was evaluated in six studies [121,128,130,138,139,140,150], light emitting from light boxes was evaluated in four studies [123,128,138,150], and specially modified goggles were evaluated in three studies [130,133,148]. In one study, the description of the light type was not given [135]. In one study, participants wore helmets with black shields to regulate light input into the eye [138]. One study used red and blue visors to simulate night work environment and prevent melatonin suppression [126]. More than one light source was used in several studies [122,123,126,139,147]. The majority of studies used CCT <3000 K [121,122,127,129,142,146,147], and between 3000 and 6500 K [117,122,126,127,131,139,140,143,147,150,151]. Two studies used CCT >6500 K [141,150]. One study tested illuminance under seven different CCTs ranging from 1600 to 14,000 K [141]; in one study, the authors used 2700 K and 5600 K [136], and, in one study, they used 2700 K and 6500 K [137]. The CCT was not defined in several studies [119,123,124,125,128,130,132,133,134,135,138,144,145,148,149].
(c) Duration and Timing of Light Exposure in Selected Studies
The duration and timing of light exposure during the night varied among studies. The shortest duration used was <30 min [120,142,144,147]. Light exposure for 60 min was used in six studies [132,135,143,149,150,151], whereas one study used 90 min [127], five studies used 2 h [122,128,130,133,148], six studies used 3 h [124,125,137,145,146], five studies used 4 h [126,136,138,139,141], and three studies used 5 h [117,121,150]. Additionally, 6.5 h of light exposure was used in one study [134], and entire night light exposure (8 h, ~11:00 p.m.–7:00 a.m.) was used in three studies [119,129,131]. In most studies, exposure of participants to ALAN occurred between 11:00 p.m. and 3:00 a.m. [123,126,127,130,133,135,136,136,138,141,143,144,145,148,149,150,151]. Many studies applied light exposure before midnight [117,120,121,122,125,132,139,140,142,146,147], and five studies applied light exposure from 3:00 a.m. until morning [123,124,135,138,150]. Participants were exposed to ALAN more than once during the scotophase (before 2:00 a.m. or early-morning light exposure) in two studies [123,135]. In two studies, participants had individual times recorded according to their inner circadian time [128,134]. In one study, exposure time was assessed to determine the time of melatonin onset [128].
(d) Effects of Nocturnal Light on Melatonin in Humans
Most studies identified significant melatonin suppression after exposure to ALAN with illuminance <250 lx [117,120,121,122,123,126,127,128,129,131,133,134,135,136,137,138,139,140,141,142,146,148,150]; many studies, however, did not find a significant effect of exposure to ALAN <250 lx [119,122,124,125,126,130,143,145,147,151]. Dose-dependent effects of illuminance on melatonin suppression were determined in many studies [117,120,122,123,124,127,128,129,133,134,137,143,144,145,147,148,149,150,151]. Reported suppression of melatonin levels ranged from <10% [120,129,130,133,134,135,148,150] to <20% [137,138,143,145,151], <30% [120,130,135,150], <40% [122,123], <50% [126,133,136,139], and ˃50% [117,131,133,134,138,148]. In one study, the effective dose for 50% melatonin suppression was computed for each individual and at the group level [117]. No suppression of melatonin was noted in some studies [119,124,125,127], and several studies did not report the percentage of melatonin suppression [121,122,127,128,147]. The duration of light exposure had a significant effect on melatonin levels in several studies [117,126,131,133,136,137]. Exposure to light during the night caused phase advance in one study [124], phase delay in five studies [117,124,128,134,139], and shortening in the high melatonin phase in one study [131].
Early studies used very high illuminances during the night and found strong suppressive effects on melatonin. Illuminance of 200 lx caused a significant (17%) melatonin suppression following 1 h of exposure at midnight [143,151]. The same illuminance, but lasting 3 h, also beginning at midnight, caused 21% mean melatonin suppression, with the highest suppression after the first hour of exposure. The suppression of melatonin was not significant in this study as compared to control night, but only six subjects were included in this study [145]. Exposure to 200 lx for 3 h at the end of the night did not cause a significant reduction in melatonin levels compared to the control [124], but very high background light was used in the control conditions in this study. Moreover, illuminance of 250 lx administered during the normal onset of melatonin secretion was reported to reduce melatonin below detectable levels; the onset of melatonin secretion was delayed for at least 1 h after light exposure and did not rise until the end of exposure, 2 h after melatonin onset in control conditions [128]. Exposure to ALAN (200 lx) between dusk and bedtime reduced levels of melatonin by 71.4%. When ALAN exposure continued throughout the entire night, total daily melatonin was suppressed by more than 50% in most individuals, with median suppression of 73.7% [131].
Spectral distribution of light, approximated as CCT and often referred to as “light quality”, may have a considerable influence on the melatonin suppression. For example, at the same illuminance, light with higher CCT can have a larger suppressive effect on melatonin production than light with lower CCT [122,127,137,147,150]. The short exposure (30–90 min) to light with CCT <2300 K in different parts of the night (illuminance 200 lx) had the same effect on melatonin as dim light conditions (˂10 lx) [127,147]. Similar results were found in other studies after 4 h of ALAN exposure (CCT <2000 K, illuminance 200 lx). Higher CCT, ranging from 3900–14,000 K, caused significant melatonin suppression in comparison with 2750 K, but resulted in negligible differences in melatonin suppression despite the large range of CCT and the same illuminance [140]. A study that used light from a fluorescent tube [129] showed that, when short wavelengths (<530 nm) were filtered out, an illuminance of 193 lx throughout the entire night suppressed melatonin only marginally, but significantly (6% ± 4%) compared to dim light conditions (5 lx), whereas non-filtered white light (253 lx) caused a larger (45% ± 6%) melatonin suppression compared to dim light.
Some studies identified age-dependent effects of ALAN. Less mature adolescents showed greater melatonin suppression at all tested illuminances (15 lx, 150 lx, 500 lx) in the evening (11:00 p.m.–12:00 a.m.) compared to the late pubertal and post-pubertal adolescents [135], whereas morning melatonin suppression (3:00–4:00 a.m.) was not statistically different among age groups. Two different CCTs with the same circadian stimulus and photon density were tested, but with different illuminance between adolescents (13–18 years) and adults (32–51 years) [136]. The suppression of melatonin was greater in the adolescent group than in adults, and there was no difference between different CCT in adults (melatonin suppression ~30%). These studies demonstrate that adolescents are more sensitive to short-wavelength light than adults. The exposure of elderly people to an entire night of ALAN in their home environment did not show significant differences in urinary melatonin between a group exposed to <3 lx and a group exposed to >3 lx [119]. This study was the only investigation to focus on light pollution, and it included 528 probands in home conditions and monitored a metabolite of melatonin in a spot morning urine sample. The authors found ALAN to be associated with impaired obese and lipid parameters, but not with melatonin. Comparison of melatonin suppression by ALAN, with monochromatic light of different wavelengths and irradiances at the beginning of the melatonin rising phase, in premenopausal and postmenopausal women, demonstrated reduced melatonin suppression in response to short-wavelength light in older postmenopausal women [120].

5. Discussion

The importance of melatonin in circadian rhythm is quite well understood, but the impact of ALAN on melatonin levels and, thus, on circadian rhythm is much less understood. It is quite possible that ALAN not only changes the amplitude of melatonin rhythms but also results in phase shifts; however, the potential shifts in timing of the melatonin cycle as a result of exposure to ALAN were barely studied [e.g. 15]. ALAN is a relatively novel human-generated environmental stressor, and its distribution is spreading worldwide. Increased illumination, and the increasing use of light sources rich in short wavelengths should raise concerns about its impact on the circadian rhythms of wild animals and humans. Our knowledge on melatonin and ALAN, however, is limited to a few groups of vertebrates (Figure 3), which compounds our extremely limiting understanding of the mechanisms in some vertebrate groups. It is clear that large differences exist both within and between vertebrate orders, precluding generalization of patterns or the transfer of knowledge from one taxonomic order to another. Although nearly all vertebrates possess photoreceptors, frequently of multiple types, which regulate melatonin levels and circadian rhythms, not all species have the same photoreceptors and sensitivity to ALAN. Moreover, ectotherms can use both light and temperature as a zeitgeber, and while this is well documented in reptiles, the importance of temperature as zeitgeber in fish, who live in well-buffered environments, is less clear. Temperature seems not to be of importance for circadian rhythms in non-reptilian vertebrates [152], who are either endothermic (birds and mammals) or avoid exposure to high temperatures (amphibians).
In almost all groups (with the exception of rodents, ungulates, and humans), the minimum light levels reported in the literature to induce a measurable melatonin suppression were the lowest light levels tested. The lowest light levels that suppress melatonin (~0.001 and 0.002 lx) with the highest variability are reported for groups with the largest number of studies (15 for fishes and 34 for humans, respectively; Figure 4, Table 2), whereas in the least-studied groups (e.g., primates other than humans, two studies), the effects were reported at relatively high light levels (50 lux). This suggests that the lower observed sensitivity in less-studied groups may be at least partially related to the lack of research on these groups. Early experiments were often designed to test relatively high illumination levels and progressed toward treatments with lower irradiance in search for the thresholds. Our review reveals that the sensitivity thresholds of melatonin to ALAN can be expected to be even lower than currently reported in the literature for groups such as birds and mammals. Further research should test for the effects of ALAN of lower intensities (<1 lx, Figure 4), which animals of all vertebrate groups may experience throughout large areas in nature.

5.1. Fishes

Freshwaters and coastal habitats are likely to be affected by light pollution, as ALAN derives from human activity centers, which are typically close to sources of freshwater [153].
The studies on plasma melatonin of fishes under different intensities of ALAN from broad-spectrum white light, despite the heterogeneity across taxa, habitats, temperature, and experimental designs, provide a surprisingly clear picture of a dose-dependent suppression of melatonin under nocturnal illumination in fishes. In many studies, plasma melatonin was even reduced at very low intensities in the range of skyglow and moonlight (0.01–1 lx); in one extreme study, even exposure to the illuminance of a new-moon night reduced plasma melatonin significantly [55]. This shows that fishes are generally susceptible to ALAN and that reduced nocturnal melatonin production can be expected in most bony fishes during ALAN exposure. From the studies using acute 1–2-h light pulses during scotophase, it is clear that the reduction of plasma melatonin is a very rapid and probably direct response to ALAN. The exception to this trend was the only experimental field study included in our analysis [63], and also the only study not to measure a reduction in plasma melatonin under ALAN with street-lamp illuminance of 15 lx, compared to half-moon conditions on the dark control site (0.02 lx). The authors attributed the lack of change in light of the half-moon to the more complex in situ conditions (i.e., higher background noise levels) and the long sampling procedure which may have blurred shifts in melatonin peaks [63]. Furthermore, while an adaptation of endogenous melatonin rhythms to the permanent illumination cannot be excluded, it is considered unlikely, given that other studies reviewed here had a similar experimental duration [59,61]. More long-term studies in natural in situ conditions are required to detect the mechanisms of acclimatization and adaptation to permanent exposure to ALAN.
From the selected literature, there was no clear overarching trend for color sensitivity of fishes toward ALAN. The production of plasma melatonin was more sensitive toward green and red light, as compared to blue light, in the freshwater species Eurasian perch [67]; however, in roach, all colors equally suppressed melatonin [65]. For the marine species European sea bass, red light had weaker effects than green or blue light at low intensities, and it was suggested that the differences between light colors depend on the intensity [62]. More studies support the idea that marine fishes are minorly sensitive toward red light [154,155], especially at low intensities [156]. These spectral sensitivities correspond to the dominant light color in the respective photic habitat, as marine fish species are known to have higher retinal spectral sensitivities at shorter wavelengths (blue light) than freshwater fishes, in which spectral sensitivity is typically more shifted to higher wavelengths (red light) [85]. If pineal and other non-visual photoreceptors have similar spectral sensitivities to visual ones, then this would explain the color effects in roach and Eurasian perch [65,67]. However, no direct measurements of spectral sensitivities for pineal or other non-visual photoreceptors in fishes are available. Setting thresholds for color sensitivity for fishes in general will not be possible and likely remains habitat- and species- specific.
The selected papers indicate that light pollution may not only affect plasma melatonin and, therefore, the timing of physiological processes, but it can also potentially influence the visual adaptation of fishes by changes in ocular melatonin. The direction of the effects of broad-spectrum white light on ocular melatonin seems to be species-dependent, but melatonin was significantly altered at almost all intensities in all studies. In different species, ocular melatonin shows opposite responses to light during the scotophase, increasing in some species and decreasing in others. The reasons why melatonin is increasing or decreasing upon exposure to ALAN remain a subject for future studies. Studies that show opposing responses in ocular and plasma melatonin support the hypothesis that ocular and plasma melatonin are parts of separate systems in fishes; ocular melatonin might be used for visual adaptation, and plasma melatonin might be used for circulating in the blood and circadian organization of cells and tissues [10,50].
Similar to other ectotherms, melatonin production in fishes is not solely influenced by light, but also by temperature [61]. The facts that Atlantic salmon showed the weakest response to ALAN at low temperatures (between 1—17°C) and that tropical fish species showed the strongest response indicate that temperature might interact with ALAN to affect melatonin. Some publications did not report water temperature [54,55,56,57,58,63] or gave a broad temperature range without specifying temperature for the time of melatonin measurements [60,61,157]. This review, therefore, does not allow us to draw conclusions on temperature-dependent ALAN effects, which warrant further study.
All selected studies investigated teleost species, and other fish taxa, e.g., cartilaginous fishes (Chondrichthyes), remain subject to future research.

5.2. Amphibians

Most species of Anura (frogs and toads) are fully or partly nocturnal and, therefore, particularly susceptible to ALAN [70]; however, no studies were identified that met our eligibility criteria, clearly indicating that there is a major research gap in this class of vertebrates regarding melatonin suppression by ALAN. The lack of studies on amphibians is surprising given the worrying worldwide decline of amphibian species and the known ecological and physiological effects of light pollution on other vertebrate taxa. In addition to habitat loss and increasing diseases, light pollution may be an important factor to consider when developing conservation measures for amphibians. Shape and thresholds of dose–response functions of melatonin toward intensity and color of ALAN, as well as effects of realistic light pollution scenarios, are unknown for amphibians and should be subject to future research.
Due to the complexity of the life cycle, it is possible that melatonin production might have different sensitivities toward ALAN at different life stages, however this has not been tested. Color change by skin melanophores, as well as differences in ocular and plasma melatonin, may also be of interest in this taxon.

5.3. Reptiles

The effect of low nocturnal light levels on melatonin in reptiles was not studied. Moreover, the importance of light in regulating melatonin cycles in reptiles is also poorly understood. Reptiles are a highly varied group, and it is clearly not possible to generalize based on the small number studies on light and melatonin in general and small number of species studied. In contrast to other vertebrates, it seems that nocturnal exposure to light in reptiles does not result in an immediate decrease in melatonin levels. Furthermore, reptiles use both ambient temperature and light as zeitgebers, where, at least in some cases, temperature seems to be the most important of the two. This seems to be a unique feature, setting reptiles apart from other vertebrates, and needs to be addressed in future studies. An important hiatus is the lack of research on the many nocturnal species, including many species of snakes and geckos. Whether these are more sensitive to nocturnal exposure to light is currently unknown.

5.4. Birds

Several conclusions can be drawn from the results. Firstly, as in other vertebrate groups, ALAN exposure at night suppresses or strongly reduces melatonin production and release in birds, even at an illuminance of 0.3 lx. This change is usually accompanied by changes in behavior, especially temporal shifts in activity patterns with higher nocturnal activity [15] and, in some cases, higher overall daily activity [96]. Secondly, as only three studies were specifically designed to test the effects of ALAN on melatonin in birds, there is a need to increase our knowledge in this field by increasing the replicability of results and the number and type of avian species tested. Novel studies should also devote particular attention to the choice of light bulbs used in the experiments, as well as the experimental set-up. Most studies used wide-spectrum light sources; therefore, a clear research gap is the effect of different ALAN wavelengths on melatonin production and release in birds. Lastly, the wider implications of night-time melatonin suppression due to ALAN in birds are also not known. Behavioral links to melatonin suppression were reported for different avian species, particularly strong shifts in activity timing. However, what does this mean for the health and fitness of birds? Changes in the temporal expression of activity patterns may have significant implications for predator–prey relationships and energetics. It is, therefore, impelling that future studies should also consider the opportunity to measure melatonin rhythms under ALAN in wild birds. This question is equally important for domesticated species of economic interests, like the chicken, where animal welfare issues also need to be considered.

5.5. Non-Human Mammals (Rodents, Ungulates, and Primates)

Despite extensive research on melatonin and circadian rhythms in rodents and ungulates, relatively little research assessed melatonin suppression under low-level ALAN in experiments specifically designed to mimic light-polluted conditions; whereas studies on non-human primates are in their infancy. In the first two groups, effects of ALAN were mostly assessed by the use of light pulses (duration from 1 min to 1 h), whereas low-light illumination throughout the entire night, which would more closely relate to light-polluted conditions, was only assessed in three studies. With only two relevant studies on primates that were identified for this review, there is a clear research gap and a need for more studies which would include diverse species, light sources, and light intensities to study the effects of ALAN on melatonin in non-human primates.
In rodents and ungulates, ALAN suppressed melatonin levels to different extents, at virtually all irradiance and wavelength levels, particularly under the combination of short-wavelength and high-irradiance exposure. The duration and frequency of the exposure have an influence on melatonin suppression; however, for a better understanding of this relationship, more studies need to be carried out. The selected studies show a positive dose-dependent relationship between nocturnal irradiance levels and melatonin suppression [113], and a dose-dependent relationship is likely to exist in relation to spectral composition as well. This was indicated in another study [158], which was not included in this review due to high irradiance levels, which used monochromatic light of different wavelengths (blue 479 nm, yellow 586 nm, and red 697 nm) but the same irradiance (293 µW/cm2) for 30 min in the middle of the scotophase to compare spectral sensitivity and acclimation duration in two rodent species, nocturnal social vole (Microtus socialis) and diurnal, obligatory subterranean blind mole rats (Spalax ehrenbergi). In both species, melatonin suppression showed negative dose-dependency toward blue light, as well as toward yellow in social voles and toward red in blind mole rats. This indicates species- and wavelength-specific sensitivity of melatonin suppression in sighted mammals, possibly as a result of different adaptive life-history strategies at the retinal level [158]. Minimizing emission of short wavelengths in the spectral output of light sources may be a promising approach to mitigate effects of on melatonin levels in mammals, as it was recently shown for nocturnal marsupial species, tammar wallaby (Macropus eugenii) [159]. More studies that compare effects of different light sources on a wider diversity of species with different life histories are highly needed.
Interestingly, in contrast to nocturnal mammals, some diurnal species seem to have robust melatonin rhythms which are relatively insensitive to nocturnal light. For example, in Eastern chipmunk (Tamias striatus), even high irradiance rich in short wavelengths applied in the middle of the scotophase (~4,000 lx at midnight, cool white fluorescent light) did not suppress nocturnal melatonin, but the suppression occurred if lighting was applied later in the scotophase (at 3:00 a.m.) [160]. Seven nights of exposure to 200 µW/cm2 did not affect melatonin levels in Eastern chipmunk nor in Mexican ground squirrel (Spermophilus mexicanus) [161]. In subterranean rodent valley pocket gopher (Thomomys bottae), exposure to irradiances ranging from 220 to 600 µW/cm2 (cool white fluorescent light) for 1–4 h into the night at varying times also did not suppress melatonin production [162]. These studies were excluded from the analysis due to too high light levels; they do, however, contribute to our understanding of ALAN effects of animals with different activity patterns.

5.6. Mammals (Humans)

In line with data from other vertebrates, ALAN can also effectively suppress the night-time melatonin production in humans. Bearing in mind that melatonin in humans, apart from regulating various physiological systems, immune activity, and anatomical and behavioral patterns, is also an efficient antioxidant, antiaging, and anti-oncogenic hormone (with regard to breast and prostate cancers) [1,163], the suppression of its production by ALAN imposes a health risk [164]. Recently, it was discovered that melatonin is involved in epigenetic modifications [163]. The negative results of its suppression are not to be recognized soon after exposure to ALAN, as a period of years can pass before the symptoms appear. Therefore, our knowledge on melatonin levels is becoming crucial, as it is an important biomarker regarding health risk evolving from exposure to ALAN. Knowing the thresholds for melatonin suppression by ALAN is important for setting recommendations for the lighting of human environments at night.
The sensitivity of the human circadian system to nocturnal light seems to be lower than previously anticipated. Although early studies on entrainment of circadian rhythms suggested social cues as an important stimulus for their synchronization in humans [165], it is now well accepted that light is also an important entraining agent for the human circadian system, and that amplitude of the melatonin rhythm can be suppressed by ALAN [7]. Early studies used very high illuminances during the night (>200 lx) and found strong suppressive effects on melatonin. As such high levels of illumination can occur at home during the evening, these findings suggest that exposure to room light before bedtime, and during the normal hours of sleep may impact physiological processes regulated by melatonin signaling, such as sleepiness, thermoregulation, blood pressure, and perhaps even glucose homeostasis [131]. Moreover, night-time light exposure can have acute effects on the endogenous circadian phase of the melatonin rhythm, with possible consequences on sleep–wake rhythms and sleep quality. Light exposure during the late evening can significantly phase-delay melatonin rhythm, whereas the same treatment can phase-advance the rhythm if it occurs late in the night. The effect is dose-dependent, because low illuminances (<15 lx) evoked a little phase shift, while bright light (>500 lx) caused an apparent saturating phase shift of the endogenous circadian melatonin rhythm [165].
Despite intense research during the last few decades, the exact threshold for melatonin suppression in humans is still not established. Most studies explored illuminance levels which are related to indoor lighting and are much higher than outdoor lighting. Such studies found that illuminances approaching 40 lx were needed for melatonin suppression after 3 h of light exposure [137,150]. In this context, recommendations by the Illuminating Engineering Society of North America for outdoor environment at night, of 18 lx on the horizontal plane and 9 lx at the eye level, are below this threshold. However, these recommendations are based on estimation at the group level from studies performed under “average” conditions with a limited number of participants; therefore, they may be too high for sensitive people exposed to ALAN in specific conditions. In a laboratory study, even the lowest illuminance (3 lx) caused melatonin suppression in some participants [134]. Moreover, laboratory studies with monochromatic light imply even greater sensitivity of the human circadian system; for example, monochromatic light near the maximum of the melanopsin absorption was reported to trigger measurable melatonin suppression even at very low irradiances of 1010 photons/cm2·s (4.3 nW/cm2) at a wavelength of 460 nm [20]. When converting these values to photopic units, the illuminance reaches down to about an exceptional 0.002 lx, which is on the order of starlight illuminance. In another study, minimum illuminance for melatonin suppression was found to be wavelength-dependent, ranging from 0.1 lx at 424 nm, 1 lx at 456–472 nm, and 5 lx at 496 nm, to 34 lx at 520 nm and 50 lx at 548 nm [146]. The idea that thresholds lie in a range of 2–10 lx is also supported by a modeling study, which was excluded from this review because it does not contain original data [166]. These findings suggest that ALAN has a potential to suppress melatonin at virtually any intensity we are exposed to in real-life conditions. These findings, however, must be verified in future experimental studies with a larger number of participants, and the relevance of such high implied sensitivity of the human circadian system to nocturnal light needs to be evaluated in the context of indoor and outdoor lighting environments and technologies.
Another recent experimental study convincingly demonstrates that the circadian melatonin production can be suppressed by a low level of white light [117]. A relatively large number (29 women and 27 men) of young participants (aged 18–30 years) were exposed to polychromatic white light in a range of 10, 30, 50, 100, 200, 400, and 2000 lx. The experiment was performed under control conditions in the sleep laboratory, and illuminance was measured at the eye level (CCT ~4,100 K; background light <0.1 lx). Under these precisely controlled lighting conditions, the effective dose of light for 50% of melatonin suppression (ED50) at the group level was 24.6 lx. However, in the most sensitive individuals, the ED50 reached only 6 lx, whereas it was 350 lx in the least sensitive individual. It can be expected that such large inter-individual variability might preclude the possibility of a significant suppression of melatonin being obtained at the group level in previous studies, mainly performed on a limited number of participants. Such large inter-individual variability was not reported for other animal species, with the exception of the one individual highlighted earlier in a primate study (see above). The factors which contribute to this extensive inter-individual variability are not known; they may include photoreceptors [167], SCN functioning [166], or non-retinal inputs to the SCN [117]. Differences in structure and calcification of the pineal gland should also be considered.
In addition to the illuminance level, the suppressive effects of ALAN on melatonin production can depend on several other factors, such as spectrum of light, duration and timing of light exposure, age of probands, and their photoperiodic history. Several studies showed that at the same illuminance, light with higher CCT had a larger suppressive effect on melatonin production than light with lower CCT. The selected studies used different lengths of ALAN exposure and, therefore, a direct comparison between them is not appropriate. Maximal melatonin suppression was reached even after 1 h of light exposure with different illuminances (200 lx, 400 lx, 600 lx), and longer exposure had no further influence on melatonin concentrations [145]. Recent studies reported somewhat different results; the significant effects of exposure duration indicated that a longer exposure (11:00 p.m. –3:00 a.m.) suppressed melatonin to a greater degree [136]. A limited number of studies deal with long or all-night light exposure to low illuminances; one notable study [134] examined overnight exposure (11:00 p.m.–5:30 a.m.) with three different illuminances at high CCT of light (3 lx, 106 lx, and 9,100 lx). Even low illuminance (˂15 lx) evoked a change in plasma melatonin concentration and caused a small phase shift [134].
The reviewed studies suggest that the sensitivity of humans to non-visual responses of light is higher than previously anticipated and that studies reporting a rather high level of light needed for melatonin suppression in humans have several limitations. It is plausible that suppressive effects of ALAN are individually based, and that thresholds reported at the group level are too high for sensitive individuals, especially if combined with short wavelengths. Moreover, the sensitivity of the circadian system changes during the night, and it is less responsive in the middle of the night, when most experiments are performed. Studies with several levels of light illuminance, spectral distribution, duration, and timing are needed to establish the thresholds. In particular, for a group of sensitive people, who may respond to very low illuminance, it is necessary to reconsider the potential health consequences of exposure to indoor and outdoor “dim” light in the evenings or throughout the entire night. Identification of such people and exploration of causes for high/low sensitivity to ALAN are other challenges for future research.

5.7. A Note on Experimental Design

When designing experiments to study melatonin suppression, a proper set-up of control conditions is crucial in order to make reliable comparisons among treatments and interpretation of experimental results. Studies on experimental animals often suffer from “too dark” control conditions, as complete darkness that is often used in laboratory experiments can lead to higher melatonin production than what would occur under naturally lit nights. For example, in Mozambique tilapia, the illumination in a new-moon night (i.e., starlight, ca. 0.0006 lx [23]) was enough to significantly reduce melatonin within 1 h to 75% of the melatonin levels in complete darkness [55]. In addition, Senegalese sole had significantly higher plasma melatonin in shaded tanks on a new-moon night than fishes exposed to natural new-moon conditions [168]. These studies indicate that complete darkness in laboratory settings may be too dark for ecologically realistic comparisons in melatonin levels.
In humans, on the other hand, controls are often subjected to too high background illuminances, which may interfere with melatonin production and may be one of the reasons for the initially reported insensitivity of human melatonin levels to ALAN, which is surprising in comparison to other mammals. Unlike recent studies, where background illuminances ranged from 0.1 to 5 or 10 lx, many early experimental designs used “dim light” up to 20 lx [126,143,148], 50 lx [128,149], or even 200 lx [124] which is likely to suppress melatonin by itself. Therefore, the use of lower background control illuminances (<0.1 lx) with spatially diffuse and spectrally broadband light is recommended for studies on melatonin in humans.
ALAN may not only affect amplitude, but also the circadian phase of the melatonin rhythms, which was reported in few studies on fishes, birds, and mammals, including humans. If a phase shift occurs under ALAN, typical single- or two-point studies exploring suppressive effects of ALAN may miss the peak of the melatonin rhythm. If the sampling time is kept the same for control and experimental animals, the results could be misleading, as these groups would be sampled at different phases during their melatonin rhythm and the melatonin levels between the groups would not be comparable. Hence, obtaining at least four samples per day per individual and treatment group is essential in order to establish full circadian profiles and understand the true effects on amplitude and timing of melatonin rhythms, which should be considered in future studies.

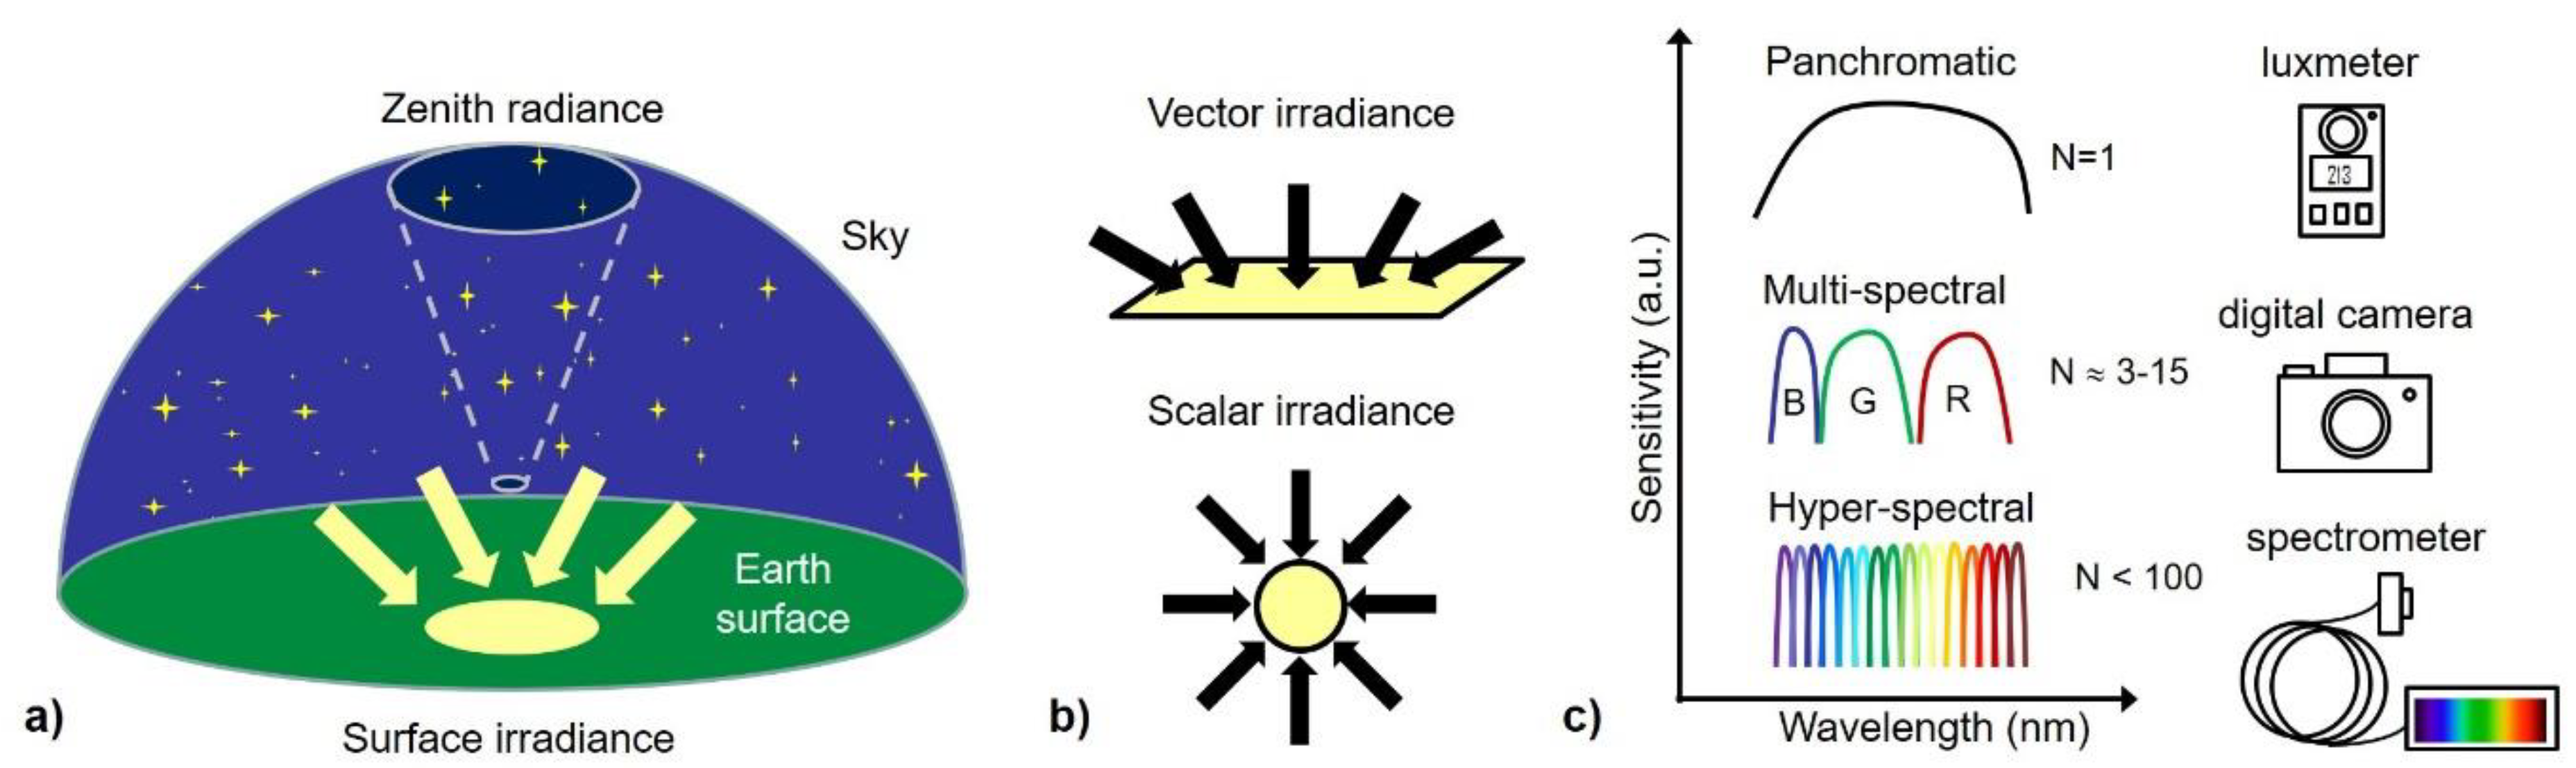
5.8. A Note on the Measurement of Light Intensities

The illumination of a study organism is a complex endeavor and should take into account intensity, spatial distribution, wavelength, and, under some circumstances, even polarization of the light source. Furthermore, the spectral sensitivity of the photoreceptors should be considered when designing a study. In the present review, we used the photometric illuminance, which is most often used in biological publications and by the lighting industry. However, illuminance refers to the spectral sensitivity of the human eye at daytime and has several drawbacks for both human studies at night and animal studies in general. The meaningfulness of an illuminance value becomes problematic particularly when monochromatic light is used. In humans it was recently found that, instead of using photopic illuminance, a new “melanopic irradiance” (using “melanopic lx”) based on a weighting function using the melanopsin action spectrum is most meaningful, also for monochromatic light [166]. In principle, such a procedure is possible also for other species if the action spectrum of photoreceptors is known; however, this is currently not the case for most species. “Circadian stimulus” is another metric suggested by Reference [169] for quantifying light as a stimulus on human melatonin suppression based on the sensitivity of all retinal photoreceptors.
If the spectrum of a light source is known or measured, then a conversion between radiometric units and photometric units, as well as species-specific action spectra, is in principle possible at least for the same geometry (irradiance and illuminance). We, therefore, recommend measurement of the (vector) spectral irradiance (in W/m2·nm) directed at the target, usually in horizontal or vertical plane depending on the experimental design. In such a case, illuminance can be easily calculated and should be provided for ALAN studies for comparisons with existing literature (see Appendix).

5.9. Research Gaps and Recommendations for Future Research

In all studied taxa, low-level light at night suppresses melatonin levels; however, the current knowledge on a dose–response relationship regarding light intensity and wavelength, as well as the shape of the dose–response function, is incomplete. For many taxa, the lowest light levels reported to suppress melatonin are the lowest light levels tested; hence, there is a clear need to test even lower irradiances to which wildlife could be exposed in nature in order to identify the thresholds of ALAN effects. Moreover, whether such thresholds exist, i.e., whether effects of ALAN occur only above a certain light level is unclear, as a slight increase in irradiance was enough to cause measurable effects in nocturnal melatonin in some studies, e.g., in fishes [55], birds [15], and humans [132]. A range of light levels, spectra, and light types used in outdoor and indoor illumination needs to be assessed in future studies, on a wider diversity of species across vertebrate taxa.
Little is known about the wider ecological implications of ALAN-suppressed melatonin and its consequences for fitness and survival of vertebrates in the wild. Melatonin is an important antioxidant and mediator of the immune functions; however, in experimental field studies, ALAN did not reduce antioxidant capacity in marsupial mammal, tammar wallaby, despite suppressing melatonin levels [159], nor was it the case in great tits [170] (although melatonin was not measured in the latter study). Melatonin suppression is often accompanied by changes in behavior, e.g., activity timing in birds. In addition to affecting melatonin and circadian rhythms, ALAN can affect a range of nocturnal activities in animals, such as foraging, orientation, predator/prey interactions, and reproduction [30,31], potentially leading to large-scale ecological changes. Field studies on wild populations and the effects of chronic, long-term exposure to ALAN are highly warranted.
To our knowledge, no studies tested the effects of ALAN on melatonin suppression in amphibians and reptiles. Such studies are urgently needed in order to understand and mitigate potential impacts of light pollution on these vulnerable groups. Which life-stages in amphibians are most susceptible to ALAN? Is melatonin in reptiles affected by ALAN, as it is in other vertebrate taxa? Are there differences in pineal and ocular melatonin? Learning from previous investigations, such studies can apply high-quality experimental designs with adequate control conditions (see above), a well-described light set-up (including irradiance, spectrum, and distance to the light sensor), and measurements of full circadian profiles using validated, and when possible, minimally invasive methods for melatonin measurements (e.g., enzyme-linked immunosorbent assay (ELISA) on samples of saliva, urine, or water). In ectotherms, ALAN may interact with temperature to affect melatonin levels; therefore, measuring and reporting temperature throughout the experimental period, especially at the time of sampling, is essential to understanding the dynamics of melatonin suppression by ALAN in these taxa. This may be of particular importance for conservation measures in a warming world.
In humans, the same illuminance was found to be highly suppressive in some individuals and well tolerated in others, and the biological mechanisms underlying this remarkable inter-individual variability in sensitivity to ALAN need to be studied extensively. For these reasons, thresholds based on the group level have serious limitations, and dose-dependent studies at the level of individuals are needed to reveal a threshold of melatonin suppression by ALAN. Furthermore, more results are needed in a developmental context; adolescents were reported to be more sensitive to ALAN than adults, especially to short wavelengths, but the exact age categories are yet to be defined. Moreover, the possibly reduced light sensitivity of the circadian system in older people must be considered in future studies. Light spectrum, duration and timing of light exposure, age of probands, and their photoperiodic history all need to be considered when assessing thresholds of nocturnal light impacts. There is an urgent need to study the effects of all-night exposure to low-intensity ALAN in different age groups with a sufficient number of human participants. Health consequences of ALAN-induced changes in melatonin levels with respect to metabolism, immune function, and endocrine balances need to be further explored, together with other non-visual effects of nocturnal light on the brain, heart, and immune system.

6. Conclusions

The use of artificial illumination is increasing exponentially worldwide. This review shows that ALAN in general suppresses nocturnal melatonin production in vertebrates, often in a dose-dependent and wavelength-dependent manner; however, our knowledge is limited to few vertebrate groups with large differences in circadian organization and sensitivity, precluding generalization of observed patterns. Amphibians and reptiles are yet to be studied in the context of light pollution and melatonin suppression. In the most-studied groups (e.g., fish and humans), the effects of ALAN are reported at surprisingly low light intensities, and they warrant a better understanding of the physiological and health consequences of melatonin suppression.
The low reported sensitivity of the circadian rhythm in some taxa indicates that ALAN has a potential to influence wild animals over large areas where light pollution is present, e.g., due to skyglow. However, studies conducted in natural conditions are scarce; furthermore, which light levels animals truly experience in nature is not really known. Light levels exponentially decrease with distance from the lamp, and mobile species can easily avoid exposure to direct illumination and, thus, also avoid potentially strong effects on melatonin rhythms [15], which may not be the case in less mobile species.
In many taxa, e.g., birds and mammals including humans, melatonin suppression is especially strong at short wavelengths; however, no clear trends were found in the spectral sensitivity of fishes toward ALAN. This makes mitigation of ALAN impacts on wildlife by spectral adjustment difficult. In humans, the sensitivity to non-visual responses of light is much higher than previously anticipated, and recognition of the same lighting environment by the circadian system varies greatly between individuals.
In summary, well-designed studies, particularly with a wider range of light irradiance and spectrum and well-defined light properties, are highly warranted for all vertebrate taxa. Characterizing the spectral composition and irradiance thresholds for melatonin suppression will be of great importance in the development of strategies to alleviate the adverse ecological and health impacts caused by exposure to ALAN. All of these findings need to be considered when developing recommendations for the lighting environments at night.

Author Contributions

Conceptualization, M.G., A.H., A.L., P.M., W.R., M.Z., and F.H.; methodology, M.G., A.H., K.M.A.G., F.K., P.M., W.R., K.S., M.Z., and F.H..; investigation M.G., A.H., P.B., D.M.D., K.M.A.G., F.K., W.R., K.S., R.H.A.v.G., and A.E.Z.; writing—original draft preparation, M.G., A.H., D.M.D., K.M.A.G., A.J., F.K., K.S., R.H.A.v.G., A.E.Z., and F.H.; writing—review and editing, M.G., P.B., D.M.D., K.M.A.G., A.J., F.K., A.L., W.R., K.S., R.H.A.v.G., M.Z., and F.H.; visualization, A.J and K.M.A.G.; supervision and project administration, M.G.; funding acquisition, F.H.

Funding

This article is based upon work from COST Action ES1204 LoNNe (Loss of the Night Network), supported by COST (European Cooperation in Science and Technology). M.G. was supported by a DRH HONORS fellowship by the Freie Universität Berlin. A.J. was supported by the Leibniz Association, Germany within the ILES (SAW-2015-IGB-1 415) and CONNECT (SAW-K45/2017) projects, and by the IGB Leibniz Institute through the Frontiers in Freshwater Science project (IGB Frontiers 2017). F.K. was supported by the Leibniz Association, Germany within the ILES (SAW-2015-IGB-1 415). W.R. was partially supported by the Center for Environment, Fisheries, and Aquaculture Science (Cefas), and the UK Government’s Department for Environment, Food, and Rural Affairs (Defra) under contracts SF0258 and SA001. M.Z. and K.S. were partially supported by the Slovak Research and Development Agency APVV-17-0178. The publication of this article was funded by the Open Access Fund of the Leibniz Association.

Acknowledgments

We gratefully acknowledge the help of Anat Barnea and Marcel Visser for fruitful discussions. This article is dedicated to our co-author Abraham Haim, a friend and great pioneer in the field of light pollution research.

Conflicts of Interest

The authors declare no conflicts of interest.

Appendix A. A Short Overview of Relevant Radiometry and Light Propagation Basics

In this subsection, we provide a brief overview of the necessary background on radiometry for light measurements in the context of ALAN and provide recommendations on how to measure light in ALAN experiments focused on melatonin. Light measurements may appear to be straightforward, but different physical quantities (measurands) and different units used across different disciplines often cause confusion. This is particularly relevant in the interdisciplinary field of light pollution where astronomers, biologists, lighting engineers, and human physiologists perform experiments on the topic of ALAN that also require light measurements. For historical reasons, the different groups use very different approaches and measures, but a common language is yet to be established. However, when all relevant parameters are measured and properly reported, it is normally possible to convert units; if not, it becomes very challenging if not impossible.

Appendix A.1. Further Reading

As it is impossible to be comprehensive here, we recommend all newcomers to this interdisciplinary field to have a look at the book written for biologists [171], which is not only useful for biologists. We further want to point out the excellent paper [172] about recommendations for human studies in what they call the “melanopsin age”, providing also a useful toolbox in the supplement to convert spectral irradiance to photopic and other units.

Appendix A.2. General Radiometry and Geometry

Firstly, we consider the geometry and define some radiometric quantities. The radiant flux (in W) is the radiant energy emitted, reflected, transmitted, or received, per unit time. The radiance L e (in W/sr·m2) is the radiant flux emitted, reflected, transmitted, or received by a surface, per unit solid angle per unit projected area. This is a directional quantity. The index “e” stands for energy. For an observer, it is the light that is incident from a specific solid angle. The irradiance E e (in W/m2) is the total radiant flux received by a surface per unit area. See Figure A1a for a schematic drawing of measurement of the radiance of the sky L e , s k y (specifically L z e n i t h at zenith), which is often measured by astronomers at night and then often reported as night sky brightness or night sky radiance. In contrast, the surface irradiance at the Earth surface is shown as an example, which is more often measured by, for example, biologists working on the topic of light pollution.
Figure A1. Schematic drawing of different radiometric parameters: (a) geometry of sky and zenith radiance and surface irradiance measurements; (b) vector and scalar irradiance; (c) different spectral bands: single (panchromatic), multiple (multi-spectral), and full spectrum (hyperspectral) (after Reference [173]).
Sustainability 11 06400 g0a1
It is important to define the irradiance properly, because it can be differentiated between scalar irradiance E e , s c a l a r (sometimes termed E 0 ), which is the light incident on a sphere [174], and vector or plane irradiance E e , p l a n e (Figure A1b), which is the light incident on a plane surface. The former is often used by biologists working with phytoplankton or marine biologists in general, and the latter is most commonly measured in the horizontal plane E e , h o r i z o n t a l (i.e., again the Earth surface) at least for most outdoor experiments, but also in the vertical plane for indoor experiments with humans.

Appendix A.3. Spectral Measurements in Single or Multiple Spectral Bands

In the spectral domain, radiance and irradiance are defined according to spectral sensitivity or “band”. Panchromatic sensors (Figure A1c, upper graph) measure the radiance in a single spectral band, sometimes due to the sensor’s own sensitivity (e.g., silicon) or by adding color filters to target a specific application.

Appendix A.3.1. Photometric Quantities

The luminance L v , for example, is the radiance referenced to the (daytime) sensitivity of the human eye (in cd/m2), and illuminance E v (in lx) would be the irradiance equivalent. The index “v” stands for visual. A basic unit in photometry is the “candela” (cd) for the luminous intensity, which is the luminous flux per solid angle. It is a historical (but still a proper SI) unit, as a common wax candle emits light with a luminous intensity of roughly one candela. The luminous flux is the total luminous energy per unit time (given in “lumen”—lm = cd·sr). The luminance (in cd/m2) is the luminous flux per unit solid angle per unit projected source area. Due to the relevance for humans, the most commonly used panchromatic sensor for light measurements is, therefore, a luxmeter (lx = lm/m2), normally measuring horizontal illuminance using a cosine corrector.

Appendix A.3.2. Photosynthetically Active Radiation

Another quantity often used in biology is “photosynthetically active radiation” (PAR) irradiance E P A R that weights the incident number of photons equally (not energy) between 400 nm and 700 nm [175]. Thus, the panchromatic PAR meters are also often called quantum light meters. PAR irradiance is often given in energetic units W/m2 or using photon flux per unit area n p h o t o n s / s · m 2 , with the number of photons n p h o t o n s     sometimes expressed in mol (1 m o l = 6.02 × 10 23 ), which is sometimes called “Einstein”—E.

Appendix A.3.3. Astronomical Magnitudes

Another panchromatic sensor used in the context of ALAN (but not in melatonin studies) is a sky quality meter (SQM) that measures the zenith night sky radiance in a spectral band that is close to, but does not exactly resemble the photopic curve [23]. Astronomers historically use “magnitudes”, a negative logarithmic scale (lower = brighter, higher = darker). The SQM provides a value in units of mags/arcsec2 that can be approximated to a luminance value [23], which is useful for sky brightness measurements and to estimate skyglow but not to characterize experimental set-ups for melatonin studies.

Appendix A.3.4. Multi- and Hyperspectral Bands

To achieve spectral resolution, it is necessary to measure in multiple bands. Currently, the terms multi-spectral and hyperspectral (from the remote sensing community) are commonly used to distinguish sensors, although this is not strictly defined. Multi-spectral sensors have several discrete bands, typically three to about 20, realized with optical filters. For example, a digital consumer camera with an RGB (red, green, blue) sensor qualifies as a multi-spectral sensor measuring L R , G , B (Figure A1c, middle graph). Such cameras with wide field optics are used to study light pollution [176]. A hyperspectral sensor has many (typically narrow) discrete bands and spans over a continuum of wavelengths measuring either the spectral radiance L λ or the spectral irradiance E λ (Figure A1c, lower graph). The index “λ” stands for wavelength. There is no strict lower boundary of the number of bands; however, this is usually several tens of bands or more than 100. A spectrum should be provided in SI (Système International) units W/m2·nm, ideally re-sampled to 1-nm steps. However, biologists (e.g., in PAR) sometimes use units based on photon numbers: n p h o t o n s / s · m 2 n m (again using both mol and Einstein).

Appendix A.4. Conversion between Units

Appendix A.4.1. Conversion between Different Geometries

It is extremely difficult to estimate an irradiance from a radiance measurement, or to convert from scalar to vector irradiance or horizontal irradiance to vertical irradiance and vice versa, unless a very simple geometry is used or full knowledge about the geometry exists (this means the full spatial light distribution). It makes a difference if an irradiance is created by the moon, a starry sky, a point source radiating isotropically in all directions (approximated by a light bulb), or a modern LED streetlight with complex optics.
For example, taking the sky geometry shown in Figure A1a, it is obvious that irradiance and zenith radiance are not necessarily interlinked. An arbitrary sky radiance distribution could be present (i.e., when the moon and clouds are up in the night sky). However, when assuming a spatially isotropic luminance across the sky, the illuminance can be estimated by E v , h o r i z o n t a l π × L v , z e n i t h .     Please be careful, as this gives only an approximate measure and is not generally applicable, as discussed in Reference [177].

Appendix A.4.2. Conversion of Photon Flux to Radiant Flux

Sometimes it is necessary to convert from photon flux ϕ p h o t (in photons/s) to radiant flux ϕ e (in W). A single photon carries the energy E p h o t o n , λ = h × ν = h × c / λ , where λ is the wavelength, ν is the frequency, c = 2.998   × 10 8 m / s the speed of light, and h =   6.626 × 10 34 J · s   is Planck’s constant. With the photon energy at a specific wavelength, one can convert using ϕ e , λ =   ϕ p h o t o n , λ × E p h o t o n , λ .

Appendix A.4.3. Conversion between Spectral Bands

Conversion between spectral bands (for example, from luminance to PAR radiance) is not straightforward and only possible if the spectrum of the light and the sensors spectral sensitivity are known. However, an approximation is sometimes possible for common situations like (clear sky) daylight or for commonly used light sources. Some look-up tables for such simple conversions were produced in the past [175].
If the spectral irradiance E λ is measured, it is possible to calculate the irradiance in other spectral bands using a weighted integral. We show this using the example of radiometric irradiance and photometric illuminance as follows:
E v , h o r i z o n t a l = 683 l m 380 n m 760 n m E e ( λ ) V ( λ ) d λ ,
where E e ( λ ) is the spectral irradiance, and V ( λ ) is the luminous efficiency function (normalized to 1). The photopic curve is shown in Figure A2 as an orange solid line. The constant of 683 lm stems from the conversion at the peak of V ( λ ) at 555 nm. The integral can be simplified to a summation problem when working in discrete bands as follows:
E v = 683 l m 380 n m 760 n m E e ( λ ) V ( λ ) Δ λ .
This can be solved with a spreadsheet program; however, care has to be taken with the quantization. It is recommended to use bins of 1 nm [171,172].
For a single wavelength, it simplifies to the following equation:
E v , λ 1 = 683 l m × E e ( λ 1 ) × V ( λ 1 ) .
This scheme can be applied to other photoreceptors, for example, those shown in Figure A2 for humans; however, it can also be applied to animals, if the spectral sensitivity is known. A nice example is the use of “melanopic lux” as proposed by Reference [172], which also provided a nice toolbox for conversion.
Figure A2. Normalized spectral sensitivity for different photoreceptors in humans, as well as the photopic curve.
Sustainability 11 06400 g0a2

Appendix A.4.4. Example: Converting Photon Flux per Unit Area to Illuminance

As an example, we use the extremely low threshold for melatonin suppression in humans due to monochromatic light found by Reference [132]. They provide a photon flux per unit area of “10 log photons/cm2·s”, which is 10 10 p h o t / c m 2 · s = 10 14 p h o t / m 2 · s . At the wavelength of 460 nm, the photon energy is as follows:
E p h o t , 460 n m = h × c 460 n m = 6.626 × 10 34 J · s × 2.998 × 10 8 m 460 × 10 9 m · s 4.3 × 10 19 J .
Then, the irradiance is as follows:
E e , 460 n m = 10 14 × 4.3 × 10 19 J m s = 4.3 × 10 5 W / m 2 .
Using the normalized photopic conversion factor at 460 nm, V ( λ ) 460 n m is 0.06, which results in an overall conversion factor of 41 lm/W. Thus, the illuminance produced by this amount of monochromatic light at 460 nm is as follows:
E v , 460 n m = 683 l m × V ( λ ) × E e , 460 n m = 41 l m / W × 4.3 × 10 5 W / m 2 176 × 10 5 l m / m 2 .
This is 0.00176 lx or about 2 mlx. This low illuminance suggests that it is about starlight level illuminance. However, we want to point out that starlight is very broadband. This means, for a photopic illuminance of 2 mlx “white” starlight, the photon flux per unit area at the maximum of the melanopsin absorption curve at 460 nm will be much lower than for the monochromatic light used by [132].

Appendix A.5. Recommendations: What to Measure and How

For experiments on ALAN in the context of melatonin, we recommend measuring vector irradiance: horizontal irradiance for animals in captivity and for outdoor experiments with animals. For human studies, either vertical or horizontal irradiance should be measured depending on the position of the visual system of the study objects. In general, a radiance measurement should be avoided, as radiance is not very relevant for non-image-forming detection, which is mostly relevant for melatonin suppression.
We further recommend obtaining spectral information to allow a conversion to photopic units, but also other measures like “melanopic lux” in the case of humans, or a tailored measure for photoreceptors of specific species. In the context of outdoor experiments with animals, it is also recommended to measure radiation outside of the visual band i.e., UV and near-infrared.
Combining the two recommendations above, we recommend measuring the spectral irradiance in the relevant plane using either a reflectance standard or a cosine corrector. The spectroradiometer should be sensitive enough to measure low light levels and cover ideally a wavelength range between 300 and 900 nm (see Reference [25] for such a set-up). Also, non-SI units should be avoided.

Appendix A6. Light Propagation in a Medium (Mainly Relevant for Water in the Context of This Paper)

In a medium like air or water, the main optical processes relevant for the topic of ALAN are absorption, emission, and scattering. While for the topic of this paper these effects can be ignored for light propagation in air, they are important for aquatic animals living in different water bodies. Simplified, absorption is the annihilation of a photon, emission is the creation of a photon, and scattering is the change of a photon’s original propagation direction in a bulk medium. At boundaries, such as, for example, the water–air interface, the light changes direction by refraction (following Snell’s law) or reflection (following the Fresnel equations). As the latter depends on the polarization of light, light propagating from air into water or light that is reflected from water usually has a higher degree of polarization than light that did not experience such a boundary. The interplay between the spectrum of incident light, absorption, and scattering defines the spectrum of the light at a specific depth in the water. Absorption and scattering depend on the optical properties of the water itself, but also on constituents such as, for example, colored dissolved organic matter (absorbing short-wavelength light) or phytoplankton (absorbing specific wavelengths, depending on their pigment composition). The optical properties of open ocean waters, coastal waters, and inland waters differ and, therefore, different spectral components of light reach the species of interest. Figure A3 shows the euphotic depth for (a) the ocean and (b) different types of inland waters. Euphotic depth z e u , λ = l n ( 100 ) k d , λ , where k d , λ is the diffuse spectral attenuation coefficient, is the depth where the light is attenuated to 1% of the surface light level. For an introductory overview of light in water, we recommend Reference [178].
Figure A3. Euphotic depth for different wavelengths for (a) clear ocean water and (b) different types of coastal or inland waters (after Reference [179]).
Sustainability 11 06400 g0a3

References

  1. Navara, K.J.; Nelson, R.J. The dark side of light at night: Physiological, epidemiological, and ecological consequences. J. Pineal Res. 2007, 43, 215–224. [Google Scholar] [CrossRef]
  2. Lerner, A.B.; Case, J.D.; Takahashi, Y.; Lee, T.H.; Mori, N.; Hass, R.; Lerner, A.B.; Case, J.D.; Lee, T.H.; Mori, W.; et al. Isolation of melatonin, the pineal gland factor that lightens melanocytes. J. Am. Chem. Soc. 1958, 80, 2587. [Google Scholar] [CrossRef]
  3. Vivien-Roels, B.; Pévet, P. Melatonin: Presence and formation in invertebrates. Experientia 1993, 49, 642–647. [Google Scholar] [CrossRef]
  4. Tal, O.; Haim, A.; Harel, O.; Gerchman, Y. Melatonin as an antioxidant and its semi-lunar rhythm in green macroalga Ulva sp. J. Exp. Bot. 2011, 62, 1903–1910. [Google Scholar] [CrossRef] [PubMed]
  5. Zhao, D.; Yu, Y.; Shen, Y.; Liu, Q.; Zhao, Z.; Sharma, R.; Reiter, R.J. Melatonin synthesis and function: Evolutionary history in animals and plants. Front. Endocrinol. 2019, 10, 249. [Google Scholar] [CrossRef] [PubMed]
  6. Tan, D.-X.; Hardeland, R.; Manchester, L.C.; Paredes, S.D.; Korkmaz, A.; Sainz, R.M.; Mayo, J.C.; Fuentes-Broto, L.; Reiter, R.J. The changing biological roles of melatonin during evolution: From an antioxidant to signals of darkness, sexual selection and fitness. Biol. Rev. 2010, 85, 607–623. [Google Scholar] [CrossRef] [PubMed]
  7. Lewy, A.J.; Wehr, T.A.; Goodwin, F.K.; Newsome, D.A.; Markey, S.P. Light suppresses melatonin secretion in humans. Science 1980, 210, 1267–1269. [Google Scholar] [CrossRef] [PubMed]
  8. Aschoff, J. Exogenous and endogenous components in circadian rhythms. Cold Spring Harb. Symp. Quant. Biol. 1960, 25, 11–28. [Google Scholar] [CrossRef] [PubMed]
  9. Roenneberg, T.; Foster, R.G. Twilight times: Light and the circadian system. Photochem. Photobiol. 1997, 66, 549–561. [Google Scholar] [CrossRef]
  10. Falcón, J.; Besseau, L.; Fuentès, M.; Sauzet, S.; Magnanou, E.; Boeuf, G. Structural and functional evolution of the pineal melatonin system in vertebrates. Ann. N. Y. Acad. Sci. 2009, 1163, 101–111. [Google Scholar] [CrossRef]
  11. Vivid, D.; Bentley, G.E. Seasonal reproduction in vertebrates: Melatonin synthesis, binding, and functionality using tinbergen’s four questions. Molecules 2018, 23, 652. [Google Scholar] [CrossRef] [PubMed]
  12. Gern, W.A.; Duvall, D.; Nervina, J.M. Melatonin: A discussion of its evolution and actions in vertebrates. Am. Zool. 1986, 26, 985–996. [Google Scholar] [CrossRef]
  13. Wiechmann, A.F.; Sherry, D.M. Role of melatonin and its receptors in the vertebrate retina. Int. Rev. Cell Mol. Biol. 2013, 300, 211–242. [Google Scholar] [PubMed]
  14. Gaston, K.J.; Visser, M.E.; Hölker, F. The biological impacts of artificial light at night: The research challenge. Phil. Trans. R. Soc. B 2015, 370, 20140133. [Google Scholar] [CrossRef] [PubMed]
  15. De Jong, M.; Jeninga, L.; Ouyang, J.Q.; van Oers, K.; Spoelstra, K.; Visser, M.E. Dose-dependent responses of avian daily rhythms to artificial light at night. Physiol. Behav. 2016, 155, 172–179. [Google Scholar] [CrossRef] [PubMed]
  16. Kayumov, L.; Casper, R.F.; Hawa, R.J.; Perelman, B.; Chung, S.A.; Sokalsky, S.; Shapiro, C.M. Blocking low-wavelength light prevents nocturnal melatonin suppression with no adverse effect on performance during simulated shift work. J. Clin. Endocrinol. Metab. 2005, 90, 2755–2761. [Google Scholar] [CrossRef]
  17. Kyba, C.C.M.; Kuester, T.; de Miguel, A.S.; Baugh, K.; Jechow, A.; Hölker, F.; Bennie, J.; Elvidge, C.D.; Gaston, K.J.; Guanter, L. Artificially lit surface of Earth at night increasing in radiance and extent. Sci. Adv. 2017, 3, e1701528. [Google Scholar] [CrossRef]
  18. Berson, D.M.; Dunn, F.A.; Takao, M. Phototransduction by retinal ganglion cells that set the circadian clock. Science 2002, 295, 1070–1073. [Google Scholar] [CrossRef]
  19. Takahashi, J.S.; DeCoursey, P.J.; Bauman, L.; Menaker, M. Spectral sensitivity of a novel photoreceptive system mediating entrainment of mammalian circadian rhythms. Nature 1984, 308, 186–188. [Google Scholar] [CrossRef]
  20. Barbier, D. The airglow. Vistas Astron. 1956, 2, 929–939. [Google Scholar] [CrossRef]
  21. Brown, D.R. Natural Illumination Charts: Research and Development Project NS 714-100; Deparment of the Navy, Bureau of Ships: Washington, DC, USA, 1952. [Google Scholar]
  22. Kyba, C.C.M.; Mohar, A.; Posch, T. How bright is moonlight? Astron. Geophys. 2017, 58, 31–32. [Google Scholar] [CrossRef]
  23. Hänel, A.; Posch, T.; Ribas, S.J.; Aubé, M.; Duriscoe, D.; Jechow, A.; Kollath, Z.; Lolkema, D.E.; Moore, C.; Schmidt, N.; et al. Measuring night sky brightness: Methods and challenges. J. Quant. Spectrosc. Radiat. Transf. 2018, 205, 278–290. [Google Scholar] [CrossRef]
  24. Jechow, A.; Hölker, F. Snowglow—The amplification of skyglow by snow and clouds can exceed full moon illuminance in suburban areas. J. Imaging 2019, 5, 69. [Google Scholar] [CrossRef]
  25. Spitschan, M.; Aguirre, G.K.; Brainard, D.H.; Sweeney, A.M. Variation of outdoor illumination as a function of solar elevation and light pollution. Sci. Rep. 2016, 6, 26756. [Google Scholar] [CrossRef] [PubMed]
  26. Lythgoe, J.N. The Ecology of Vision, 1st ed.; Clarendon Press: Oxford, UK, 1979; ISBN 978-0-19-854529-3. [Google Scholar]
  27. Riegel, K.W. Light Pollution: Outdoor lighting is a growing threat to astronomy. Science 1973, 179, 1285–1291. [Google Scholar] [CrossRef] [PubMed]
  28. Schroer, S.; Hölker, F. Impact of lighting on flora and fauna. In Handbook of Advanced Lighting Technology; Karlicek, R., Sun, C.-C., Zissis, G., Ma, R., Eds.; Springer International Publishing: Cham, Switzerland, 2016; pp. 1–33. ISBN 978-3-319-00295-8. [Google Scholar]
  29. Cho, Y.; Ryu, S.-H.; Lee, B.R.; Kim, K.H.; Lee, E.; Choi, J. Effects of artificial light at night on human health: A literature review of observational and experimental studies applied to exposure assessment. Chronobiol. Int. 2015, 32, 1294–1310. [Google Scholar] [CrossRef] [PubMed]
  30. Longcore, T.; Rich, C. Ecological light pollution. Front. Ecol. Environ. 2004, 2, 191–198. [Google Scholar] [CrossRef]
  31. Hölker, F.; Wolter, C.; Perkin, E.K.; Tockner, K. Light pollution as a biodiversity threat. Trends Ecol. Evol. 2010, 25, 681–682. [Google Scholar] [CrossRef]
  32. Hölker, F.; Wurzbacher, C.; Weißenborn, C.; Monaghan, M.T.; Holzhauer, S.I.J.; Premke, K. Microbial diversity and community respiration in freshwater sediments influenced by artificial light at night. Phil. Trans. R. Soc. B 2015, 370, 20140130. [Google Scholar] [CrossRef]
  33. Knop, E.; Zoller, L.; Ryser, R.; Gerpe, C.; Hörler, M.; Fontaine, C. Artificial light at night as a new threat to pollination. Nature 2017, 548, 206–209. [Google Scholar] [CrossRef]
  34. Kurvers, R.H.J.M.; Drägestein, J.; Hölker, F.; Jechow, A.; Krause, J.; Bierbach, D. Artificial light at night affects emergence from a refuge and space use in guppies. Sci. Rep. 2018, 8, 1–10. [Google Scholar] [CrossRef] [PubMed] [Green Version]
  35. Hölker, F.; Moss, T.; Griefahn, B.; Kloas, W.; Voigt, C.; Henckel, D.; Hänel, A.; Kappeler, P.; Völker, S.; Schwope, A.; et al. The dark side of light: A transdisciplinary research agenda for light pollution policy. Ecol. Soc. 2010, 15. [Google Scholar] [CrossRef]
  36. Kyba, C.C.M.; Hänel, A.; Hölker, F. Redefining efficiency for outdoor lighting. Energy Environ. Sci. 2014, 7, 1806–1809. [Google Scholar] [CrossRef]
  37. Rosebrugh, D.W. Sky-glow from large cities. JR Astron. Soc. Can. 1935, 29, 79. [Google Scholar]
  38. Falchi, F.; Cinzano, P.; Duriscoe, D.; Kyba, C.C.M.; Elvidge, C.D.; Baugh, K.; Portnov, B.A.; Rybnikova, N.A.; Furgoni, R. The new world atlas of artificial night sky brightness. Sci. Adv. 2016, 2, e1600377. [Google Scholar] [CrossRef] [PubMed] [Green Version]
  39. Jechow, A.; Kolláth, Z.; Ribas, S.J.; Spoelstra, H.; Hölker, F.; Kyba, C.C.M. Imaging and mapping the impact of clouds on skyglow with all-sky photometry. Sci. Rep. 2017, 7, 6741. [Google Scholar] [CrossRef] [PubMed]
  40. Menaker, M.; Moreira, L.F.; Tosini, G. Evolution of circadian organization in vertebrates. Braz. J. Med. Biol. Res. 1997, 30, 305–313. [Google Scholar] [CrossRef] [Green Version]
  41. Doyle, S.; Menaker, M. Circadian photoreception in vertebrates. Cold Spring Harb. Symp. Quant. Biol. 2007, 72, 499–508. [Google Scholar] [CrossRef] [Green Version]
  42. Pérez, J.H.; Tolla, E.; Dunn, I.C.; Meddle, S.L.; Stevenson, T.J. A comparative perspective on extra-retinal photoreception. Trends Endocrinol. Metab. 2019, 30, 39–53. [Google Scholar] [CrossRef] [Green Version]
  43. Peirson, S.N.; Halford, S.; Foster, R.G. The evolution of irradiance detection: Melanopsin and the non-visual opsins. Phil. Trans. R. Soc. B 2009, 364, 2849–2865. [Google Scholar] [CrossRef] [Green Version]
  44. Korf, H.W.; Schomerus, C.; Stehle, J.H. The pineal organ, its hormone melatonin, and the photoneuroendocrine system. Adv. Anat. Embryol. Cell Biol. 1998, 146, 1–100. [Google Scholar] [PubMed]
  45. Dodt, E.; Meissl, H. The pineal and parietal organs of lower vertebrates. Experientia 1982, 38, 996–1000. [Google Scholar] [CrossRef] [PubMed]
  46. Ganong, W.F.; Shepherd, M.D.; Wall, J.R.; Van Brunt, E.E.; Clegg, M.T. Penetration of light into the brain of mammals. Endocrinology 1963, 72, 962–963. [Google Scholar] [CrossRef] [PubMed]
  47. Hartwig, H.G.; van Veen, T. Spectral characteristics of visible radiation penetrating into the brain and stimulating extraretinal photoreceptors. J. Comp. Physiol. 1979, 130, 277–282. [Google Scholar] [CrossRef]
  48. Dodt, E. The parietal eye (pineal and parietal organs) of lower vertebrates. In Visual Centers in the Brain; Handbook of Sensory Physiology; Berlucchi, G., Brindley, G.S., Brooks, B., Creutzfeldt, O.D., Dodt, E., Doty, R.W., Freund, H.-J., Gross, C.G., Jeffreys, D.A., Eds.; Springer: Berlin/Heidelberg, Germany, 1973; pp. 113–140. ISBN 978-3-642-65495-4. [Google Scholar]
  49. Klein, D.C.; Coon, S.L.; Roseboom, P.H.; Weller, J.L.; Bernard, M.; Gastel, J.A.; Zatz, M.; Iuvone, P.M.; Rodriguez, I.R.; Bégay, V.; et al. The melatonin rhythm-generating enzyme: Molecular regulation of serotonin N-acetyltransferase in the pineal gland. Recent Prog. Horm. Res. 1997, 52, 307–357. [Google Scholar] [PubMed]
  50. Falcón, J.; Migaud, H.; Muñoz-Cueto, J.A.; Carrillo, M. Current knowledge on the melatonin system in teleost fish. Gen. Comp. Endocr. 2010, 165, 469–482. [Google Scholar] [CrossRef] [Green Version]
  51. Erren, T.C.; Erren, M.; Lerchl, A.; Meyer-Rochow, V.B. Clockwork blue: On the evolution of non-image-forming retinal photoreceptors in marine and terrestrial vertebrates. Naturwissenschaften 2008, 95, 273–279. [Google Scholar] [CrossRef]
  52. Walmsley, L.; Hanna, L.; Mouland, J.; Martial, F.; West, A.; Smedley, A.R.; Bechtold, D.A.; Webb, A.R.; Lucas, R.J.; Brown, T.M. Colour as a signal for entraining the mammalian circadian clock. PLoS Biol. 2015, 13, e1002127. [Google Scholar] [CrossRef]
  53. Moher, D.; Liberati, A.; Tetzlaff, J.; Altman, D.G.; PRISMA Group. Preferred reporting items for systematic reviews and meta-analyses: The PRISMA statement. PLoS Med. 2009, 6, e1000097. [Google Scholar] [CrossRef] [Green Version]
  54. Vera, L.M.; López-Olmeda, J.F.; Bayarri, M.J.; Madrid, J.A.; Sánchez-Vázquez, F.J. Influence of light intensity on plasma melatonin and locomotor activity rhythms in tench. Chronobiol. Int. 2005, 22, 67–78. [Google Scholar] [CrossRef]
  55. Nikaido, Y.; Ueda, S.; Takemura, A. Photic and circadian regulation of melatonin production in the Mozambique tilapia Oreochromis mossambicus. Comp. Biochem Physiol. A Mol. Integr. Physiol. 2009, 152, 77–82. [Google Scholar] [CrossRef] [PubMed]
  56. Choi, J.Y.; Kim, N.N.; Choi, Y.-U.; Choi, C.Y. Changes in circadian parameters of humbug damselfish, Dascyllus aruanus according to lunar phase shifts in Micronesia. Biol. Rhythm Res. 2017, 48, 475–483. [Google Scholar] [CrossRef]
  57. Rahman, M.S.; Kim, B.H.; Takemura, A.; Park, C.B.; Lee, Y.D. Effects of moonlight exposure on plasma melatonin rhythms in the seagrass rabbitfish, Siganus canaliculatus. J. Biol. Rhythms 2004, 19, 325–334. [Google Scholar] [CrossRef] [PubMed]
  58. Rahman, M.S.; Kim, B.-H.; Takemura, A.; Park, C.-B.; Lee, Y.-D. Influence of light–dark and lunar cycles on the ocular melatonin rhythms in the seagrass rabbitfish, a lunar-synchronized spawner. J. Pineal Res. 2004, 37, 122–128. [Google Scholar] [CrossRef]
  59. Liu, Q.; Manning, A.J.; Duston, J. Light intensity and suppression of nocturnal plasma melatonin in Arctic charr (Salvelinus alpinus). Comp. Biochem Physiol. A Mol. Integr. Physiol. 2019, 228, 103–106. [Google Scholar] [CrossRef]
  60. Park, Y.J.; Park, J.G.; Takeuchi, Y.; Hur, S.P.; Lee, Y.D.; Kim, S.J.; Takemura, A. Influence of moonlight on mRNA expression patterns of melatonin receptor subtypes in the pineal organ of a tropical fish. Mar. Genom. 2014, 14, 67–70. [Google Scholar] [CrossRef]
  61. Porter, M.J.R.; Duncan, N.J.; Handeland, S.O.; Stefansson, S.O.; Bromage, N.R. Temperature, light intensity and plasma melatonin levels in juvenile Atlantic salmon. J. Fish. Biol. 2001, 58, 431–438. [Google Scholar] [CrossRef]
  62. Bayarri, M.J.; Madrid, J.A.; Sánchez-Vázquez, F.J. Influence of light intensity, spectrum and orientaion on sea bass plasma and ocular melatonin. J. Pineal Res. 2002, 32, 34–40. [Google Scholar] [CrossRef]
  63. Brüning, A.; Kloas, W.; Preuer, T.; Hölker, F. Influence of artificially induced light pollution on the hormone system of two common fish species, perch and roach, in a rural habitat. Conserv. Physiol. 2018, 6, coy016. [Google Scholar] [CrossRef]
  64. Brüning, A.; Hölker, F.; Franke, S.; Preuer, T.; Kloas, W. Spotlight on fish: Light pollution affects circadian rhythms of European perch but does not cause stress. Sci. Tot. Environ. 2015, 511, 516–522. [Google Scholar] [CrossRef]
  65. Brüning, A.; Hölker, F.; Franke, S.; Kleiner, W.; Kloas, W. Influence of light intensity and spectral composition of artificial light at night on melatonin rhythm and mRNA expression of gonadotropins in roach Rutilus rutilus. Fish. Physiol. Biochem. 2018, 44, 1–12. [Google Scholar] [CrossRef] [PubMed]
  66. Kupprat, F.; Hölker, F.; Kloas, W. Can skyglow reduce nocturnal melatonin concentrations in European perch? Environ. Pollut. under review.
  67. Brüning, A.; Hölker, F.; Franke, S.; Kleiner, W.; Kloas, W. Impact of different colours of artificial light at night on melatonin rhythm and gene expression of gonadotropins in European perch. Sci. Tot. Environ. 2016, 543, 214–222. [Google Scholar] [CrossRef] [PubMed]
  68. Kashiwagi, T.; Park, Y.J.; Park, J.G.; Imamura, S.; Takeuchi, Y.; Hur, S.P.; Takemura, A. Moonlight affects mRNA abundance of arylalkylamine N-acetyltransferase in the retina of a lunar-synchronized spawner, the goldlined spinefoot. J. Exp. Zool. A Ecol. Genet. Physiol. 2013, 319, 505–516. [Google Scholar] [PubMed]
  69. Iigo, M.; Sato, M.; Ikeda, E.; Kawasaki, S.; Noguchi, F.; Nishi, G. Effects of photic environment on ocular melatonin contents in a labrid teleost, the wrasse Halichoeres tenuispinnis. Gen. Comp. Endocrinol. 2003, 133, 252–259. [Google Scholar] [CrossRef]
  70. Rich, C.; Longcore, T. (Eds.) Ecological Consequences of Artificial Night Lighting; Island Press: Washington, DC, USA, 2006. [Google Scholar]
  71. Wise, S. Studying the ecological impacts of light pollution on wildlife: Amphibians as models. In Starlight: A Common Heritage; Cipriano, M., Jafar, J., Eds.; Cambridge University Press: Cambridge, UK, 2007; pp. 209–218. [Google Scholar]
  72. Perry, G.; Buchanan, B.W.; Fisher, R.N.; Salmon, M.; Wise, S.E. Effects of artificial night lighting on amphibians and reptiles in urban environments. In Urban Herpetology; Mitchell, J.C., Brown, R.E.J., Eds.; Society for the study of Amphibians and Reptiles: Salt Lake City, UT, USA, 2008. [Google Scholar]
  73. Dananay, K.L.; Benard, M.F. Artificial light at night decreases metamorphic duration and juvenile growth in a widespread amphibian. Proc. R. Soc. B. 2018, 285. [Google Scholar] [CrossRef]
  74. Touzot, M.; Teulier, L.; Lengagne, T.; Secondi, J.; Théry, M.; Libourel, P.-A.; Guillard, L.; Mondy, N. Artificial light at night disturbs the activity and energy allocation of the common toad during the breeding period. Conserv. Physiol. 2019, 7. [Google Scholar] [CrossRef]
  75. Dias, K.S.; Dosso, E.S.; Hall, A.S.; Schuch, A.P.; Tozetti, A.M. Ecological light pollution affects anuran calling season, daily calling period, and sensitivity to light in natural Brazilian wetlands. Sci. Nat. 2019, 106, 46. [Google Scholar] [CrossRef]
  76. Underhill, V.A.; Höbel, G. Mate choice behavior of female Eastern Gray Treefrogs (Hyla versicolor) is robust to anthropogenic light pollution. Ethology 2018, 124, 537–548. [Google Scholar] [CrossRef]
  77. Wright, M.L.; Bruni, N.K. Influence of the photocycle and thermocycle on rhythms of plasma thyroxine and plasma and ocular melatonin in late metamorphic stages of the bullfrog tadpole, Rana catesbeiana. Comp. Biochem. Physiol. A Mol. Integr. Physiol. 2004, 139, 33–40. [Google Scholar] [CrossRef]
  78. Wright, M.L.; Duffy, J.L.; Guertin, C.J.; Alves, C.D.; Szatkowski, M.C.; Visconti, R.F. Developmental and diel changes in plasma thyroxine and plasma and ocular melatonin in the larval and juvenile bullfrog, Rana catesbeiana. Gen. Comp. Endocrinol. 2003, 130, 120–128. [Google Scholar] [CrossRef]
  79. Wright, M.L.; Francisco, L.L.; Scott, J.L.; Richardson, S.E.; Carr, J.A.; King, A.B.; Noyes, A.G.; Visconti, R.F. Effects of bilateral and unilateral ophthalmectomy on plasma melatonin in Rana tadpoles and froglets under various experimental conditions. Gen. Comp. Endocrinol. 2006, 147, 158–166. [Google Scholar] [CrossRef] [PubMed]
  80. Vanecek, J. Cellular mechanisms of melatonin action. Physiol. Rev. 1998, 78, 687–721. [Google Scholar] [CrossRef] [PubMed]
  81. Binkley, S.; Mosher, K.; Rubin, F.; White, B. Xenopus tadpole melanophores are controlled by dark and light and melatonin without influence of time of day. J. Pineal Res. 1988, 5, 87–97. [Google Scholar] [CrossRef]
  82. Lee, J.H.; Hung, C.F.; Ho, C.C.; Chang, S.H.; Lai, Y.S.; Chung, J.G. Light-induced changes in frog pineal gland N-acetyltransferase activity. Neurochem. Int. 1997, 31, 533–540. [Google Scholar] [CrossRef]
  83. Green, C.B.; Liang, M.Y.; Steenhard, B.M.; Besharse, J.C. Ontogeny of circadian and light regulation of melatonin release in Xenopus laevis embryos. Brain Res. Dev. Brain Res. 1999, 117, 109–116. [Google Scholar] [CrossRef]
  84. Foster, R.G.; Roberts, A. The pineal eye in Xenopus laevis embryos and larvae: A photoreceptor with a direct excitatory effect on behaviour. J. Comp. Physiol. 1982, 145, 413–419. [Google Scholar] [CrossRef]
  85. Loew, E.R.; Lythgoe, J.N. The ecology of colour vision. Endeavour 1985, 9, 170–174. [Google Scholar] [CrossRef]
  86. Cahill, G.M.; Parsons, S.E.; Besharse, J.C. Spectral sensitivity of melatonin synthesis suppression in Xenopus eyecups. Vis. Neurosci. 1998, 15, 499–502. [Google Scholar] [CrossRef]
  87. Firth, B.T.; Christian, K.A.; Belan, I.; Kennaway, D.J. Melatonin rhythms in the Australian freshwater crocodile (Crocodylus johnstoni): A reptile lacking a pineal complex? J. Comp. Physiol. B Biochem. Syst. Environ. Physiol. 2010, 180, 67–72. [Google Scholar] [CrossRef]
  88. Roth, J.J.; Gern, W.A.; Roth, E.C.; Ralph, C.L.; Jacobson, E. Nonpineal melatonin in the alligator (Alligator mississippiensis). Science 1980, 210, 548–550. [Google Scholar] [CrossRef] [PubMed]
  89. Bertolucci, C.; Frigato, E.; Foà, A. The reptilian clock system: Circadian clock, extraretinal photoreception, and clock-dependent celestial compass orientation mechanisms in reptiles. In Biological Timekeeping: Clocks, Rhythms and Behaviour; Springer: New Delhi, India, 2017; pp. 223–239. [Google Scholar]
  90. Underwood, H. Pineal melatonin rhythms in the lizard Anolis carolinensis: Effects of light and temperature cycles. J. Comp. Physiol. A Sens Neural Behav. Physiol. 1985, 157, 57–65. [Google Scholar] [CrossRef] [PubMed]
  91. Hyde, L.L.; Underwood, H. Effects of nightbreak, T-cycle, and resonance lighting schedules on the pineal melatonin rhythm of the lizard Anolis carolinensis: Correlations with the reproductive response. J. Pineal Res. 1993, 15, 70–80. [Google Scholar] [CrossRef] [PubMed]
  92. Underwood, H.; Calaban, M. Pineal melatonin rhythms in the lizard Anolis carolinensis: I. Response to light and temperature cycles. J. Biol. Rhythms 1987, 2, 179–193. [Google Scholar] [CrossRef] [PubMed]
  93. Firth, B.T.; Belan, I.; Kennaway, D.J.; Moyer, R.W. Thermocyclic entrainment of lizard blood plasma melatonin rhythms in constant and cyclic photic environments. Am. J. Physiol. 1999, 277, R1620–R1626. [Google Scholar] [CrossRef]
  94. Moore, A.F.; Kawasaki, M.; Menaker, M. Photic induction of locomotor activity is correlated with photic habitat in Anolis lizards. J. Comp. Physiol. A Sens Neural Behav. Physiol. 2012, 198, 193–201. [Google Scholar] [CrossRef]
  95. Vivien-Roels, B.; Pévet, P.; Claustrat, B. Pineal and circulating melatonin rhythms in the box turtle, Terrapene carolina triunguis: Effect of photoperiod, light pulse, and environmental temperature. Gen. Comp. Endocrinol. 1988, 69, 163–173. [Google Scholar] [CrossRef]
  96. Dominoni, D.M.; Goymann, W.; Helm, B.; Partecke, J. Urban-like night illumination reduces melatonin release in European blackbirds (Turdus merula): Implications of city life for biological time-keeping of songbirds. Front. Zool. 2013, 10, 60. [Google Scholar] [CrossRef] [Green Version]
  97. Schoech, S.J.; Bowman, R.; Hahn, T.P.; Goymann, W.; Schwabl, I.; Bridge, E.S. The effects of low levels of light at night upon the endocrine physiology of western scrub-jays (Aphelocoma californica). J. Exp. Zool. A Ecol. Genet. Physiol. 2013, 319, 527–538. [Google Scholar] [CrossRef]
  98. Kumar, J.; Malik, S.; Bhardwaj, S.K.; Rani, S. Bright light at night alters the perception of daylength in Indian weaver bird (Ploceus philippinus). J. Exp. Zool. A Ecol. Integr. Physiol. 2018, 329, 488–496. [Google Scholar] [CrossRef]
  99. Jiang, J.; He, Y.; Kou, H.; Ju, Z.; Gao, X.; Zhao, H. The effects of artificial light at night on Eurasian tree sparrow (Passer montanus): Behavioral rhythm disruption, melatonin suppression and intestinal microbiota alterations. Ecol. Indic. 2020, 108, 105702. [Google Scholar] [CrossRef]
  100. Cockrem, J.F. Circadian rhythms of plasma melatonin in the Adelie penguin (Pygoscelis adeliae) in constant dim light and artificial photoperiods. J. Pineal Res. 1991, 11, 63–69. [Google Scholar] [CrossRef]
  101. Singh, J.; Rani, S.; Kumar, V. Functional similarity in relation to the external environment between circadian behavioral and melatonin rhythms in the subtropical Indian weaver bird. Horm. Behav. 2012, 61, 527–534. [Google Scholar] [CrossRef] [PubMed]
  102. Vakkuri, O.; Rintamäki, H.; Leppäluoto, J. Plasma and tissue concentrations of melatonin after midnight light exposure and pinealectomy in the pigeon. J. Endocrinol. 1985, 105, 263–268. [Google Scholar] [CrossRef] [PubMed]
  103. Lewis, P.D.; Perry, G.C.; Morris, T.R.; English, J. Supplementary dim light differentially influences sexual maturity, oviposition time, and melatonin rhythms in pullets. Poult. Sci. 2001, 80, 1723–1728. [Google Scholar] [CrossRef] [PubMed] [Green Version]
  104. Meyer, W.E.; Millam, J.R. Plasma melatonin levels in Japanese quail exposed to dim light are determined by subjective interpretation of day and night, not light intensity. Gen. Comp. Endocrinol. 1991, 82, 377–385. [Google Scholar] [CrossRef]
  105. Kennaway, D.J.; Voultsios, A.; Varcoe, T.J.; Moyer, R.W. Melatonin in mice: Rhythms, response to light, adrenergic stimulation, and metabolism. Am. J. Physiol. Regul. Integr. Comp. Physiol. 2002, 282, R358–R365. [Google Scholar] [CrossRef] [Green Version]
  106. Dauchy, R.T.; Wren, M.A.; Dauchy, E.M.; Hoffman, A.E.; Hanifin, J.P.; Warfield, B.; Jablonski, M.R.; Brainard, G.C.; Hill, S.M.; Mao, L.; et al. The influence of red light exposure at night on circadian metabolism and physiology in Sprague-Dawley rats. J. Am. Assoc. Lab. Anim. Sci. 2015, 54, 40–50. [Google Scholar]
  107. Travlos, G.S.; Wilson, R.E.; Murrell, J.A.; Chignell, C.F.; Boorman, G.A. The effect of short intermittent light exposures on the melatonin circadian rhythm and NMU-induced breast cancer in female F344/N rats. Toxicol. Pathol. 2001, 29, 126–136. [Google Scholar] [CrossRef]
  108. Xiang, S.; Dauchy, R.T.; Hauch, A.; Mao, L.; Yuan, L.; Wren, M.A.; Belancio, V.P.; Mondal, D.; Frasch, T.; Blask, D.E.; et al. Doxorubicin resistance in breast cancer is driven by light at night-induced disruption of the circadian melatonin signal. J. Pineal Res. 2015, 59, 60–69. [Google Scholar] [CrossRef] [Green Version]
  109. Glickman, G.L.; Harrison, E.M.; Elliott, J.A.; Gorman, M.R. Increased photic sensitivity for phase resetting but not melatonin suppression in Siberian hamsters under short photoperiods. Horm. Behav. 2014, 65, 301–307. [Google Scholar] [CrossRef] [PubMed] [Green Version]
  110. Hoffmann, K.; Illnerová, H.; Vaněček, J. Effect of photoperiod and of one minute light at night-time on the pineal rhythm on N-acetyltransferase activity in the Djungarian hamster Phodopus sungorus. Biol. Reprod. 1981, 24, 551–556. [Google Scholar] [CrossRef] [PubMed] [Green Version]
  111. Schwimmer, H.; Mursu, N.; Haim, A. Effects of light and melatonin treatment on body temperature and melatonin secretion daily rhythms in a diurnal rodent, the fat sand rat. Chronobiol. Int. 2010, 27, 1401–1419. [Google Scholar] [CrossRef] [PubMed]
  112. Asher, A.; Shabtay, A.; Brosh, A.; Eitam, H.; Agmon, R.; Cohen-Zinder, M.; Zubidat, A.E.; Haim, A. “Chrono-functional milk”: The difference between melatonin concentrations in night-milk versus day-milk under different night illumination conditions. Chronobiol. Int. 2015, 32, 1409–1416. [Google Scholar] [CrossRef] [PubMed]
  113. Deveson, S.L.; Arendt, J.; Forsyth, I.A. Sensitivity of goats to a light pulse during the night as assessed by suppression of melatonin concentrations in the plasma. J. Pineal Res. 1990, 8, 169–177. [Google Scholar] [CrossRef] [PubMed]
  114. Vivien-Roels, B.; Pévet, P.; Zarazaga, L.; Malpaux, B.; Chemineau, P. Daily and light-at-night induced variations of circulating 5-methoxytryptophol (5-ML) in ewes with respectively high and low nocturnal melatonin secretion. J. Pineal Res. 1999, 27, 230–236. [Google Scholar] [CrossRef]
  115. Walsh, C.M.; Prendergast, R.L.; Sheridan, J.T.; Murphy, B.A. Blue light from light-emitting diodes directed at a single eye elicits a dose-dependent suppression of melatonin in horses. Vet. J. 2013, 196, 231–235. [Google Scholar] [CrossRef]
  116. Hoban, T.M.; Lewy, A.J.; Fuller, C.A. Light suppression of melatonin in the squirrel monkey (Saimiri sciureus). J. Pineal Res. 1990, 9, 13–19. [Google Scholar] [CrossRef]
  117. Phillips, A.J.K.; Vidafar, P.; Burns, A.C.; McGlashan, E.M.; Anderson, C.; Rajaratnam, S.M.W.; Lockley, S.W.; Cain, S.W. High sensitivity and interindividual variability in the response of the human circadian system to evening light. Proc. Natl. Acad. Sci. USA 2019, 116, 12019–12024. [Google Scholar] [CrossRef] [Green Version]
  118. Le Tallec, T.; Théry, M.; Perret, M. Melatonin concentrations and timing of seasonal reproduction in male mouse lemurs (Microcebus murinus) exposed to light pollution. J. Mammal. 2016, 97, 753–760. [Google Scholar] [CrossRef] [Green Version]
  119. Obayashi, K.; Saeki, K.; Iwamoto, J.; Okamoto, N.; Tomioka, K.; Nezu, S.; Ikada, Y.; Kurumatani, N. Exposure to light at night, nocturnal urinary melatonin excretion, and obesity/dyslipidemia in the elderly: A cross-sectional analysis of the HEIJO-KYO study. J. Clin. Endocrinol. Metab. 2013, 98, 337–344. [Google Scholar] [CrossRef] [PubMed]
  120. Herljevic, M.; Middleton, B.; Thapan, K.; Skene, D.J. Light-induced melatonin suppression: Age-related reduction in response to short wavelength light. Exp. Gerontol. 2005, 40, 237–242. [Google Scholar] [CrossRef] [PubMed] [Green Version]
  121. Bues, M.; Pross, A.; Stefani, O.; Frey, S.; Anders, D.; Späti, J.; Wirz-Justice, A.; Mager, R.; Cajochen, C. LED-backlit computer screens influence our biological clock and keep us more awake. J. Soc. Inf. Disp. 2012, 20, 266. [Google Scholar] [CrossRef]
  122. Chellappa, S.L.; Steiner, R.; Blattner, P.; Oelhafen, P.; Götz, T.; Cajochen, C. Non-visual effects of light on melatonin, alertness and cognitive performance: Can blue-enriched light keep us alert? PLoS ONE 2011, 6, e16429. [Google Scholar] [CrossRef] [PubMed]
  123. Figueiro, M.G.; Bullough, J.D.; Parsons, R.H.; Rea, M.S. Preliminary evidence for spectral opponency in the suppression of melatonin by light in humans. Neuroreport 2004, 15, 313–316. [Google Scholar] [CrossRef] [PubMed]
  124. Hashimoto, S.; Nakamura, K.; Honma, S.; Tokura, H.; Honma, K. Melatonin rhythm is not shifted by lights that suppress nocturnal melatonin in humans under entrainment. Am. J. Physiol. 1996, 270, R1073–R1077. [Google Scholar] [CrossRef]
  125. Heo, J.Y.; Kim, K.; Fava, M.; Mischoulon, D.; Papakostas, G.I.; Kim, M.J.; Kim, D.J.; Chang, K.A.J.; Oh, Y.; Yu, B.H.; et al. Effects of smartphone use with and without blue light at night in healthy adults: A randomized, double-blind, cross-over, placebo-controlled comparison. J. Psychiatr. Res. 2017, 87, 61–70. [Google Scholar] [CrossRef]
  126. Higuchi, S.; Fukuda, T.; Kozaki, T.; Takahashi, M.; Miura, N. Effectiveness of a red-visor cap for preventing light-induced melatonin suppression during simulated night work. J. Physiol. Anthropol. 2011, 30, 251–258. [Google Scholar] [CrossRef] [Green Version]
  127. Kozaki, T.; Koga, S.; Toda, N.; Noguchi, H.; Yasukouchi, A. Effects of short wavelength control in polychromatic light sources on nocturnal melatonin secretion. Neurosci. Lett. 2008, 439, 256–259. [Google Scholar] [CrossRef]
  128. Trinder, J.; Armstrong, S.M.; O’Brien, C.; Luke, D.; Martin, M.J. Inhibition of melatonin secretion onset by low levels of illumination. J. Sleep Res. 1996, 5, 77–82. [Google Scholar] [CrossRef]
  129. Van De Werken, M.; Giménez, M.C.; De Vries, B.; Beersma, D.G.M.; Gordijn, M.C.M. Short-wavelength attenuated polychromatic white light during work at night: Limited melatonin suppression without substantial decline of alertness. Chronobiol. Int. 2013, 30, 843–854. [Google Scholar] [CrossRef] [PubMed] [Green Version]
  130. Figueiro, M.G.; Wood, B.; Plitnick, B.; Rea, M.S. The impact of light from computer monitors on melatonin levels in college students. Neuroendocrinol. Lett. 2011, 32, 158–163. [Google Scholar] [PubMed]
  131. Gooley, J.J.; Chamberlain, K.; Smith, K.A.; Khalsa, S.B.S.; Rajaratnam, S.M.W.; Van Reen, E.; Zeitzer, J.M.; Czeisler, C.A.; Lockley, S.W. Exposure to room light before bedtime suppresses melatonin onset and shortens melatonin duration in humans. J. Clin. Endocrinol. Metab. 2011, 96, E463–E472. [Google Scholar] [CrossRef] [PubMed] [Green Version]
  132. Vartanian, G.V.; Li, B.Y.; Chervenak, A.P.; Walch, O.J.; Pack, W.; Ala-Laurila, P.; Wong, K.Y. Melatonin suppression by light in humans is more sensitive than previously reported. J. Biol. Rhythms 2015, 30, 351–354. [Google Scholar] [CrossRef] [PubMed] [Green Version]
  133. Wood, B.; Rea, M.S.; Plitnick, B.; Figueiro, M.G. Light level and duration of exposure determine the impact of self-luminous tablets on melatonin suppression. Appl. Ergon. 2013, 44, 237–240. [Google Scholar] [CrossRef] [PubMed]
  134. Zeitzer, J.M.; Dijk, D.; Kronauer, R.E.; Brown, E.N.; Czeisler, C.A. Sensitivity of the human circadian pacemaker to nocturnal light: Melatonin phase resetting and suppression. J. Physiol. 2000, 526, 695–702. [Google Scholar] [CrossRef]
  135. Crowley, S.J.; Cain, S.W.; Burns, A.C.; Acebo, C.; Carskadon, M.A. Increased sensitivity of the circadian system to light in early/mid-puberty. J. Clin. Endocrinol. Metab. 2015, 100, 4067–4073. [Google Scholar] [CrossRef]
  136. Nagare, R.; Plitnick, B.; Figueiro, M.G. Effect of exposure duration and light spectra on nighttime melatonin suppression in adolescents and adults. Light Res. Technol 2019, 51, 530–543. [Google Scholar] [CrossRef]
  137. Nagare, R.; Rea, M.S.; Plitnick, B.; Figueiro, M.G. Nocturnal melatonin suppression by adolescents and adults for different levels, spectra, and durations of light exposure. J. Biol. Rhythms 2019, 34, 178–194. [Google Scholar] [CrossRef]
  138. Rüger, M.; Gordijn, M.C.M.; Beersma, D.G.M.; de Vries, B.; Daan, S. Weak relationships between suppression of melatonin and suppression of sleepiness/fatigue in response to light exposure. J. Sleep Res. 2005, 14, 221–227. [Google Scholar] [CrossRef]
  139. Chang, A.-M.; Aeschbach, D.; Duffy, J.F.; Czeisler, C.A. Evening use of light-emitting eReaders negatively affects sleep, circadian timing, and next-morning alertness. Proc. Natl. Acad. Sci. USA 2015, 112, 1232–1237. [Google Scholar] [CrossRef] [PubMed] [Green Version]
  140. Chinoy, E.D.; Duffy, J.F.; Czeisler, C.A. Unrestricted evening use of light-emitting tablet computers delays self-selected bedtime and disrupts circadian timing and alertness. Physiol. Rep. 2018, 6, e13692. [Google Scholar] [CrossRef] [PubMed]
  141. Kraneburg, A.; Franke, S.; Methling, R.; Griefahn, B. Effect of color temperature on melatonin production for illumination of working environments. Appl. Ergon. 2017, 58, 446–453. [Google Scholar] [CrossRef] [PubMed]
  142. Münch, M.; Regente, J.; Bes, F.; De Zeeuw, J.; Hädel, S.; Wahnschaffe, A.; Kunz, D. Blue-enriched morning light as a countermeasure to light at the wrong time: Effects on cognition, sleepiness, sleep, and circadian phase. Neuropsychobiology 2017, 74, 207–218. [Google Scholar] [CrossRef]
  143. Nathan, P.J.; Wyndham, E.L.; Burrows, G.D.; Norman, T.R. The effect of gender on the melatonin suppression by light: A dose response relationship. J. Neural Transm. 2000, 107, 271–279. [Google Scholar] [CrossRef]
  144. Thapan, K.; Arendt, J.; Skene, D.J. An action spectrum for melatonin suppression: Evidence for a novel non-rod, non-cone photoreceptor system in humans. J. Physiol. 2001, 535, 261–267. [Google Scholar] [CrossRef]
  145. McIntyre, I.M.; Norman, T.R.; Burrows, G.D.; Armstrong, S.M. Quantal melatonin suppression by exposure to low intensity light in man. Life Sci. 1989, 45, 327–332. [Google Scholar] [CrossRef]
  146. Souman, J.L.; Borra, T.; de Goijer, I.; Schlangen, L.J.M.; Vlaskamp, B.N.S.; Lucassen, M.P. Spectral tuning of white light allows for strong reduction in melatonin suppression without changing illumination level or color temperature. J. Biol. Rhythms 2018, 33, 420–431. [Google Scholar] [CrossRef]
  147. Wahnschaffe, A.; Haedel, S.; Rodenbeck, A.; Stoll, C.; Rudolph, H.; Kozakov, R.; Schoepp, H.; Kunz, D. Out of the lab and into the bathroom: Evening short-term exposure to conventional light suppresses melatonin and increases alertness perception. Int. J. Mol. Sci. 2013, 14, 2573–2589. [Google Scholar] [CrossRef]
  148. Wright, H.R.; Lack, L.C. Effect of light wavelength on suppression and phase delay of the melatonin rhythm. Chronobiol. Int. 2001, 18, 801–808. [Google Scholar] [CrossRef]
  149. Whitmore, J.N.; French, J.; Fischer, J.R. Psychophysiological effects of a brief nocturnal light exposure. J. Hum. Ergol. 2001, 30, 267–272. [Google Scholar]
  150. Figueiro, M.G.; Rea, M.S.; Bullough, J.D. Circadian effectiveness of two polychromatic lights in suppressing human nocturnal melatonin. Neurosci. Lett. 2006, 406, 293–297. [Google Scholar] [CrossRef] [PubMed]
  151. Nathan, P.J.; Burrows, G.D.; Norman, T.R. The effect of dim light on suppression of nocturnal melatonin in healthy women and men. J. Neural Transm. 1997, 104, 643–648. [Google Scholar] [CrossRef] [PubMed]
  152. Zachmann, A.; Ali, M.A.; Falcón, J. Melatonin and its effects in fishes: An overview. In Rhythms in Fishes; Springer: Boston, MA, USA, 1992; pp. 149–165. [Google Scholar]
  153. Kummu, M.; de Moel, H.; Ward, P.J.; Varis, O. How close do we live to water? A global analysis of population distance to freshwater bodies. PLoS ONE 2011, 6, e20578. [Google Scholar] [CrossRef] [PubMed]
  154. Oliveira, C.; Ortega, A.; López-Olmeda, J.F.; Vera, L.M.; Sánchez-Vázquez, F.J. Influence of constant light and darkness, light intensity, and light spectrum on plasma melatonin rhythms in Senegal sole. Chronobiol. Int. 2007, 24, 615–627. [Google Scholar] [CrossRef]
  155. Takeuchi, Y.; Imamura, S.; Sawada, Y.; Hur, S.P.; Takemura, A. Effects of different colors of light on melatonin suppression and expression analysis of Aanat1 and melanopsin in the eye of a tropical damselfish. Gen. Comp. Endocrinol. 2014, 204, 158–165. [Google Scholar] [CrossRef]
  156. Carazo, I.; Norambuena, F.; Oliveira, C.; Sánchez-Vázquez, F.J.; Duncan, N.J. The effect of night illumination, red and infrared light, on locomotor activity, behaviour and melatonin of Senegalese sole (Solea senegalensis) broodstock. Physiol. Behav. 2013, 118, 201–207. [Google Scholar] [CrossRef]
  157. Oliveira, C.C.V.; Figueiredo, F.; Soares, F.; Pinto, W.; Dinis, M.T. Meagre’s melatonin profiles under captivity: Circadian rhythmicity and light sensitiveness. Fish. Physiol. Biochem. 2018, 44, 885–893. [Google Scholar] [CrossRef]
  158. Zubidat, A.E.; Nelson, R.J.; Haim, A. Spectral and duration sensitivity to light-at-night in ‘blind’ and sighted rodent species. J. Exp. Biol. 2011, 214, 3206–3217. [Google Scholar] [CrossRef] [Green Version]
  159. Dimovski, A.M.; Robert, K.A. Artificial light pollution: Shifting spectral wavelengths to mitigate physiological and health consequences in a nocturnal marsupial mammal. J. Exp. Zool. A Ecol. Integr. Physiol. 2018, 329, 497–505. [Google Scholar] [CrossRef]
  160. Reiter, R.J.; King, T.S.; Richardson, B.A.; Hurlbut, E.C. Studies on pineal melatonin levels in a diurnal species, the Eastern chipmunk (Tamias striatus): Effects of light at night, propranolol administration or superior cervical ganglionectomy. J. Neural Transm. 1982, 54, 275–284. [Google Scholar] [CrossRef] [PubMed]
  161. Reiter, R.J.; Peters, J.F. Non-suppressibility by room light of pineal N-acetyltransferase activity and melatonin levels in two diurnally active rodents, the Mexican ground squirrel (Spermophilus mexicanus) and the eastern chipmunk (Tamias striatus). Endocr. Res. 1984, 10, 113–121. [Google Scholar] [CrossRef] [PubMed]
  162. Reiter, R.J.; Reiter, M.N.; Hattori, A.; Yaga, K.; Herbert, D.C.; Barlow-Walden, L. The pineal melatonin rhythm and its regulation by light in a subterranean rodent, the valley pocket gopher (Thomomys bottae). J. Pineal Res. 1994, 16, 145–153. [Google Scholar] [CrossRef] [PubMed]
  163. Haim, A.; Zubidat, A.E. Artificial light at night: Melatonin as a mediator between the environment and epigenome. Phil. Trans. R. Soc. B 2015, 370, 20140121. [Google Scholar] [CrossRef] [PubMed] [Green Version]
  164. Giudice, A.; Crispo, A.; Grimaldi, M.; Polo, A.; Bimonte, S.; Capunzo, M.; Amore, A.; D’Arena, G.; Cerino, P.; Budillon, A.; et al. The effect of light exposure at night (LAN) on carcinogenesis via decreased nocturnal melatonin synthesis. Molecules 2018, 23, 1308. [Google Scholar] [CrossRef] [PubMed] [Green Version]
  165. Wever, R. A The Circadian System of Man: Results of Experiments Under Temporal Isolation; Springer: New York, NY, USA, 1979. [Google Scholar]
  166. McGlashan, E.M.; Poudel, G.R.; Vidafar, P.; Drummond, S.P.A.; Cain, S.W. Imaging individual differences in the response of the human suprachiasmatic area to light. Front. Neurol. 2018, 9, 1022. [Google Scholar] [CrossRef]
  167. Prayag, A.S.; Najjar, R.P.; Gronfier, C. Melatonin suppression is exquisitely sensitive to light and primarily driven by melanopsin in humans. J. Pineal Res. 2019, 66, e12562. [Google Scholar] [CrossRef]
  168. Oliveira, C.; Duncan, N.J.; Pousão-Ferreira, P.; Mañanós, E.; Sánchez-Vázquez, F.J. Influence of the lunar cycle on plasma melatonin, vitellogenin and sex steroids rhythms in Senegal sole, Solea senegalensis. Aquaculture 2010, 306, 343–347. [Google Scholar] [CrossRef] [Green Version]
  169. Rea, M.; Figueiro, M. Light as a circadian stimulus for architectural lighting. Light Res. Technol. 2018, 50, 497–510. [Google Scholar] [CrossRef]
  170. Raap, T.; Casasole, G.; Costantini, D.; AbdElgawad, H.; Asard, H.; Pinxten, R.; Eens, M. Artificial light at night affects body mass but not oxidative status in free-living nestling songbirds: An experimental study. Sci. Rep. 2016, 6, 35626. [Google Scholar] [CrossRef]
  171. Johnsen, S. The Optics of Life: A Biologist’s Guide to Light in Nature; Princeton University Press: Princeton, NJ, USA, 2012. [Google Scholar]
  172. Lucas, R.J.; Peirson, S.; Berson, D.M.; Brown, T.M.; Cooper, H.M.; Czeisler, C.A.; Figueiro, M.G.; Gamlin, P.D.; Lockley, S.W.; O’Hagan, J.B.; et al. Measuring and using light in the melanopsin age. Trends Neurosci. 2014, 37, 1–9. [Google Scholar] [CrossRef] [PubMed]
  173. Jechow, A.; Hölker, F. How dark is a river? Artificial light at night in aquatic systems and the need for comprehensive night-time light measurements. WIREs Water 2019, e1388. [Google Scholar] [CrossRef] [Green Version]
  174. Smith, R.C.; Wilson, W.H. Photon scalar irradiance. Appl. Opt. 1972, 11, 934–938. [Google Scholar] [CrossRef] [PubMed]
  175. Thimijan, R.; Heins, R. Photometric, radiometric, and quantum light units of measure: A review of procedures for interconversion. Hortscience 1983, 18, 818–822. [Google Scholar]
  176. Jechow, A.; Hölker, F.; Kyba, C.C.M. Using all-sky differential photometry to investigate how nocturnal clouds darken the night sky in rural areas. Sci. Rep. 2019, 9, 1391. [Google Scholar] [CrossRef] [PubMed] [Green Version]
  177. Kocifaj, M.; Posch, T.; Solano Lamphar, H.A. On the relation between zenith sky brightness and horizontal illuminance. Mon. Not. R. Astron. Soc. 2015, 446, 2895–2901. [Google Scholar] [CrossRef]
  178. Mobley, C.D. Light and Water: Radiative Transfer in Natural Waters; Academic Press: San Diego, CA, USA, 1994. [Google Scholar]
  179. Hölker, F.; Jechow, A.; Schroer, S.; Gessner, M.O. Nächtliches Licht und Lichtverschmutzung in und um Gewässer. In Handbuch Angewandte Limnologie: Grundlagen-Gewässerbelastung-Restaurierung-Aquatische Ökotoxikologie-Bewertung-Gewässerschutz; WILEY-VCH Verlag GmbH & Co.: KGaA, Weinheim, 2018; pp. 1–26. ISBN 978-3-527-67848-8. [Google Scholar]
Figure 1. Relative and absolute downwelling spectral irradiance at night (left), during the three twilight phases, and during the day (right) obtained (a) in a rural location (red dot indicates 558 nm), and (b) in the city (red dot indicates 819 nm; red line 570–615 nm). Values in main graphs were normalized to a value of 1 at 555 nm (gray dots), and insets show absolute spectral irradiance. (Adapted from Reference [25] CC BY license (Creative Commons Attribution 4.0 International License))
Sustainability 11 06400 g001
Figure 2. Flow diagram of literature search and identification of studies in humans relevant for this review.
Sustainability 11 06400 g002
Figure 3. Minimum levels reported in the literature to suppress melatonin (MEL) in vertebrate groups relative to light levels by natural and artificial light (ALAN) sources. Left panel: illuminance during day, twilight, and night as a function of elevation angle of sun and moon; the shaded gray bar symbolizes twilight (CT—end of civil twilight, NT—end of nautical twilight, AT—end of astronomical twilight), the light-green bar symbolizes clear sky illuminance, and the black bar symbolizes illuminance during overcast night; yellow solid line—sun illuminance on clear day, yellow dashed line—sun illuminance on cloudy day, gray solid line—moonlight full moon, gray dashed line—moonlight first and last quarter (“half-moon”). Central panel: minimum melatonin suppression levels published in the reviewed studies for different vertebrate groups: fishes, amphibians, reptiles, birds, rodents, ungulates, non-human primates, and humans. Due to the low number of studies (n = 2), the levels reported for non-human primates are not shown. Right panel: typical illuminance levels from ALAN; * indicates minimum level of monochromatic light (460 nm) that suppressed MEL in controlled laboratory conditions [132], ** indicates a significant suppression of MEL at new moon conditions, probably in the range of a few millilux, but light intensities were not measured in this study [55]. Icons were made with Freepik (www.flaticon.com).
Sustainability 11 06400 g003
Figure 4. Relationship between the number of studies identified as relevant for this review (Table 2) and lowest light levels of nocturnal light reported in those studies to suppress melatonin (MEL) for different vertebrate groups; * indicates minimum level of monochromatic light (460 nm) that suppressed MEL in controlled laboratory conditions [132], ** indicates a significant suppression of MEL at new moon conditions, probably in the range of a few millilux, but light intensities were not measured in this study [55]. Icons were made with Freepik (www.flaticon.com).
Sustainability 11 06400 g004
Table 1. Distribution of circadian photoreceptors across vertebrate classes. Modified from Reference [40].
Parapineal OrganPineal OrganDeep-Brain PhotoreceptorsRetina (Including Melanopsin)
Fishes++++
Amphibians++++
Reptiles++++
Birds+++
Mammals+
Table 2. Studies investigating melatonin suppression in vertebrates under typical light pollution scenarios (see text for details). Number of studies identified in the systematic literature search performed separately for vertebrate groups (fishes, amphibians, reptiles, birds, and three separate searches for mammals), and number of studies included in the review based on eligibility criteria.
FishesAmphibiansReptilesBirdsMammals (Rodents and Ungulates)Mammals (Primates)Mammals (Humans)
Number of studies identified in the keyword search in Scopus357 5615155125171145
Number of studies identified in the keyword search in Web of Science367343216913325733
Number of studies included in the review15 001011234
Table 3. Overview of studies on melatonin suppression under artificial light at night (ALAN) in fishes included in the analysis: plasma melatonin at exposure to ALAN with (3A) broad-spectrum white light and (3B) different colors of light; ocular melatonin at exposure to ALAN with (3C) white light and (3D) different colors of light. Percentage changes relative to control levels are reported and depicted with an asterisk when significant. “N/A” indicates that values were not available. M—males, F—females, rel—melatonin relative to baseline value, for details please check original study. Light intensities were reported at the water surface if not stated differently. Dark controls refer to laboratory experiments where no illumination was detected in controls. Only the most relevant effects are reported. Because the complexity of the experimental design can vary depending on the study, we stress the need to check the original study for the exact details.
(3A) Plasma melatonin at exposure to nocturnal white light in fishes
SpeciesTaxonomic familyTemperatureLight intensitiesLight color/light typeControlMethodology and timing of samplingMelatonin levels relative to controlReference
European sea bass
(Dicentrarchus labrax)
Moranidae23 °C1.4 lx (0.6 µW/cm2)
5.7 lx (2.4 µW/cm2)
14.2 lx (6 µW/cm2)
141.8 lx (60 µW/cm2)
WhiteDarkPlasma sample
N/A
−12.5%
−25%
−75% *
−83% *
(Bayarri et al., 2002) [62]
Humbug damselfish
(Dascyllus aruanus)
PomacentridaeN/AFirst-quarter moon
Full moon (0.3 lx)
Last-quarter moon
MoonlightNew moonPlasma sample
N/A
−29% *
−55% *
−35% *
(Choi et al., 2017) [56]
Mozambique tilapia
(Oreochromis mossambicus)
CichlidaeN/ANew moon
Full moon
0.1 lx
1 lx
Moonlight
 
White
DarkPlasma sample
01:00 a.m.
−25% *
−56% *
−33% *
−31% *
(Nikaido et al., 2009) [55]
Seagrass rabbitfish
(Signaus canaliculatus)
SiganidaeN/AFirst-quarter moon
Full moon
Last-quarter moon
12 lx
Moonlight
 

White
New moon
 

Dark
Plasma sample
N/A
−28% N/A
−59% N/A
−7% N/A
−62% * (mean)
(Rahman et al., 2004) [57]
Goldlined spinefoot
(Signaus guttatus)
SiganidaeN/A for sampling
(19.8–30.9 °C)
Full moonMoonlightNew moonPlasma sample
N/A
−41% *(Park et al., 2014) [60]
Arctic charr
(Salvelinus alpinus)
Salmonidae10 °C0.1–0.3 lx (mid-water)
50–65 lx (mid-water)
WhiteDarkPlasma sample
10:00 p.m.
−57% *
−74% *
(Liu et al., 2019) [59]
Atlantic salmon
(Salmo salar)
SalmonidaeN/A for sampling
(1–17 °C)
1 lx
20 lx
100 lx
WhiteDarkPlasma sample
9:00 p.m.
−11% N/A
−23% N/A
−30% N/A
(Porter et al., 2001) [61]
Tench
(Tinca tinca)
CyprinidaeN/A0.3 lx (3.3 µW/cm2)
1 lx (5.3 µW/cm2)
3 lx (10.5 µW/cm2)
WhiteDarkPlasma sample
N/A
−67% *
−65% *
−67% *
(Vera et al., 2005) [54]
Roach
(Rutilus rutilus)
CyprinidaeN/A15 lxWhiteHalf-moon (0.02 lx)Plasma sample
N/A
+14% for F
+900% for M
(Brüning et al., 2018) [63]
Roach
(Rutilus rutilus)
Cyprinidae15 °C1 lx
10 lx
100 lx
WhiteDarkWater-based measurement
8:00 a.m.
−97% *
−97% *
−99% *
(Brüning et al., 2018) [65]
Eurasian perch
(Perca fluviatilis)
Percidae16 °C1 lx
10 lx
100 lx
WhiteDarkWater-based measurement
5:00 a.m.
−73% */79 % N/A (rel)
−79% */75 % N/A (rel)
−84% */82% N/A (rel)
(Brüning et al., 2015) [64]
Eurasian perch
(Perca fluviatilis)
PercidaeN/A15 lxWhiteHalf-moon (0.02 lx)Plasma sample
N/A
0%(Brüning et al., 2018) [63]
Eurasian perch
(Perca fluviatilis)
Percidae16 °C0.01 lx
0.1 lx
1 lx
WhiteDarkWater-based measurement
5:00 a.m.
−48% */−15% (rel)
−57% */−21% * (rel)
−78% */−49% * (rel)
Kupprat et al. under revision [66]
(3B) Plasma melatonin at exposure to nocturnal colored light in fishes
SpeciesTaxonomic familyTemperatureLight intensitiesLight color/light typeControlMethodologyMelatonin levels relative to controlReference
European sea bass
(Dicentrarchus labrax)
Moranidae23 °C2 lx (2.4 µW/cm2)
11 lx (2.4 µW/cm2)
3 lx (2.4 µW/cm2)
5 lx (6 µW/cm2)
28 lx (6 µW/cm2)
7 lx (6 µW/cm2)
Blue
Green
Red
Blue
Green
Red
DarkPlasma sample
N/A
−55% *
−58% *
−14%
−84% *
−56% *
−78% *
(Bayarri et al., 2002) [62]
Roach
(Rutilus rutilus)
Cyprinidae15 °C0.15 lx (5.6 mW/m2)
2.2 lx (4.8 mW/m2)
0.65 lx (3.9 mW/m2)
(all 0.021 µmol/s/m2)
Blue
Green
Red
DarkWater-based measurement
8:00 a.m.
−95% *
−95% *
−95% *
(Brüning et al., 2018) [65]
Eurasian perch
(Perca fluviatilis)
Percidae16 °C0.15 lx (5.6 mW/m2)
2.2 lx (4.8 mW/m2)
0.65 lx (3.9 mW/m2)
(all 0.021 µmol/s/m2)
Blue
 
Green
Red
DarkWater-based measurement
08:00 a.m.
−68% */−10% N/A (rel)
−84% */−50% N/A (rel)
−80% */−33% N/A (rel)
(Brüning et al., 2016) [67]
(3C) Ocular melatonin at exposure to nocturnal white light in fishes
SpeciesTaxonomic familyTemperatureLight intensitiesLight color/light typeControlMethodologyMelatonin levels relative to controlReference
European sea bass
(Dicentrarchus labrax)
Moranidae23 °C1.4 lx (0.6 µW/cm2)
6 lx (2.4 µW/cm2)
14 lx (6 µW/cm2)
140 lx (60 µW/cm2)
WhiteDarkOcular sample
N/A
+40%
+76% *
+152% *
0%
(Bayarri et al., 2002) [62]
Wrasse
(Halichaoeres tenuispinnis)
Labridae25 °C0.13 lx
1.3 lx
13 lx
130 lx
WhiteDarkOcular sample
N/A
−24%
−65% *
−66% *
−74% *
(Iigo et al., 2003) [69]
Seagrass rabbitfish
(Signaus canaliculatus)
SiganidaeN/AFirst-quarter moonMoonlightNew moonOcular sample
N/A
−34% N/A(Rahman et al., 2004) [58]
Full moon−42% N/A
Last-quarter moon−16% N/A
12 lxWhiteDark−49% * (mean)
Full moonMoonlightNew moonsgAanat1 expression (Ocular sample)
N/A
−66% * (continuous)
Goldlineds spinefoot
(Signaus guttatus)
Siganidae25 °C−58% (before pulse, 12:00 p.m.)(Kashiwagi et al., 2013) [68]
Full moonMoonlightDark−72% * (2-h pulse)
(3D) Ocular melatonin at exposure to nocturnal colored light in fishes
SpeciesTaxonomic familyTemperatureLight intensitiesLight color/light typeControlMethodologyMelatonin levels relative to controlReference
European sea bass
(Dicentrarchus labrax)
Moranidae23 °C2 lx (2.4 µW/cm2)
11 lx (2.4 µW/cm2)
3 lx (2.4 µW/cm2)
5 lx (6 µW/cm2)
28 lx (6 µW/cm2)
7 lx (6 µW/cm2)
Blue
Green
Red
Blue
Green
Red
DarkOcular sample
N/A
+717% *
+400% *
+567% *
+1733% *
+650% *
+233%
(Bayarri et al., 2002) [62]
Table 4. Overview of studies on melatonin suppression by artificial light at night (ALAN) in birds. Only studies where the experiment was specifically designed to test the effects of ALAN are reported (see text for other studies). Percentage changes relative to control levels are reported and depicted with an asterisk when significant. Only the most relevant effects are reported. Because the complexity of the experimental design can vary depending on the study, we stress the need to check the original study for the exact details. LED—light-emitting diode.
SpeciesTaxonomic FamilyTemperatureLight Intensities and DurationLight Color/Light TypeControl MethodologyMelatonin Relative to ControlReference
Great tit
(Parus major)
Paridae10–14 °C0.15, 0.5, 1.5, 5 lx
for entire night
Warm white LED0.05 lxPlasma sample−50% under 5 lx *(de Jong et al., 2016) [15]
Eurasian blackbird
(Turdus merula)
Turdidae20 °C0.3 lx
for entire night
Incandescent light bulb0.001 lxPlasma sample~−50% winter (dusk and dawn) *
~−30% summer (dusk, midnight, dawn) *
(Dominoni et al., 2013) [96]
Eurasian tree sparrow (Passer montanus)
Passeridae22 °C8 lx
for entire night
Cool white fluorescent lamp0 lxPlasma sample−70% at midnight *(Jiang et al., 2020) [99]
Indian weaver bird
(Ploceus philippinus)
Ploceidae24 °C2 lx
for entire night or 4 h
Cool white fluorescent lamp0.1 lxPlasma sample−66% at midnight *
−50% at dawn and dusk *
(Kumar et al., 2018) [98]
Western scrub-jay (Aphelocoma californica)Corvidae20 °C0.3 lx
for entire night
Incandescent light bulb0.01 lxPlasma sample+50% *(Schoech et al., 2013) [97]
Table 5. Overview of studies on melatonin suppression (SUP) by artificial light at night (ALAN) in non-human mammals: (5A) rodents, (5B) ungulates, and (5C) primates. Percentage changes in melatonin levels relative to control (CON) levels are reported and depicted with an asterisk when significant. MEL—melatonin, LP—long photoperiod, SP—short photoperiod, M—male, F—female, aMT6s—6-sulfatoxymelatonin, NS—not significant, CCT—correlated color temperature.
(5A) Melatonin at exposure to nocturnal light in mammals: rodents
SpeciesNumber, gender, and age of subjectsLight intensity/treatmentsLight durationCCT, wavelength, light color/light typeControl light intensitiesMethodologyMelatonin relative to controlReference
Sprague–Dawley ratsn = 12
M
adults (3–4 weeks)
8.07 ± 0.95 lx (3.31 ± 0.38 μW/cm2) Overnight (12-h light/12-h dark),
over 4 weeks
>620 nm, red light0 lxPlasma MEL~−95% for peak dark-phase MEL(Dauchy et al., 2015) [106]
Siberian hamsters
(Phodopus sungorus)
n = 6–8
M
adults
1. 0.003 μW/cm2
2. 0.03 μW/cm2
3. 0.3 μW/cm2
4. 1.31 μW/cm2
5. 4.8 μW/cm2
6. 68 μW/cm2
15-min light pulse, 60% into the scotophase,
LP: 14-h light/10-h dark
SP: 10-h light/14-h dark
480 nm LED0 lxPlasma MELMEL SUP similar for both photoperiods:
1. NS
2. ~−60% *
3. ~−90% *
4. ~−90% *
5. ~−90% *
6. ~−90% *
(Glickman et al., 2014) [109]
Siberian hamsters (Phodopus sungorus)n = 132–156
M
adults
SP (8-h light/16-h dark) + light pulse (200–800 lx)1-min light pulse, in the middle of the scotophase,
3–4 weeks
Fluorescent light1. LP (16-h light/8-h dark)
2. SP (8-h light/16-h dark)
Only
Pineal N-acetyltransferase
(MEL formation)
Treatment to CON 1: NS
Treatment to CON 2: 50% shorter enzyme activity time under short photoperiod only
(Hoffmann et al., 1981)
Laboratory micen = 10–14
M
adults
200 lx15-min light pulse:
1. 4 h into scotophase,
2. 2 h before end of scotophase
N/A0 lxPlasma and pineal MELSimilar MEL SUP after light pulse at both times:
~−85% * pineal MEL
~−70% * plasma MEL
1: delay of morning decline of MEL production
2: advance of morning decline of MEL production (>2 h)
(Kennaway et al., 2002) [105]
Fat sand rat (Psammomys obesus)n = 8
M
N/A
1. Acute light pulse
2. SP (8-h light/16-h dark)
2. SP + chronic light pulse
4. Constant dim blue light (30 lx, 470 nm)
Acute light pulse: 30 min, 5 h into the scotophase
Chronic light pulse: 3 × 15 min
at 4-h intervals
Constant light: over 24 h for 3 weeks
Cool white fluorescentControl photoperiod 12-h light/12-h dark, no light at nightaMT6s in urine1: −63% *
2: −73% * (6 h into scotophase)
3: +71−89% * compared to SP only
4: +71% *
(Schwimmer et al., 2010) [111]
Rats n = 3−6
F
5 weeks (50 ± 3 days)
61, 81, 128, 193 lx1. 5× 1-min light pulse, 2 h into scotophase, 1 day
2. 2 weeks
3. 10 weeks
Incandescent light12-h light/12-h dark, dim red light at night (λ ≥ 650 nm), <0.1 lxSerum MEL1: ~−65% *
2: ~−35% * (high sensitivity mid-scotophase ~−39%), phase advance
3. ~−25% *, stronger phase advance
(Travlos et al., 2001) [107]
Nude ratsn = 12
F
1–2 weeks
0.2 lx dim light Throughout the scotophase (12-h light/12-h dark) 0 lxPlasma MEL~−88% * for peak dark-phase MEL(Xiang et al., 2015) [108]
(5B) Melatonin at exposure to nocturnal light in mammals: ungulates
SpeciesNumber, gender, and age of subjectsLight intensity/treatmentsLight durationCCT, wavelength, light color/light typeControl light intensitiesMethodologyMelatonin relative to controlReference
Israeli Holstein cowsn = 14
F
mean age 3.85 years
105 ± 3.91 lxOvernight ALAN: 482 ± 5.12 nm
Control: 648 ± 5.12 nm
5.08 ± 0.04 lxMEL in milk −44% * in night-time sample
−38.4 * in daytime sample
(Asher et al., 2015) [112]
Goatsn = 6
F
2 years
1. 0.87 ± 0.14 lx (0.26 ± 0.004 µW/cm2)
2. 2.3 ± 0.3 lx (0.68 ± 0.09 µW/cm2)
3. 14.2 ± 2.1 lx (4.22 ± 0.62 µW/cm2)
4. 137 ± 14 lx (40.70 ± 4.16 µW/cm2)
1 h, 3 h into scotophase (8-h light/16-h dark).
Increasing intensity treatments,
1–3 days between the treatments
Cool white fluorescent lamps0 lxPlasma MEL1: 0%
2. −43.1% *
3: −71.1% *
4: −81.2% *
(Deveson et al. 1990) [113]
Sheepn = 6–7
F
N/A
N/A1 h at midnightN/ADim red light (<1 lx)Plasma MEL~−92% * for the high-MEL group
~−88% * for the low-MEL group
(Vivien-Roels et al. 1999) [114]
Thoroughbred horse (Equus caballus)n = 4
M
5 years
3, 10, 50, 1001 h Blue LED, 468 nm<0.1 lxSerum MEL3 lx: NS
10 lx: ~−60% *
50 lx: ~−80% *
100 lx: ~−70% *
(Walsh et al. 2013) [115]
(5C) Melatonin at exposure to nocturnal light in mammals: primates
SpeciesNumber, gender, and age of subjectsLight intensity/treatmentsLight duration and timingCCT, wavelength, light color/light typeControl light intensitiesMethodologyMelatonin relative to controlReference
Mouse lemur (Microcebus murinus)n = 12
M
adults
51.5 lx3–5 h, 5 weeks during the nightsWhite LED
Yellow LED
~0.3 lxaMT6s in urine −50% *(Le Tallec, Théry, and Perret 2016) [118]
Squirrel monkey
(Saimiri sciureus)
n = 9
M
adults
200 lx2 h (12:00–02:00 a.m.)Fluorescent lightNo light at nightMEL in plasma,
aMT6s in urine
−4.8% *(Hoban, Lewy, and Fuller 1990) [116]
Table 6. Overview of studies on melatonin suppression by artificial light at night (ALAN) in humans included in the analysis. Percentage changes in melatonin levels relative to control levels were calculated when possible and depicted with an asterisk when significant. “N/A” indicates that values were not available. Only the most relevant effects are reported. MEL—melatonin, aMT6s—6-sulfatoxymelatonin, SUP—suppression, SIGN—significant, NS—not significant, MEF—melanopic efficacy, CON—control, AUC—area under the curve, CS—circadian stimulus (measure of the effectiveness of the retinal light stimulus for the human circadian system), CT—circadian time, M—male, F—female.
Number,
Gender (M, F),
Age of Subjects
Light Intensity/Light Type
Duration and Timing of Light ExposureCCT, Wavelength, Color of LightControl Lighting ConditionsLocationMethodology
MEL Relative to CON
Reference
n = 13
M = 13
mean age
23.8 ± 5.0 years
~75 lx 5 h
(7:30 p.m.–12:30 a.m.)
1. LED screen—6953 K
2. No LED screen—4775 K
<8 lxLaboratoryMEL in salivaSIGN effects for screen,
time of day, interaction screen vs. time of day
(Bues et al. 2012) [121]
n = 12
M = 6, F = 6
mean age
24.92 ± 2.87 years
Printed book 0.91 lx
LED ebook 31.73 lx
4 h before bed time every day (6:00–10:00 p.m.)
5 days each session
N/A~3 lx ambient room light levelLaboratoryMEL in plasmaLED ebook:
−55.12 ± 20.12% *
Printed book:
18.77 ± 39.57% NS
between sessions *
(Chang et al. 2015) [139]
n = 16
M = 16
(20–28 years)
40 lx2 h
(9:30–11:30 p.m.)
Fluorescent lamps:
6500 K
2500 K
incandescent lamp: 3000 K
0 lxLaboratoryMEL in saliva6500 K: *
MEL increase to pre-light exposure levels:
6500 K: 29.5 ± 5%
3000 K: 49 ± 7.6%
2500 K: 42 ± 8.6%
(Chellappa et al. 2011) [122]
n = 9
M = 6; F = 3
mean age
25.7 ± 3.0 years
LED tablet:
38.4 ± 23.2 lx (min–max: 1.5–148.2 lx)
2× 5 consecutive evenings (6:00–8:45 p.m.)N/APrinted book:
0.7 ± 0.2 lx (min–max: 0.2–1.4 lx)
LaboratoryMEL in plasmaLED tablet: 54.17 ± 18%; printed: 9.75 ± 22.75%;
LED tablet delayed bedtime for 30 min, MEL secretion for ~1 h and sleep onset for 30 min
(Chinoy, Duffy, and Czeisler 2018) [140]
n = 67
M = 38; F = 29;
pre- to mid-pubertal group (9.1–14.7 years);
late- to post-pubertal group (11.5–15.9 years)
15 lx
150 lx
500 lx
4 consecutive nights
1 h
evening group (11:00 p.m.–12:00 a.m.) morning group (3:00–4:00 a.m.)
N/A0.1 lxLaboratoryMEL in salivaEvening light exposure: pre- to mid-pubertal group
MEL SUP:
15 lx: −9.2 ± 20.5%
150 lx: −26 ± 17.7%
500 lx: −36.9 ± 11.4%
late- to post-pubertal group MEL SUP
15 lx: −5.3 ± 17.7%
150 lx: −12.5 ± 17.3%
500 lx: −23.9 ± 21.7%
Evening light exposure between age groups: SIG
Morning light exposure between age groups: NS
(Crowley et al. 2015) [135]
n = 4
M = 4
(20–21 years)
1. 18 lx (29 μW/cm2) for blue LED
2. 450 lx (170 μW/cm2) for mercury vapor
1 h
(1:00–2:00 a.m. and 5:00–6:00 a.m.)
Blue LED,
mercury vapor lamp
Dimly illuminated areaLaboratoryMEL in plasma1: −34 ± 9% *
2: −18 ± 6% *
(Figueiro, et al. 2004) [123]
n = 40
M = 22
(18–54 years,
median = 21 years)
F = 18
(18–35 years,
median = 23 years)
1. 30 lx
2. 100 lx
3. 300 lx
4. 1000 lx
(at the cornea)
40 min,
2 experimental sessions
(2:00–2:40 a.m.,
3:40–4:20 a.m.)
4100 K
8000 K
Dim light (red LED)LaboratoryMEL in plasmaSIGN effect of light level and spectrum
4100 K:
1: 3 ± 11%
2: 10 ± 4%
3: 38 ± 7%
4: 38 ± 6%
8000 K:
1: 10 ± 8%
2: 32 ± 7%
3: 47 ± 4%
4: 34 ± 9%
(Figueiro, Rea, and Bullough 2006) [150]
n = 21
mean age
28.0 ± 9.9 years
1. Computer monitor 7 lx
2. Computer monitor 7 lx + 40 lx blue safety glasses (peak λ ~470 nm)
2 h
(11:00 p.m.–1:00 a.m.)
N/AComputer monitor 7 lx + orange-tinted glasses (<525 nm ~0)LaboratoryMEL in saliva1: −11% NS
2: −30% *
(Figueiro et al. 2011) [130]
n = 116
study 1 n = 104, study 2 n = 12
(18–30 years)
<200 lxovernight illumination
Study 1: 9–10 days
Study 2: 14 days
4100 K˂3 lxLaboratoryMEL in plasmaExposure during sleep:
~−50% in 85% trial
exposure before bedtime: SUP MEL, later MEL onset in 99.0% of individuals and shortened MEL duration by ~90 min
(Gooley et al. 2011) [131]
n = 9
M = 9
mean age 22.11 ± 0.69 years
200 lx
500 lx
1000 lx
5000 lx
10,000 lx
3 h
(6:00–9:00 a.m.)
N/A˂200 lxLaboratoryMEL in plasma200 lx NS
˃500 lx *, first hour of exposure ~35–50%
(Hashimoto et al. 1996) [124]
n = 22
M=22
mean age
30.95 ± 4.15 years
2 types of smartphones:
LED with blue light,
LED with suppressed blue light
150 min
(7:30–10:00 p.m.)
N/A<3 lxLaboratoryMEL in blood serumLED with blue light: lower levels and later onset of MEL secretion than LED with SUP blue light
MEL between groups: NS
(Heo et al. 2017) [125]
n = 34,
F young (n = 13), mean age 24 ± 3 years
F postmenopausal (n = 21), mean age 57 ± 5 years
456 nm:
~11.4 lx (3.8 μW/cm2)
29.4 lx (9.8 μW/cm2)
548 nm:
84 lx (28 μW/cm2)
186 lx (62 μW/cm2)
30 min during the rising phase of melatonin synthesisMonochromatic light:
456 nm
548 nm
0 lxLaboratoryMEL in plasma456 nm, postmenopausal women:
~11.4 lx: −1.4 ± 5% NS
29.4 lx: −12.5 ± 4% NS
Young women
~11.4 lx: −18.4 ± 4.8% *
29.4 lx: −25.5 ± 6.4% *
548 nm:
SIGN SUP in both age group,
NS difference between age groups
(Herljevic et al. 2005) [120]
n = 11
M = 11
mean age
21.2 ± 0.9 years
1. Non-visor: 500 lx
2. red visor: 160 lx
3. blue visor: 160 lx
2–4 h
(11:00 p.m.–3:00 a.m.)
4200 K˂15 lxLaboratoryMEL in saliva2-h exposure:
1: −57.0 ± 26.6%
2: -20.3 ± 32.1% * to non-visor
3: −31.1 ± 41.5%
4 h exposure:
1: −52.6 ± 22.4%
2: −7.7 ± 3.3% *
3: −3 ± 67.6% *

(Higuchi et al. 2011) [126]
n = 12
M = 12
mean age
21.3 ± 1.1 years
200 lx1.5 h
(1:00–2:30 a.m.)
Fluorescent lamps: 2300 K
3000 K
5000 K
<10 lxLaboratoryMEL in saliva5000 K: *
3000 K: *
5000 K more than 3000 K
2300 K: NS
(Kozaki et al. 2008)
[127]
(Experiment 2)
n = 16
M = 9, F = 7
(19–28 years)
200 lx4 h
(10:00 p.m.–2:00 a.m.)
L1—1600 K
L2—1950 K
L3—2750 K
L4—3900 KL5—6100 K
L6—7100 K
L7—14,000 K
<0.1 lxLaboratoryMEL in salivaSmall MEL SUP under CCT <2000 K and strong MEL SUP with CCT ≥3900 K
AUC under L4–L7 were SIGN lower than under L1 and AUCs under L3-L7 were SIGN smaller than under L2
(Kraneburg et al. 2017) [141]
n = 6
M = 4, F = 2
mean age
32.3 + 6.2 years
200 lx
400 lx
600 lx
3 h
(12:00–03:00 a.m.)
N/A˂10 lxLaboratoryMEL in plasma200 lx: −21% NS
400 lx: −50% *
600 lx: −65% *
(McIntyre et al. 1989) [145]
n = 18
M = 6; F = 12;
mean age
23.2 ± 3.3 years
Evening light: orange (OL) ~100 lx; blue-enriched (BL) ~500 lx
Morning light: mixed blue-enriched (MBL) 750 lx; control (CON) 40 lx
EL:
30 min
(10:00–10:30 p.m.)
ML:
3 h
(8:00–11:00 a.m.)
OL—1500 K
BL—6500 K
DL—2700 K
MBL—3,537 K
CON—2600 K
Dim light (DL) <7 lx
Laboratory and home settingsMEL in saliva
Evening light:
BL to D: *
OL to DL: *
OL to BL: *
Phase shifts greater under CON than MBL,
phase delays after 3 days:
MBL to CON *
phase advances: NS
(Münch et al. 2017) [142]
n = 24
12 adolescents: M = 3, F = 9
mean age
16.5 ± 1.9 years
12 adults:
M = 2, F = 10
mean age
46 ± 5.2 years
295 lx for 2700 K
209 lx for 5600 K
(CS at the eye level = 0.25)
4 h (11:00 p.m.–3:00 a.m.)Blue light,
2700 K
5600 K
<5 lxLaboratoryMEL in salivaGreater MEL SUP for longer exposure duration, SIGN interaction between light spectrum and age
Adolescents:
5600 K: −43 ± 4% *
2700 K: −29 ± 4% *
Adults:
5600 K: −33% ± 3% *
2700 K: −33% ± 2% *
(Nagare, Plitnick and Figueiro 2019)
[136]
n = 41
18 adolescents (13–18 years)
23 adults
(24–55 years)
40–1000 lx
(CS = 0.07, 0.14, 0.30, 0.50)
0.5–3.0 h
(11:00 p.m.–2:00 a.m.)
White light,
2700K
6500 K
<5 lxLaboratoryMEL in salivaSIGN effects of light intensity, spectrum, exposure duration; effect of light diminishes with increasing exposure duration for age groups and spectra.
6500 K: −24.7 ± 1% *
2700 K: −18.4 ± 1% *
(Nagare et al. 2019)
[137]
n = 54,
study 1:
M = 22 (19–34 years), F = 21 (20–56 years)
study 2:
M = 4 (27–58 years), F = 7 (25–51 years)
Study 1: 200 lx study 2: 500 lx1h
(12:00–1:00 a.m.)
5000 K10–20 lxLaboratoryMEL in plasmaStudy 1:
M: 16,9%
F: 14,5%
study 2:
M: 35%
F: 45%
NS differences between the sexes
(Nathan, Burrows, and Norman 1997)
[151]
n = 10
M = 5, F = 5
mean age
25.0 ± 2.5 years
200 lx
500 lx
1000 lx
3000 lx
1h
(12:00–1:00 a.m.)
5000 K10–20 lxLaboratoryMEL in plasma200 lx: −17% NS
500 lx: −40% *
1000 lx: −56% *
3000 lx: −74% *
No differences between the sexes
(Nathan et al. 2000)
[143]
n = 528;
dark LAN group
n = 383
LAN group n = 145
Seniors (min 60 years) mean age 72.8 years
LAN group ≥ 3 lxContinuous overnight exposureN/ADark LAN <3 lx Home settingsaMT6s in urineLAN 6.8 g (4.3–10.5);
Dark LAN group: 6.5 g (3.9–9.5); NS
(Obayashi et al. 2013) [119]
n = 56
M = 27, F = 29
mean age
20.8 ± 2.6 years
10, 30, 50, 100, 200, 400, and 2000 lx5 h (4 h before sleep and 1 h after sleep start)4100 K<1 lxLaboratory MEL in saliva−50% * at group level ~24.6 lx; high variability for individuals: −50% * from 6 to 350 lx(Phillips et. al. 2019) [117]
n = 36,
each experiment n = 12
M = 29, F = 7
mean age 21.91 ± 2.03 years
100 lx, partial illumination of the retina4 h
(12:00–4:00 a.m.)
N/A<10 lxLaboratoryMEL in saliva−22% * after temporal and −58% * after nasal exposure(Rüger et al. 2005) [138]
n = 16
M = 9; F = 7
mean age
36.2 ± 8.6 years
~175 lx3 h
2 h before and 1 h after habitual bedtime
White light,
similar CCT 2700 K
2 spectral powers: low 52.03 µW/cm2 high 90.85 µW/cm2
<5 lxLaboratoryMEL in salivaHigh MEF: ~−50% *
low MEF: NS
(Souman et al. 2018) [146]
n = 22
M = 18, F = 4
mean age
27.0 ± 7.0 years
0.70–65 µW/cm230 min
(11:30 p.m.–2:30 a.m.)
CT 16–18
Monochromatic light, λmax
424, 456, 472, 496,
520, and 548 nm
No light exposureLaboratoryMEL in plasmaMEL concentrations SUP in a dose-dependent manner.
No SIGN MEL SUP at the lowest irradiances (0.70–3.3 µW/cm2) of 520 nm
(Thapan, Arendt, and Skene 2001) [144]
n = 6
M = 6
(18–22 years,
mean age 20.2 years)
250 lx
500 lx
1000 lx
2500 lx
3 h
individually determined 1h before MEL onset
N/A<50 lxLaboratoryMEL in plasmaComplete MEL SUPPR compared to CON in all treatments(Trinder et al. 1996) [128]
n = 33
M = 33
study 1 n = 17
study 2 n = 16 (22.6 ± 2.2 years)
1. Short-wavelength attenuated polychromatic white light (SWL): 193 lx
2. Full-spectrum light (FWL): 256 lx
3 nights,
overnight exposure
(11:00 p.m.–7:00 a.m.)
3000 K3 lxLaboratory and home settingsMEL in saliva
aMT6s in urine
SWL: −6 ± 4% NS
FWL: −45 ± 6% *
SWA to CON *
(Van De Werken et al. 2013) [129]
n = 6
(19–37 years)
8.1 log photons/cm2·s
9.2 log photons/cm2·s
10.3 log photons/cm2·s
1 h (10:00–11:00 p.m.)
460 nmComplete darknessLaboratoryMEL in salivaThreshold for human melatonin suppression ~10 log photons/cm2·s at 460 nm(Vartanian et al. 2015) [132]
n = 9
M = 6; F = 3
mean age
26.3 ± 4.2
(22–33 years)
1. 130 lx
2. 130 lx
3. 500 lx
4. 500 lx
5. 500 lx
30 min
(10:30–11:00 p.m.)
1. 2000 K
2. 6000 K
3. 6000 K
4. 5000 K
5. 2800 K
<10 lxLaboratoryMEL in saliva1: NS
2–5: *
(Wahnschaffe et al. 2013) [147]
n = 10
M = 6, F = 4
18–41 years
500–1000 lx full spectrum
500–1000 lx green light
1 h
(2:00–3:00 a.m.)
N/A
20–50 lx full spectrum (dim)
LaboratoryMEL in salivaAll light treatments
SIGN different from CON. None of the treatment conditions SIGN different from each other
(Whitmore, French, and Fischer 2001) [149]
n = 13
mean age
18.9 ± 5.2 years
Tablet + blue LED 59 ± 5.0 lx
tablet only
18 ± 3. 8 lx
1–2 h
(11:00 p.m.–1:00 a.m.)
3 weekends, 1 week apart
blue light λmax ~470 nmTablet + orange-tinted glasses 9.8 ± 1.9 used as controlLaboratoryMEL in saliva1 h exposure:
Tablet + blue LED: −48 ± 4% *
Tablet only: −7 ± 4% NS
2 h exposure:
Tablet + blue LED: −66 ± 4% *
Tablet only: −23 ± 6% *
(Wood et al. 2013) [133]
n = 15
M = 5, F = 10
mean age 31.8 ± 11.9 years
130 µW/cm2
(received by each eye)
2 h
(12:00–2:00 a.m.)
1. 660 nm
2. 595 nm
3. 525 nm
4. 497 nm
5. 470 nm
No lightLaboratoryMEL in saliva1: −5% NS
2: −10% NS
3: −70% *
4: −80% *
5: −65% *
(Wright and Lack 2001) [148]
n = 23
mean age
27.8 ± 8.91
(18–44 years)
3 lx
106 lx
9100 lx
6–5-h pulseCool lightDim lightLaboratoryMEL in plasma3 lx: −11% N/A
106 lx: −88% N/A
9100 lx: −98% N/A
(Zeitzer et al. 2000) [134]

