Night-Time Light Dynamics during the Iraqi Civil War


1
State Key Laboratory of Information Engineering in Surveying, Mapping and Remote Sensing, Wuhan University, Wuhan 430079, China
2
Collaborative Innovation Centre of Geospatial Technology, Wuhan 430079, China
3
School of Resource and Environmental Sciences, Wuhan University, Wuhan 430079, China
4
Economics and Management School, Wuhan University, Wuhan 430079, China
*
Author to whom correspondence should be addressed.
Remote Sens. 2018, 10(6), 858; https://doi.org/10.3390/rs10060858
Submission received: 29 March 2018
/
Revised: 24 May 2018
/
Accepted: 28 May 2018
/
Published: 1 June 2018
(This article belongs to the Special Issue Remote Sensing of Night Lights – Beyond DMSP)
Abstract
:In this study, we analyzed the night-time light dynamics in Iraq over the period 2012–2017 by using Visible Infrared Imaging Radiometer Suite (VIIRS) monthly composites. The data quality of VIIRS images was improved by repairing the missing data, and the Night-time Light Ratio Indices (NLRIs), derived from urban extent map and night-time light images, were calculated for different provinces and cities. We found that when the Islamic State of Iraq and Syria (ISIS) attacked or occupied a region, the region lost its light rapidly, with the provinces of Al-Anbar, At-Ta’min, Ninawa, and Sala Ad-din losing 63%, 73%, 88%, and 56%, of their night-time light, respectively, between December 2013 and December 2014. Moreover, the light returned after the Iraqi Security Forces (ISF) recaptured the region. In addition, we also found that the night-time light in the Kurdish Autonomous Region showed a steady decline after 2014, with the Arbil, Dihok, and As-Sulaymaniyah provinces losing 47%, 18%, and 31% of their night-time light between December 2013 and December 2016 as a result of the economic crisis in the region. The night-time light in Southern Iraq, the region controlled by Iraqi central government, has grown continuously; for example, the night-time light in Al Basrah increased by 75% between December 2013 and December 2017. Regions formerly controlled by ISIS experienced a return of night-time light during 2017 as the ISF retook almost all this territory in 2017. This indicates that as reconstruction began, electricity was re-supplied in these regions. Our analysis shows the night-time light in Iraq is directly linked to the socioeconomic dynamics of Iraq, and demonstrates that the VIIRS monthly night-time light images are an effective data source for tracking humanitarian disasters in that country.
1. Introduction
The Iraqi Civil War (2014–2017) has brought a severe humanitarian disaster to Northern Iraq, with more than 60,000 deaths and more than three million internally displaced persons [1,2]. In January 2014, the Islamic State of Iraq and Syria (ISIS), which rapidly grew during the Syrian Civil War, seized Fallujah city in Al-Anbar Province. This operation was considered the first major success for ISIS in Iraq. After that, ISIS occupied a number of Northern Iraqi cities and towns, including Mosul and Tikrit, by June 2014. On 29 June 2014, ISIS announced the establishment of a new caliphate, named the Islamic State (IS), with Abu Bakr al-Baghdadi as its caliph. The ISIS was responsible for a great number of massacres (such as Sinjar Massacre of the Yezidi [3]) while in control. Over the period 2015–2016, the Iraqi Security Forces (ISF), militant groups, and Kurdish forces (also called Peshmerga) were contesting ISIS, retaking cities including Tikrit. In October 2016, the ISF, with allied militias and an international alliance, launched an offensive, named the “We Are Coming, Nineveh” campaign, in Mosul. After long fierce battles in Mosul, the Iraqi government announced victory over ISIS in July 2017, indicating the almost complete collapse of ISIS in Iraq.
The ISIS-controlled areas are dangerous for journalists and international investigators; thus, there is an urgent need to evaluate the humanitarian conditions in these areas from both aerial photography [4] and satellite images [5]. Remote sensing images have long been an important data source to evaluate areas of conflict due to their low cost, large coverage, and objectivity [6]. Therefore, the academic community has widely used remote sensing to evaluate the impact of conflicts on the economy and environment in many countries and regions, such as Kuwait [7,8], Bosnia [9], Chechnya [10], and the Congo [11]. In addition, a number of organizations have used remote sensing as an operational tool to evaluate human rights in conflict areas. For example, the Scientific Responsibility, Human Rights and Law Program of the American Association for the Advancement of Science (AAAS) used high-resolution remote sensing images to assess the conflict in Aleppo City, Syria by mapping military vehicles/equipment, roadblocks, and destruction of buildings, infrastructure, and cultural artifacts [12].
In contrast to day-time images, night-time light images provide a special perspective on human activities, because human settlements emit light at night. These satellite-acquired night-time light images have been widely used in socioeconomic studies, including those on power consumption estimation [13], poverty assessment [14,15], urbanization mapping [16,17,18,19,20,21,22,23], regional inequality [24,25,26], Gross Domestic Product (GDP) estimation [27,28], and population movement [29], as well as conflict evaluation in Russia [10], Syria [30,31], Iraq [32], and Yemen [33]. Moreover, night-time light images have also played an important role in mapping light pollution [34,35,36] and evaluating its impact on human health [37,38].
A previous study found that after ISIS occupied Northern Iraq in 2014, the occupied cities lost most of their night-time light between May 2014 and December 2014, indicating that these regions were lacking electricity supply at that time [32]. Nevertheless, the study only captured a short period of ISIS-derived conflict in Iraq, and the night-time light dynamics during the full period for the whole of Iraq remain unknown. Currently, the ISIS has been defeated and most of the Iraqi regions they previously ruled are now controlled by the ISF and Kurdish forces, providing an opportunity to analyze how night-time light changed during the full period of the conflict: What are the night-time light patterns of different provinces? What are the night-time light dynamic patterns of different cities? Are these patterns related to conflict events? This paper uses VIIRS monthly night-time light images to analyze ISIS-derived conflict in Iraq over the period 2014–2017, providing a full picture showing how the night-time light changed during and after the conflict.
2. Materials and Methods
2.1. Study Area and Data
Iraq is located in the Middle East, with Iran, Turkey, Syria, Jordan, Saudi Arabia, and Kuwait as its neighboring countries. Iraq has 18 provinces, with Bagdad as its capital and Mosul as its second largest city. In the past, the Defense Meteorological Satellite Program’s Operational Linescan System (DMSP/OLS) was the only operational satellite that could record night-time light. That history has changed since the emergence of the Suomi National Polar-orbiting Partnership satellite’s Visible Infrared Imaging Radiometer Suite (Suomi NPP/VIIRS), which has higher resolution and radiometric quality than DMSP/OLS [39]. Suomi NPP/VIIRS night-time light images have been widely used in studies of urbanization [40], power consumption [41,42,43], carbon emission [44], regional inequality [26], and GDP estimation [45,46] as well as conflict evaluation [32,33,47]. In this study, Suomi/NPP-VIIRS night-time light images were employed as the night-time light data source.
To analyze how night-time light changed due to ISIS-derived conflict, three types of data sources were used in this study:
- (1)
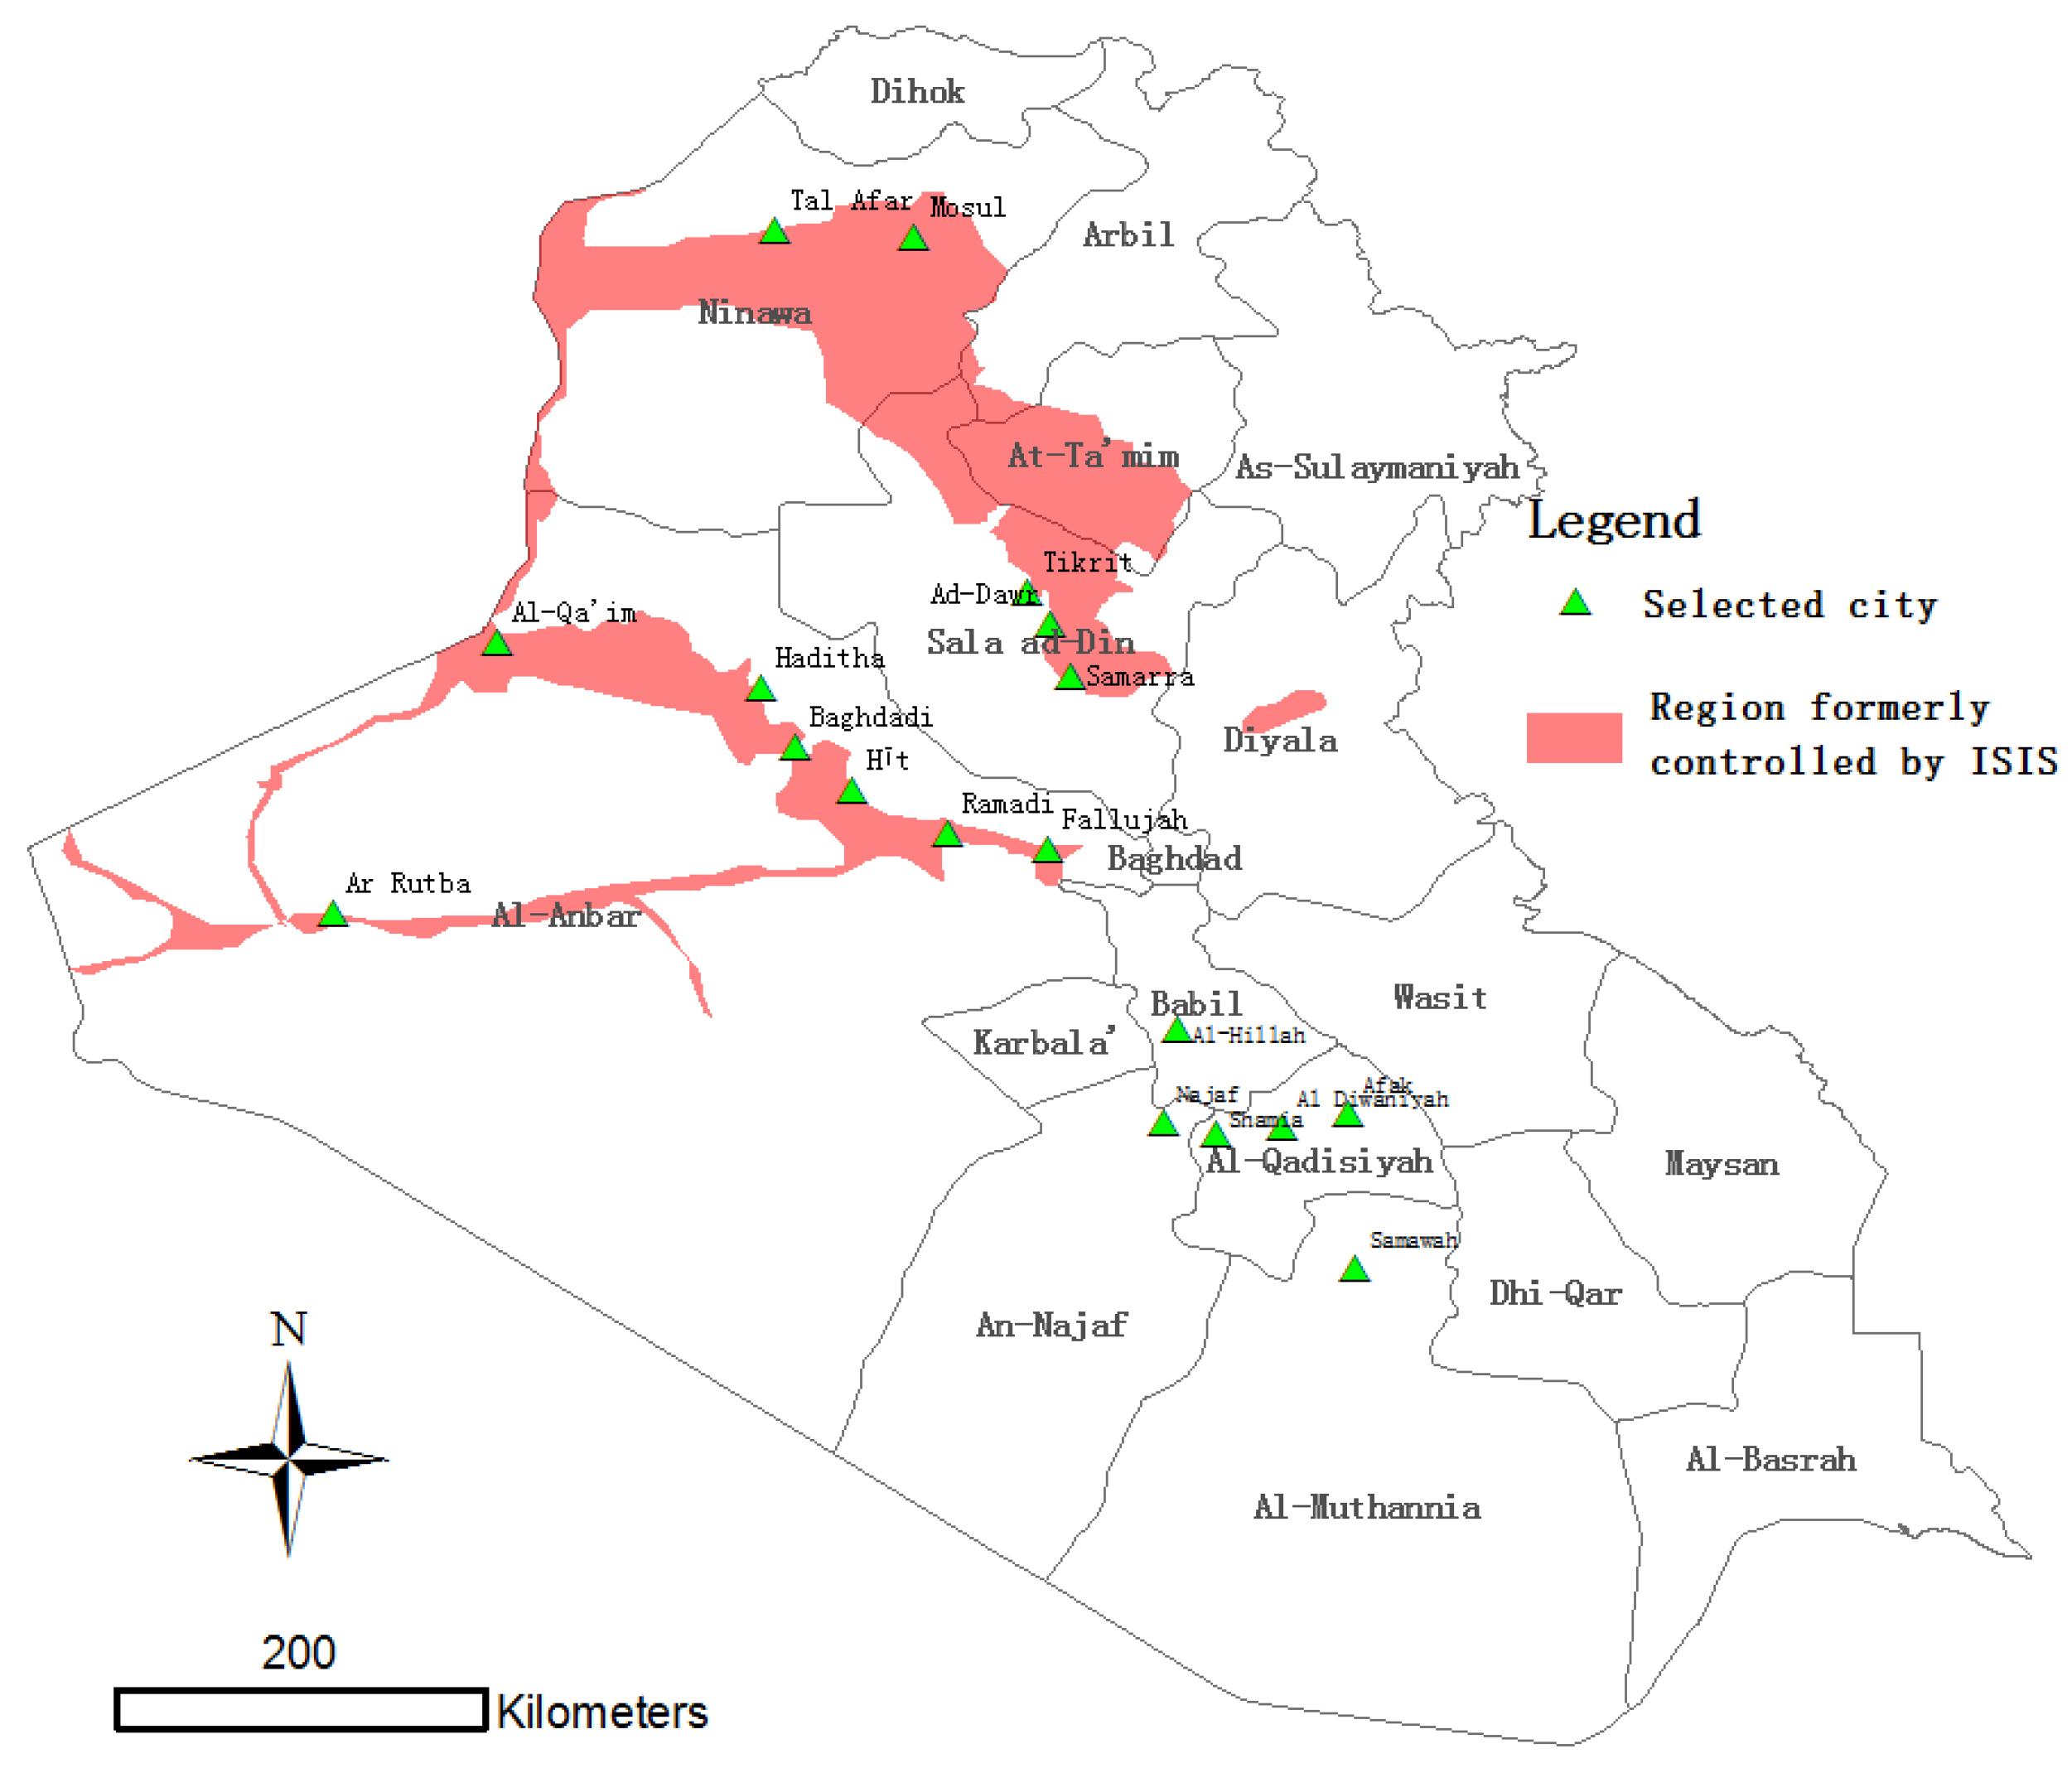
- Border data. The provincial and international border data of Iraq were downloaded from Global Administrative Areas (www.gadm.org), geographic coordinates of centers of the selected cities were extracted from Google Earth (Figure 1), and borders of ISIS-controlled regions in January 2015 were digitalized from a media website [48].
- (2)
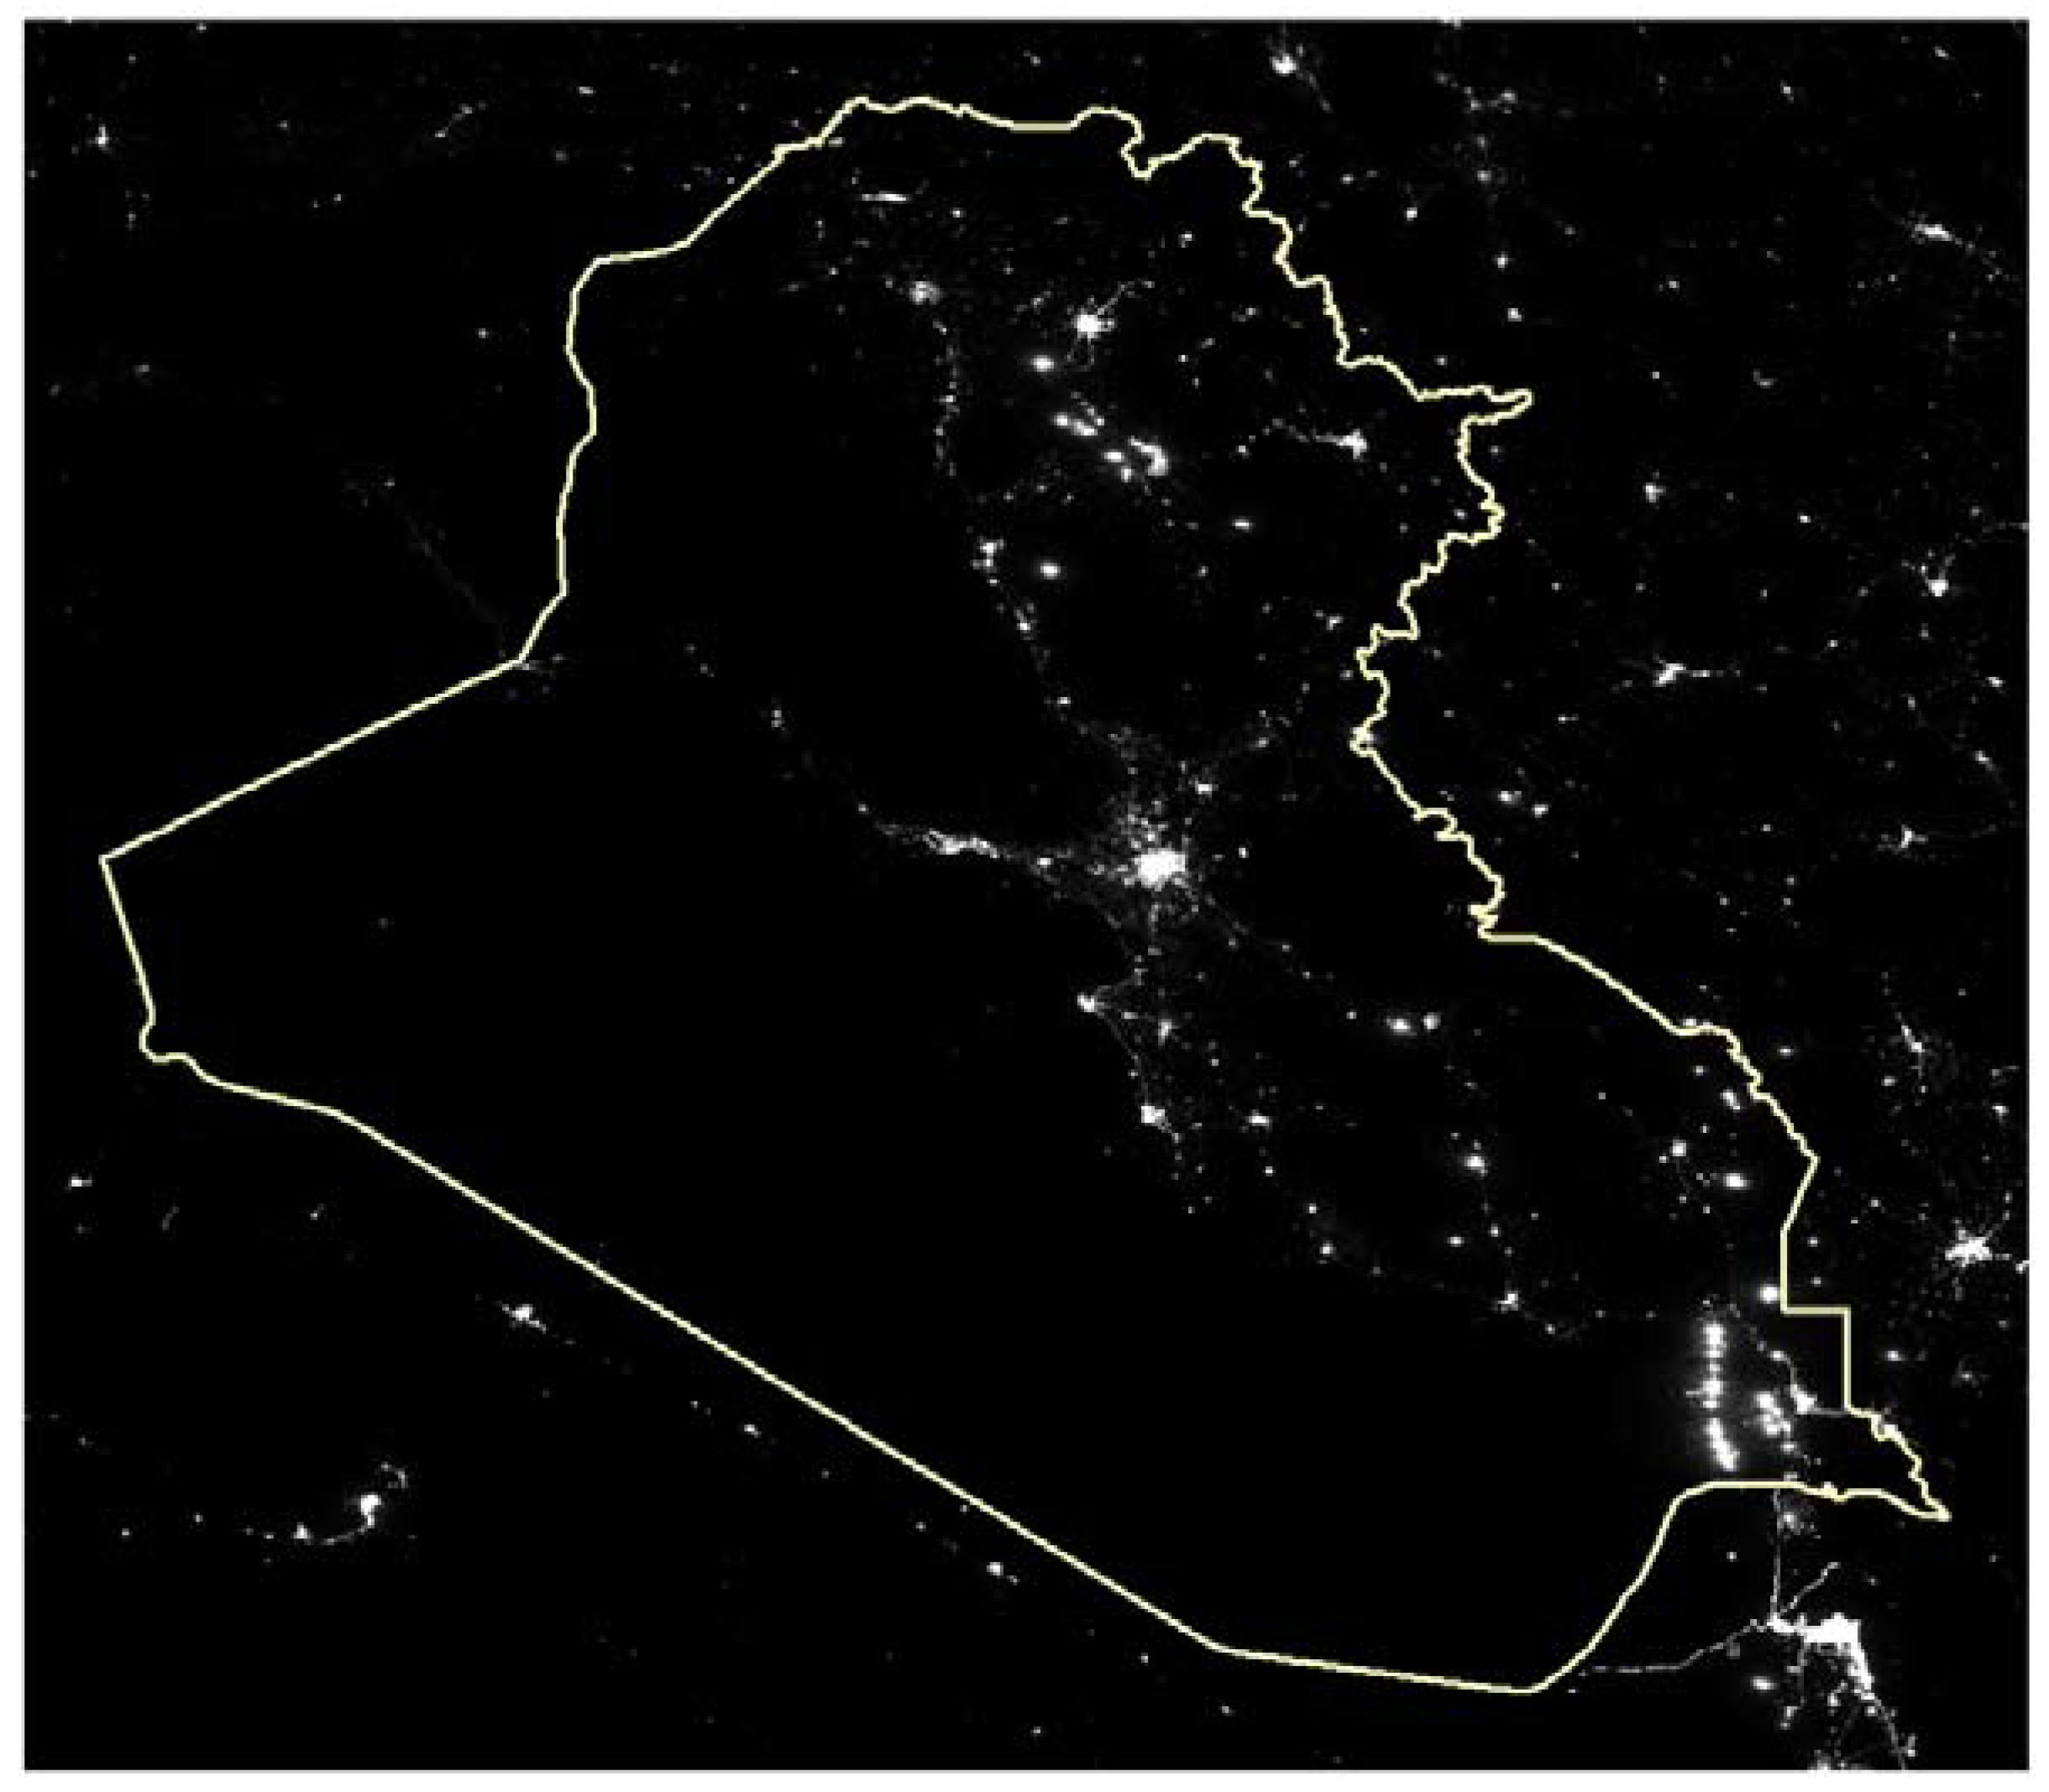
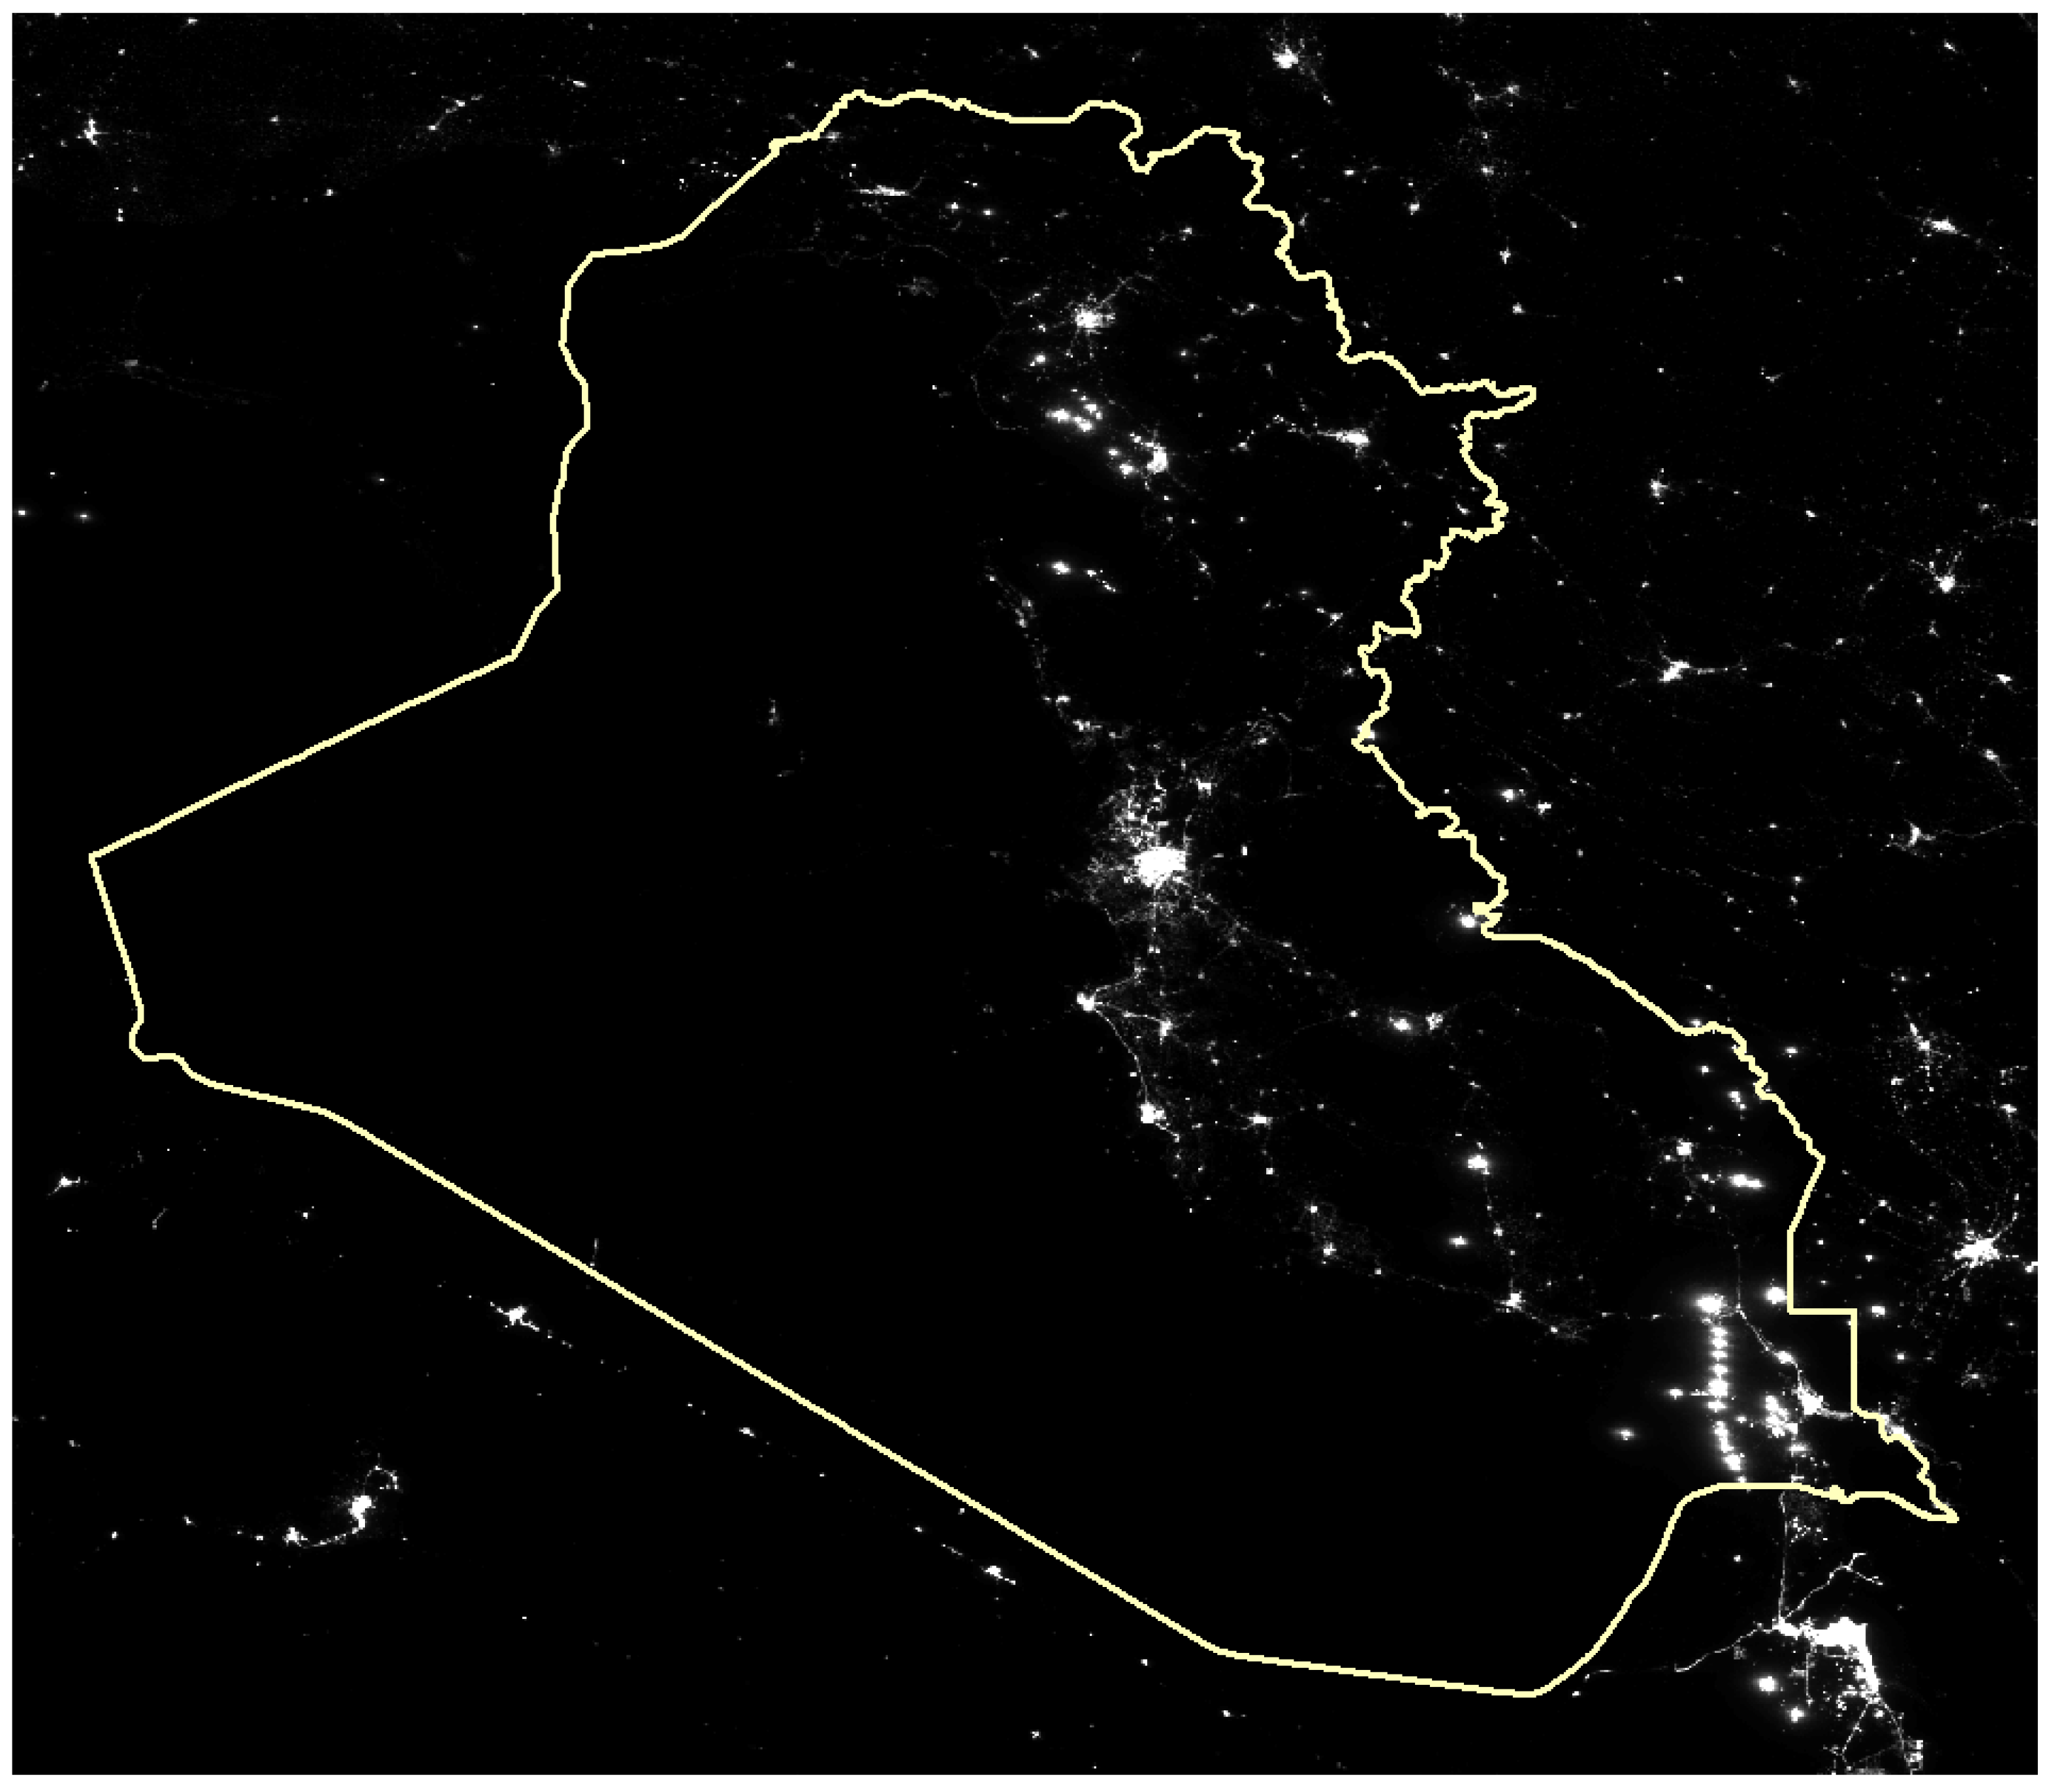
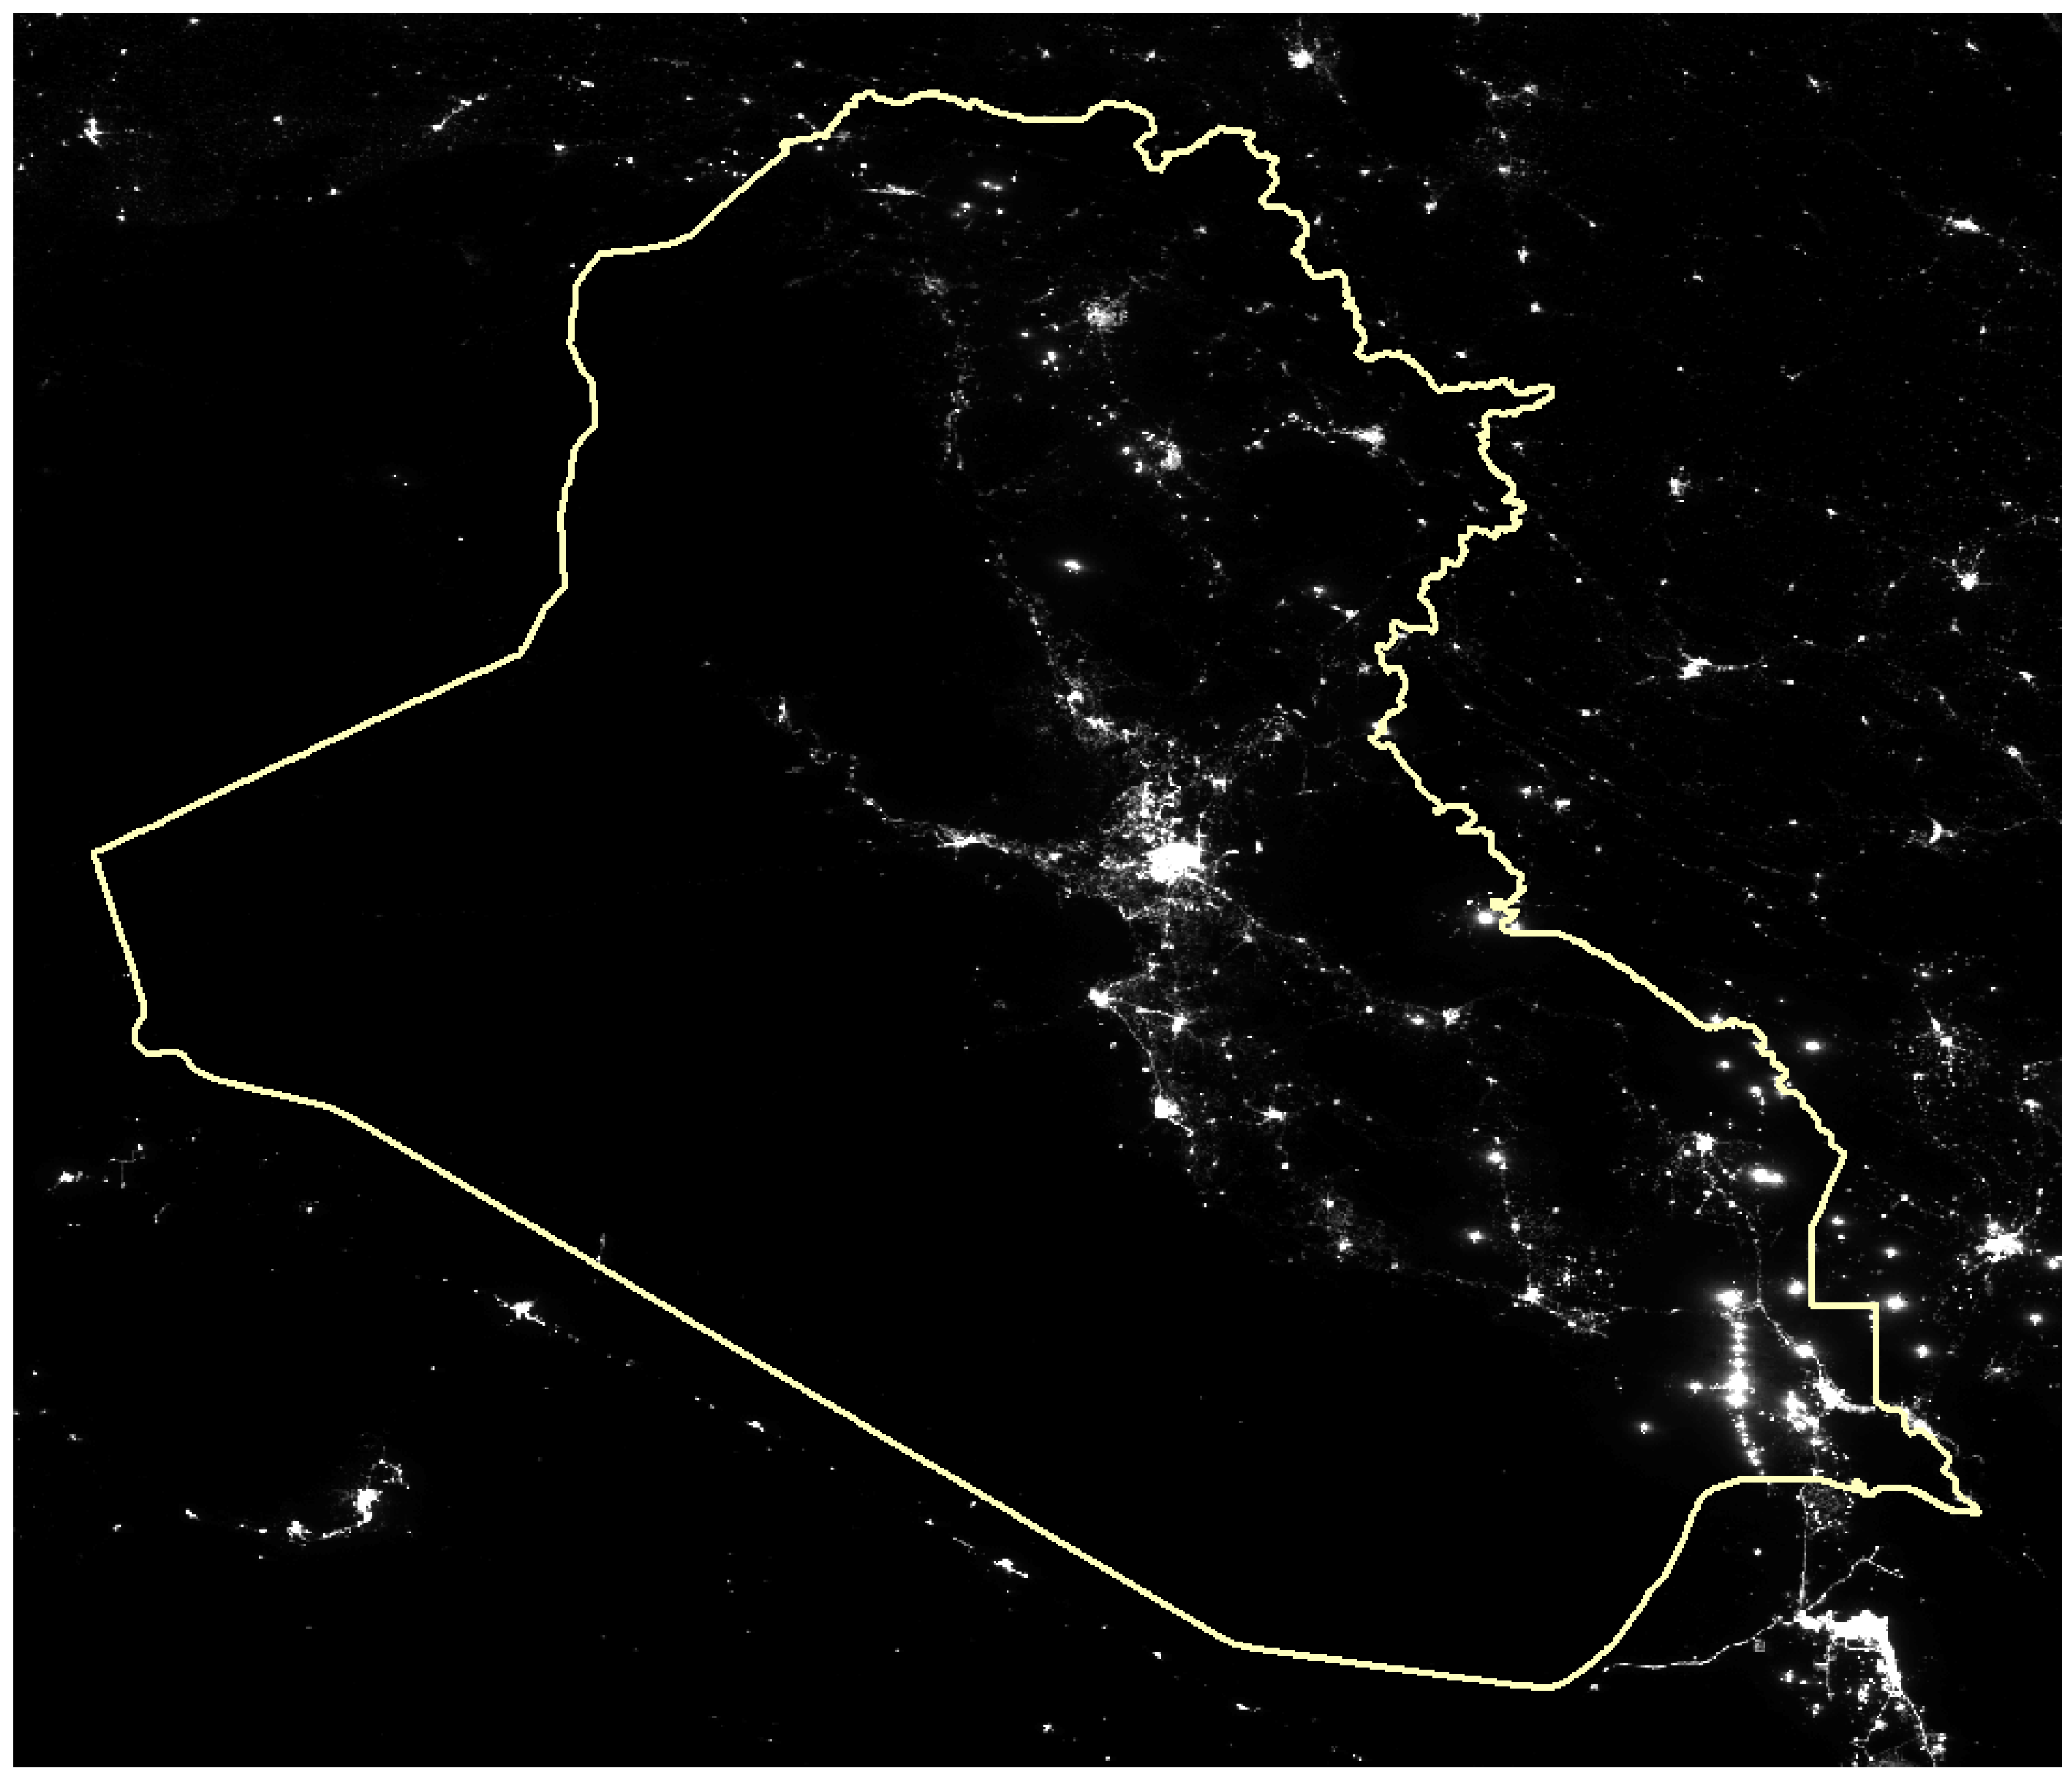
- Night-time light images. A total of 69 monthly night-time light images, acquired by VIIRS between April 2014 and December 2017 (Figure 2, Figure 3 and Figure 4), were downloaded from the National Geophysical Data Center (https://ngdc.noaa.gov/eog/viirs/download_dnb_composites.html)
- (3)
- A land cover map. Iraq’s Land Cover Map at 30-m resolution for 2010 was acquired from National Geomatics Center of China (http://globallandcover.com/GLC30Download/index.aspx).
2.2. Methods
2.2.1. Data Preprocessing
For convenient analysis of multi-temporal VIIRS images, spatial and temporal continuity of the images is necessary. However, data are missing or partly missing for 10 months between March 2014 and December 2017. These months are June 2012, February 2013, June 2013, June 2014, June 2015, October 2015, December 2015, June 2016, May 2017, and June 2017. There are eight months for which images in the adjacent months are available. Images from these months were interpolated by simply averaging the data from the two adjacent months using the following equation:
where , , and denote the radiance of ith pixel in (t − 1)th, tth, and (t + 1)th months, respectively.
For the missing data in May 2017 and June 2017, we used two simple linear interpolation equations to estimate the missing data:
where , , , and denote radiance of ith pixel in (t − 2)th, (t − 1)th, tth, and (t + 1)th months, respectively. In this analysis, (t − 2)th, (t − 1)th, tth and (t + 1)th months denote April 2017, May 2017, June 2017, and July 2017, respectively. The time series images were denoised so that some abnormal values were filtered out [49].
Iraq is an oil-rich country, and some regions are lighted by oil wells due to the blooming effect. At present, there is no effective method to remove the blooming effect of flaring gas from night-time light images directly. A practical way is to mask out the regions that are potentially impacted by the flaring gas. We developed a simple way to mask out the blooming effect. We set a threshold of 500 NanoWatt/(cm2 sr) to extract the flaring gas region. A distance of 10 km was used to generate a buffer zone from the extracted flaring gas region, and then the region and buffer zone were combined to generate boundaries of the regions impacted by the blooming effect. Using this method, some urban areas, contaminated by the flaring gas at night, were masked out and discarded for analysis.
2.2.2. Calculation of Sum of City Light and Night-Time Light Ratio Index
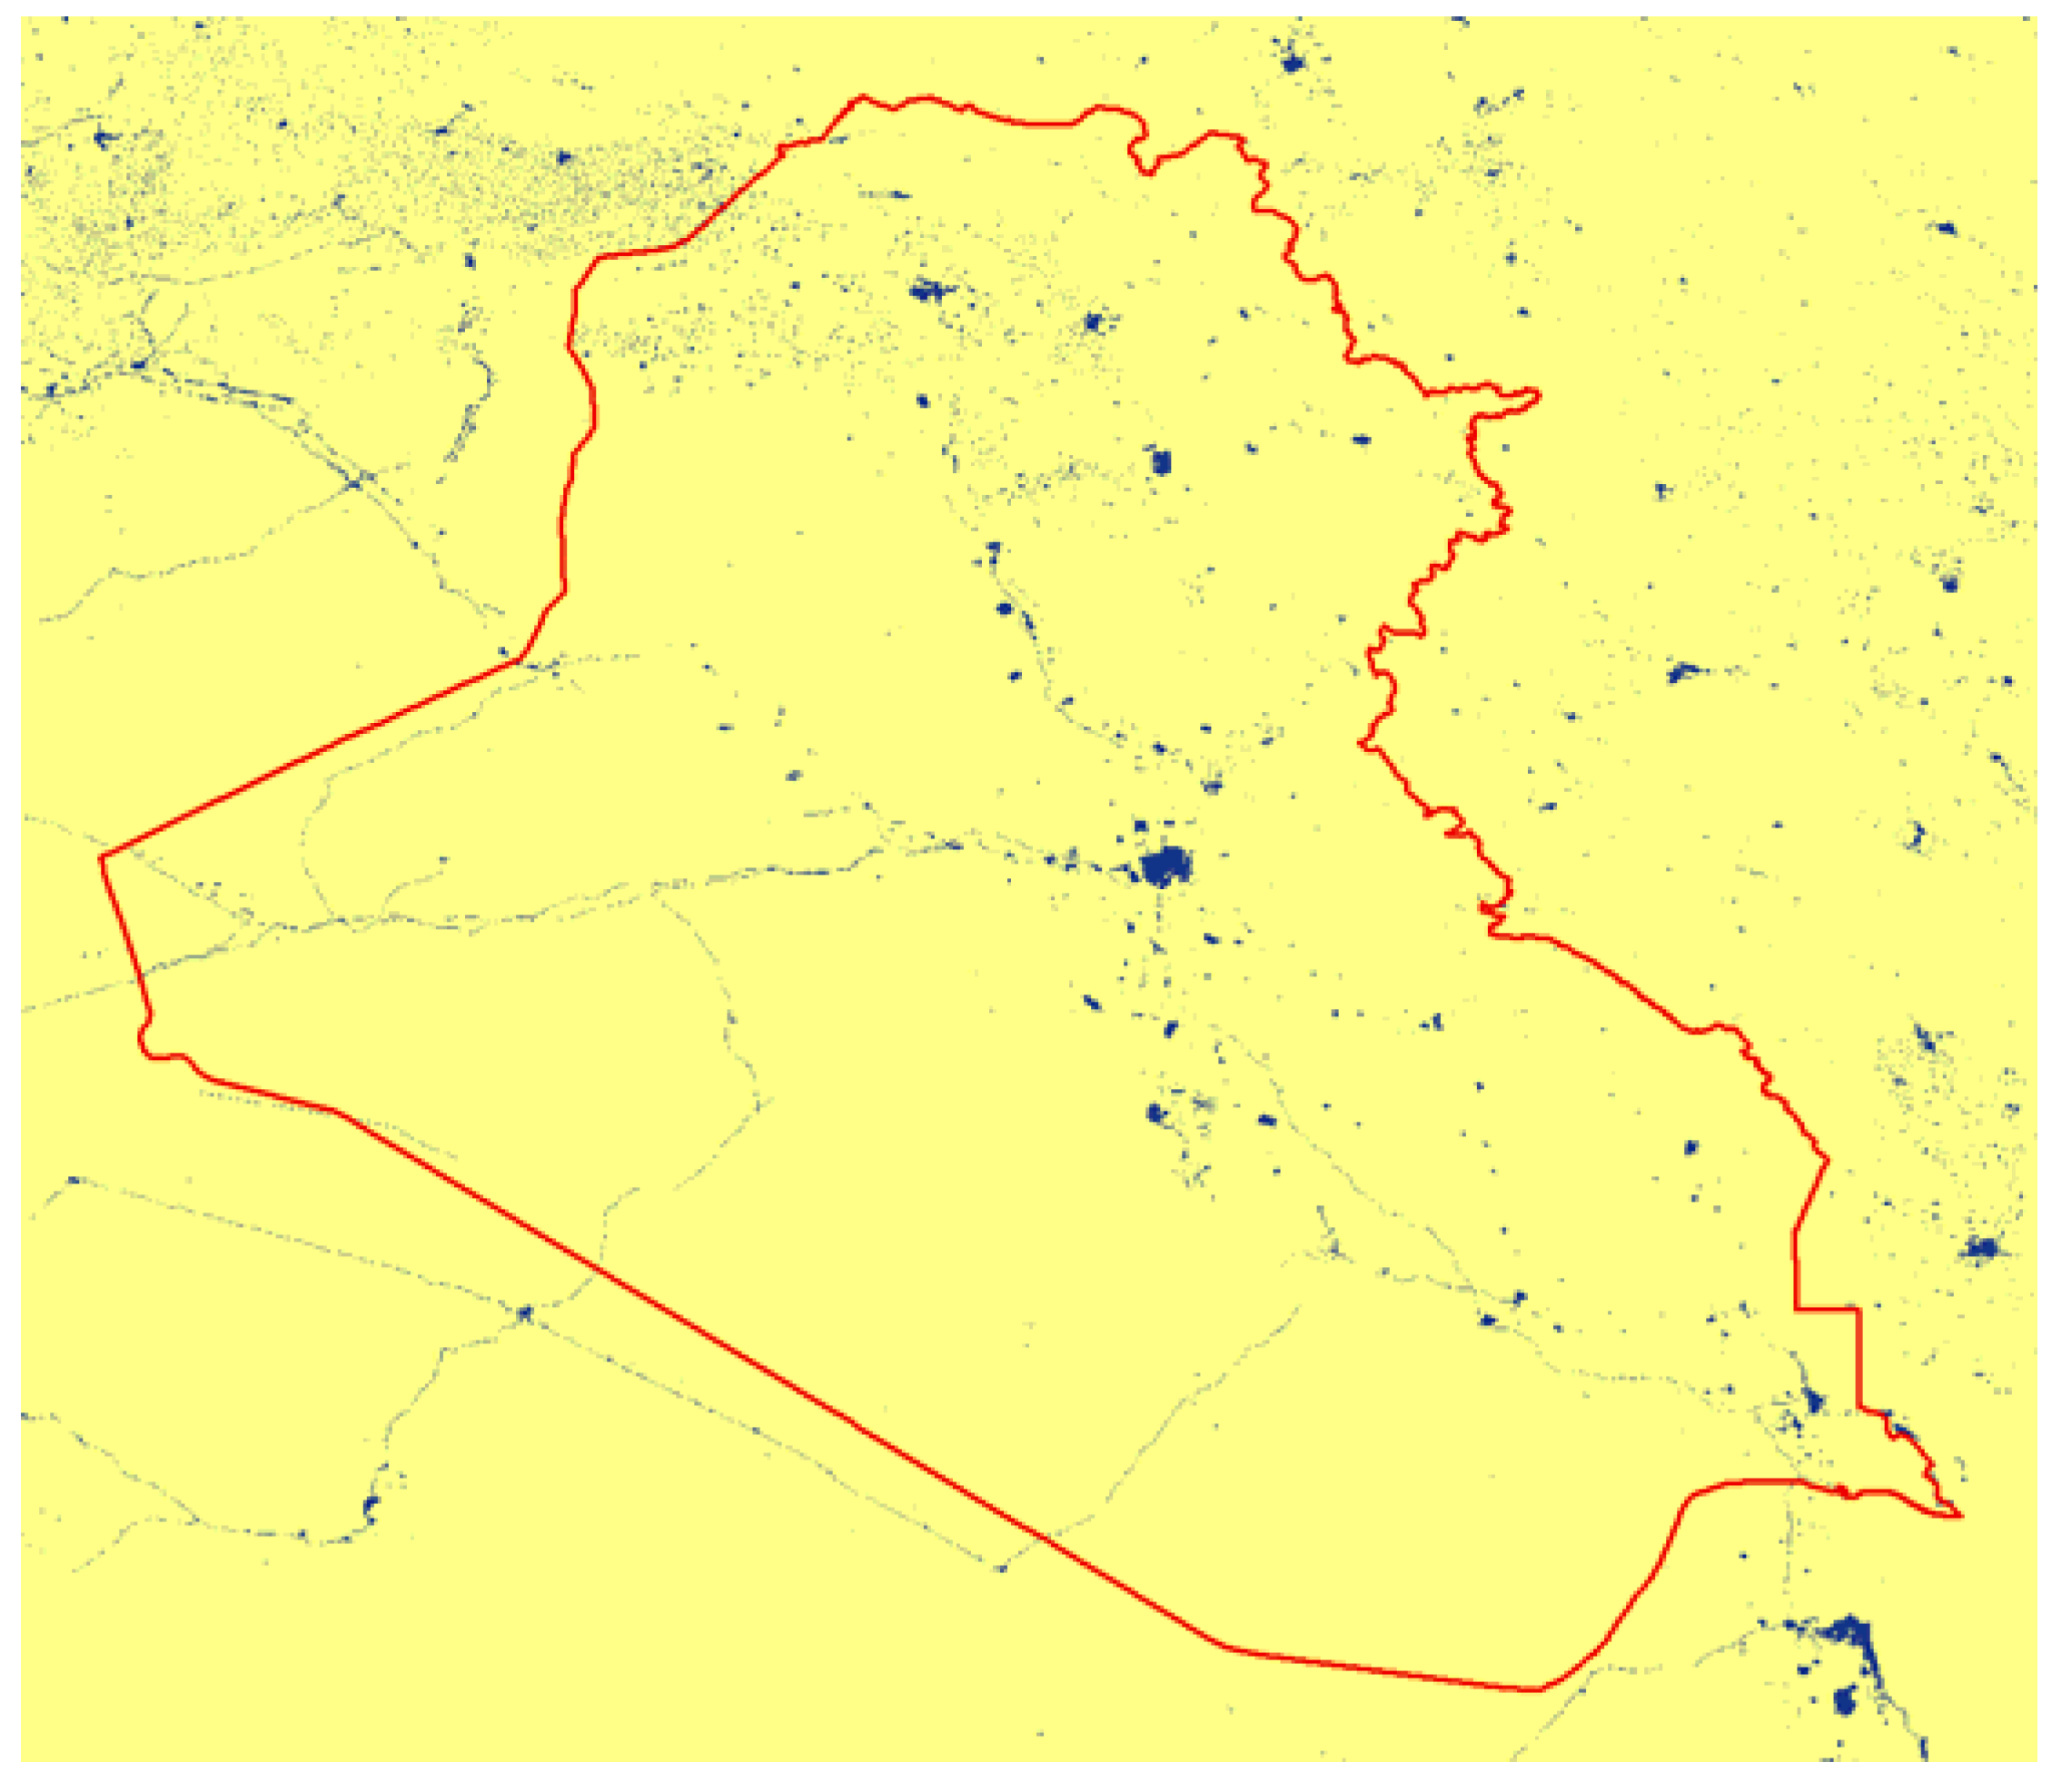
In this study, the sum of city light (SCL) is used to analyze city light dynamics. First, a built-up proportion map for Iraq is generated from the land cover map of Iraq by aggregating the built-up pixels to the resolution of VIIRS images. After that, a threshold of 0.05 is used to generate a built-up extent map (Figure 5) from the proportion map. Then, the sum of city light (SCL) is generated using the following equation:
where denotes radiance value of ith pixel of the VIIRS image, denotes whether the ith pixel belongs to the built-up area () or not (), and denotes whether the ith pixel falls into the mask of the flaring gas () or not (). This equation means the pixels, which fall into the urban area and out of flaring gas mask, are collected to calculate the SCL for a region.
For each region, the SCL values are calculated for all months, and then they are divided by the SCL value in the kth month to derive the Night-time Light Ratio Index (NLRI):
where and denote the SCL for ith and kth month, respectively, and denotes the night-time light ratio index for the ith month. In this study, the kth month is December 2013, which is before the ISIS invasion of Iraq. The NLRI has proved to be a stable index to represent the city light dynamics [32], and it will be used to analyze time series data in this study.
2.2.3. Detecting Darker Regions
Whether a region was darker than the pre-war level was potential evidence to reflect the impact of war on the region. The night-time light change in most of the Iraqi regions shows seasonal change patterns, which widely exist in different countries due to a variety of factors including the seasonality of land surface reflectance, the plant phenology, or the atmospheric component [33,50]. Considering the seasonality, following steps are used to judge whether there was less night-time light in a region than in the pre-war period, and if yes, how much light declined in the darkest period compared to the pre-war period.
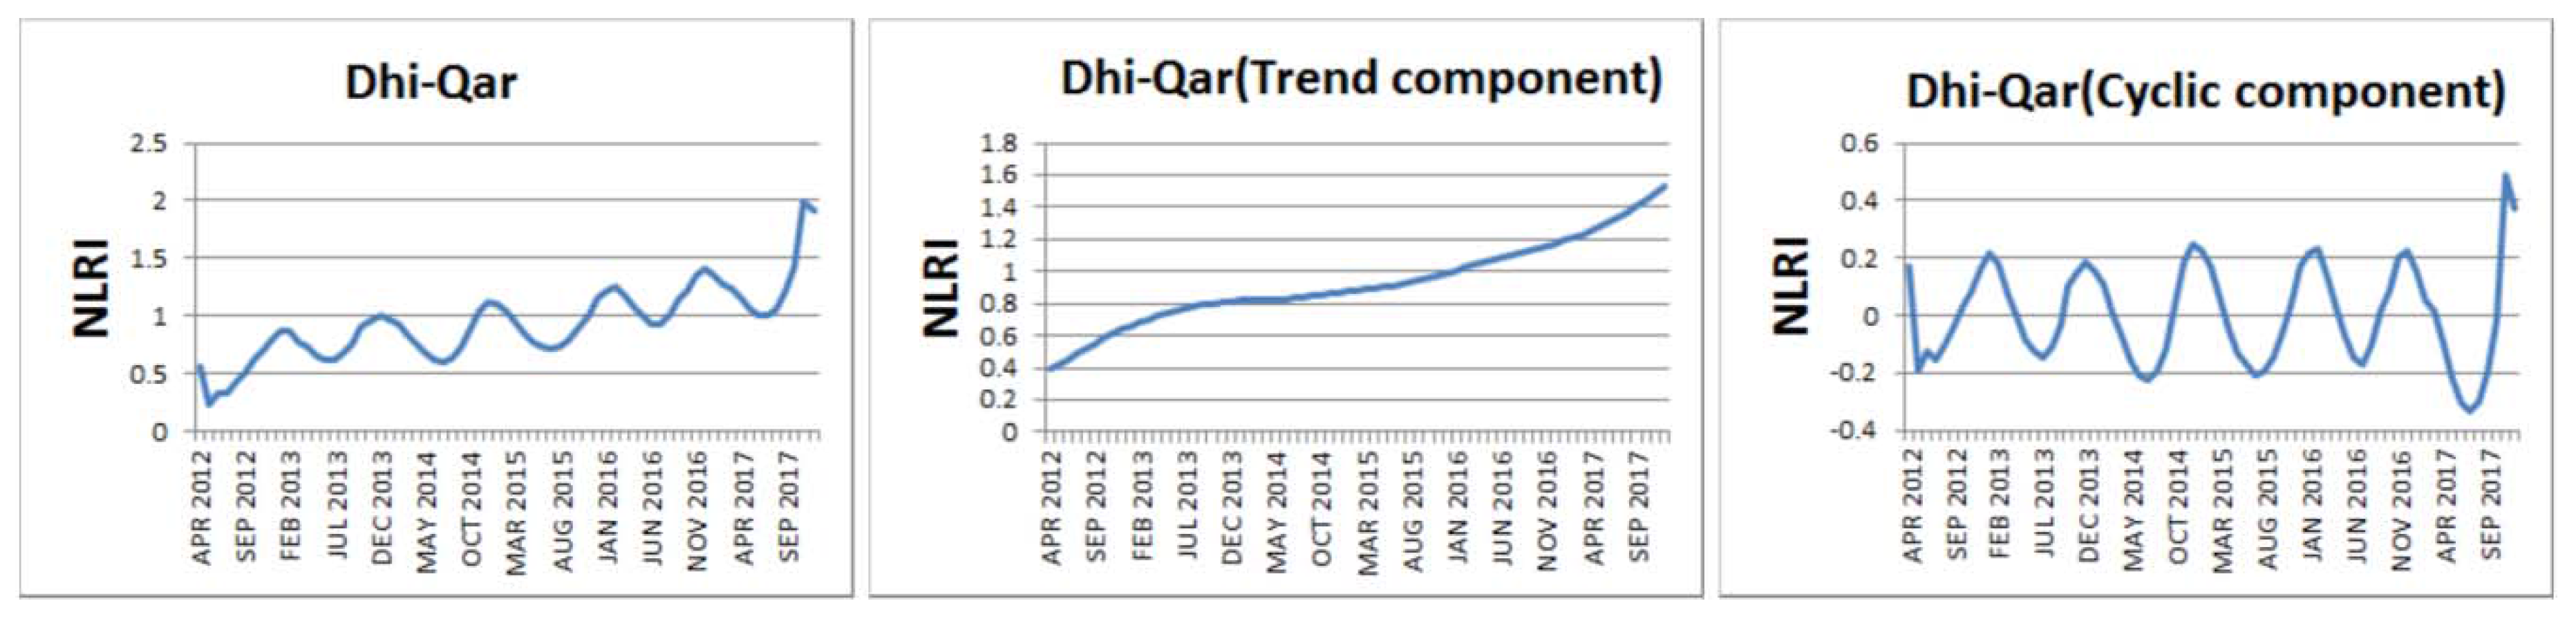
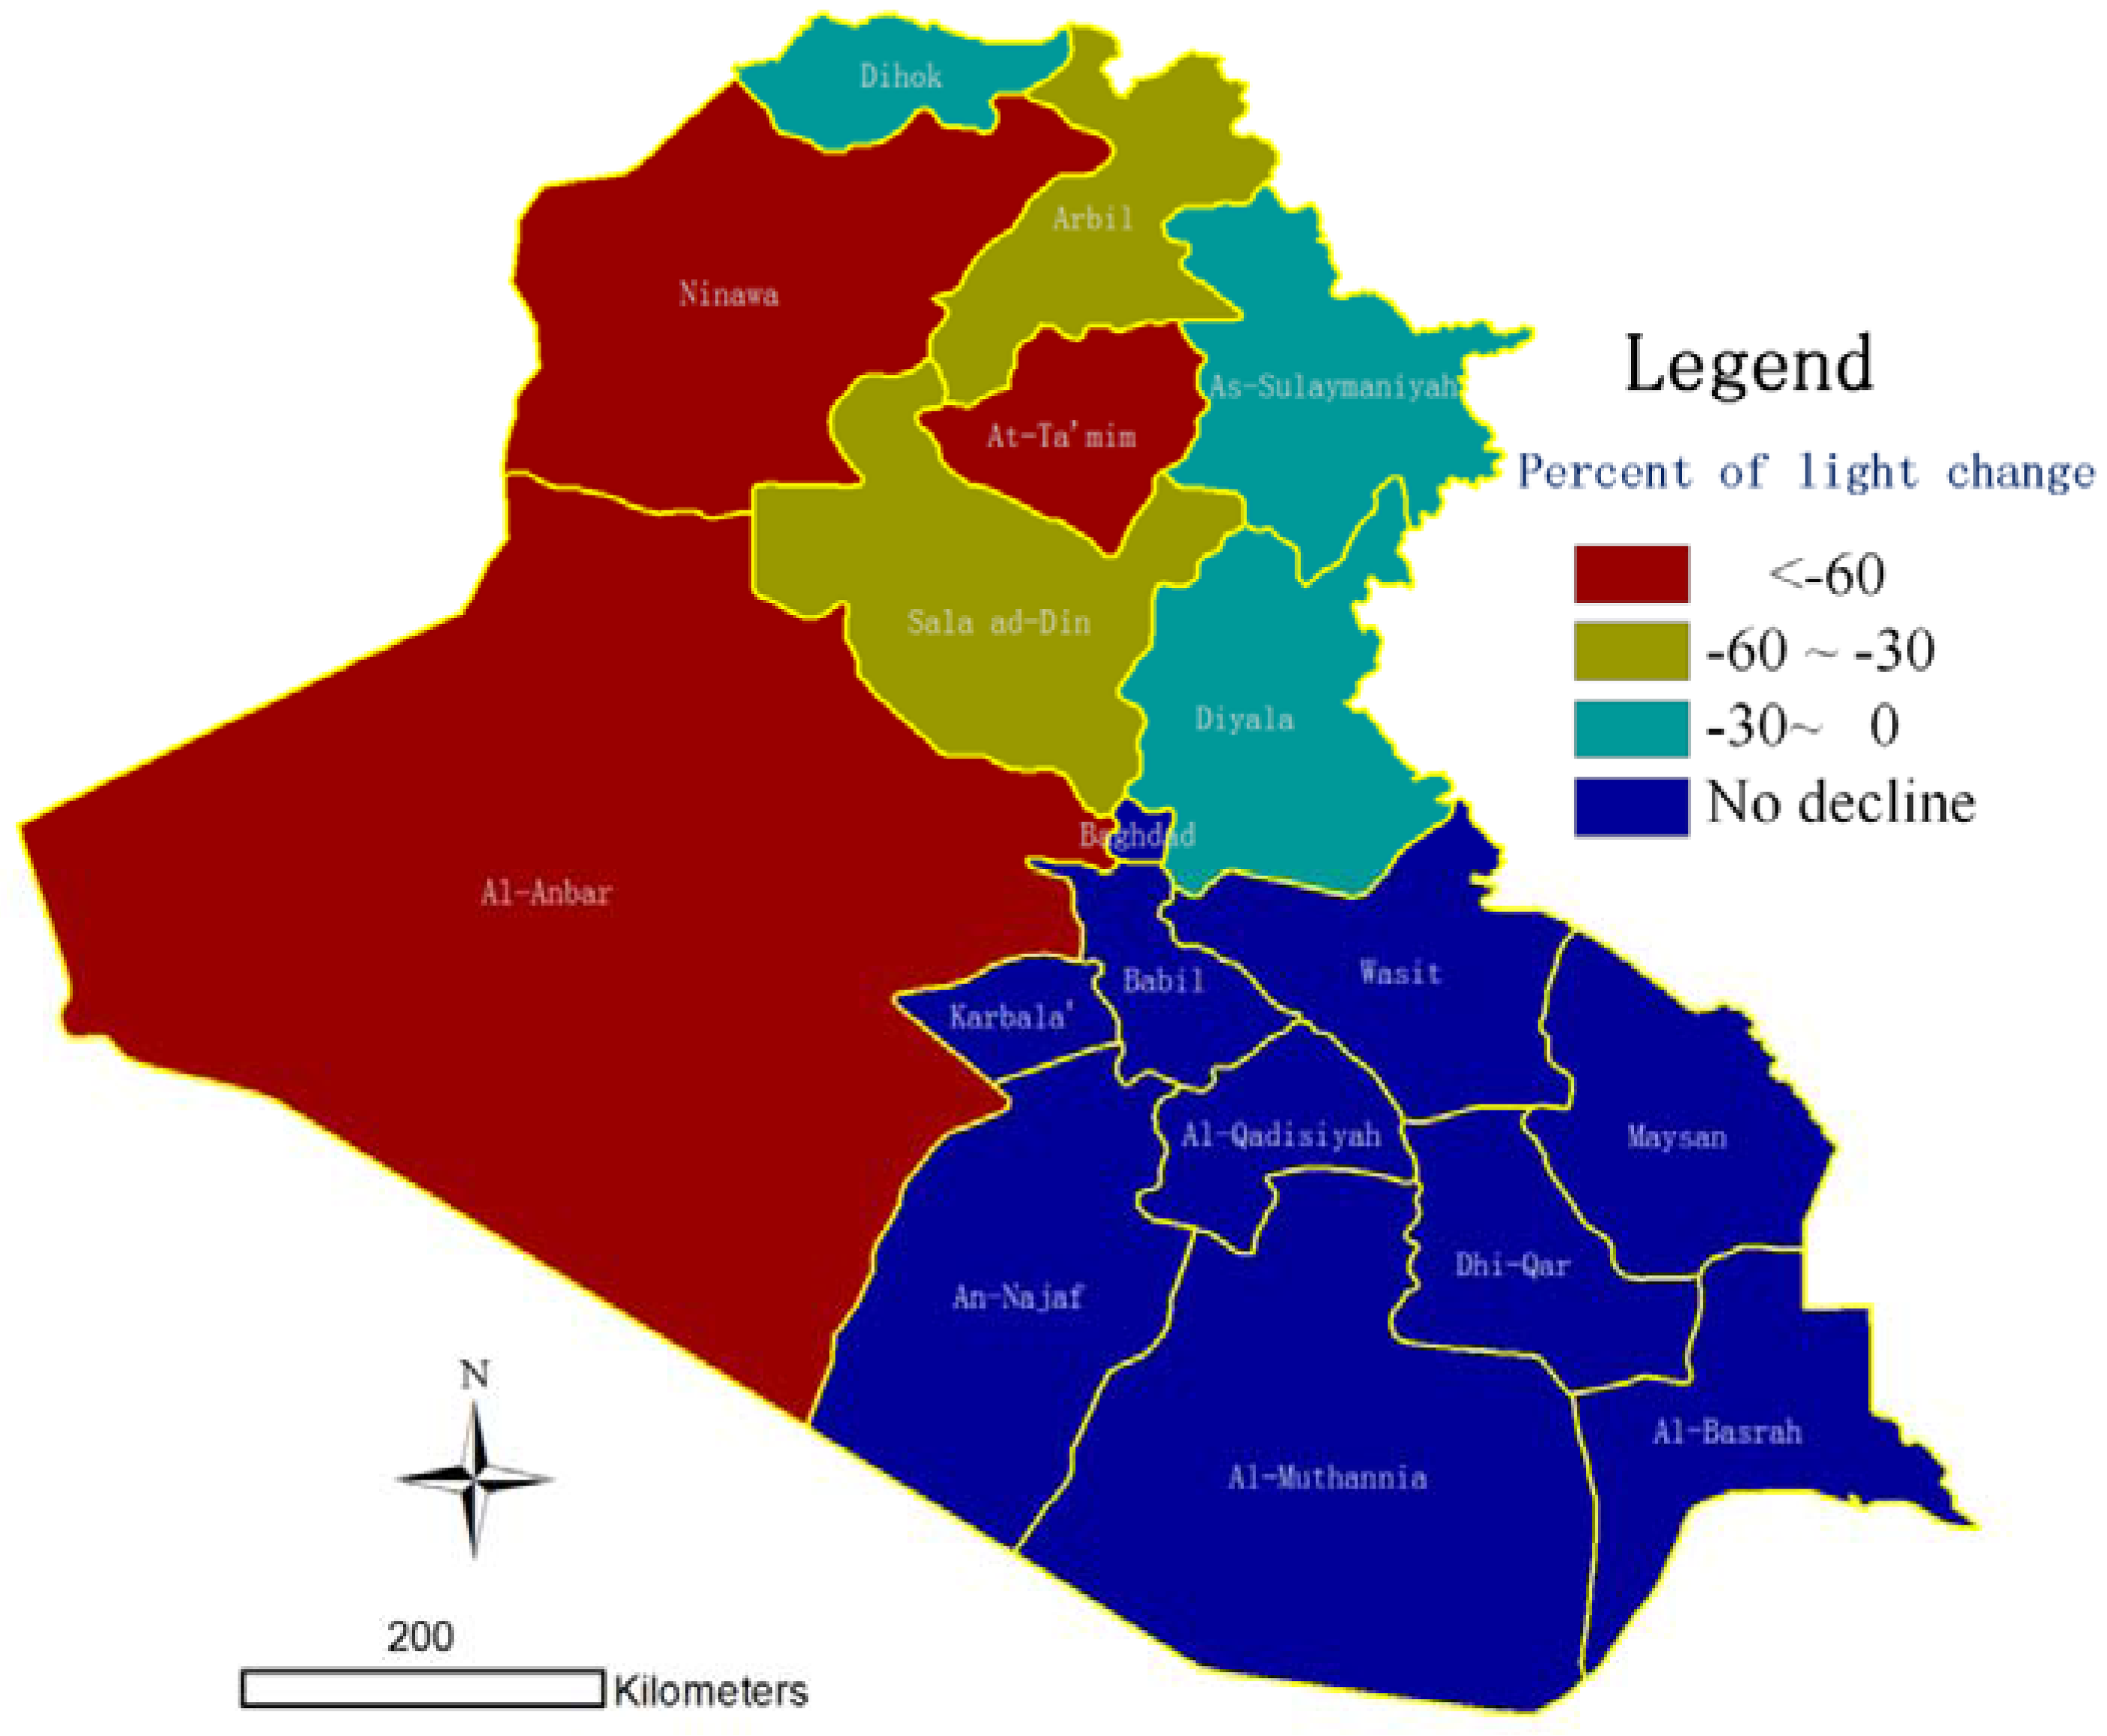
NLRIi, which is the time series NLRI data for the ith region, is decomposed into the cyclic component ci and trend component ti using the Hodrick–Prescott filter. The Hodrick–Prescott filter has been widely used in time series economic data analysis [51] and has been used in remote sensing data analysis [52]. For the extracted trend component data ti, the minimal value during December 2013 to December 2017 was extracted as mi, and the value for December 2013 is ni. If ni > mi, it indicates the region has a darker period during the war than the pre-war level, and the ratio of light decline is calculated as (mi − ni)/ni, otherwise, there is no darker period during the war.
2.2.4. Annual Change Rate of Night-Time Light
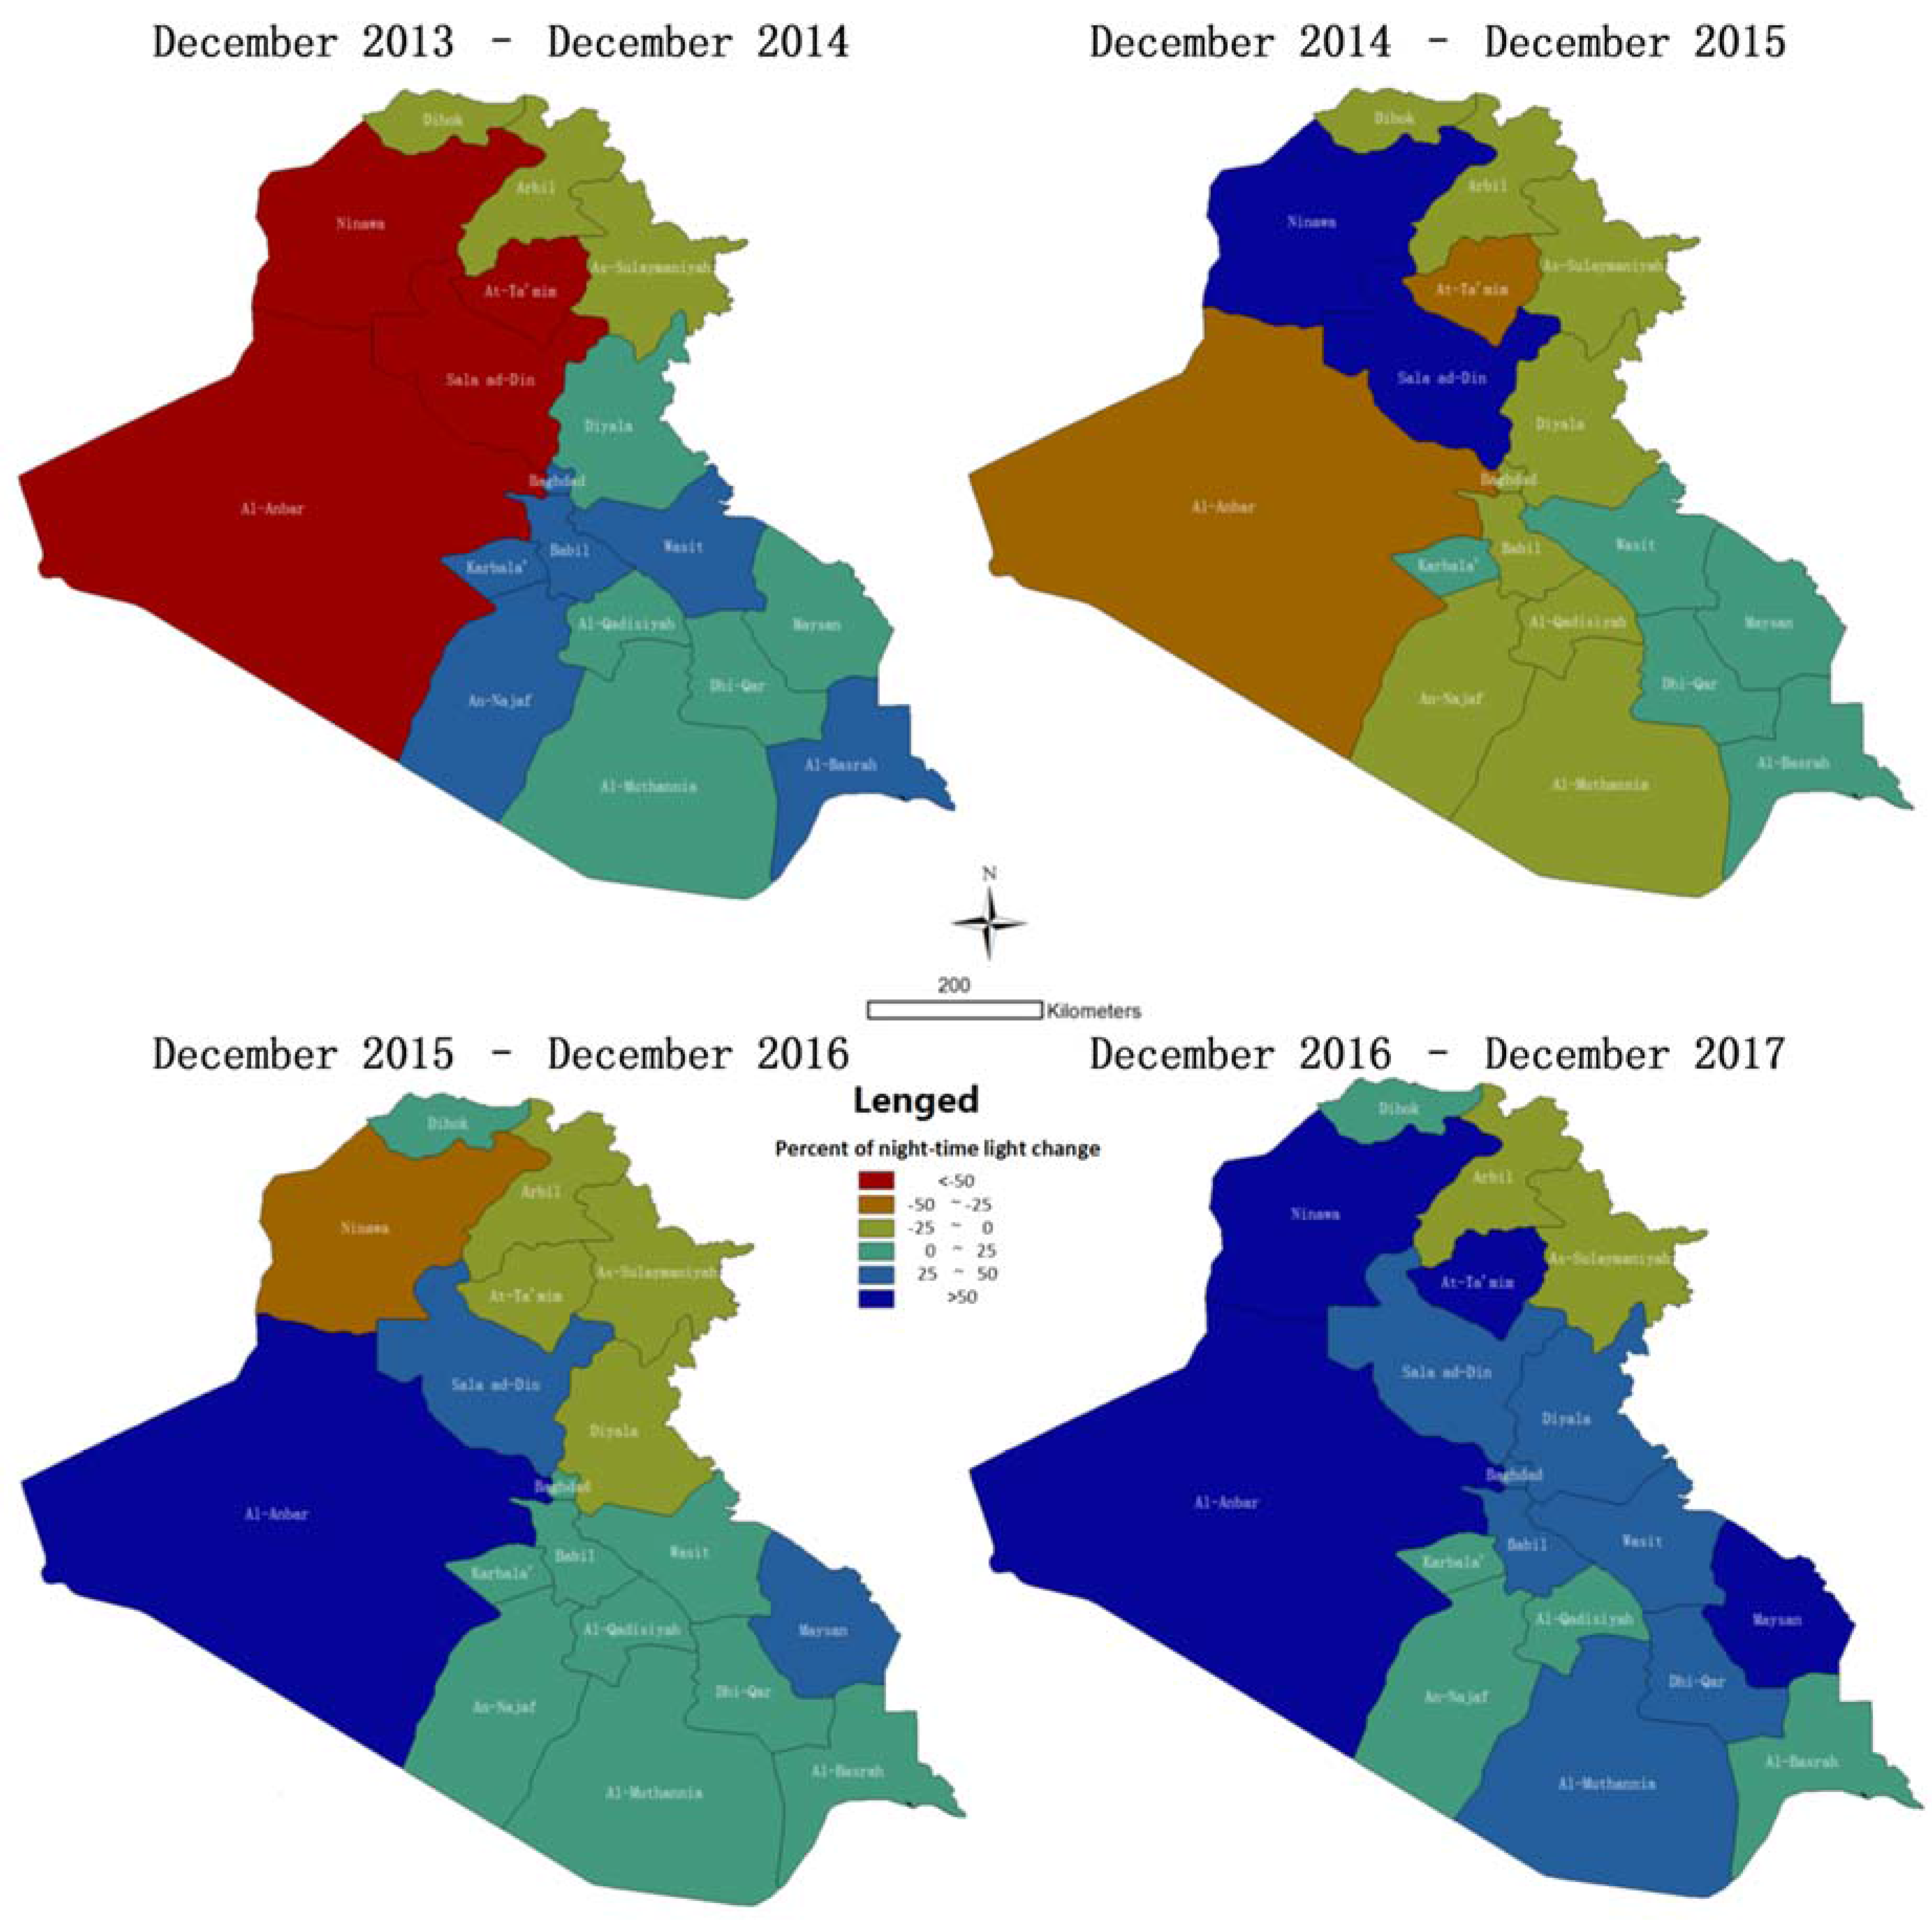
To show the temporal pattern of provincial night-time light over time on maps, we calculated the night-time light change rate of each province for each year by calculating the SCL change rate for December 2013 to December 2014, December 2014 to December 2015, December 2015 to December 2016, and December 2016 to December 2017.
2.2.5. Multiscale Analysis of Night-Time Light Dynamics
In this study, we analyze the night-time light dynamics at the provincial and city scales. In the provincial analysis, we grouped the 18 Iraqi provinces into three types: (A) Northern Iraq, formerly occupied or partly occupied by ISIS; (B) Southern Iraq, which includes Iraqi central government-ruled regions and was never occupied by ISIS; and (C) the Kurdish Autonomous Region. Although the Kurdish Autonomous Region is also located in the north, this is a special area recognized by the international community. Table 1 provides the classification of these regions.
In addition to analysis at the provincial scale, we applied a city-level analysis to derive detailed information about change in night-time light. The majority of the formerly ISIS-controlled Iraqi territory is located in the three provinces, Al-Anbar, Sala Ad-Din, and Ninawa. A previous study selected 13 major cities in these provinces for time series analysis to evaluate the impact of conflict in the region [32]. In our study, we selected 12 cities out of the 13 cities, removing Baiji, because the image patches for that city are contaminated by the strong blooming effect from the oil refinery in the city. The 12 cities, all located in Northern Iraq, are Ramadi, Tikrit, Ad-Dawr, Al-Qa’im, Ar Rutba, Baghdadi, Fallujah, Haditha, Hīt, Samarra, Tal Afar, and Mosul (Figure 1). To highlight the night-time light dynamics in these 12 cities, we added a control group of cities, which are located in the Southern Iraq and were never occupied by ISIS. These cities are Najaf, Al Diwaniyah, Al-Hillah, Samawah, Afak, and Shamia (Figure 1). For each city, except Mosul, a circular buffer zone with a radius of 5 km was generated. For Mosul, the radius was set to 15 km because of the city size. Thus, each city has an associated region for calculating NLRI.
3. Results
3.1. Night-Time Light Dynamics by Provincial Analysis
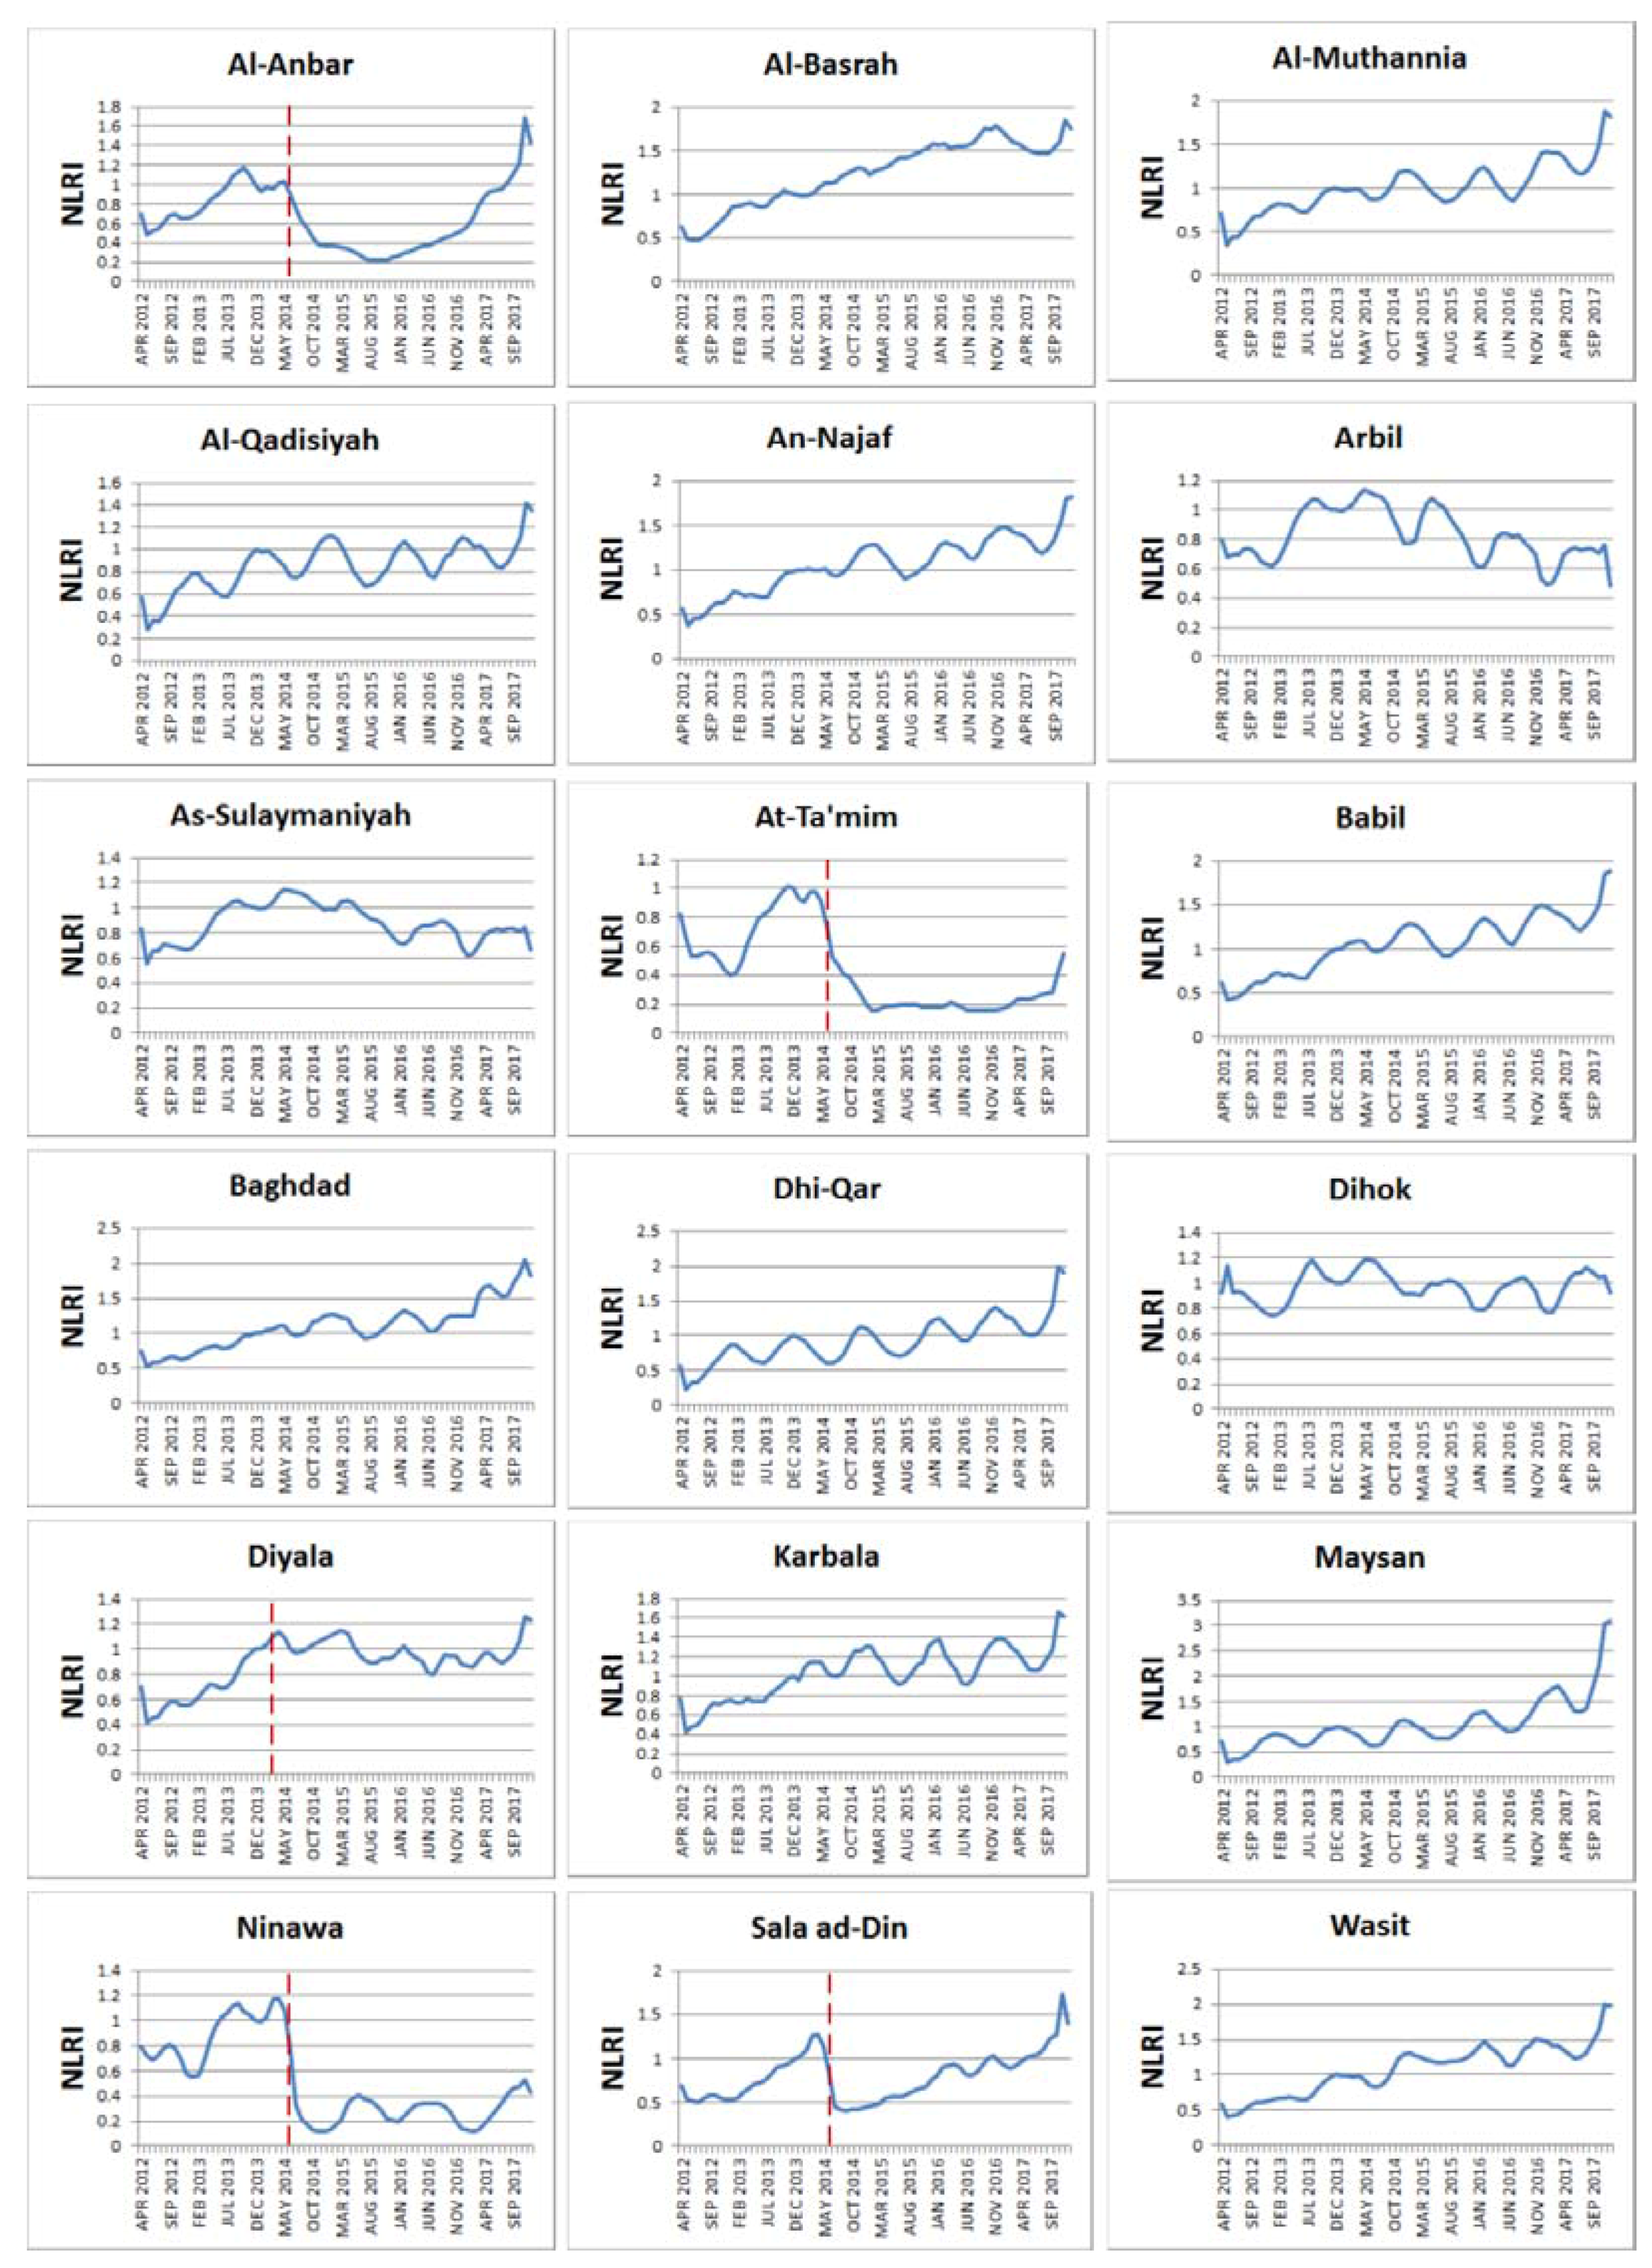
For all Iraqi provinces, Figure 6 and Table 1 provide the time series NLRI, and the night-time light dynamics is clearly shown. In addition, we extracted the region that had a darker period during the conflict, deriving decomposition components (Figure 7) and results (Figure 8). We can see that Figure 6 and Figure 8 are consistent, with the provinces of Northern Iraq and the Kurdish Autonomous Region having darker periods after December 2013.
We find that all provinces in Northern Iraq and the Kurdish Autonomous Region became darker after the war began, while all the provinces in Southern Iraq continuously became brighter. For all the provinces in Southern Iraq, it is interesting to see that night-time light showed a stable increase, indicating the region was not severely affected by ISIS. For example, the night-time light from Al-Basrah in December 2014, December 2015, December 2016, and December 2017 increased by 29%, 57%, 71%, and 75%, respectively, as compared to that of December 2013. Among the five provinces of Northern Iraq, Al-Anbar, At-Ta’min, Ninawa, and Sala Ad-din showed a dramatic decline in night-time light during the conflict, losing 63%, 73%, 88%, and 56%, respectively, from December 2013 to December 2014, which is consistent with the events, as ISIS occupied many cities, towns, and villages in these four provinces during 2014 [53,54].
Figure 9 shows the annual change rates of night-time light for all provinces. Figure 9 shows that in 2014, the light declined in Northern Iraq, except Diyala, with the other four provinces losing more than 50%, while the night-time light only decreased slightly in the Kurdish Autonomous Region, and the light increased in Southern Iraq. In 2015, the light change pattern is much more complicated: the ISIS-invaded Ninawa and Sala ad-Din provinces show night-time light return, while the rest of Northern Iraq and the Kurdish Autonomous Region continued to lose light. We also found that four provinces in Southern Iraq had a slight loss of light. In 2016, the light in Al-Anbar and Sala ad-Din returned substantially, but the amount of light in Ninawa dropped dramatically again, and the light in all provinces in Southern Iraq increased. In 2017, nearly all the provinces in Iraq had an increase in light, with the exceptions of Arbil and As-Sulaymaniyah in the Kurdish Autonomous Region. In summary, the light in Southern Iraq generally increased, with minor fluctuations in some provinces in 2015. The light in Northern Iraq declined most dramatically, but also experienced a strong return, as the electricity supply fluctuated. Meanwhile, the amount of light in the Kurdish Autonomous Region showed a general decline.
3.2. Night-Time Light Dynamics by City Analysis
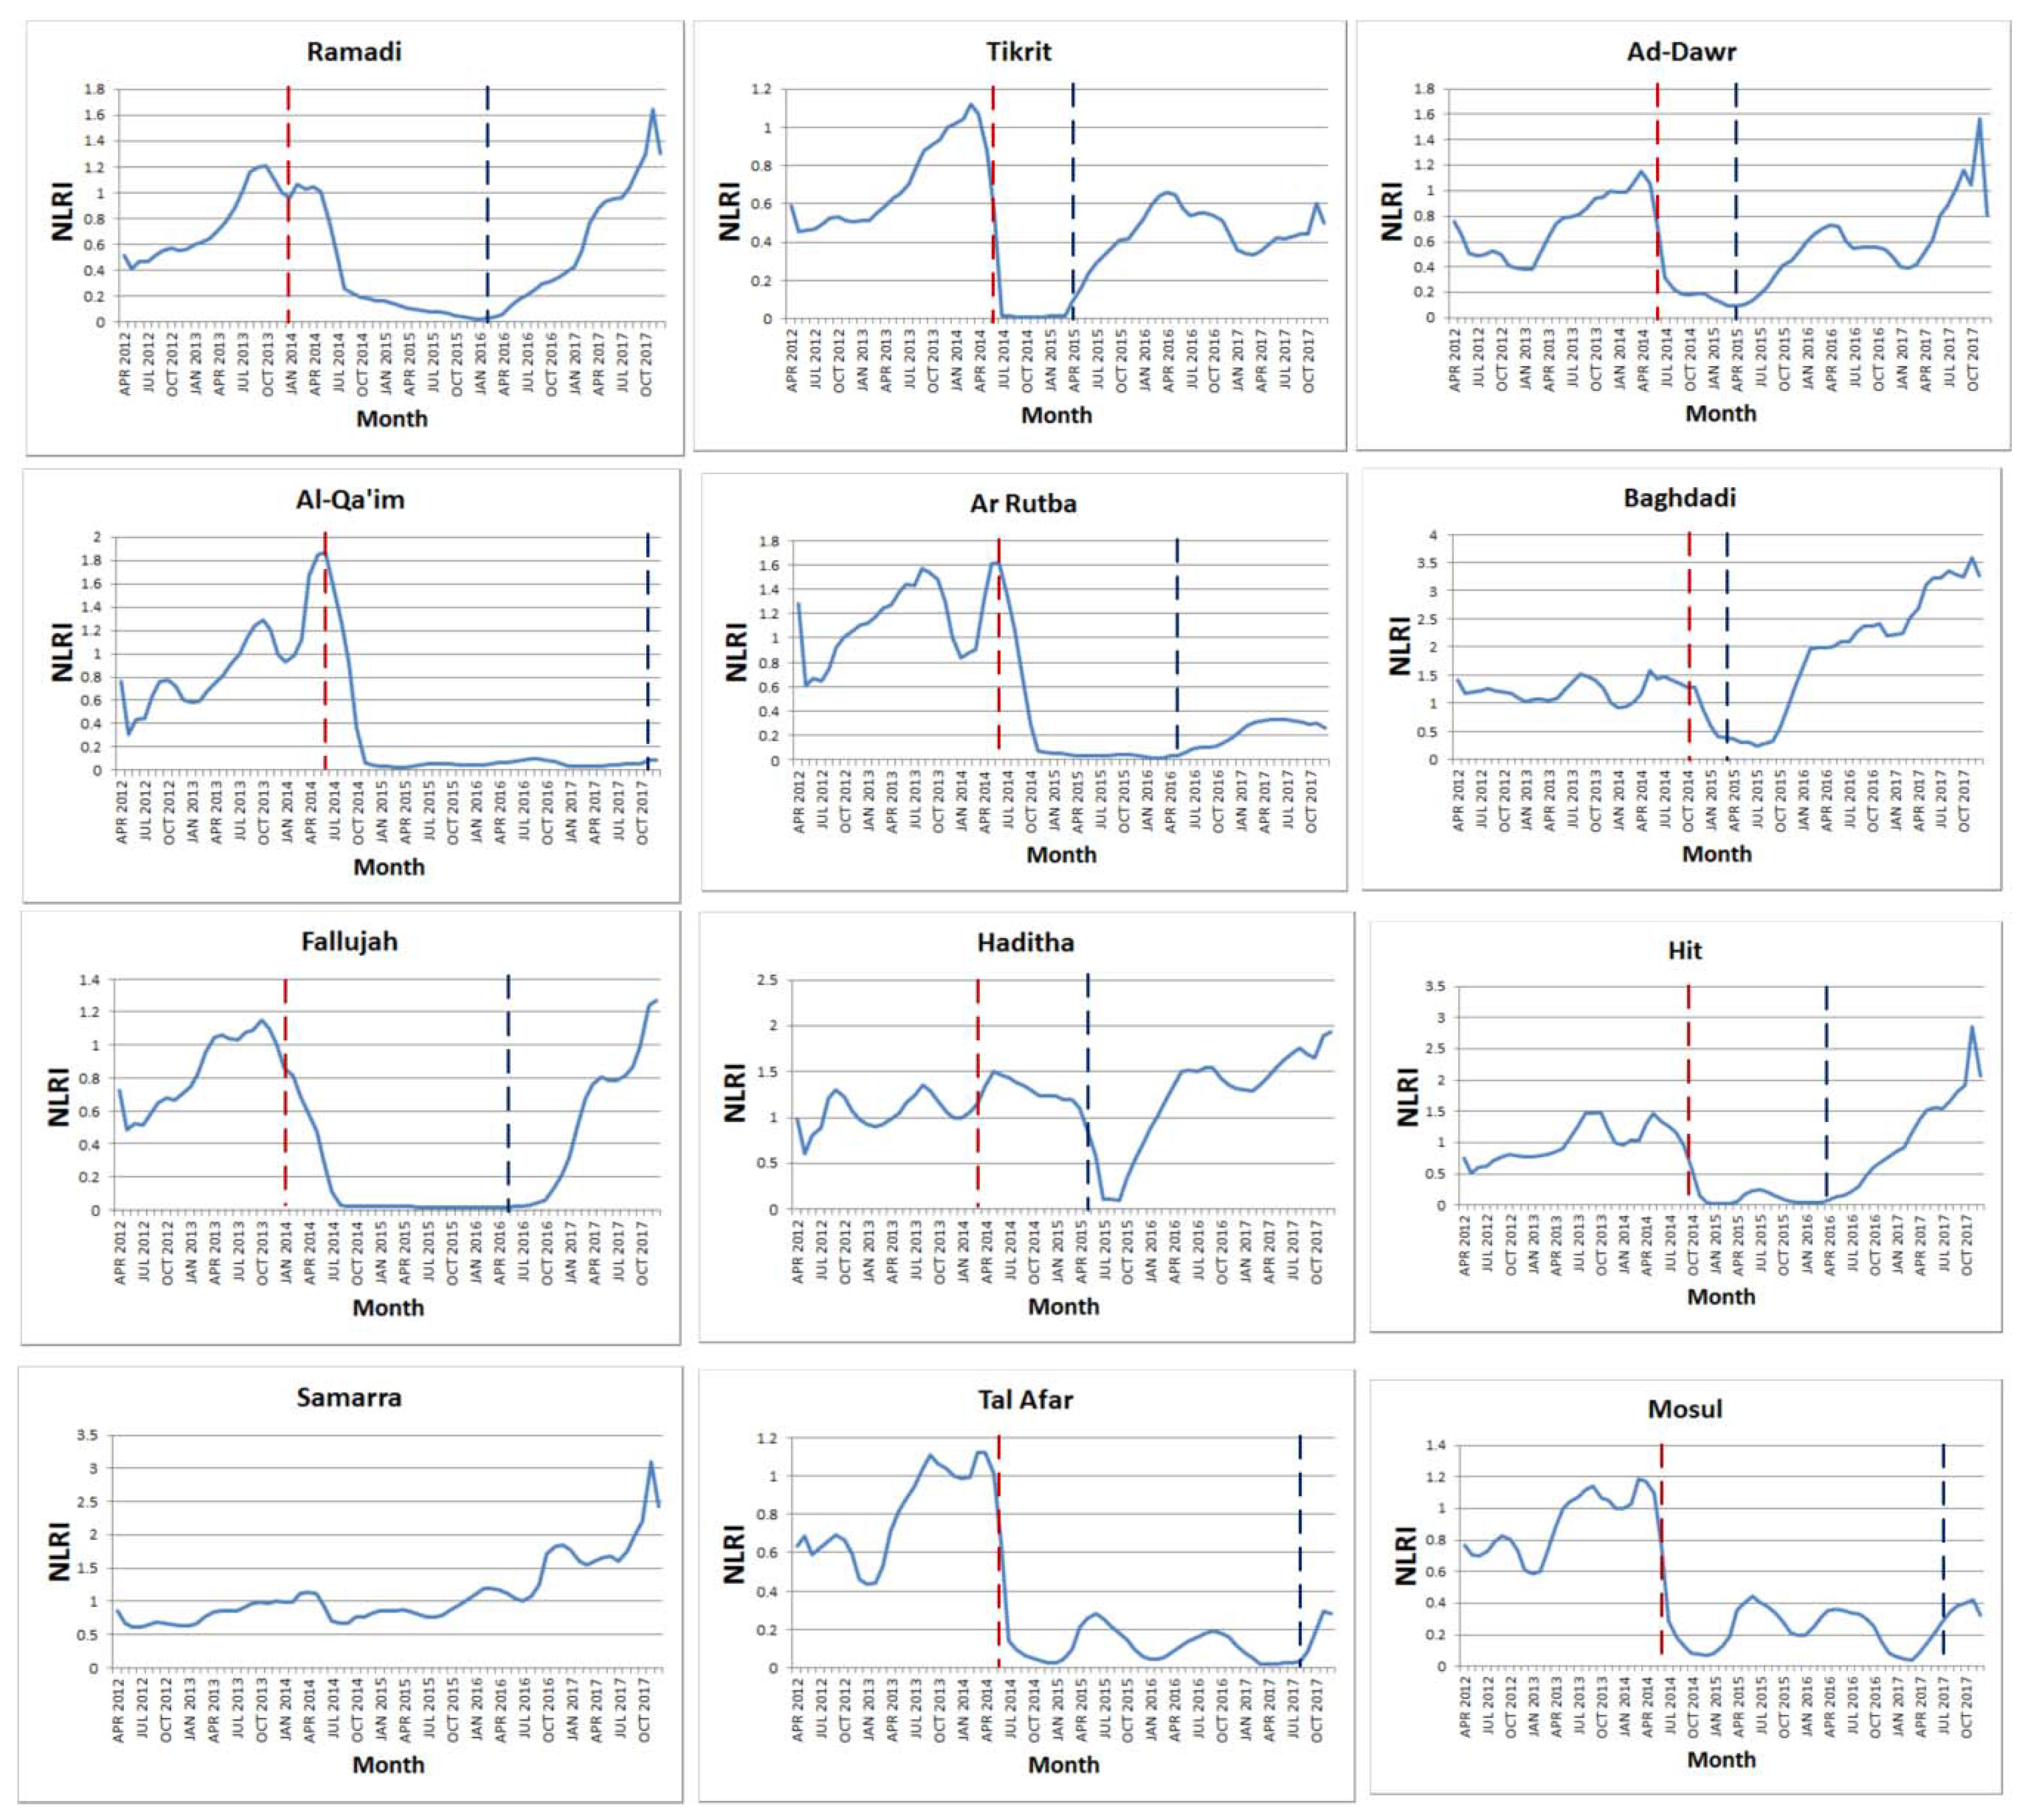
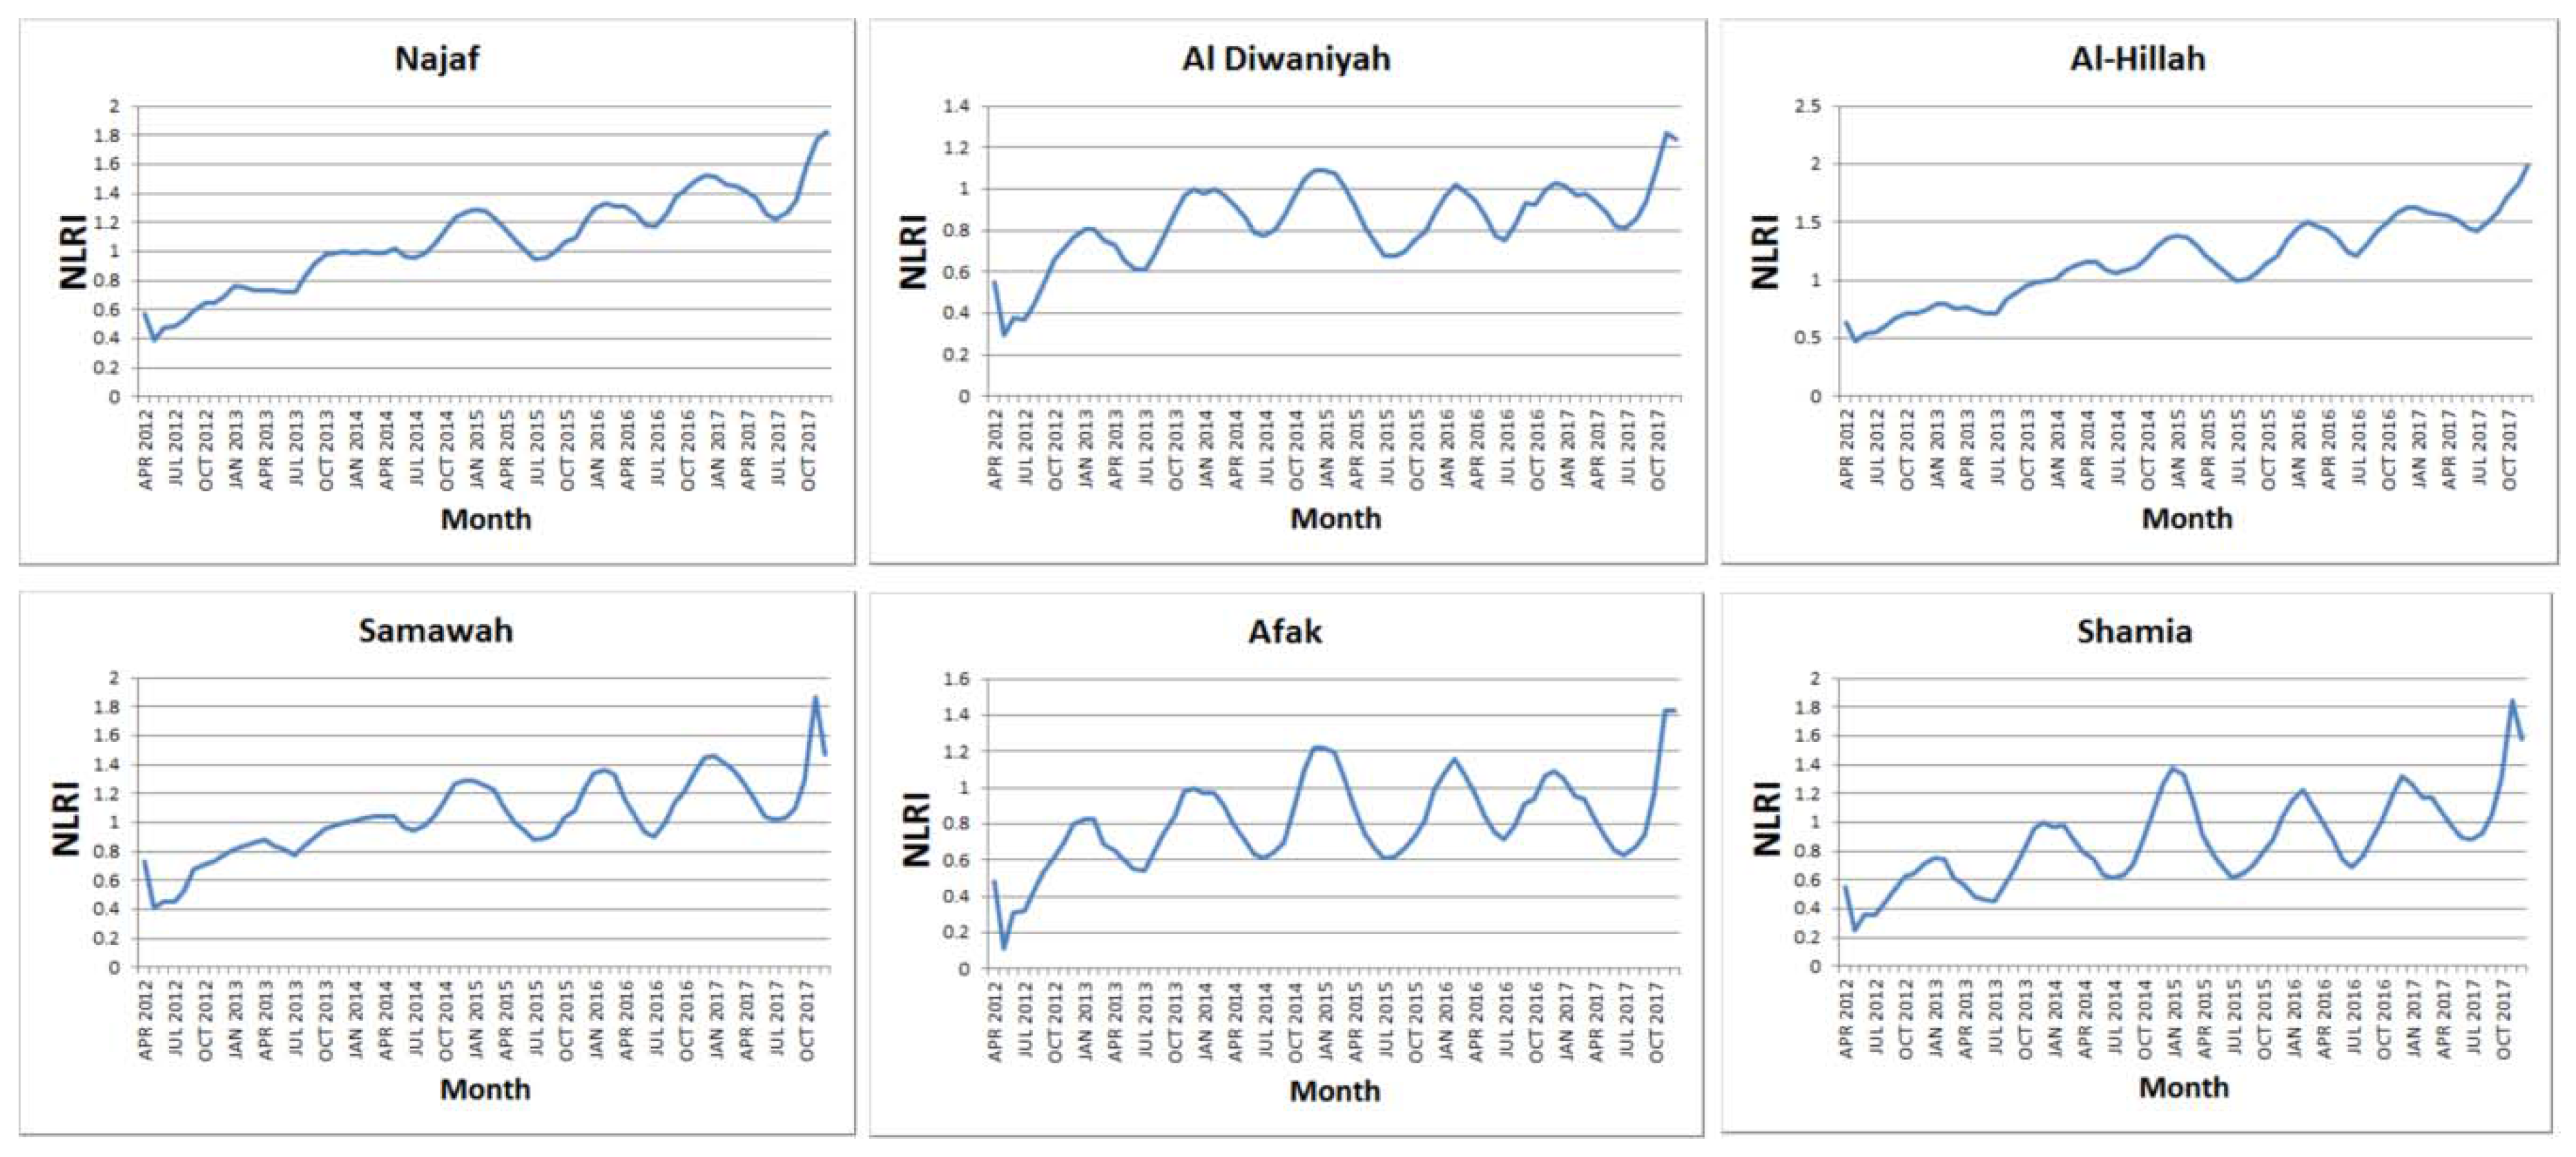
Figure 10 and Figure 11 provide the NLRI curves for the 12 selected cities in Northern Iraq and six selected cities in Southern Iraq, respectively. Table 2 provides the relative SCL for annual change of all 18 cities. We found that nearly all the selected cities in Northern Iraq experienced a sharp decline in night-time light. The most extreme cases are Tikrit, Al-Qa’im, Ar Rutba, Fallujah, Hit, Tal Afar, and Mosul which lost 100%, 96%, 94%, 98%, 97%, 98%, and 94%, respectively, between December 2013 and December 2014. The only exception is Samarra, which was controlled by the ISF all the time, and did not show much decline in light during all the periods. It is interesting to see from Table 2 that Baghdadi did not experience much decline of light, even though the decline is very clear in Figure 10, indicating that the short term change is sometimes missed when calculating the annual change. For the six selected cities in Southern Iraq, the night-time light shows stable or stably increasing patterns which are different from those of Northern Iraq.
4. Discussion
4.1. Comparison with Previous Study
A previous study analyzed the night-time light dynamics in 13 cities during the 2014 Northern Iraq insurgency and found that the ISIS-controlled cities fell into darkness [32]. This study is a significant extension of that previous work, extending the spatial extent to the entirety of Iraq and the temporal extent to six years. This provides a full picture of the night-time light change before and during the Iraqi Civil War as well as during reconstruction.
4.2. Patterns of the Night-Time Light
At the provincial level, Figure 8 shows that all the provinces in Northern Iraq and the Kurdish Autonomous Region experienced periods during the war that were darker than the pre-war level, while Southern Iraq did not have such periods, although there was a minor decline in night-time light during some months for some provinces in this region. Among all the provinces in Northern Iraq and the Kurdish Autonomous Region, Al-Anbar, Ninawa, and At-Ta’min experienced the most severe decline in night-time light. It is not surprising to see that night-time light in Northern Iraq declined dramatically after ISIS occupation in 2014. Furthermore, these regions became brighter with the return of the electricity supply after the ISF recaptured them. Our results also indicate that the electricity supply, which is an important economic indicator, remained well developed in Southern Iraq during the civil war. Moreover, we found the night-time light in Kurdish Autonomous Region continuously declined from 2014, indicating electricity shortages in this region. As the international community cannot access the economic data for the region [55], night-time light data provides a new perspective on socioeconomic dynamics in the Kurdish Autonomous Region.
In fact, in contrast to the popular impression that all of Iraq is very dangerous due to ISIS, Southern Iraq is no more dangerous than a normal Arabian country [56]. While Northern Iraq was suffering from the war, Southern Iraq remained under stable development; the electrical capacity of Iraq increased from 10,000 MW to 13,000 MW between 2013 and 2016 [55,57]. Furthermore, annual oil production also increased steadily [58] as most of the oil wells are far from ISIS-controlled areas [59]. In addition, Southern Iraq was supplied with more electricity, as the Iraqi government cut the electricity supply in ISIS-controlled regions by severing them from the national power grid [60]. The Diyala province in Northern Iraq is regarded as a province partly controlled by ISIS [48], but the ISIS presence was only around the town of Muqdadiyah [48,61], and thus the Diyala province as a whole was a less violent region than other Northern Iraqi provinces [62]. This might explain why the night-time light in Diyala only decreased 12% between December 2013 and December 2016. It is also interesting that the night-time light of all the provinces in Northern Iraq returned between December 2016 and December 2017, indicating that access to electricity was restored after they were restored to government control by the Iraqi Security Forces and their allies. The Kurdish Autonomous Region has been in a major economic crisis since 2014 due to factors such as the war budget, evacuation of both international and local investment, and reduced financial support from the central government [63,64,65,66,67], resulting in electricity shortages in the region.
4.3. Effect of Conflict Events on the Night-Time Light Dynamics
At the city level, the NLRI is clearly responsive to the battles in the cities. For example, the battle between the ISIS and ISF in Ramadi started in January 2014. There were several rounds of seesaw battles, however, the ISF finally recaptured the city in February 2016. Responding to the events in Ramadi, night-time light sharply declined starting in early 2014 and dropped to a nadir point in February 2016, afterwards returning stably. Descriptions of conflict events and night-time light changes for all 12 cities are listed in Table A1 of the Appendix. Comparing the events and night-time light dynamics, we found the timeline of events and the light dynamics are very close for most of the cities: night-time light declined sharply as ISIS attacked or occupied a city and returned when the ISF retook the city. In addition, all the cities, except Samarra and Haditha which never fell into ISIS control, show a sharp decline in night-time light during 2014.
To directly display how ISIS activity influenced the night-time light at the provincial scale, vertical dotted lines in red color were added to NLRI curves of all the Northern Iraq provinces (Figure 6); these lines represent the month when ISIS started an offensive in the region. Although the ISIS occupied or attacked some cities in early 2014, most of the cities were far from the ISIS until June 2014, so the month when the ISIS started an offensive in Al-Anbar, At-Ta’min, Ninawa, and Sala ad-Din was set to June 2014, and the month for Diyala was March 2014. We found that the ISIS offensive had very clear effect on time series night-time light in Al-Anbar, At-Ta’min, Ninawa, and Sala ad-Din; however, the cut-off effect on the night-time light in Diyala was not significant, since Diyala was less affected by ISIS incursions [62]. The ISIS retreated rapidly from each province in Northern Iraq, but for the ISF, reclaiming territory has been a slow process. Thus, we did not analyze the cut-off effect of the ISIS retreat at the provincial scale, but focused on the city scale, where the changes in night-time light were more apparent.
At the city scale, both the ISIS offensive and retreat always occurred in a short time, so the months of when these activities occurred are labelled in red and blue colors (Figure 10), respectively. There are 11 cities in this analysis, since Samarra City, which had never suffered an attack from ISIS forces, was excluded. For the 11 cities, except for Ramadi and Haditha, the ISIS offensive had a clear cut-off effect on the night-time light dynamics. The cut-off effect in Ramadi and Haditha was delayed by months, since Ramadi did not fall into ISIS occupation quickly and Haditha never fell under ISIS occupation. In addition, the month of ISIS retreat was a turning point (or very close the turning point) for the 11 cities, indicating that electricity was resupplied as soon as ISIS retreated from most of the cities, except in Baghdadi, Haditha, and Mosul. Since Haditha never fell under ISIS occupation, it is not difficult to explain why the effect of ISIS retreat is not clear in the NRLI curves. The ISF campaign to retake Mosul started in October 2016 and ended in July 2017 (Table A1), during which the districts of Mosul were retaken one by one. Therefore, electricity was resupplied to the Mosul districts in a temporal order, so the month of July 2017 was not a turning point in the NLRI.
In summary, the ISIS offensive had a clear cut-off effect on night-time light dynamics at the provincial and city scales, while the ISIS retreat was a turning point which increased the night-time light at the city scale.
4.4. Limitation and Future Work
In this study, we found that there is a seasonal pattern in the time series night-time light for most of the provinces in Iraq. To detect the trend change in the time series data by removing the seasonality, we used the Hodrick–Prescott filter to separate the cyclic component from the trend component. Although the results show that the darker regions (extracted using the Hodrick–Prescott filter) are consistent with the socioeconomic conditions in Iraq, the filter may have smoothed some real short-term changes. Therefore, finding out the determinants behind the seasonality of VIIRS monthly night-time light dynamics can help to extract real night-time light change more accurately. Another potential limitation of this research stems from the local pass time of the Suomi NPP satellite, occurring around 1:30 a.m. [39]. This is when most of the city light has been turned off, suggesting that the VIIRS night-time light image can only partly reflect the electricity supply. As ground data is difficult to collect in conflict areas, the VIIRS night-time light images are still an attractive option when evaluating the electricity supply. The evaluation can be improved if a model linking electricity consumption and VIIRS night-time light can be set up, considering the local environment and human activities.
Although the monthly night-time light images can help track the effect of conflicts, the temporal resolution is of one month, and this is insufficient for tracking very short-term changes in night-time light. These short-term changes could provide real-time humanitarian information, which is valuable to the international community and aid groups. From this perspective, daily night-time light analysis is needed to accurately monitor humanitarian conditions, but the quality of the original VIIRS Sensor Data Record (SDR) product is not good enough for time series analysis and change detection. Therefore, the VIIRS SDR product must be improved by radiometric correction and gap filling for bad data [41], so that more accurate conflict assessment can be done in future studies.
5. Conclusions
In this research, night-time light in Iraq during 2012–2017 was analyzed using VIIRS monthly night-time light images. The data quality was improved through several steps, including missing data repair. A time series Night-time Light Ratio Index (NLRI) was derived for all provinces and 12 cities in Northern Iraq, as well as for six cities in Southern Iraq. The provinces that suffered from darker periods as compared to the pre-war level were detected. The dynamic patterns in the night-time light are as follows:
- (1)
- Most of the Northern Iraq regions showed a sharp decline in light due to the Islamic State of Iraq and Syria (ISIS) invasion in 2014, with light fluctuation after that, and finally light returned after the Iraqi Security Forces (ISF) and its allies recaptured them;
- (2)
- The Kurdish Autonomous Region had a continuous light decline from 2014, indicating that the region was lacking in electricity supply due to the economic crisis in the region;
- (3)
- All the Southern Iraqi provinces showed a steady light increase, which is quite different to Northern Iraq and the Kurdish Autonomous Region, indicating stable development in regions under Iraqi Government control.
This is the first report on the latter two aspects, revealing new information about the Iraqi Civil War. These findings show the night-time light data acquired by VIIRS is clearly affected by the conflict events of the Iraqi Civil War.
Author Contributions
X.L., D.L., and C.W. conceived and designed the experiments; S.L. and M.J. performed the experiments; X.L. wrote the paper; and all authors edited the paper.
Acknowledgments
The authors would like to thank anonymous reviewers for their helpful comments. This research was supported by the National Natural Science Foundation of China under grant no. 41771386, the Application Research of Remote Sensing Technology on Global Energy Internet under grant no. JYYKJXM(2017)011, the Key Laboratory of Spatial Data Mining & Information Sharing of Ministry of Education, Fuzhou University under grant no. 2016LSDMIS03, and the Fundamental Research Funds for the Central Universities under grant no. 2042016kf0162.
Conflicts of Interest
The authors declare no conflict of interest.
Appendix A

Table A1.
Conflict events and dynamic night-time light patterns of 12 Iraqi cities in Northern Iraq.
Table A1.
Conflict events and dynamic night-time light patterns of 12 Iraqi cities in Northern Iraq.
| City | Events, Night-Time Light Dynamics, and Their Relationship |
|---|---|
| Ramadi | Event and source: Battle of Ramadi between the ISIS and the Iraqi Security Forces (ISF) started in January 2014. There were several rounds of seesaw battles. ISIS captured the city in May 2015, and the ISF finally recaptured the city in February 2016; https://en.wikipedia.org/wiki/Anbar_campaign_(2013%E2%80%9314) https://en.wikipedia.org/wiki/Battle_of_Ramadi_%282014%E2%80%9315%29 https://en.wikipedia.org/wiki/Battle_of_Ramadi_(2015%E2%80%9316) Light dynamic: The night-time light sharply declined from early 2014 and dropped to a nadir point in February 2016. The light finally returned stably afterwards. Relationship: The light dropped rapidly from the beginning of the battle, and returned when the ISF recaptured the city |
| Tikrit | Event and source: ISIS occupied Tikrit in June 2014, and ISF retook it in April 2015. After that, the conflict continued around the city, which severely damaged the electrical supply. https://en.wikipedia.org/wiki/First_Battle_of_Tikrit https://en.wikipedia.org/wiki/Second_Battle_of_Tikrit https://www.iraqinews.com/iraq-war/3-towers-power-transmission-detonated-east-tikrit/ Light dynamics: The night-time light dropped sharply between January 2014 and July 2014, and the city lost almost all its light. The light gradually returned around April 2015; after that, it increased, but with fluctuations. Relationship: The light dropped rapidly as ISIS controlled the city and returned as the ISF recaptured it, the continuous battle around the city making the light unstable. |
| Ad Dawr (Al-Dour) | Event and source: ISIS captured the city in June 2014, and the ISF retook it in March 2015. https://www.nhregister.com/nationworld/article/Iraq-sees-more-than-1-000-killings-in-June-alone-11377320.php http://zeenews.india.com/news/world/iraq-forces-look-to-tighten-noose-around-tikrit_1556452.html Light dynamics: Similar to those of Tikrit. Relationship: Similar to those of Tikrit. |
| Al Qa’im | Event and source: ISIS seized the city in June 2014, and the ISF retook it in November 2017. https://edition.cnn.com/2014/06/21/world/meast/iraq-crisis/index.html http://www.washingtonexaminer.com/losing-al-qaim-isis-has-a-big-but-not-existential-problem/article/2639549 Light dynamics: Night-time light declined sharply to almost zero starting in June 2014, and stayed at a very low level to the end of 2017. Relationship: The light dropped sharply after ISIS occupied the city. |
| Ar Rutba | Event and source: ISIS seized the city in June 2014, and the ISF retook it in May 2016. https://www.ibtimes.com/isis-takes-control-rutba-iraqs-western-border-jordan-1608548 https://en.wikipedia.org/wiki/Ar-Rutbah_offensive_(2016) Light dynamics: The night-time light declined sharply between June 2014 and November 2014, and almost all the light was lost during this period. Light stayed at a very low level until May 2016 when the light returned. Relationship: The light dropped rapidly as ISIS controlled the city, and returned as the ISF recaptured it. |
| Baghdadi | Event and source: ISIS lay siege to the city by cutting off the supply of electricity in October 2014 and seized the city on February 2015. The ISF retook it in March 2015. https://www.iraqinews.com/iraq-war/deputy-governor-anbar-says-isis-cut-supplies-baghdadi-town/ https://counterjihadreport.com/2015/02/13/islamic-state-seizes-town-of-khan-al-baghdadi-threaten-us-marines-at-ayn-al-asad/ https://www.aljazeera.com/news/2015/03/iraqi-forces-retake-al-baghdadi-isil-150307050409010.html Light dynamics: Night-time light declined rapidly from October 2014 and returned after July 2015. Relationship: The light declined rapidly after ISIS besieged the city; the light returned several months after the ISF recaptured it. |
| Fallujah | Event and source: ISIS captured the city in January 2014, and the ISF retook it in May 2016. https://en.wikipedia.org/wiki/Fallujah Light dynamics: The night-time light declined between the end of 2013 and August 2014, falling into almost zero, and gradually returned since June 2016. Relationship: After ISIS seized the city, the light was reduced to almost zero, and it returned as the ISF recaptured it. |
| Haditha | Event and source: The city was besieged by ISIS in March 2014, but was continuously controlled by the ISF and local militants and never fell under ISIS control. Haditha Dam, which provides the majority of electricity supply in the area, was attacked by ISIS many times during the siege. The Iraqi government entered the city on May 2016, after that, ISIS retreated. https://www.washingtonpost.com/world/middle_east/this-town-has-resisted-islamic-state-for-18-months-but-food-is-running-low/2015/07/21/ddccc634-299f-11e5-960f-22c4ba982ed4_story.html?utm_term=.983ed9c74d00 https://www.iraqinews.com/iraq-war/isis-attack-haditha-dam-foiled/ https://www.iraqinews.com/iraq-war/20-dead-isis-attack-haditha-dam-7-car-bombs/ http://www.dailymail.co.uk/wires/afp/article-3569821/Iraqi-forces-retake-road-isolated-Anbar-city.html Light dynamics: The night-time light declined gradually from May 2014, dropped faster after March 2015, and reaching zero in July 2015. Light finally returned in September 2015. Relationship: The light declined as ISIS besieged the city and attacked the power station. It returned as the siege was ended. |
| Hit | Event and source: ISIS seized the city in October 2014, and the ISF retook it in April 2016. https://en.wikipedia.org/wiki/H%C4%ABt Light dynamics: The night-time light declined from June 2014, and reached nearly zero in December 2014. It stayed at a very low level, and finally returned in April 2016. Relationship: The light dropped rapidly as ISIS controlled the city, although there was a moderate decline before ISIS control. Light returned as the ISF recaptured the city. |
| Samarra | Event and source: Samarra was controlled by ISF all the time, although some battles were fought nearby. http://www.bbc.com/news/world-middle-east-27838034 Light dynamics: The night-time light had a general increase despite small fluctuations. Relationship: The light increased as the ISF strongly controlled the city. |
| Mosul | Event and source: ISIS seized Mosul in June 2014, and the ISF with its alliance launched a campaign to retake Mosul in October 2016, finally seizing the whole city in July 2017. During ISIS control, the Iraqi central government cut off the electricity supply to Mosul. ISIS tried to restore electricity supply during 2015. The Iraqi central government resumed, providing the hydropower electricity to Mosul in January 2015, but ISIS cut off electricity to residents as a means to block outside news in May 2016. https://en.wikipedia.org/wiki/Mosul https://www.rand.org/nsrd/projects/when-isil-comes-to-town/case-studies/mosul.html http://www.rudaw.net/english/middleeast/iraq/06052017 Light dynamics: The night-time light decline sharply from April 2014, and returned in January 2015, declining again in June 2015, returning in January 2016. It declined again in May 2016, and finally returned in February 2017. Relationship: The light declined sharply as ISIS occupied Mosul and returned as the ISF recaptured the city. During the period of ISIS control, the light was recovered to a certain degree as the Iraqi government resumed supplying electricity to the city. The ISIS cut off electricity however, and the light was reduced again. |
| Tal Afar | Event and source: ISIS seized Tal Afar in June 2014, and the ISF retook it in August 2017. As Tal Afar is nearby Mosul, the electricity supply dynamics of Tal Afar are similar to that of Mosul. https://en.wikipedia.org/wiki/Tal_Afar Light dynamics: The night-time light dynamic pattern of Tal Afar is similar to that of Mosul. Relationship: Similar to that of Mosul. |
References
- Iraq Body Count. Iraq Body Count. Available online: https://www.iraqbodycount.org/ (accessed on 30 April 2018).
- BBC. Islamic State Conflict: Three Million Displaced in Iraq. Available online: http://www.bbc.com/news/world-us-canada-33238134 (accessed on 30 April 2018).
- Spencer, R. ISIL Carried out Massacres and Mass Sexual Enslavement of Yazidis, UN Confirms. Available online: http://www.telegraph.co.uk/news/worldnews/islamic-state/11160906/Isil-carried-out-massacres-and-mass-sexual-enslavement-of-Yazidis-UN-confirms.html (accessed on 30 April 2018).
- Newsmax. Wash Post Details ISIS Surveillance Eyes from Sky in US. Available online: https://www.newsmax.com/newsfront/navy-surveillance-eyes-terrorism/2017/07/06/id/800275/ (accessed on 30 April 2018).
- Patel, J.; Wallace, T. Before and After Satellite Images of Mosul Reveal the Devastation After the Islamic State Was Forced Out. Available online: https://www.nytimes.com/interactive/2017/07/15/world/middleeast/mosul-before-after.html (accessed on 30 April 2018).
- Witmer, F.D. Remote sensing of violent conflict: Eyes from above. Int. J. Remote Sens. 2015, 36, 2326–2352. [Google Scholar] [CrossRef]
- Kwarteng, A.; Chavez, P., Jr. Change detection study of Kuwait City and environs using multi-temporal Landsat Thematic Mapper data. Int. J. Remote Sens. 1998, 19, 1651–1662. [Google Scholar] [CrossRef]
- Koch, M.; El-Baz, F. Identifying the effects of the Gulf War on the geomorphic features of Kuwait by remote sensing and GIS. Photogramm. Eng. Remote Sens. 1998, 64, 739–746. [Google Scholar]
- Witmer, F.D.; O’Loughlin, J. Satellite data methods and application in the evaluation of war outcomes: Abandoned agricultural land in Bosnia-Herzegovina after the 1992–1995 conflict. Ann. Assoc. Am. Geogr. 2009, 99, 1033–1044. [Google Scholar] [CrossRef]
- Witmer, F.D.W.; O’Loughlin, J. Detecting the effects of wars in the Caucasus regions of Russia and Georgia using radiometrically normalized DMSP-OLS nighttime lights imagery. Gisci. Remote Sens. 2011, 48, 478–500. [Google Scholar] [CrossRef]
- Nackoney, J.; Molinario, G.; Potapov, P.; Turubanova, S.; Hansen, M.C.; Furuichi, T. Impacts of civil conflict on primary forest habitat in northern Democratic Republic of the Congo, 1990–2010. Biol. Conserv. 2014, 170, 321–328. [Google Scholar] [CrossRef]
- American Association for the Advancement of Science. Conflict in Aleppo, Syria: A Retrospective Analysis. Available online: https://www.aaas.org/aleppo_retrospective#1 (accessed on 30 April 2018).
- Letu, H.; Hara, M.; Yagi, H.; Naoki, K.; Tana, G.; Nishio, F.; Shuhei, O. Estimating energy consumption from night-time DMPS/OLS imagery after correcting for saturation effects. Int. J. Remote Sens. 2010, 31, 4443–4458. [Google Scholar] [CrossRef]
- Yu, B.; Shi, K.; Hu, Y.; Huang, C.; Chen, Z.; Wu, J. Poverty Evaluation Using NPP-VIIRS Nighttime Light Composite Data at the County Level in China. IEEE J. Sel. Top. Appl. Earth Obs. Remote Sens. 2015, 8, 1217–1229. [Google Scholar] [CrossRef]
- Elvidge, C.D.; Sutton, P.C.; Ghosh, T.; Tuttle, B.T.; Baugh, K.E.; Bhaduri, B.; Bright, E. A global poverty map derived from satellite data. Comput. Geosci. 2009, 35, 1652–1660. [Google Scholar] [CrossRef]
- Ma, T.; Zhou, Y.K.; Zhou, C.H.; Haynie, S.; Pei, T.; Xu, T. Night-time light derived estimation of spatio-temporal characteristics of urbanization dynamics using DMSP/OLS satellite data. Remote Sens. Environ. 2015, 158, 453–464. [Google Scholar] [CrossRef] [Green Version]
- Liu, Z.; He, C.; Zhang, Q.; Huang, Q.; Yang, Y. Extracting the dynamics of urban expansion in China using DMSP-OLS nighttime light data from 1992 to 2008. Landsc. Urban Plan. 2012, 106, 62–72. [Google Scholar] [CrossRef]
- Huang, Q.; He, C.; Gao, B.; Yang, Y.; Liu, Z.; Zhao, Y.; Dou, Y. Detecting the 20 year city-size dynamics in China with a rank clock approach and DMSP/OLS nighttime data. Landsc. Urban Plan. 2015, 137, 138–148. [Google Scholar] [CrossRef]
- Zhang, Q.; Seto, K. Mapping urbanization dynamics at regional and global scales using multi-temporal DMSP/OLS nighttime light data. Remote Sens. Environ. 2011, 115, 2320–2329. [Google Scholar] [CrossRef]
- Savory, D.J.; Andrade-Pacheco, R.; Gething, P.W.; Midekisa, A.; Bennett, A.; Sturrock, H.J. Intercalibration and Gaussian process modeling of nighttime lights imagery for measuring urbanization trends in Africa 2000–2013. Remote Sens. 2017, 9, 713. [Google Scholar] [CrossRef]
- Ma, X.L.; Tong, X.H.; Liu, S.C.; Luo, X.; Xie, H.; Li, C.M. Optimized sample selection in SVM classification by combining with DMSP-OLS, Landsat NDVI and GlobeLand30 products for extracting urban built-up areas. Remote Sens. 2017, 9, 236. [Google Scholar] [CrossRef]
- Li, Q.; Lu, L.; Weng, Q.; Xie, Y.; Guo, H. Monitoring urban dynamics in the Southeast U.S.A. using time-series DMSP/OLS nightlight imagery. Remote Sens. 2016, 8, 578. [Google Scholar] [CrossRef]
- Aubrecht, C.; León Torres, J. Evaluating multi-Sensor nighttime earth observation data for identification of mixed vs. residential use in urban areas. Remote Sens. 2016, 8, 114. [Google Scholar] [CrossRef]
- Zhou, Y.K.; Ma, T.; Zhou, C.H.; Xu, T. Nighttime light derived assessment of regional inequality of socioeconomic development in China. Remote Sens. 2015, 7, 1242–1262. [Google Scholar] [CrossRef]
- Xu, H.; Yang, H.; Li, X.; Jin, H.; Li, D. Multi-Scale measurement of regional inequality in Mainland China during 2005–2010 using DMSP/OLS night light imagery and population density grid data. Sustainability 2015, 7, 13469–13499. [Google Scholar] [CrossRef]
- Wu, R.; Yang, D.; Dong, J.; Zhang, L.; Xia, F. Regional inequality in China based on NPP-VIIRS night-time light imagery. Remote Sens. 2018, 10, 240. [Google Scholar] [CrossRef]
- Li, X.; Xu, H.; Chen, X.; Li, C. Potential of NPP-VIIRS nighttime light imagery for modeling the regional economy of China. Remote Sens. 2013, 5, 3057–3081. [Google Scholar] [CrossRef]
- Chen, X.; Nordhaus, W.D. Using luminosity data as a proxy for economic statistics. Proc. Natl. Acad. Sci. USA 2011, 108, 8589–8594. [Google Scholar] [CrossRef] [PubMed] [Green Version]
- Bharti, N.; Tatem, A.J.; Ferrari, M.J.; Grais, R.F.; Djibo, A.; Grenfell, B.T. Explaining seasonal fluctuations of measles in Niger using nighttime lights imagery. Science 2011, 334, 1424–1427. [Google Scholar] [CrossRef] [PubMed]
- Li, X.; Li, D. Can night-time light images play a role in evaluating the Syrian Crisis? Int. J. Remote Sens. 2014, 35, 6648–6661. [Google Scholar] [CrossRef]
- Li, X.; Li, D.; Xu, H.; Wu, C. Intercalibration between DMSP/OLS and VIIRS night-time light images to evaluate city light dynamics of Syria’s major human settlement during Syrian Civil War. Int. J. Remote Sens. 2017, 38, 5934–5951. [Google Scholar] [CrossRef]
- Li, X.; Zhang, R.; Huang, C.; Li, D. Detecting 2014 Northern Iraq Insurgency using night-time light imagery. Int. J. Remote Sens. 2015, 36, 3446–3458. [Google Scholar] [CrossRef]
- Jiang, W.; He, G.; Long, T.; Liu, H. Ongoing conflict makes Yemen dark: From the perspective of nighttime light. Remote Sens. 2017, 9, 798. [Google Scholar] [CrossRef]
- Bennie, J.; Duffy, J.; Davies, T.; Correa-Cano, M.; Gaston, K. Global trends in exposure to light pollution in natural terrestrial ecosystems. Remote Sens. 2015, 7, 2715–2730. [Google Scholar] [CrossRef] [Green Version]
- Bennie, J.; Davies, T.W.; Duffy, J.P.; Inger, R.; Gaston, K.J. Contrasting trends in light pollution across Europe based on satellite observed night time lights. Sci. Rep. 2014, 4, 3789. [Google Scholar] [CrossRef] [PubMed] [Green Version]
- Han, P.; Huang, J.; Li, R.; Wang, L.; Hu, Y.; Wang, J.; Huang, W. Monitoring trends in light pollution in China based on nighttime satellite imagery. Remote Sens. 2014, 6, 5541–5558. [Google Scholar] [CrossRef]
- Bauer, S.E.; Wagner, S.E.; Burch, J.; Bayakly, R.; Vena, J.E. A case-referent study: Light at night and breast cancer risk in Georgia. Int. J. Health Geogr. 2013, 12, 1–10. [Google Scholar] [CrossRef] [PubMed]
- Kloog, I.; Haim, A.; Stevens, R.G.; Portnov, B.A. Global co-distribution of light at night (LAN) and cancers of prostate, colon, and lung in men. Chronobiol. Int. 2009, 26, 108–125. [Google Scholar] [CrossRef] [PubMed]
- Elvidge, C.D.; Baugh, K.E.; Zhizhin, M.; Hsu, F.-C. Why VIIRS data are superior to DMSP for mapping nighttime lights. Proc. Asia-Pac. Adv. Netw. 2013, 35, 62–69. [Google Scholar] [CrossRef]
- Zheng, Q.; Zeng, Y.; Deng, J.; Wang, K.; Jiang, R.; Ye, Z. “Ghost cities” identification using multi-source remote sensing datasets: A case study in Yangtze River Delta. Appl. Geogr. 2017, 80, 112–121. [Google Scholar] [CrossRef]
- Román, M.O.; Stokes, E.C. Holidays in lights: Tracking cultural patterns in demand for energy services. Earth’s Future 2015, 3, 182–205. [Google Scholar] [CrossRef] [PubMed] [Green Version]
- Cole, T.A.; Wanik, D.W.; Molthan, A.L.; Román, M.O.; Griffin, R.E. Synergistic use of nighttime satellite data, electric utility infrastructure, and ambient population to improve power outage detections. Remote Sens. 2017, 9, 286. [Google Scholar] [CrossRef]
- Mann, M.L.; Melaas, E.K.; Malik, A. Using VIIRS Day/Night band to measure electricity supply reliability: Preliminary results from Maharashtra, India. Remote Sens. 2016, 8, 711. [Google Scholar] [CrossRef]
- Shi, K.F.; Chen, Y.; Yu, B.L.; Xu, T.B.; Chen, Z.Q.; Liu, R.; Li, L.Y.; Wu, J.P. Modeling spatiotemporal CO2 (carbon dioxide) emission dynamics in China from DMSP-OLS nighttime stable light data using panel data analysis. Appl. Energy 2016, 168, 523–533. [Google Scholar] [CrossRef]
- Chen, X.; Nordhaus, W. A test of the new VIIRS lights data set: Population and economic output in Africa. Remote Sens. 2015, 7, 4937–4947. [Google Scholar] [CrossRef]
- Nordhaus, W.; Chen, X. A sharper image? Estimates of the precision of nighttime lights as a proxy for economic statistics. J. Econ. Geogr. 2014, 15, 217–246. [Google Scholar] [CrossRef] [Green Version]
- Coscieme, L.; Sutton, P.C.; Anderson, S.; Liu, Q.; Elvidge, C.D. Dark Times: Nighttime satellite imagery as a detector of regional disparity and the geography of conflict. Gisci. Remote Sens. 2017, 54, 118–139. [Google Scholar] [CrossRef]
- BBC. Islamic State and the Crisis in Iraq and Syria in Maps. Available online: http://www.bbc.com/news/world-middle-east-27838034 (accessed on 30 April 2018).
- Li, X.; Chen, F.; Chen, X. Satellite-observed nighttime light variation as evidence for global armed conflicts. IEEE J. Sel. Top. Appl. Earth Obs. Remote Sens. 2013, 6, 2302–2315. [Google Scholar] [CrossRef]
- Levin, N. The impact of seasonal changes on observed nighttime brightness from 2014 to 2015 monthly VIIRS DNB composites. Remote Sens. Environ. 2017, 193, 150–164. [Google Scholar] [CrossRef]
- Hodrick, R.J.; Prescott, E.C. Postwar US business cycles: An empirical investigation. J. Money Credit Bank. 1997, 29, 1–16. [Google Scholar] [CrossRef]
- Vasquez, P.I.L.; de Araujo, L.M.N.; Molion, L.C.B.; Abdalad, M.D.; Moreira, D.M.; Sanchez, A.; Barbosa, H.A.; Rotunno, O.C. Historical analysis of interannual rainfall variability and trends in southeastern Brazil based on observational and remotely sensed data. Clim. Dyn. 2018, 50, 801–824. [Google Scholar] [CrossRef]
- Aljazeera. Iraq Rebels Battle for Baquba City. Available online: https://www.aljazeera.com/news/middleeast/2014/06/iraq-rebels-battle-baquba-city-2014617124856327794.html (accessed on 30 April 2018).
- CNN. ISIS Fast Facts. Available online: https://edition.cnn.com/2014/08/08/world/isis-fast-facts/ (accessed on 30 April 2018).
- All Iraq New Agency. Iraq’s Electricity Capacity Reaches 10,000 MW. Available online: http://ifpinfo.com/Energy-NewsArticle-3038#.WqaReHyYOpo (accessed on 30 April 2018).
- Al-Khatteeb, L. Southern Iraq Is a Safe Place. Available online: https://www.brookings.edu/opinions/southern-iraq-is-a-safe-place/ (accessed on 30 April 2018).
- Reuters. Electricity Supply in Iraq’s Kurdistan Region Hit by Blast. Available online: https://www.yahoo.com/news/electricity-supply-iraqs-kurdistan-region-hit-blast-185444157.html (accessed on 30 April 2018).
- Mostafa, M. Iraq’s Oil Production up 36% in 2017: Official. Available online: https://www.iraqinews.com/business-iraqi-dinar/iraqs-oil-production-36-2017-official/ (accessed on 30 April 2018).
- Ngo, D. The Impact of ISIS on Iraq’s Oil Industry. Available online: http://energyinasiablog.com/2014/08/isis-impact-on-iraqs-oil-industry/ (accessed on 30 April 2018).
- Shaver, A. Turning the Lights off on the Islamic State. Available online: http://www.washingtonpost.com/blogs/monkey-cage/wp/2014/10/16/turning-the-lights-off-on-the-islamic-state/ (accessed on 30 April 2018).
- CBS. Armed with U.S. Weapons, Infamous Militia Beating ISIS. Available online: https://www.cbsnews.com/news/armed-with-u-s-weapons-ruthless-militia-beating-isis-in-iraq/ (accessed on 30 April 2018).
- Knights, M.; Mello, A. Losing Mosul, Regenerating in Diyala: How the Islamic State Could Exploit Iraq’s Sectarian Tinderbox. Available online: https://ctc.usma.edu/losing-mosul-regenerating-in-diyala-how-the-islamic-state-could-exploit-iraqs-sectarian-tinderbox/ (accessed on 30 April 2018).
- Salih, S. Kurdish Investors Put Their Money Elsewhere. Available online: http://www.niqash.org/en/articles/economy/5813/Kurdish-Crises-Drive-Kurdish-Investors-To-Put-Their-Money-Elsewhere.htm (accessed on 30 April 2018).
- Ekurd Daily. U.S. Requests Data on Iraqi Kurdistan’s Economic Crisis. Available online: http://ekurd.net/us-requests-data-iraqi-kurdistan-2016-02-12 (accessed on 30 April 2018).
- Al Arabiya. Oil Companies Evacuate Workers from Iraqi Kurdistan. Available online: http://english.alarabiya.net/en/business/2014/08/08/Oil-companies-suspend-work-evacuate-workers-from-Iraqi-Kurdistan-.html (accessed on 30 April 2018).
- Reuters. Iraqi Kurds’ Protests over Economic Crisis Turn Violent. Available online: https://www.aljazeera.com/news/2015/10/iraqi-kurds-protests-economic-crisis-turn-violent-151008155126148.html (accessed on 30 April 2018).
- Hassan, H. Baghdad’s Financial Blockade of Iraqi Kurdistan Has Desired Effect. Available online: http://www.niqash.org/en/articles/economy/3544/ (accessed on 30 April 2018).
Figure 1.
The administrative map of Iraq.

Figure 2.
The Visible Infrared Imaging Radiometer Suite (VIIRS) night-time light image of Iraq for December 2013.
Figure 2.
The Visible Infrared Imaging Radiometer Suite (VIIRS) night-time light image of Iraq for December 2013.

Figure 3.
The VIIRS night-time light image of Iraq for December 2015.

Figure 4.
The VIIRS night-time light image of Iraq for December 2017.

Figure 5.
The built-up area map of Iraq for 2010.

Figure 6.
The Night-time light Ratio Index (NLRI) for 18 Iraqi provinces between April 2012 and December 2017; the red vertical dotted line represents the month when the Islamic State of Iraq and Syria (ISIS) started an offensive in the region.
Figure 6.
The Night-time light Ratio Index (NLRI) for 18 Iraqi provinces between April 2012 and December 2017; the red vertical dotted line represents the month when the Islamic State of Iraq and Syria (ISIS) started an offensive in the region.

Figure 7.
The time series NLRI and its decomposed trend and cyclic components, with Dhi-Qar province as an example.
Figure 7.
The time series NLRI and its decomposed trend and cyclic components, with Dhi-Qar province as an example.

Figure 8.
A map showing percent of light decline in the darkest month compared to December 2013.

Figure 9.
The maps showing the annual night-time light change.

Figure 10.
The Night-time light Ratio Index (NLRI) for 12 cities in Northern Iraq between April 2012 and December 2017; the red vertical dotted line represents the month when ISIS started an offensive in the region; the blue vertical dotted line represents the month when ISIS retreated from the region.

Figure 11.
The Night-time light Ratio Index (NLRI) for six cities in Southern Iraq as the control group between April 2012 and December 2017.
Figure 11.
The Night-time light Ratio Index (NLRI) for six cities in Southern Iraq as the control group between April 2012 and December 2017.

Table 1.
The sum of city light (SCL) for all the Iraqi provinces; NI denotes Northern Iraq, SI denotes Southern Iraq, and KAR denotes the Kurdish Autonomous Region.
Table 1.
The sum of city light (SCL) for all the Iraqi provinces; NI denotes Northern Iraq, SI denotes Southern Iraq, and KAR denotes the Kurdish Autonomous Region.
| Province | Type | Relative SCL (SCL in December 2013 as 100) | ||||
|---|---|---|---|---|---|---|
| December 2013 | December 2014 | December 2015 | December 2016 | December 2017 | ||
| Al-Anbar | NI | 100 | 37 | 25 | 52 | 143 |
| Al-Basrah | SI | 100 | 129 | 157 | 171 | 175 |
| Al-Muthannia | SI | 100 | 120 | 113 | 140 | 182 |
| Al-Qadisiyah | SI | 100 | 112 | 95 | 111 | 136 |
| An-Najaf | SI | 100 | 126 | 119 | 148 | 182 |
| Arbil | KAR | 100 | 77 | 65 | 53 | 48 |
| As-Sulaymaniyah | KAR | 100 | 99 | 77 | 69 | 67 |
| At-Ta’mim | NI | 100 | 27 | 18 | 16 | 55 |
| Babil | SI | 100 | 126 | 122 | 149 | 189 |
| Baghdad | SI | 100 | 125 | 120 | 125 | 183 |
| Dhi-Qar | SI | 100 | 112 | 116 | 140 | 191 |
| Dihok | KAR | 100 | 92 | 81 | 82 | 92 |
| Diyala | NI | 100 | 108 | 94 | 88 | 124 |
| Karbala | SI | 100 | 126 | 131 | 137 | 162 |
| Maysan | SI | 100 | 113 | 123 | 157 | 311 |
| Ninawa | NI | 100 | 12 | 20 | 14 | 43 |
| Sala ad-Din | NI | 100 | 44 | 75 | 97 | 139 |
| Wasit | SI | 100 | 128 | 132 | 150 | 197 |
Table 2.
The sum of city light (SCL) for 12 cities in Northern Iraq and six cities in Southern Iraq; NI denotes Northern Iraq, and SI denotes Southern Iraq.
Table 2.
The sum of city light (SCL) for 12 cities in Northern Iraq and six cities in Southern Iraq; NI denotes Northern Iraq, and SI denotes Southern Iraq.
| City | Type | Relative SCL (SCL in December 2013 as 100) | ||||
|---|---|---|---|---|---|---|
| December 2013 | December 2014 | December 2015 | December 2016 | December 2017 | ||
| Ramadi | NI | 100 | 16 | 3 | 38 | 130 |
| Tikrit | NI | 100 | 0 | 46 | 43 | 50 |
| Ad-Dawr | NI | 100 | 19 | 51 | 48 | 80 |
| Al-Qa’im | NI | 100 | 4 | 5 | 6 | 8 |
| Ar Rutba | NI | 100 | 6 | 3 | 18 | 26 |
| Baghdadi | NI | 100 | 87 | 132 | 220 | 327 |
| Fallujah | NI | 100 | 2 | 1 | 21 | 126 |
| Haditha | NI | 100 | 123 | 71 | 131 | 192 |
| Hit | NI | 100 | 3 | 3 | 77 | 207 |
| Muqdadiyah | NI | 100 | 72 | 82 | 61 | 90 |
| Samarra | NI | 100 | 82 | 103 | 184 | 243 |
| Tal Afar | NI | 100 | 2 | 5 | 11 | 28 |
| Mosul | NI | 100 | 6 | 19 | 8 | 32 |
| Baghdad | NI | 100 | 124 | 119 | 124 | 183 |
| Najaf | SI | 100 | 126 | 121 | 152 | 182 |
| Al Diwaniyah | SI | 100 | 109 | 88 | 103 | 123 |
| Al-Hillah | SI | 100 | 135 | 134 | 162 | 198 |
| Samawah | SI | 100 | 129 | 123 | 145 | 147 |
| Afak | SI | 100 | 121 | 98 | 109 | 142 |
| Shamia | SI | 100 | 126 | 104 | 132 | 158 |
© 2018 by the authors. Licensee MDPI, Basel, Switzerland. This article is an open access article distributed under the terms and conditions of the Creative Commons Attribution (CC BY) license (http://creativecommons.org/licenses/by/4.0/).
Share and Cite
MDPI and ACS Style
Li, X.; Liu, S.; Jendryke, M.; Li, D.; Wu, C. Night-Time Light Dynamics during the Iraqi Civil War. Remote Sens. 2018, 10, 858. https://doi.org/10.3390/rs10060858
AMA Style
Li X, Liu S, Jendryke M, Li D, Wu C. Night-Time Light Dynamics during the Iraqi Civil War. Remote Sensing. 2018; 10(6):858. https://doi.org/10.3390/rs10060858
Chicago/Turabian StyleLi, Xi, Shanshan Liu, Michael Jendryke, Deren Li, and Chuanqing Wu. 2018. "Night-Time Light Dynamics during the Iraqi Civil War" Remote Sensing 10, no. 6: 858. https://doi.org/10.3390/rs10060858
Note that from the first issue of 2016, this journal uses article numbers instead of page numbers. See further details here.