Article

Out of the Dark: Establishing a Large-Scale Field Experiment to Assess the Effects of Artificial Light at Night on Species and Food Webs

by
Stephanie I. J. Holzhauer
1,2,*,
Steffen Franke
3,
Christopher C. M. Kyba
1,4,5,
Alessandro Manfrin
1,6,
Reinhard Klenke
7,
Christian C. Voigt
8,
Daniel Lewanzik
8,9,
Martin Oehlert
1,
Michael T. Monaghan
1,
Sebastian Schneider
10,
Stefan Heller
1,
Helga Kuechly
1,11,
Anika Brüning
1,
Ann-Christin Honnen
1 and
Franz Hölker
1,*
1
Leibniz Institute of Freshwater Ecology and Inland Fisheries (IGB), Müggelseedamm 301/310, 12587 Berlin, Germany
2
Senckenberg German Entomological Institute, Eberswalder Straße 90, 15374 Müncheberg, Germany
3
Leibniz Institute for Plasma Science and Technology, Felix-Hausdorff-Str. 2, 17489 Greifswald, Germany
4
Deutsches GeoForschungsZentrum GFZ, Telegrafenberg, 14473 Potsdam, Germany
5
Institute for Space Sciences, Freie Universität Berlin, Carl-Heinrich-Becker Weg 6-10, 12165 Berlin, Germany
6
Department of Biology-Chemistry-Pharmacy, Freie Universität Berlin, Takustraβe 3, 14195 Berlin, Germany
7
Helmholtz Centre for Environmental Research (UFZ), Department of Conservation Biology, Permoserstr. 15, 04318 Leipzig, Germany
8
Leibniz Institute for Zoo and Wildlife Research (IZW), Alfred-Kowalke-Straße 17, 10315 Berlin, Germany
9
Acoustic and Functional Ecology, Max Planck Institute for Ornithology, Eberhard-Gwinner-Str. 11, 82319 Seewiesen, Germany
10
Technische Universität Berlin, Energy and Automation Technology, Lighting Technology, Einsteinufer 19, 10587 Berlin, Germany
11
LUP GmbH, Große Weinmeisterstraße 3a, 14469 Potsdam, Germany
*
Authors to whom correspondence should be addressed.
Sustainability 2015, 7(11), 15593-15616; https://doi.org/10.3390/su71115593
Submission received: 17 August 2015 / Revised: 9 November 2015 / Accepted: 12 November 2015 / Published: 20 November 2015

Abstract

:
Artificial light at night (ALAN) is one of the most obvious hallmarks of human presence in an ecosystem. The rapidly increasing use of artificial light has fundamentally transformed nightscapes throughout most of the globe, although little is known about how ALAN impacts the biodiversity and food webs of illuminated ecosystems. We developed a large-scale experimental infrastructure to study the effects of ALAN on a light-naïve, natural riparian (i.e., terrestrial-aquatic) ecosystem. Twelve street lights (20 m apart) arranged in three rows parallel to an agricultural drainage ditch were installed on each of two sites located in a grassland ecosystem in northern Germany. A range of biotic, abiotic, and photometric data are collected regularly to study the short- and long-term effects of ALAN on behavior, species interactions, physiology, and species composition of communities. Here we describe the infrastructure setup and data collection methods, and characterize the study area including photometric measurements. None of the measured parameters differed significantly between sites in the period before illumination. Results of one short-term experiment, carried out with one site illuminated and the other acting as a control, demonstrate the attraction of ALAN by the immense and immediate increase of insect catches at the lit street lights. The experimental setup provides a unique platform for carrying out interdisciplinary research on sustainable lighting.

1. Introduction

The artificial illumination of outdoor areas at night has fundamentally transformed nightscapes [1,2] and is increasing rapidly across much of the globe (from 0%–20% per year, depending on the region [1]). Artificial light at night (ALAN) has led to increased light pollution [3] and to potentially important, but largely neglected, impacts on biodiversity [4,5,6]. While night-time lights have been used to develop indicators of human well-being [7], little is known about the detrimental effects that ALAN may have on terrestrial, freshwater, and riparian ecosystems [8,9,10,11]. Potential effects include the disruption of migration, foraging, and reproduction of organisms, as well as changes to processes related to ecosystem functions such as nutrient cycling and biogeochemical processes [4,5,6,11,12].
Freshwaters and their adjacent terrestrial ecosystems (i.e., riparian ecosystems) are very likely to be affected by ALAN because humans tend to build cities close to freshwaters [13]. The illumination of running waters in urban environments is disproportionally higher than many other natural areas such as forests, lakes, meadows, and pastures e.g., [14]. Experiments on the effects of ALAN in aquatic systems have reported physiological [15] and behavioral [16,17,18] responses of aquatic organisms to light levels of less than 15 lux. ALAN may therefore be an ecologically significant light source despite the comparatively low brightness compared to sunlight during the day. Artificial light may affect local insect populations and disrupt their dispersal across associated terrestrial landscapes. A recent study along a rural stream suggested that aquatic insects might be more vulnerable to artificial lighting than terrestrial insects. Even traps 40 m from the nearest light saw a significantly greater proportion of aquatic insects captured when the lights were on [19]. To date, the extent to which this translates into impacts on communities and ecosystems remains poorly understood. One study of a stream that is lit by ALAN (and thus potentially adapted to ALAN) provided evidence that community structure and ecosystem function can be altered because of changes in aquatic-terrestrial fluxes of invertebrates [20]. A separate study of ALAN-naïve forested headwater streams concluded that short-term exposure (five weeks) to artificial light changed invertebrate behavior, but did not significantly alter other trophic levels [16]. One reason for this discrepancy might be that ALAN represents a sustained perturbation with long-term cumulative effects [6,16]. Much of the available knowledge is based on short-term experiments that were carried out within a single generation of studied taxa (often days to weeks). These do not allow for the consideration of long-term response mechanisms. To reliably predict the ecological consequences of ALAN in natural systems, it is critical to have a better understanding of longer term processes that moderate the susceptibility of communities to an illuminated environment [6].
In the fields of lighting engineering and urban planning, urban lighting and light pollution are mainly considered using terms such as efficiency, glare, and visual comfort [1], with little or no consideration of natural ecosystems upon which humans depend. The technical report of the International Commission on Illumination (CIE 158:2004, [21]) is primarily focused on the effect of light on criminality and perceived safety in public areas. The report does not discuss the biological effect of light on human residents or the environment. Technical report CIE 126:1997 [22] deals with the minimization of skyglow to improve the conditions for astronomical observations, but does not discuss the effect of ALAN on ecosystems. In the past decade, there have been increased efforts to investigate the biological effect of light on the non-visual system of receptors in humans, and to formulate guidelines regarding quantitative measures that can be considered in the evaluation of lighting systems. Technical report CIE 158:2004 [21] denominates action functions for the nocturnal human melatonin suppression, and the German draft standard DIN V 5031-100:2009 [23] defines a possible measure to quantify this effect (see also DIN SPEC 67600:2013, [24]). Technical report CIE 150:2003 [25] addresses the effect of obtrusive light on ecosystems, but cites a lack of data to define quantitative measures. It is clear that an interdisciplinary approach is needed to successfully understand, quantify, and mitigate the effects of ALAN on ecosystems.
Apart from two recent long-term experimental illumination studies that included several generations of key species [26,27], the effects of ALAN have only been studied in laboratory experiments (e.g., [15,28]) or by making observations at or near existing public light infrastructure [29,30,31,32]. The limitations of these approaches include an inability to predict community- and ecosystem-level effects from laboratory experiments, and the potentially confounding effect of studying communities of organisms that are already accustomed to the presence of ALAN [12]. New experimental infrastructures are needed for the study of response mechanisms including acclimation and adaptation, including the physiological, behavioral and evolutionary compensatory mechanisms that can be linked to environmental context and seasonal timing [6].
The experimental setup we present here constitutes an important next step in experimental research of ALAN. We installed commercial streetlights in a previously unlit rural area, and the infrastructure was explicitly designed to mimic urban street lighting conditions in design, illuminance level, and homogeneity of illumination. The aim is to investigate the impacts of artificial light on both structural and functional components of an ALAN-naïve riparian ecosystem (i.e., aquatic and terrestrial ecosystems and their boundary) and thereby circumvent the limitations of earlier approaches mentioned above. The experiment will observe the impact of ALAN on animals, plants, and microbial communities, including species inhabiting forest, grassland, riparian and aquatic habitats. In addition to species-specific effects on arthropods, bats, birds, and fish, we examine changes to community diversity and quantity of arthropod catches. Specific topics include changes in the behavior and in food source preferences of bats as obligatory nocturnal predators, the effects on reproduction in birds and on hormones that underlie a day-night-rhythm or a seasonal rhythm in fish. The large size of our infrastructure does not allow for replication of entire sites in the strict sense; however, the setup allows for a change of lighting between sites. Assigning one site as the treatment and the other as the control is adequate for a deductive experiment, provided the a priori probability of corroboration is known [33]. When this is not feasible, experiments can be complemented by replicated laboratory studies as was done in a related study of microbial communities [12]. In the future, control (dark) and experimental (lit) sites can be alternated in order to corroborate any findings. For highly mobile organisms whose home range is larger than one or both fields, our setup may not be suitable for testing certain hypotheses because of scale-dependence. Studies of long-term effects that require sustained illumination of treatment sites could be carried out using additional sites (not yet planned) or through collaboration with other infrastructures [26,27]. Here, we describe the study area and the newly constructed infrastructure including a characterization of the illumination with photometric measurements. We also outline sampling regimes for a range of experiments taking place, and we present preliminary findings from studies examining the short-term effects of introduced ALAN on insects and spiders.
Our experimental setup allows us to test six main hypotheses: (i) ALAN acts over a longer (i.e., multi-year) time-period with delayed and slowly increasing responses from many aquatic and terrestrial organisms; (ii) the long-term presence of ALAN will lead to altered community structure by favoring species that are able to take advantage of the low light intensity at night; (iii) the attraction of species to light sources results in rows of street lights acting as barriers to insect dispersal; (iv) ALAN can alter the exchange of organic matter between stream and riparian systems by changing the reciprocal aquatic-terrestrial flux of invertebrates; (v) altered cross-boundary interactions will lead to changes in food web dynamics, with a larger number of species with aquatic larval stages at lit street lamps compared to unlit street lamps; and (vi) that seasonal changes in community structure and function will change because of the loss of an important seasonal cue, leading to changes in phenology such as insect emergence and bird breeding activity.

2. Material and Methods
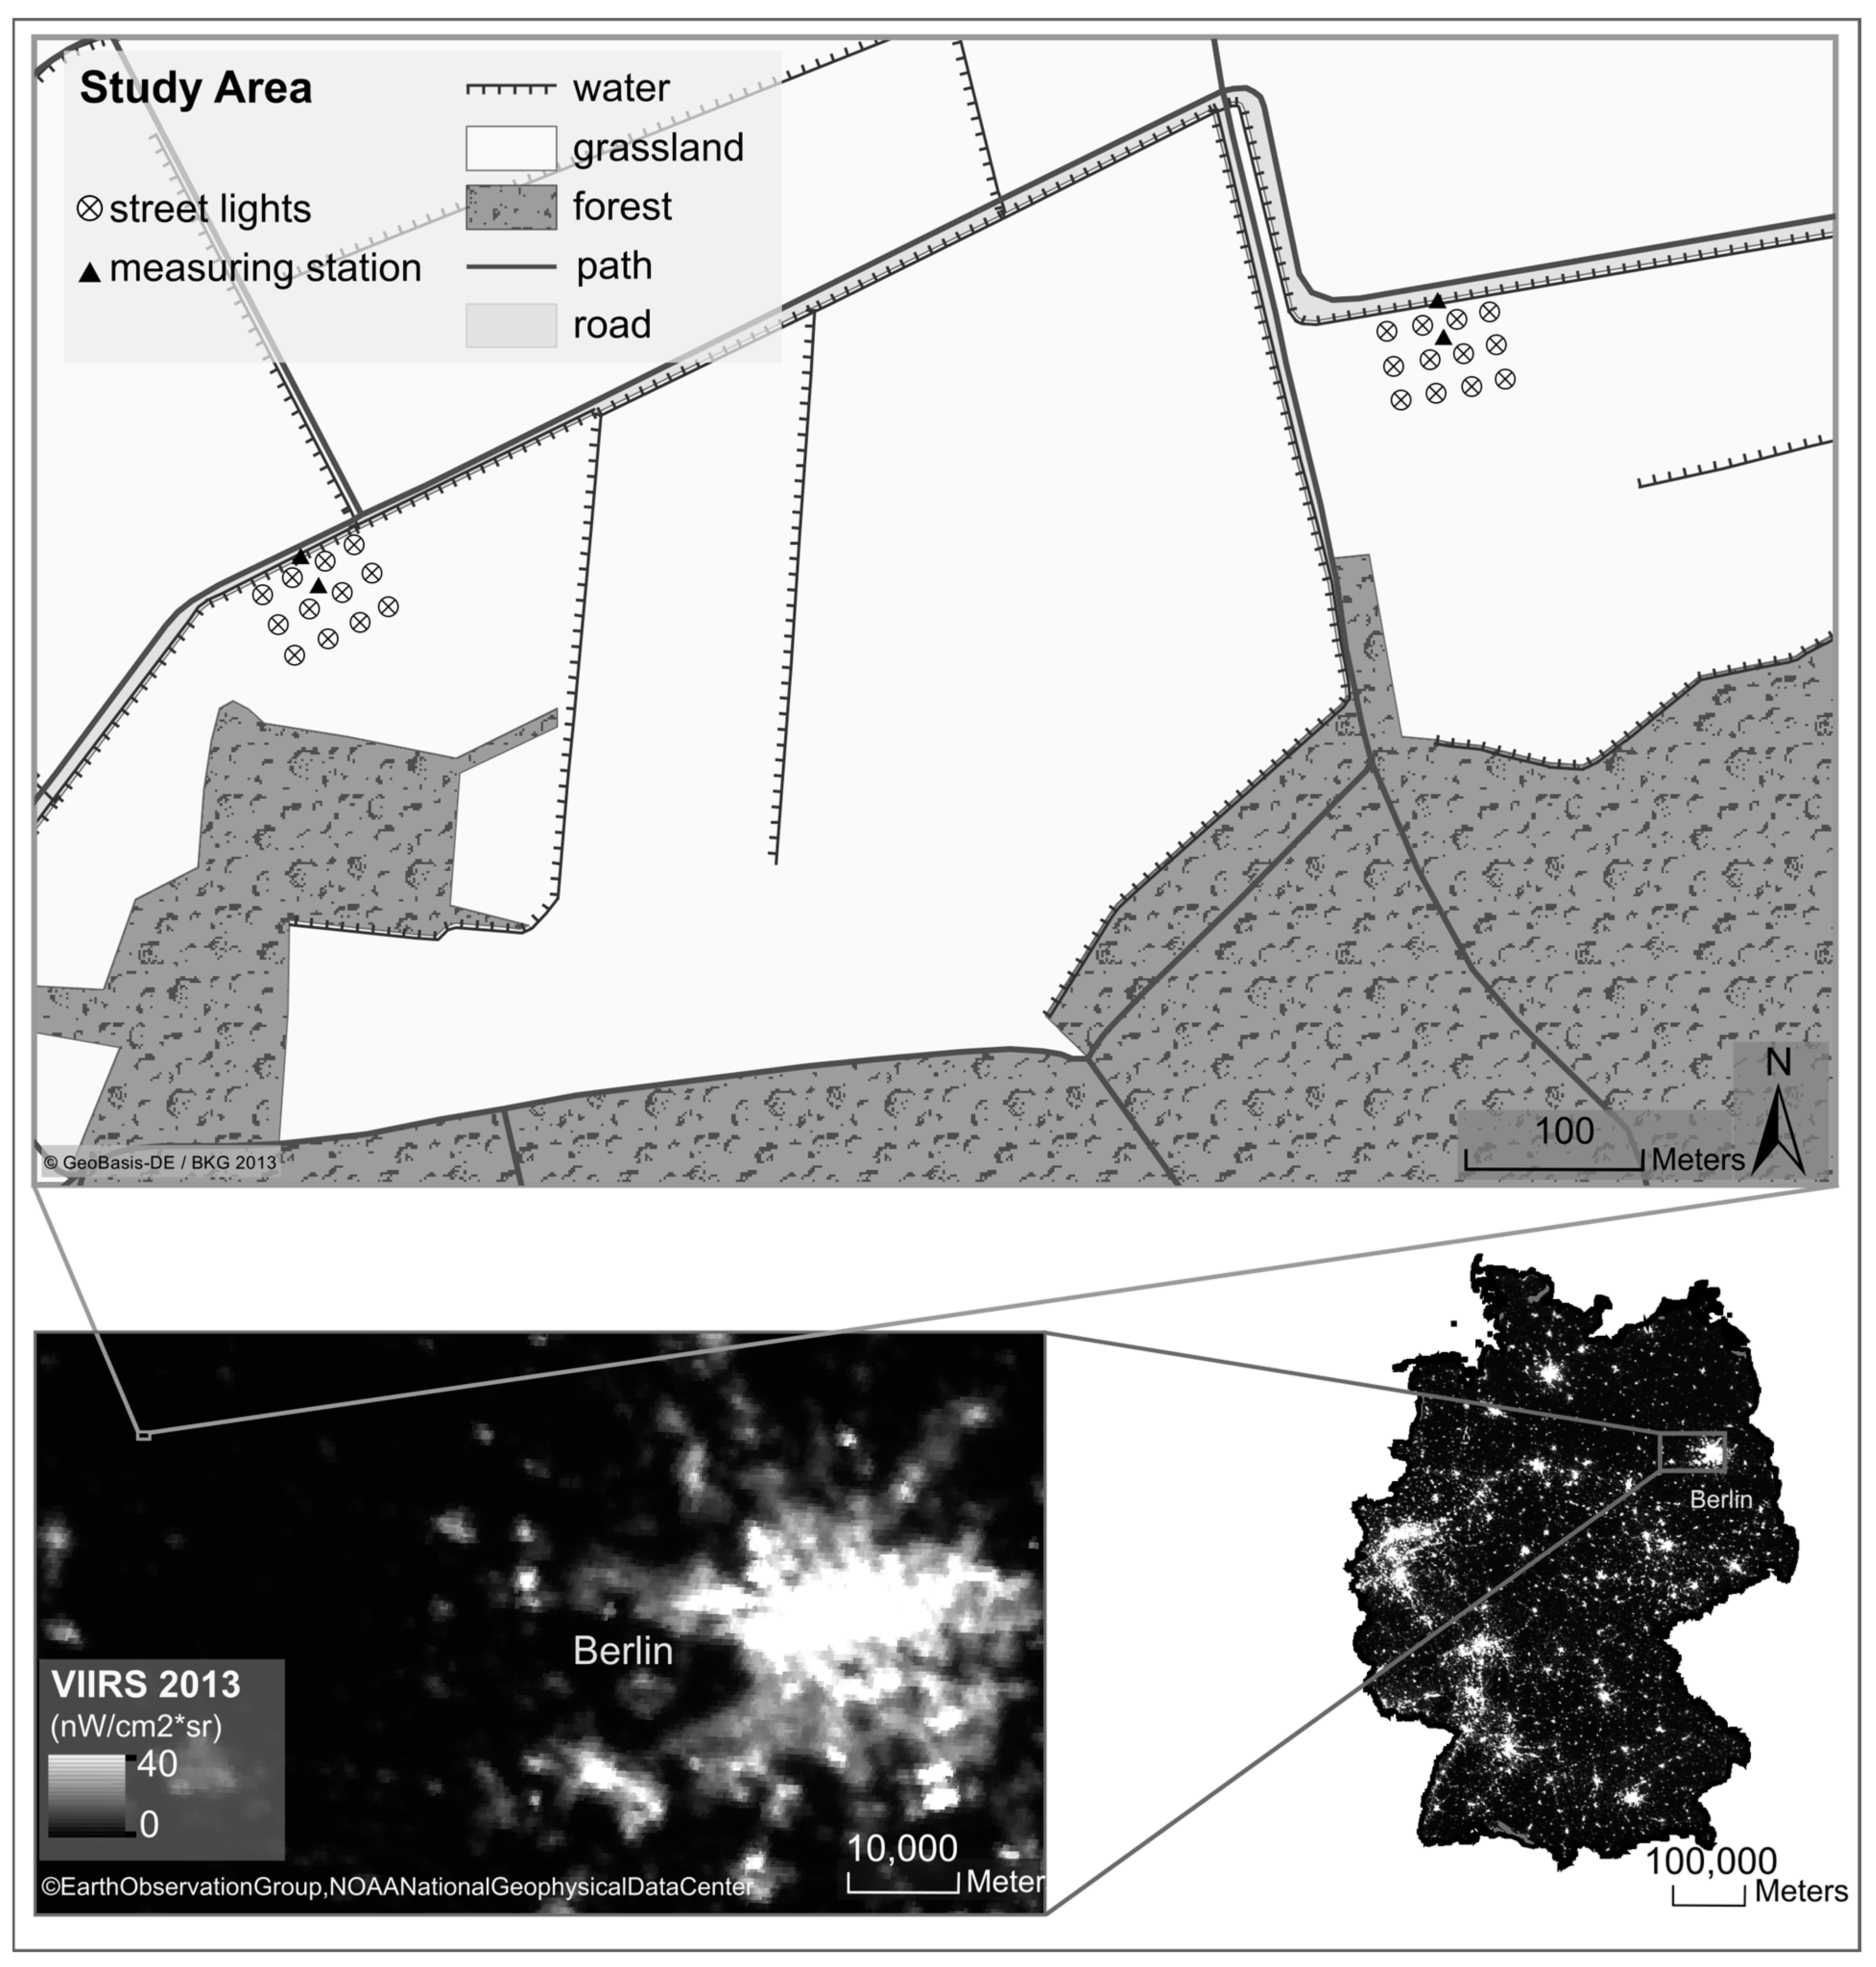
2.1. Study Area

The study area is located ca. 70 km northwest of Berlin, Germany, in the Westhavelland region of the federal state of Brandenburg (Figure 1). The Westhavelland Nature Park covers 1315 km2 [34] and is one of the least-illuminated areas in Germany. Accordingly, an area of 750 km² within the Nature Park was recently designated an “International Dark-Sky Reserve” by the International Dark-Sky Association (IDA) [35]. We chose two light-naïve experimental sites for the study, and 12 street lights were added to each site (Figure 1). Both sites consist of managed permanent grassland adjacent to an agricultural drainage ditch. The ditch itself, is approximately 5 m wide and mean annual water depth is 50 cm (varying from 24–76 cm depending on the management). The water surface is typically 50 cm below the upper rim of the grassland sites. The two grassland sites are under the same management regime (mown for hay twice per year between June and October, no fertilizer). There is little or no water flow in the ditch except during strong precipitation events. The main flow direction, as indicated in the official topographic map for this area, is from east to west (Blatt 3340—NO Ferchesar, 1:10,000, Landesvermessung und Geobasisinformation Brandenburg). Mixed forest adjoins the western site at a distance of approximately 100 m, and the eastern site at 200 m. The two Verlust der Nacht experimental sites (“western” and “eastern”), are separated by a Euclidian distance of ca. 600 m (ca. 800 m along the drainage ditch (Figure 1)) and a row of trees along the path west of the eastern site.
Figure 1. Study area (upper panel) located 70 km north-west of Berlin in Westhavelland, Germany. The experimental sites, each 60 m × 40 m, are located along a drainage ditch. The map (lower panel) based on nighttime satellite data shows radiance in nW·cm−2·sr−1 (with a 0.8 std stretch). It is derived from the first global cloud-free composite of nighttime lights by the new Visible Infrared Imaging Radiometer Suite (VIIRS) on the Suomi-NPP satellite (Earth Observation Group, NOAA National Geophysica Data Center, 2013).
Sustainability 07 15593 g001

2.2. Street-Light Infrastructure and Sampling of Light and Abiotic Data

2.2.1. Street-Light Infrastructure

In 2012, two identical experimental settings were installed on the two experimental sites, consisting of 12 street lights arranged in three rows parallel to the drainage ditch (Figure 2). The first row of lights is 3 m from the drainage ditch. The lights are placed on a 60 m × 40 m grid with 20 m spacing (Figure 2). The setup allows for the testing of a light gradient from the drainage ditch towards the forest, as well as parallel to the ditch. Street lights L01–L12 are in the western site, and street lights L13–L24 are in the eastern site. The coordinate system supports the documentation of the location of traps and probe sampling.
When a site is lit, illumination starts and ends during civil twilight. The timing is controlled by an electronic astronomical time switch that contains information about the location on the globe and the corresponding times for civil dusk/dawn, here at −3 degree elevation angle between horizon and sun. This is one of two methods regularly used for street light regulation in Germany.
The luminaires (Schréder Saphire 1) are mounted 4.75 m above ground and are equipped with 70 W high-pressure sodium lamps (OSRAM VIALOX NAV-T Super 4Y). The spectral distribution of the light emitted by this type of lamp (Figure 3) was measured using a compact spectrometer (JETI specbos) under luminaire L08. The total luminous flux is around 6750 lm, for a luminous efficiency of 96 lm/W. Technical specifications of the luminaire declare an upward light ratio (ULR) of 0.5%, which is the percentage of the luminaire’s total luminous flux emitted above the horizontal. According to technical report CIE 126-1997 [22], which was incorporated into currently applied standards (e.g., EN 12464-2:2007 and EN 12193:2007), the upper limit for the ULR depends upon the environmental zone where the lighting installation is located. The ULR of 0.5% is higher than the ULR upper limit of 0% for the environmental zone E1 “intrinsically dark landscapes”, which includes national parks, and lower than the upper limit for ULR of E2 (5%), E3 (15%), and E4 (25%) in rural urban locations to city centers.
Figure 2. Schematic drawing of the western site at the agricultural drainage ditch (d) with street lights (L01-L12), measuring stations for light and abiotic data (M01, M02), and insect traps (legend: denoted by letters A, E, P next to symbols). Dashed orientation lines: horizontal: 60 m, vertical 40 m. Coordinates of x, y, and z axes give positions on the experimental sites.
Sustainability 07 15593 g002
Figure 3. Spectral distribution of light emitted by a high-pressure sodium lamp (OSRAM Vialox NAV-T Super 4Y 70 W) mounted in a Schréder Saphire 1 luminaire given by the solid black line. For reference the spectral sensitivity of the human eye for photopic vision is given by the dash-dotted grey line.
Sustainability 07 15593 g003

2.2.2. Automated Sampling

Light, weather, and water-related parameters are recorded continuously. Two light and abiotic measuring stations were placed in each experimental site (see Figure 2). Measuring stations (M01 and M03, Figure 2) consist of device towers with equipment mounted on crossbeams at 2.75 m and 5.25 m height. Weather-related parameters include temperature, moisture, pressure, and wind (Table 1). Light-related parameters include broadband solar irradiance, photosynthetically active radiation, illuminance below and above the street lights and the night sky radiance (cf. Table 1). The underwater measuring stations at each site (M02 and M04, Figure 2) are 30 cm below the mean water surface at the edge of the drainage ditch (~80 cm below the upper rim of the grassland). They collect water-related parameters including temperature, oxygen, conductivity, pH, and chlorophyll-a (Table 1). All parameters are measured every 15 min and stored on a data logger.
Table 1. Devices used to measure light and abiotic data and their positions on the experimental sites. Coordinates: see Figure 2; z gives the vertical distance from the ground.
Property (Unit)DevicePosition Coordinates (m) P(x, y, z)
Light-Related Parameters
broadband solar irradiance (W/m2)CMP3 Pyranometer (300 to 2800 nm), Kipp & ZonenM01/03: P(30, 30, 2.75)
photosynthetically active radiation (µmol·m−2·s−1)PQS 1 PAR Quantum Sensor (300–700 nm), Kipp & ZonenM01/03: P(30, 30, 2.75)
M02/04: P(30, 43, −0.80)
relative irradiance (mV); after transformation: illuminance (lux)Kuffner-Lightmeter Mark 2.4 V03.01 Analog, K2W LightsM01: P(30, 30, 2.75)
M01: P(30, 30, 5.25)
M03: P(30, 30, 2.75)
M03: P(30, 30, 5.25)
night sky radiance (magSQM/arcsec2)Sky Quality Meter, Unihedron SQM-LU-DLL16: P(60, 40, 4.80)
Weather-Related Parameters
temperature (°C)Vaisala Weather Transmitter WXT520M01/03: P(30, 30, 2.75)
precipitation (mm)Vaisala Weather Transmitter WXT520M01/03: P(30, 30, 2.75)
relative humidity (%)Vaisala Weather Transmitter WXT520M01/03: P(30, 30, 2.75)
barometric pressure (hPa)Vaisala Weather Transmitter WXT520M01/03: P(30, 30, 2.75)
wind intensity (m/s)Vaisala Weather Transmitter WXT520M01/03: P(30, 30, 2.75)
wind direction (degree) (0°–359°)Vaisala Weather Transmitter WXT520M01/03: P(30, 30, 2.75)
precipitation (mm), incl. snow, drizzling rainTipping bucket raining gauge (0,2 mm)M01/03: P(30, 30, 2.75)
wind direction (3D anemometer, vectors x, y, z (m/s), transformation to (°))Ultrasonic 3d Anemometer; THIES CLIMAM01/03: P(30, 30, 5.25)
Water-Related Parameters
temperature (°C)YSI 6600 V2 data sonde, YSIM02/04: P(30, 43, −0.80)
O2 concentration (mg/L)YSI 6600 V2 data sonde, YSIM02/04: P(30, 43, −0.80)
O2 saturation (%)YSI 6600 V2 data sonde, YSIM02/04: P(30, 43, −0.80)
pHYSI 6600 V2 data sonde, YSIM02/04: P(30, 43, −0.80)
conductivity (µS/cm)YSI 6600 V2 data sonde, YSIM02/04: P(30, 43, −0.80)
chlorophyll-a concentration (µg/L)YSI 6600 V2 data sonde, YSIM02/04: P(30, 43, −0.80)
Continuous acquisition of light and abiotic data started in June 2012. Parameter values collected before the start of the artificial illumination were used to test for a difference between the sites. A selection of the most representative parameters used for the site comparison (air and water temperature, wind intensity, humidity, light intensity, pH, oxygen, chlorophyll-a) is shown in Figure S1. A generalized least squares model (GLS) was applied to each selected environmental variable (see Figure S1) using the lmne package [36] for R [37]. The analysis incorporated an autoregressive correlation structure of order 2 (corARMA = 2) to account for serial correlation of time series data. The data autocorrelation was tested in each variable using Durbin-Watson statistics in the car package [38] for R. The correlation structure suitability was tested using a likelihood-ratio test [39].

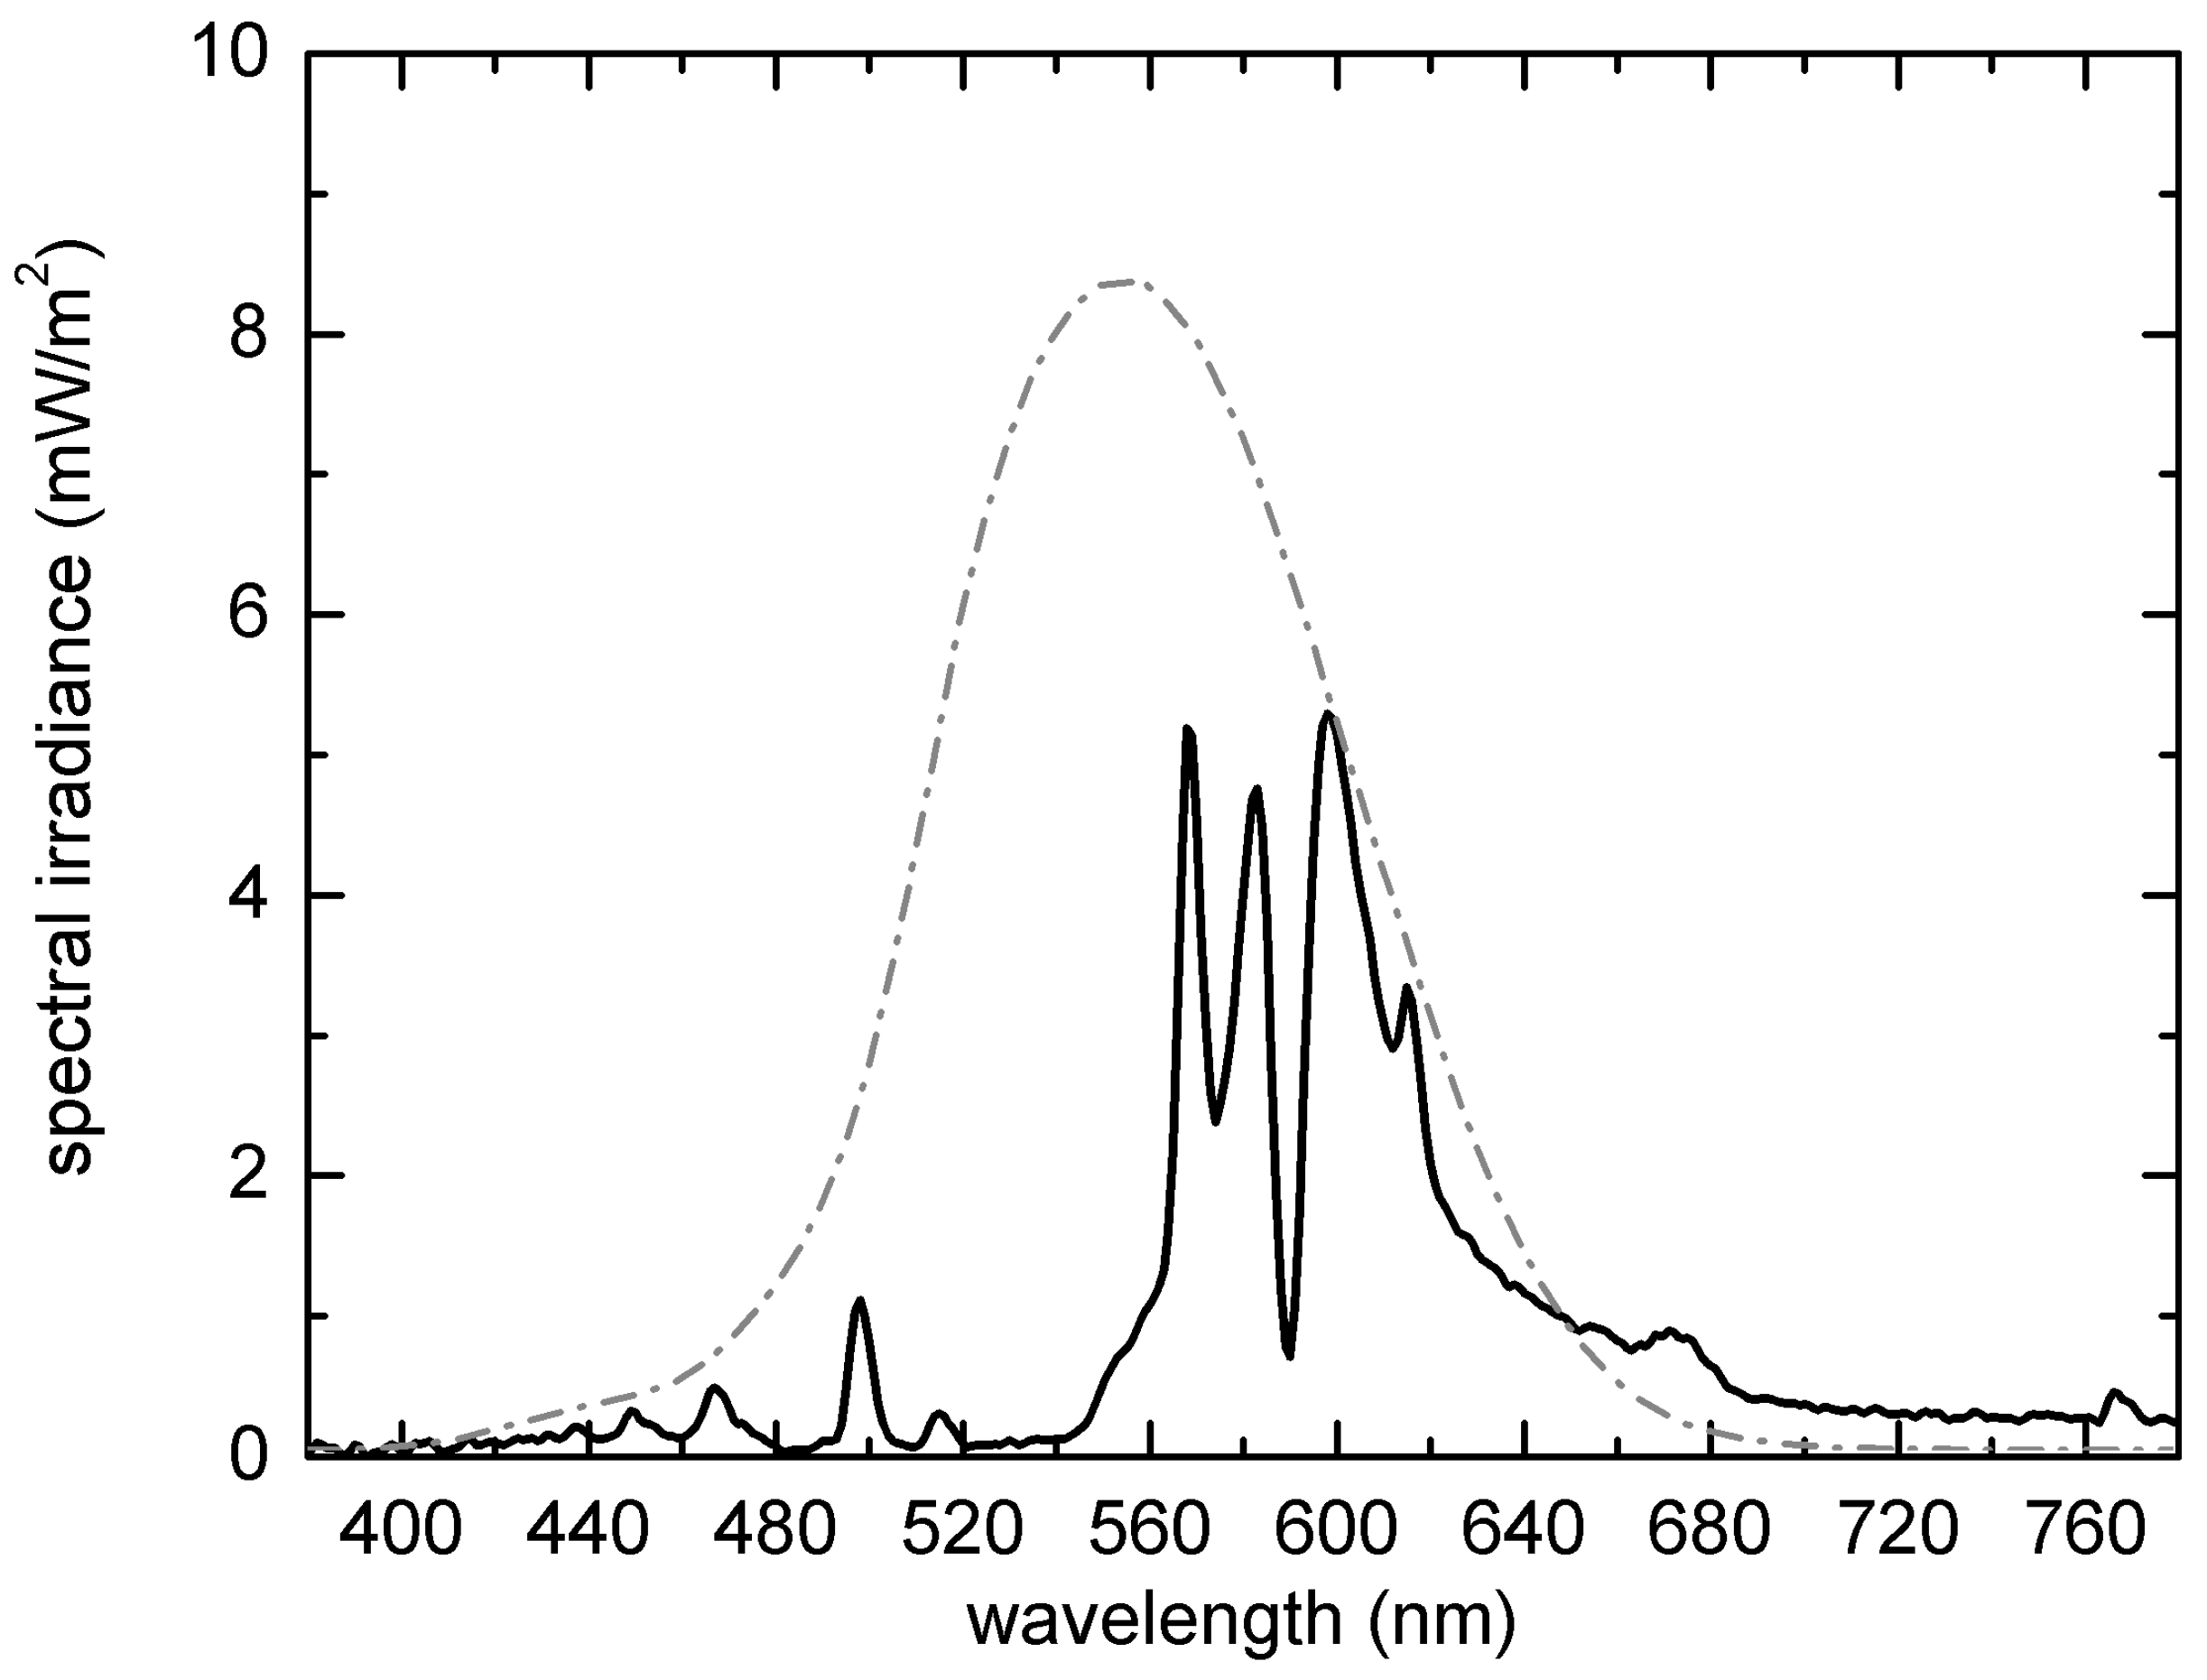
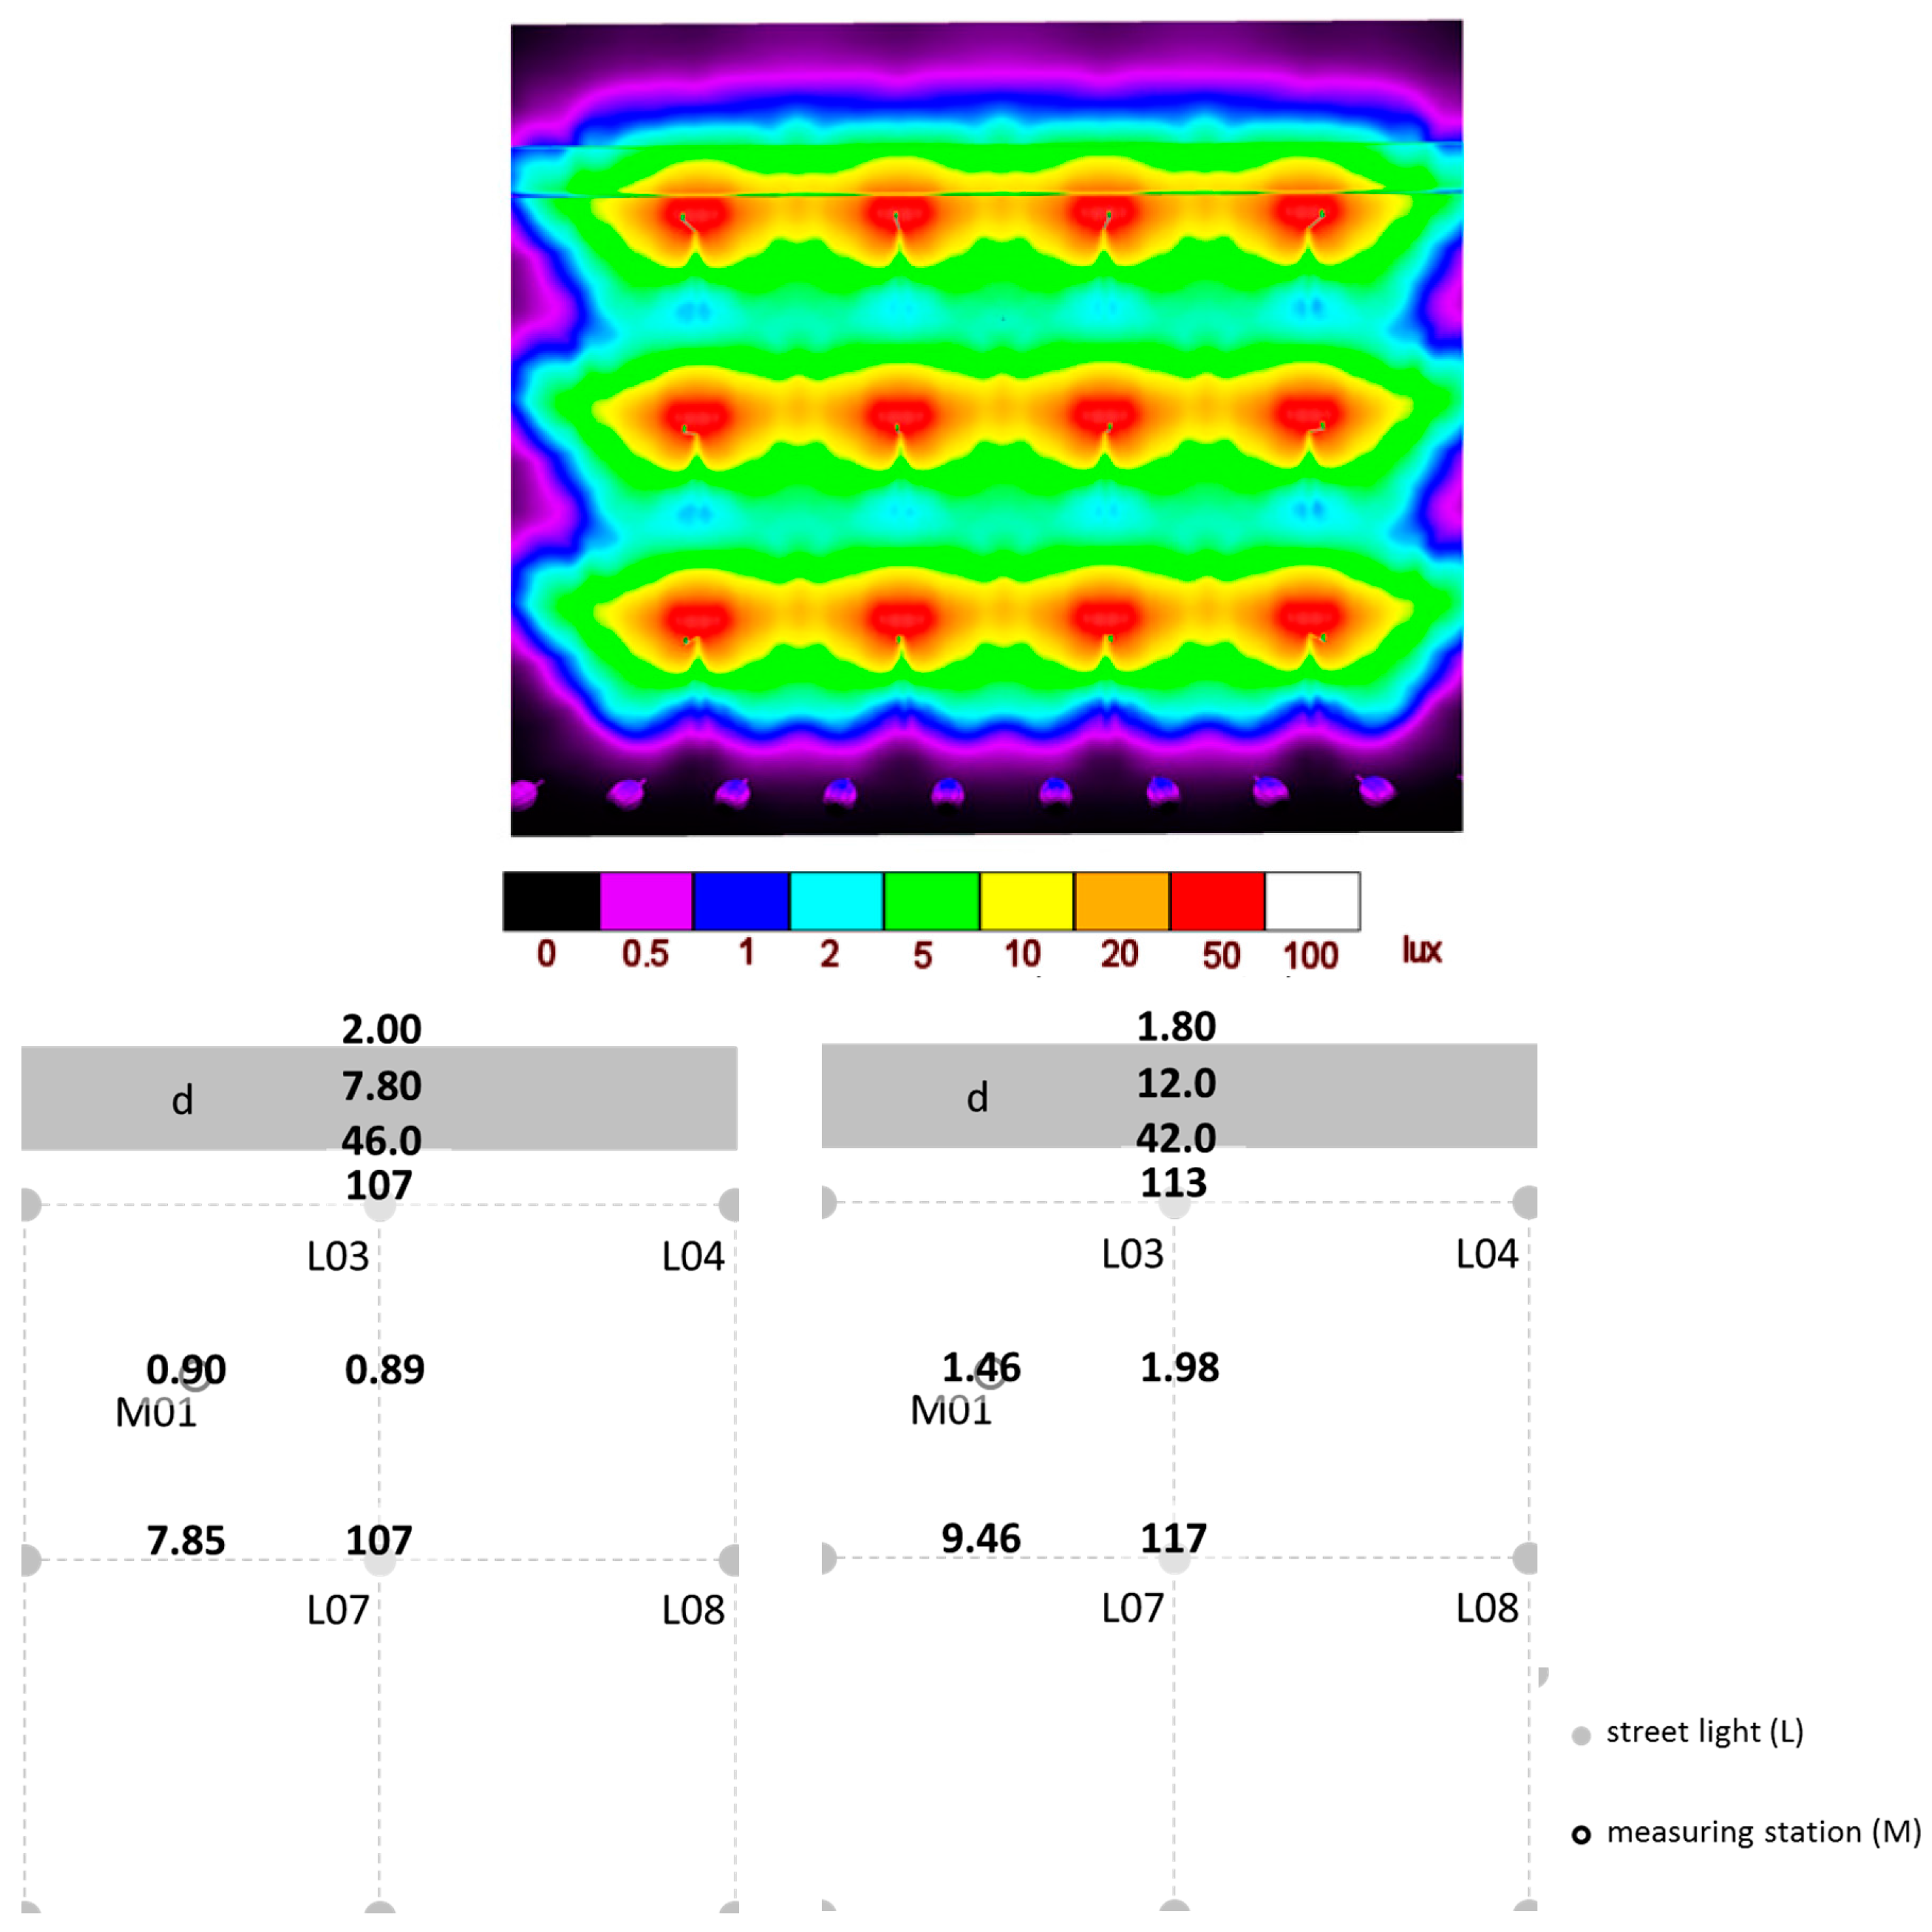
2.3. Photometric Characterization of the Study Area after Installation of the Infrastructure

A photometric characterization of the installed infrastructure and a measurement of the night-sky radiance (skyglow) were conducted in the western site after it was illuminated for a pilot study in 2012 (see Section 1.4.2, below), with skyglow including sky radiance due to celestial light, local light sources and also bright distant sources. For photometric characterization of the illuminated western site illuminance levels (lux) above the ground were measured with mobile lux meters. Illuminance levels were measured at selected positions and compared to a computer-simulated illumination (Dialux software Version 4.10). For simulation, the luminous intensity distribution curve of the luminaire supplied by the manufacturer was applied to the street light arrangement given in Figure 2. Due to the presence of vegetation, measurements at ground level would not have been comparable to calculations. Data were therefore collected 1.5 m above the ground. Starting at lamp L07, illuminance values were measured in between adjacent lamps. Starting at lamp L03, illuminance values were measured at the edge of the drainage ditch, in the middle, and at the opposite edge of the ditch.
The night-sky radiance was quantified using a stationary Sky Quality Meter (SQM) at the control site, installed on top of street lamp L16 at a height of 4.80 m (L16, Table 1) [40,41]. Stationary devices like Kuffner Lightmeters or SQMs are used to produce skyglow time series [42,43]. The SQM measures radiance (W/m2) in a band that is roughly similar to, but does not match, human photopic sensitivity, with extra sensitivity in the infrared. Hence only approximate conversion to luminance values (cd/m²) can be given.
The night sky radiance was continuously measured at the unlit site using an SQM-LU-DL (Unihedron, Grimsby, ON, Canada, Table 1) installed at the measuring station in June 2012. The SQM measures radiance in the astronomical units magSQM/arcsec2 [44]. We report sky luminance relative to an assumed “natural night sky luminance” of 252 μcd/m2, following the convention of Cinzano et al. [45]. All measurements are archived according to the community standard for skyglow measurements [46]. To test the effect of clouds on the sky radiance, an analysis similar to the one described by Kyba et al. [42] was performed, in which times were restricted to within half an hour of midnight. The radiance of the moonless night sky at the study area was then compared to that observed with another SQM-LU-DL located in central Berlin (52.5241° N, 13.3976° E) during 8 June 2012–9 September 2012.

2.4. Biological Studies

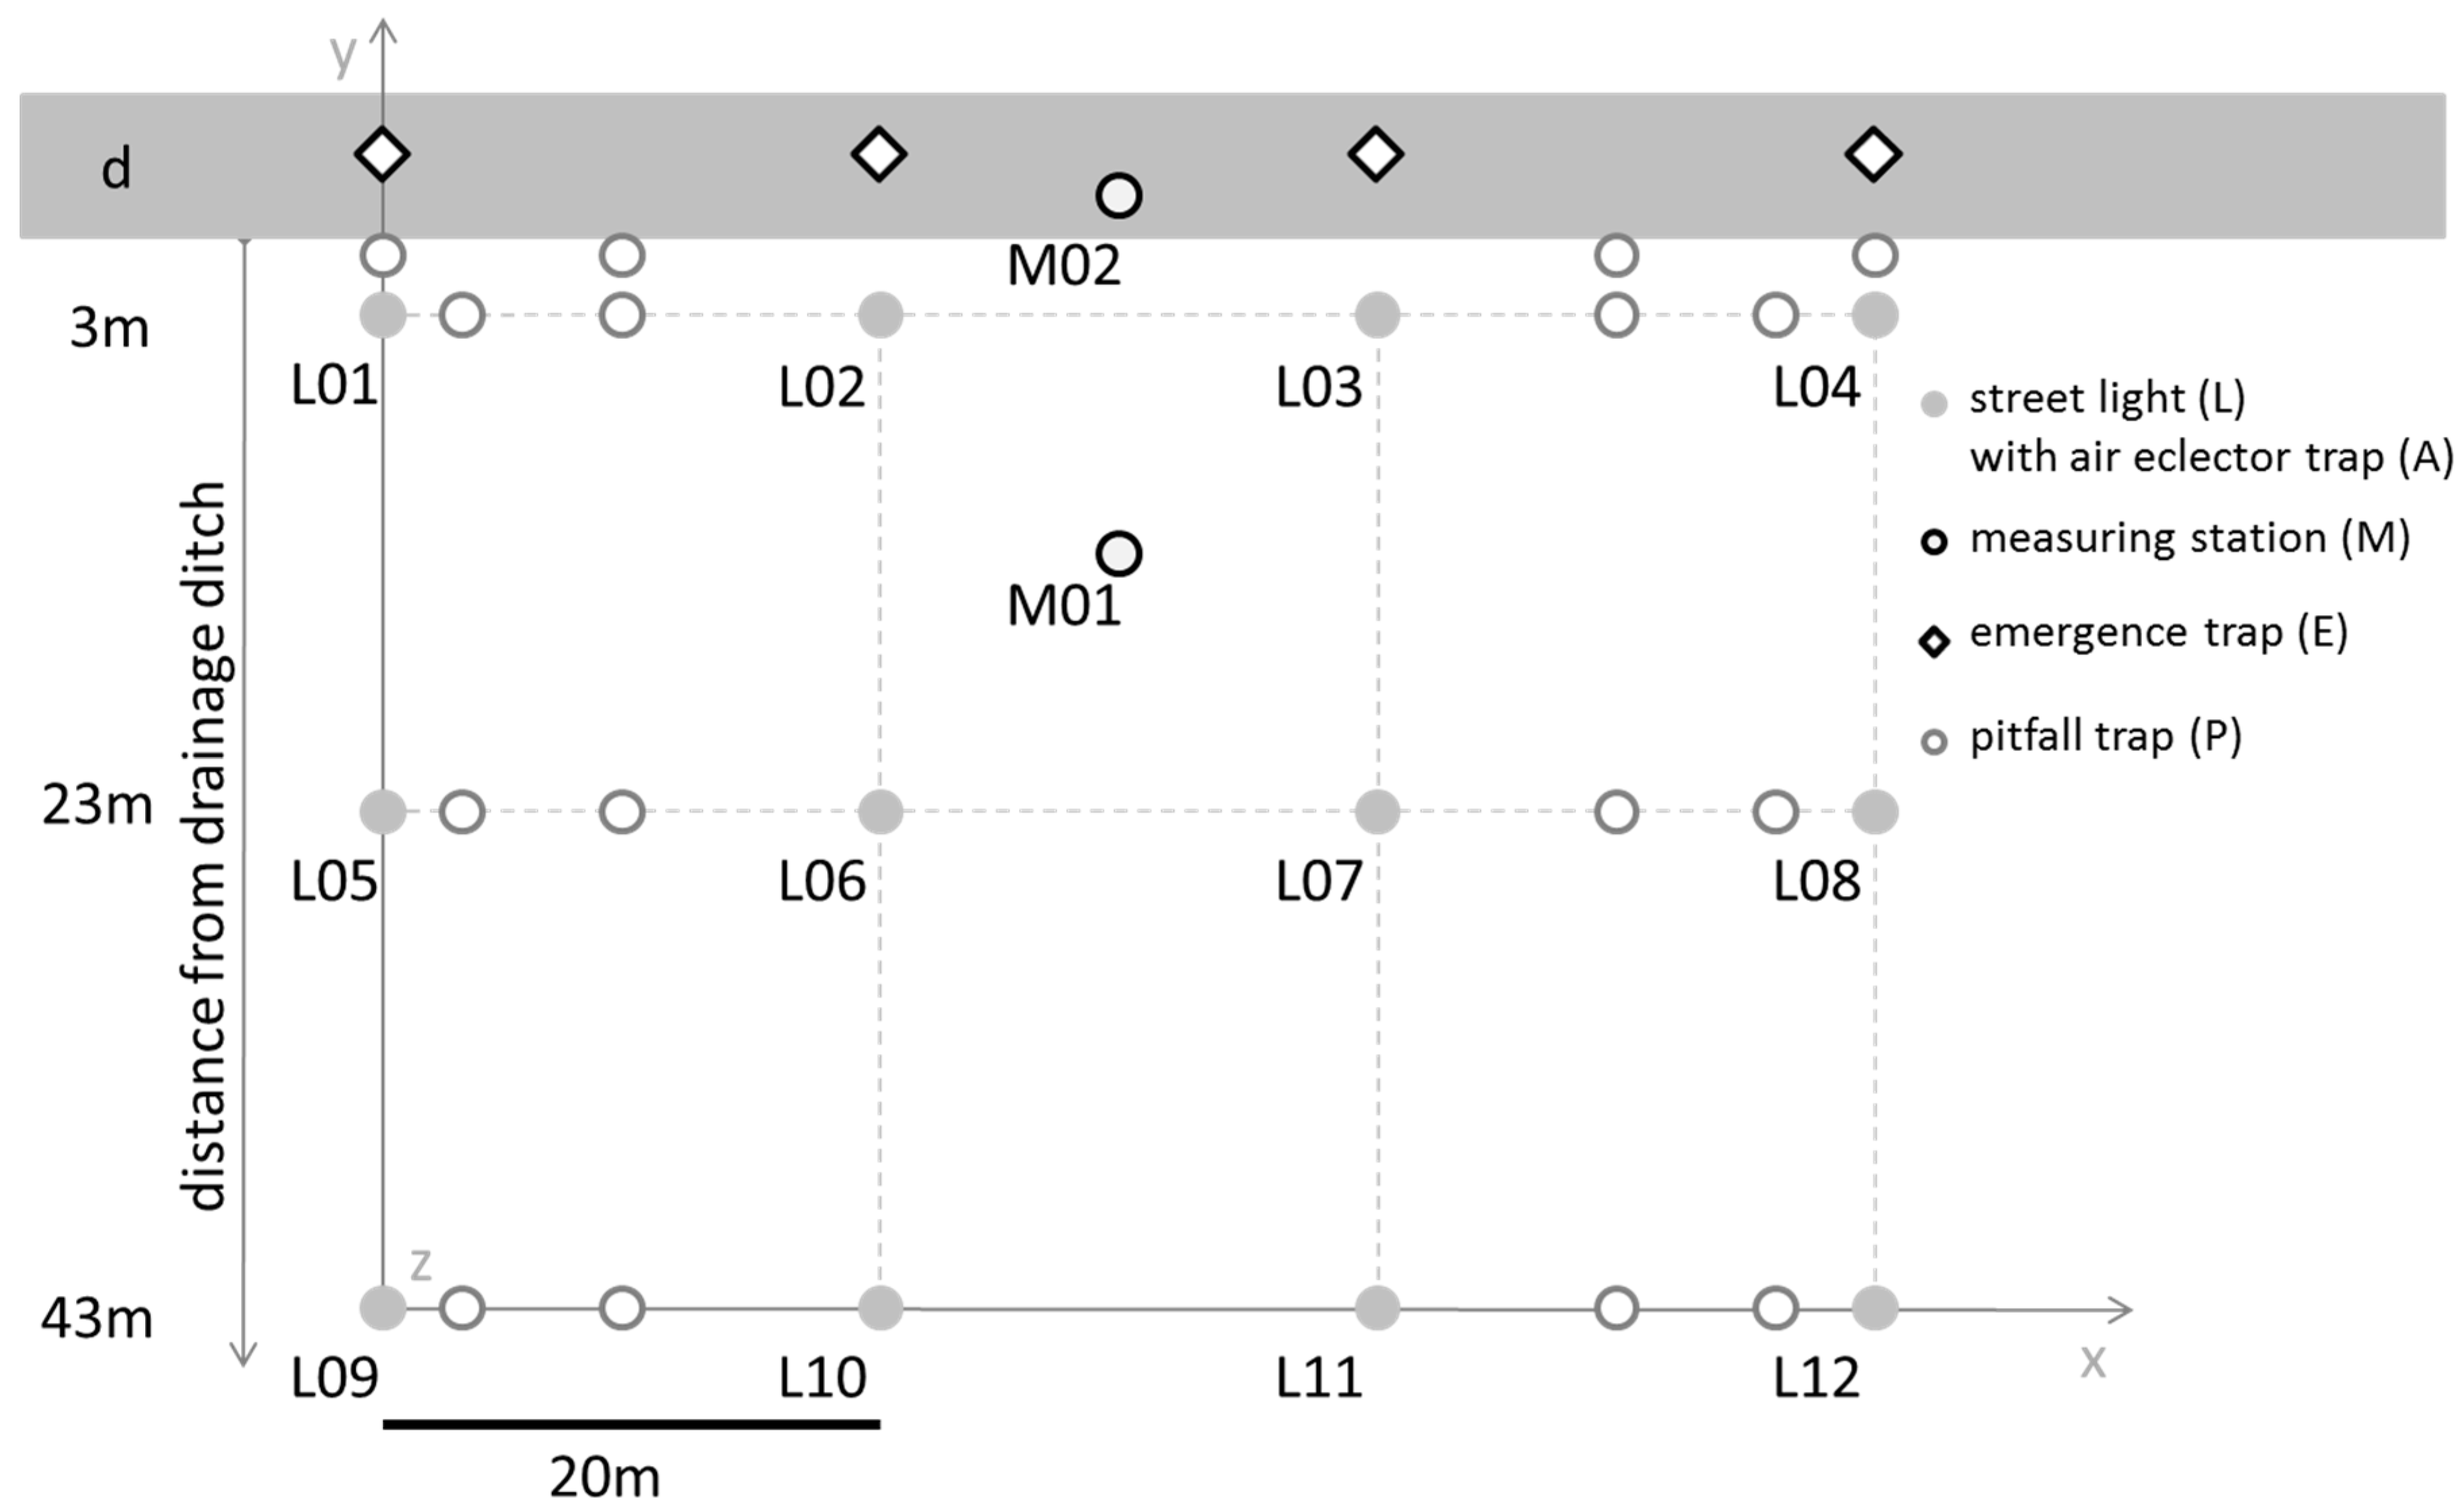
2.4.1. Arthropod Sampling Design

The description of the sampling and observation design in the following refers to a single experimental site, but the street light infrastructure at both experimental sites is identical. Arthropods are sampled at the luminaires, at ground level, at the surface of the drainage ditch and within the drainage ditch using different trap types (Figure 2). Flying insects are sampled using air eclector traps (A, Figure 2) [47]. These consist of two transparent Plexiglas panels (204 mm × 500 mm × 3 mm) that intersect at a 90-degree angle. Each trap is connected to a 25-cm diameter funnel that leads to a collecting bottle filled with 200 mL 70% ethanol. All traps are mounted 0.5 m below the height of the luminaires and are perpendicular to the orientation of each luminaire so as not to block full illumination of the area. Ground-dwelling insects are sampled using 16 pitfall traps (P, Figure 2) in between the street lights and near the ditch. The pitfall traps consist of a container (15-cm diameter) filled with 70% ethanol and inserted in the ground with its rim at the surface. To reduce the amount of rain and debris entering the trap, and to ensure that no flying insects fall into the traps after exhaustion at the lamps, they are covered by transparent Plexiglas. Aquatic insects emerging from the ditch are sampled using four floating pyramid-shaped emergence traps (E, Figure 2) (base of each pyramid: 0.85 m × 0.85 m). The sides of the traps consist of 300-µm mesh and at the top is a funnel that allows the entrance of emerging aquatic insects but prevents them from escaping. A container at this top is filled with 70% ethanol (see e.g., [19]). Each emergence trap is positioned in front of a street light 1 m from the edge of the drainage ditch. Four bottle traps (B, Figure 2) baited with cat food are installed in the ditch near the emergence traps to catch and determine the water beetle fauna.

2.4.2. Pilot Study

We carried out a pilot study addressing the short-term effects of introduced ALAN on flying insects and spiders on ten nights between 13 May and 23 August 2012 during half-moon periods. Sampling took place only on nights with no rain; therefore the sampling occurred up to two days before or after the first and third quarter moon. Both sites were dark at the start of the study. Illumination of the western site (treatment) started in the evening of 25 July 2012 and the eastern site (control) was kept dark throughout the pilot study. Illumination was furthermore added to the western site (treatment) for one night on 11 July (illumination test). Insect catches were conducted twice in two subsequent nights, 10 and 11 July and 24 and 25 July, with 11 and 25 July being nights of illumination of the western site, to analyze the immediate effect of illumination.
Captured individuals were identified to the level of Order (insects) or classified as spiders (Order Araneae), respectively. Arthropod catches (insects and spiders) were standardized to count per hour performance of the air eclector traps (catch per unit of effort, CPUE). The arthropod community present in the traps before and after the illumination of the treatment site was determined. Differences in the catches of insect orders and spiders between experimental sites before and after illumination of the treatment site were examined using linear mixed-effect models using the lmer() function in the lme package [48] for R.
The first artificially illuminated night (11 July) was analyzed once separately (overnight term) to test for any immediate changes using the model log(X + 1) ~ TS + (1|Trap) where X was arthropod CPUE and TS was the effect of treatment and site, with four categories: before-east (BE), before-west (BW), after-east (AE), after-west (AW), where “before” represented the time when the lamps were off in both sites and “after” represented the time when the treatment site (western site) was illuminated. Effects within the period of the study were analyzed using all sampling dates and the model log(X + 1) ~ TS + (1|Trap) + (1|Date), where traps and sampling days were used as random factors. A separate analysis was made for only the aquatic insects, defined as those taxa with an aquatic immature stage. The model fixed factor was tested and selected by likelihood ratio tests against reduced models (without the fixed factor) using ANOVA and AIC comparison [49]. Stepwise selection of the best fit model was performed using a χ2 test (implemented with the drop1() function in the stats package for R). Residuals were tested for normality by applying the Wilk-Shapiro test [50] and log-transformed in the model. The variance explained by the model was calculated as pseudo-marginal variance (mR2) that describes the proportion of variance explained by the fixed factor(s) [51] calculated with the r.squaredGLMM () function in the MuMln package [52] for R. We used a post hoc multiple comparison analysis using the testInteractions() function in the phia package [53] for R to examine CPUE differences among conditions (TS). A sequential Bonferroni procedure [54] was used to reduce Type I error or the false rejection of the null hypothesis.

2.4.3. Monitoring of Bats as a Group of Obligatory Nocturnal Mammals

Past studies have found both negative and positive consequences of artificial light for bats [55,56]. Our working hypothesis is that artificial light will change the bat assemblage foraging at the lit site compared with the assemblage foraging at the dark site. Specifically, we predict that foraging activity of bats such as Pipistrellus pipistrellus that also inhabit urban areas will increase at the lit site compared with the dark control site because of the aggregation of insects around artificial light [26,57,58]. In contrast, bats with a more rural distribution pattern, such as Pipistrellus nathusii should be less abundant at the lit than at the dark site since they are generally more light-averse. Similarly, species that usually forage in cluttered space should be less abundant at the lit site because they are adapted to the dark interior of their forest habitat and might be particularly light-averse [56,59].
Bat activity is monitored acoustically using 10 batcorders (ecoObs GmbH, Reindelstr. 2, 90402 Nürnberg, Germany). Batcorders are specifically designed to automatically record the echolocation calls of bats. Recordings are triggered by the ultrasonic echolocation calls of bats so that devices do not have to record continuously. Batcorders record with a sampling rate of 500 kHz and at 16 Bit amplitude resolution. The quality value used to distinguish bat calls from noise is set to 20. The threshold for triggering a recording is defined as −27 dB, which corresponds to a range of about 10 m distance between the emitting bat and the microphone, depending on species specific call characteristics, call direction, and weather conditions (e.g., humidity and temperature). We set the post-trigger to the batcorder’s maximum, such that calls between which more than 800 ms elapsed are saved in separate files, and a minimal threshold frequency of 14 kHz. To avoid recordings of echoes, we fix each batcorder on top of a pole 3 m above ground and at least 3 m away from adjacent vegetation. The electret microphone of the batcorder is arranged at the tip of a 20 cm protruding extension and characterized by a high omnidirectionality (0 until −9 dB between 0 and 180° incidence). Microphones are calibrated in order to guarantee the comparability between recordings of different devices. The batcorders are positioned so that the microphone extension is orientated horizontally. To investigate the effects of ALAN on general bat activity, feeding activity, and bat species composition, a batcorder is installed in the center of both the lit and unlit site. Another batcorder is set up a few meters northwest and southeast of the two experimental sites, respectively, to investigate whether ALAN impacts bat activity farther from the light source (Figure 1). In addition, batcorders (two batcorders each) are installed at landscape elements that are usually associated with high bat activity (i.e., a forest edge and a water-filled channel) in proximity to the experimental sites. Recordings are analyzed automatically using the bcAdmin/batIdent software (ecoObs GmbH). Automatic identification of bat calls at a likelihood of 80% or higher are accepted for further analysis. Afterwards, recordings for which the automatic analysis produced results of low reliability are manually re-analyzed. In addition, a randomly chosen set of recordings is manually double-checked to ensure that automatic identification works accurately.

2.4.4. Monitoring of Birds

The sites are smaller than the home ranges and feeding areas of most birds. However, to measure the direct effects caused by the artificial illumination, it is necessary to establish a direct link between the sites and individual birds. This is nearly impossible for most bird species living in the habitat of the experimental sites, dominated by wet meadows and surrounded by small groves and forests, because even small song birds like the meadow pipit (Anthus pratensis) or whinchat (Saxicola rubetra) have territories larger than at least half a hectare. In comparison, starlings (Sturnus vulgaris) are flexible in their choice of breeding habitat if suitable nest holes can be found. Artificial nest boxes provide this functionality and individual birds using these nest boxes benefit, at least partly, from suitable feeding grounds at short distances. In order to establish a breeding colony of starlings at the experimental sites, one artificial nest box was mounted at each of the street lamp posts in April 2013.
While the nest boxes mounted at the lamp posts are an artificial system, this approach allows us to formulate clearer hypotheses than in a descriptive study observing reactions of a natural system. In addition to the illumination we expect observations regarding (i) the acceptance and establishment of a colony; (ii) the intensity of use (occupation rates); (iii) the reproductive success; (iv) the light and stress-related endocrinology; and perhaps (v) evolutionary effects because of changes in mating success similar to e.g., [60]. At first we expect to find differences between the two sites with regard to the establishment of the population in terms of speed and completeness of nest box occupancy, differences in feeding behavior and reproductive success as well as in the physiology of the nestlings. On a longer time scale we will examine differences in colonies caused by changes of population parameters, the population structure, and the food web composition and interaction.
We calculated that if a colony of at least 10 breeding pairs of S. vulgaris could be established at each site, it would solve the problem of scale mismatch in a very elegant way. Surprisingly, our expectations were exceeded as almost all nest boxes were visited and partly occupied by common starlings in the first year. Very few attempts were made by competing tree sparrows. During the following two years we observed an occupation rate of nearly 100% for common starlings exclusively.
Whether artificial night light influences the selection of breeding sites can be addressed directly by the selection, the speed, and the rate of occupation of nest boxes between the two sites. Although there is no opportunity for repetition either by a switch of the illumination between the two existing plots or by one or two additional plots the process of nest occupancy and the preferences for boxes within the sites can give some more insight about the effects of ALAN. It should be possible to show this with statistically sound results over the years. Additionally we have the opportunity to collect detailed information about individual parameters such as body condition, hormone levels, and activity times with much less effort than in ground breeding birds.
In the future, breeding attempts of starlings (S. vulgaris) will continue to be registered and individuals will be banded and measured after females lay the first egg. The nestlings will also be banded. Selected parameters quantifying body size, weight, and condition, as well as blood samples and single feathers for the study of hormone levels and stable isotopes will be collected to minimize disturbance. Adult birds and their offspring will later be marked with RFID tags and the nest boxes will be equipped with tag readers, registering each activity with a time stamp in order to collect activity times [61,62]. Additionally, observations will be used to quantify the type, distance, and use of feeding grounds. All biological parameters will be analyzed in relation to the physical environmental conditions and habitat characteristics found in the study area. The links to the local food web will probably be clearer in the stable isotope signature of offspring compared to adults because only the offspring depend completely on food from the area. Whether we can find direct links to the illumination of the plots will depend very much on the distance to the feeding grounds preferred by the colonies.
Because common starlings eat insects and fruit from soil and vegetation, as well as at least potentially also from the insect traps, we must take this interaction into account. Although it is a rather artificial effect because there is an insect trap mounted on the same pole as each nest box, this system can shed light on the effect of predation on traps and the provision of food for the starlings. Specific observations will be made to qualify and quantify these effects. The lamp posts in itself as well as the mounted gallows for the traps and the nest boxes definitely play a role as resting point and lookout for all insect hunting birds, not only the starlings. The simultaneous study of birds and insects will provide much more understanding of their interactions.

2.4.5. Physiological Experiment with Fish

An experiment with European perch (Perca fluviatilis) and common roach (Rutilus rutilus) will address the influence of different nocturnal light levels on hormones that underlie a day-night-rhythm (e.g., melatonin) or a seasonal rhythm (reproductive hormones). For these experiments, eight fish cages (each 1 m2) are installed at each experimental site. Cages are placed in pairs in the drainage ditch directly in front of each lamp of the first row (Figure 2). Each cage is populated with six perch and six roach. After one month, the fishes are sampled over four consecutive nights (four cages per night). Blood samples are taken for hormone analyses, and brain samples (pituitary) are taken for gene expression analyses of the gonadotropins (reproductive hormones). Experiments at the study area are complemented by laboratory studies.
We expect that levels of nocturnal melatonin in the blood are significantly reduced in fish in the lit site, suggesting a disturbance of the diurnal rhythm. Furthermore, the concentration of reproductive hormones in the blood as well as gene expression of gonadotropins in the pituitary are expected to be significantly lower in fish exposed to ALAN, indicating a disturbance of the reproductive rhythm. This assumption is justified by results from laboratory studies with European perch, where a disruption of these rhythms by ALAN has been demonstrated [15].

2.4.6. Food Web Dynamics

We hypothesize that light will attract a large number of aquatic insects, specifically that more species and individuals with aquatic immature stages will be collected at street lamps of the experimental site compared to the same sites of the control sites. One result will be a greater availability of aquatic insects (abundance and diversity) to terrestrial predators, and a second will be greater nutrient flux from illuminated aquatic food webs into adjacent terrestrial food webs. To test this latter hypothesis we will compare stable isotope ratios of nitrogen and carbon from insect predators in the illuminated terrestrial food webs with predators from the control site.

3. Preliminary Results

3.1. Comparison of Environmental Parameters between Sites

No statistically significant differences between the environmental parameters automatically sampled in the two experimental sites were detected before the start of the ALAN treatment (see Table S1 in the supplementary material). It could be observed that night-time light intensity was higher on the western site compared to the eastern site after the start of the illumination.

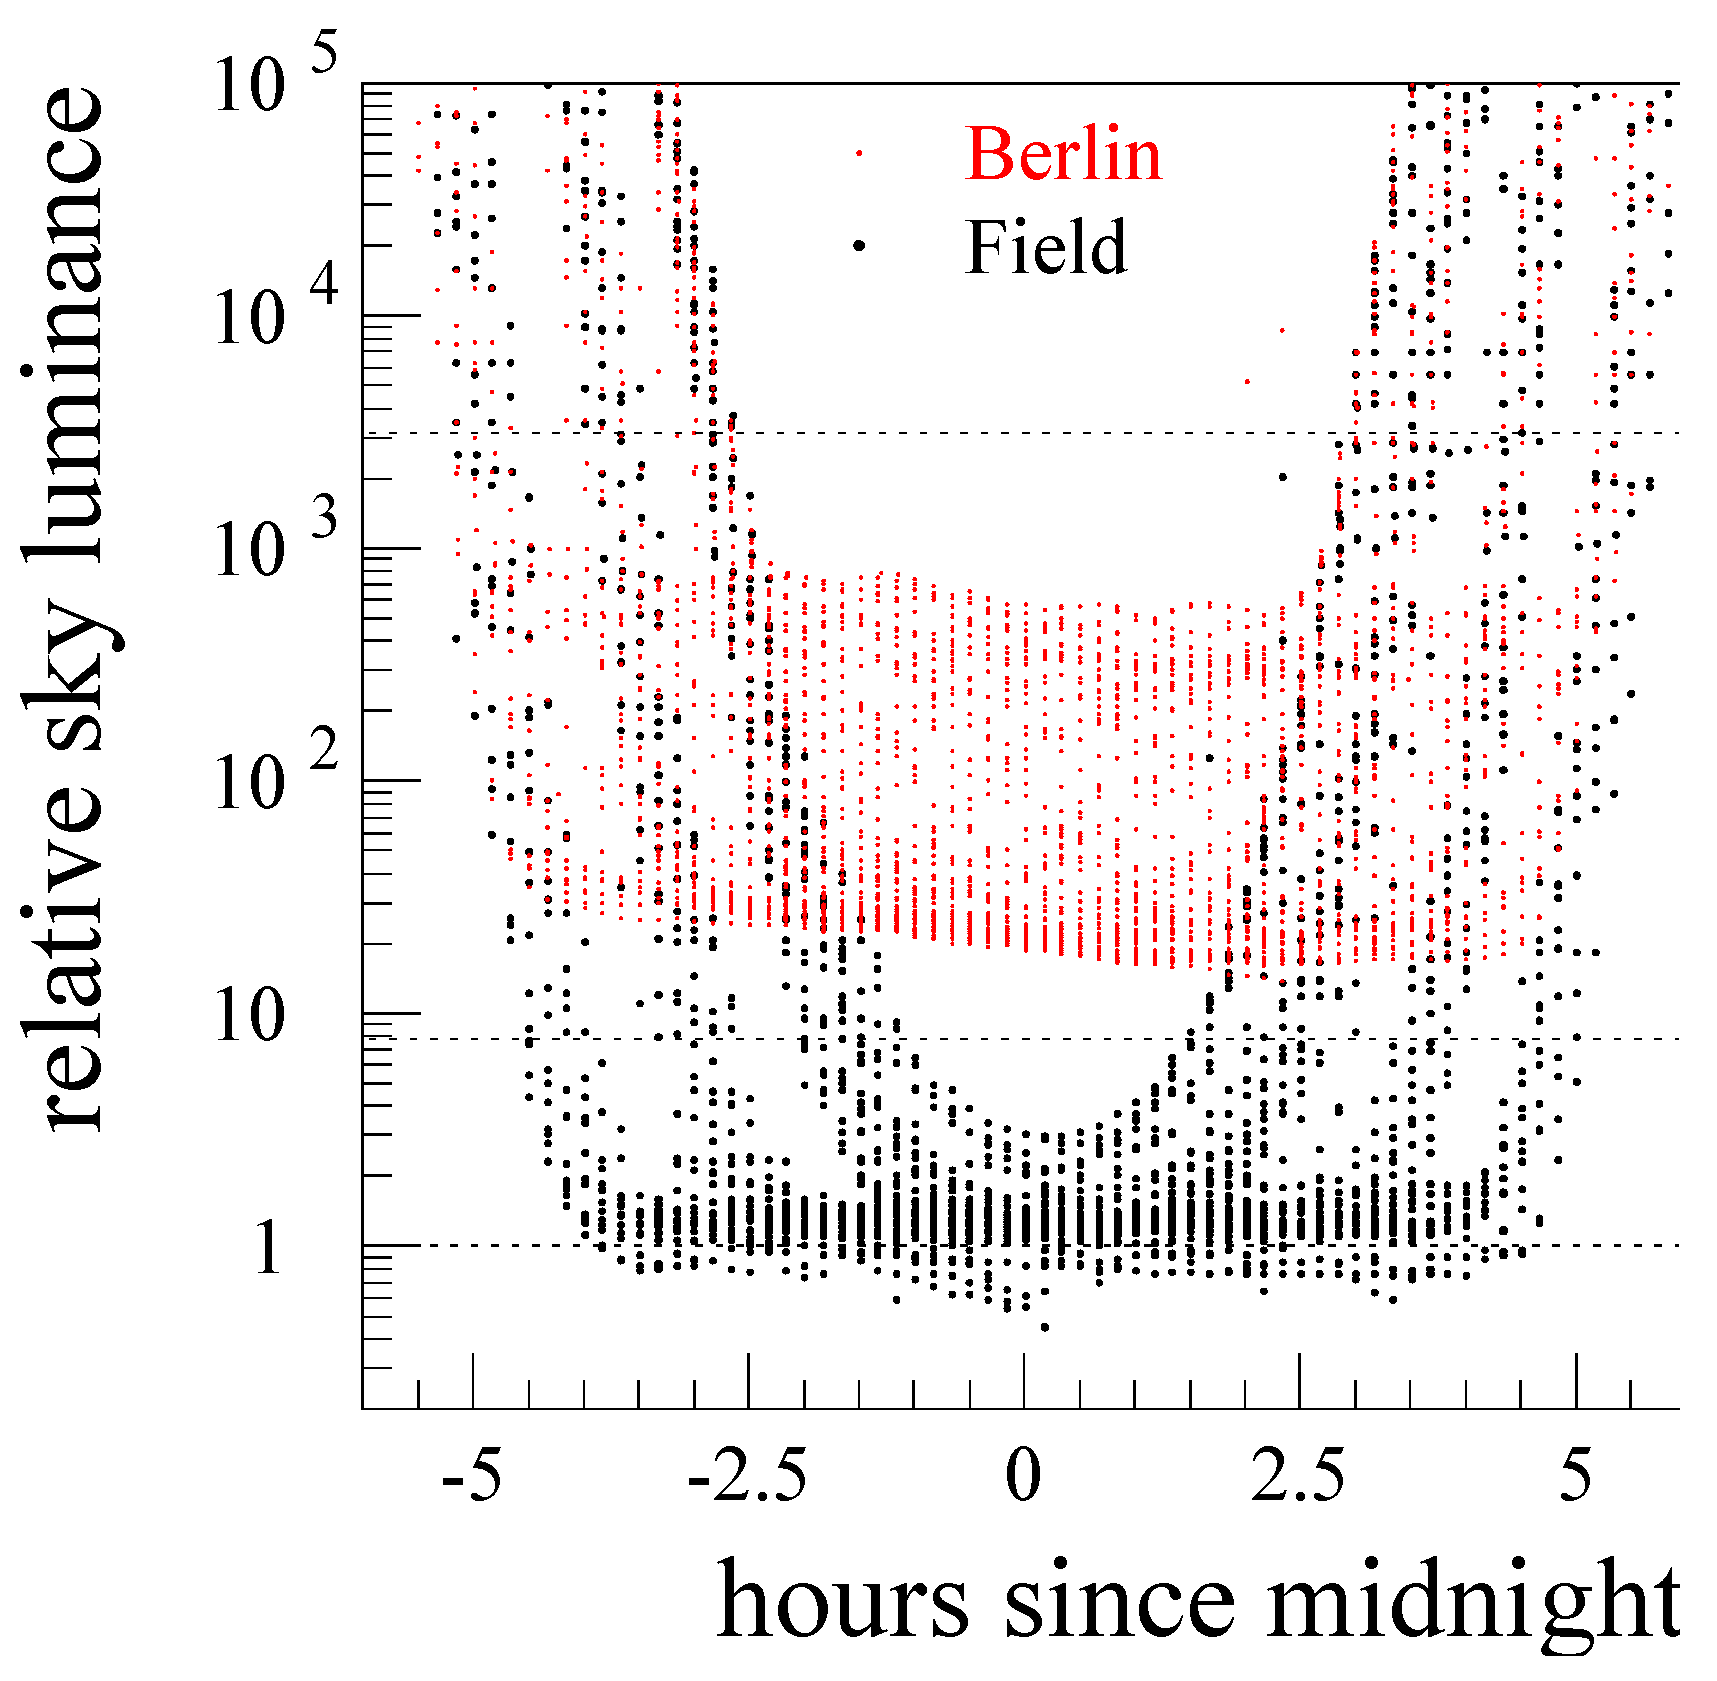
3.2. Photometric Characterization of the Study Area after Installation of Infrastructure

Simulated maximum illuminance of the lit field was around 50 lux, minimum illuminance between two rows of street lamps was around 1 lux and minimum illuminance between two adjacent street lamps of the same row was around 10 lux (Figure 4). These illuminance levels were verified by measurements at selected points.
Figure 4. Comparison of simulated (top, bottom left) and measured (bottom right) illuminance levels (lux). Color-coded illuminance levels for the treatment site at ground level from computer simulation are shown above. The drainage ditch is located above the light rows. Below calculated (left) and measured (right) illuminance levels at selected terrestrial positions, at the shoreline and above the drainage ditch (d) in the western site 1.5 m above ground level are given.
Sustainability 07 15593 g004
Illuminance levels measured 1.5 m above the ground and calculated illuminance levels from the simulation are given for selected positions in Figure 4. With respect to the limited accuracy of the measurement and calculation, data correspond well. Maximum illuminance values close to the street lamps agree within 10%, minimum illuminance values agree within a factor of two. This is acceptable considering the decay of illuminance by around one order of magnitude towards the middle between two rows of street lamps. Uncertainties arise from the luminous intensity distribution curve of the luminaire, as well as from the location of the test points and from the topography of the site (which is not perfectly flat as is assumed in computer simulation). However, this is not required for the experiments as the effect of gradients is also a focus of ongoing studies.
The study area is not strongly affected by skyglow as measurements taken at the site confirm. During astronomical night (when the sun is more than 18° below the horizon), the sky radiance was observed to be in the range 0.8 to 1.8 times the assumed natural background 95% of the time in the summer of 2012. Cloud coverage dramatically amplifies urban sky radiance, for example by a factor of 10.1 for one location inside of Berlin and by a factor of 2.8 at 32 km from the city [42]. In contrast to urban sites, little variation with cloudiness was observed at the field site. On clear nights (0–1 okta), 95% of the time the sky radiance was in the range of 1.15 to 1.5 times brighter than a natural clear night sky. Overcast nights (7–8 okta) ranged from 0.82 to 1.8 times brighter than a natural clear night sky. Figure 5 compares the approximate luminance of the moonless night sky at the study site to that observed with another SQM-LU-DL located in central Berlin. Values are relative to the assumed natural sky background of 252 μcd/m2. The approximate relative luminance for the end of civil, nautical, and astronomical twilight in a pristine location are shown as dotted lines. Compared to an urban location, the study area exhibits far less variation in sky luminance once astronomical twilight ends. The length of the night changes considerably over the measurement period, and gaps in the twilight data occur due to rejecting the periods when the moon was above the horizon.
Figure 5. The approximate summer sky luminance (cd/m2) relative to a “natural” night sky is shown as a function of time of night for the study area (black) and for a location in central Berlin (red). The approximate sky luminance for the end of civil (top), nautical (center), and astronomical (bottom) twilight in a pristine location are indicated by the dotted horizontal lines.
Sustainability 07 15593 g005

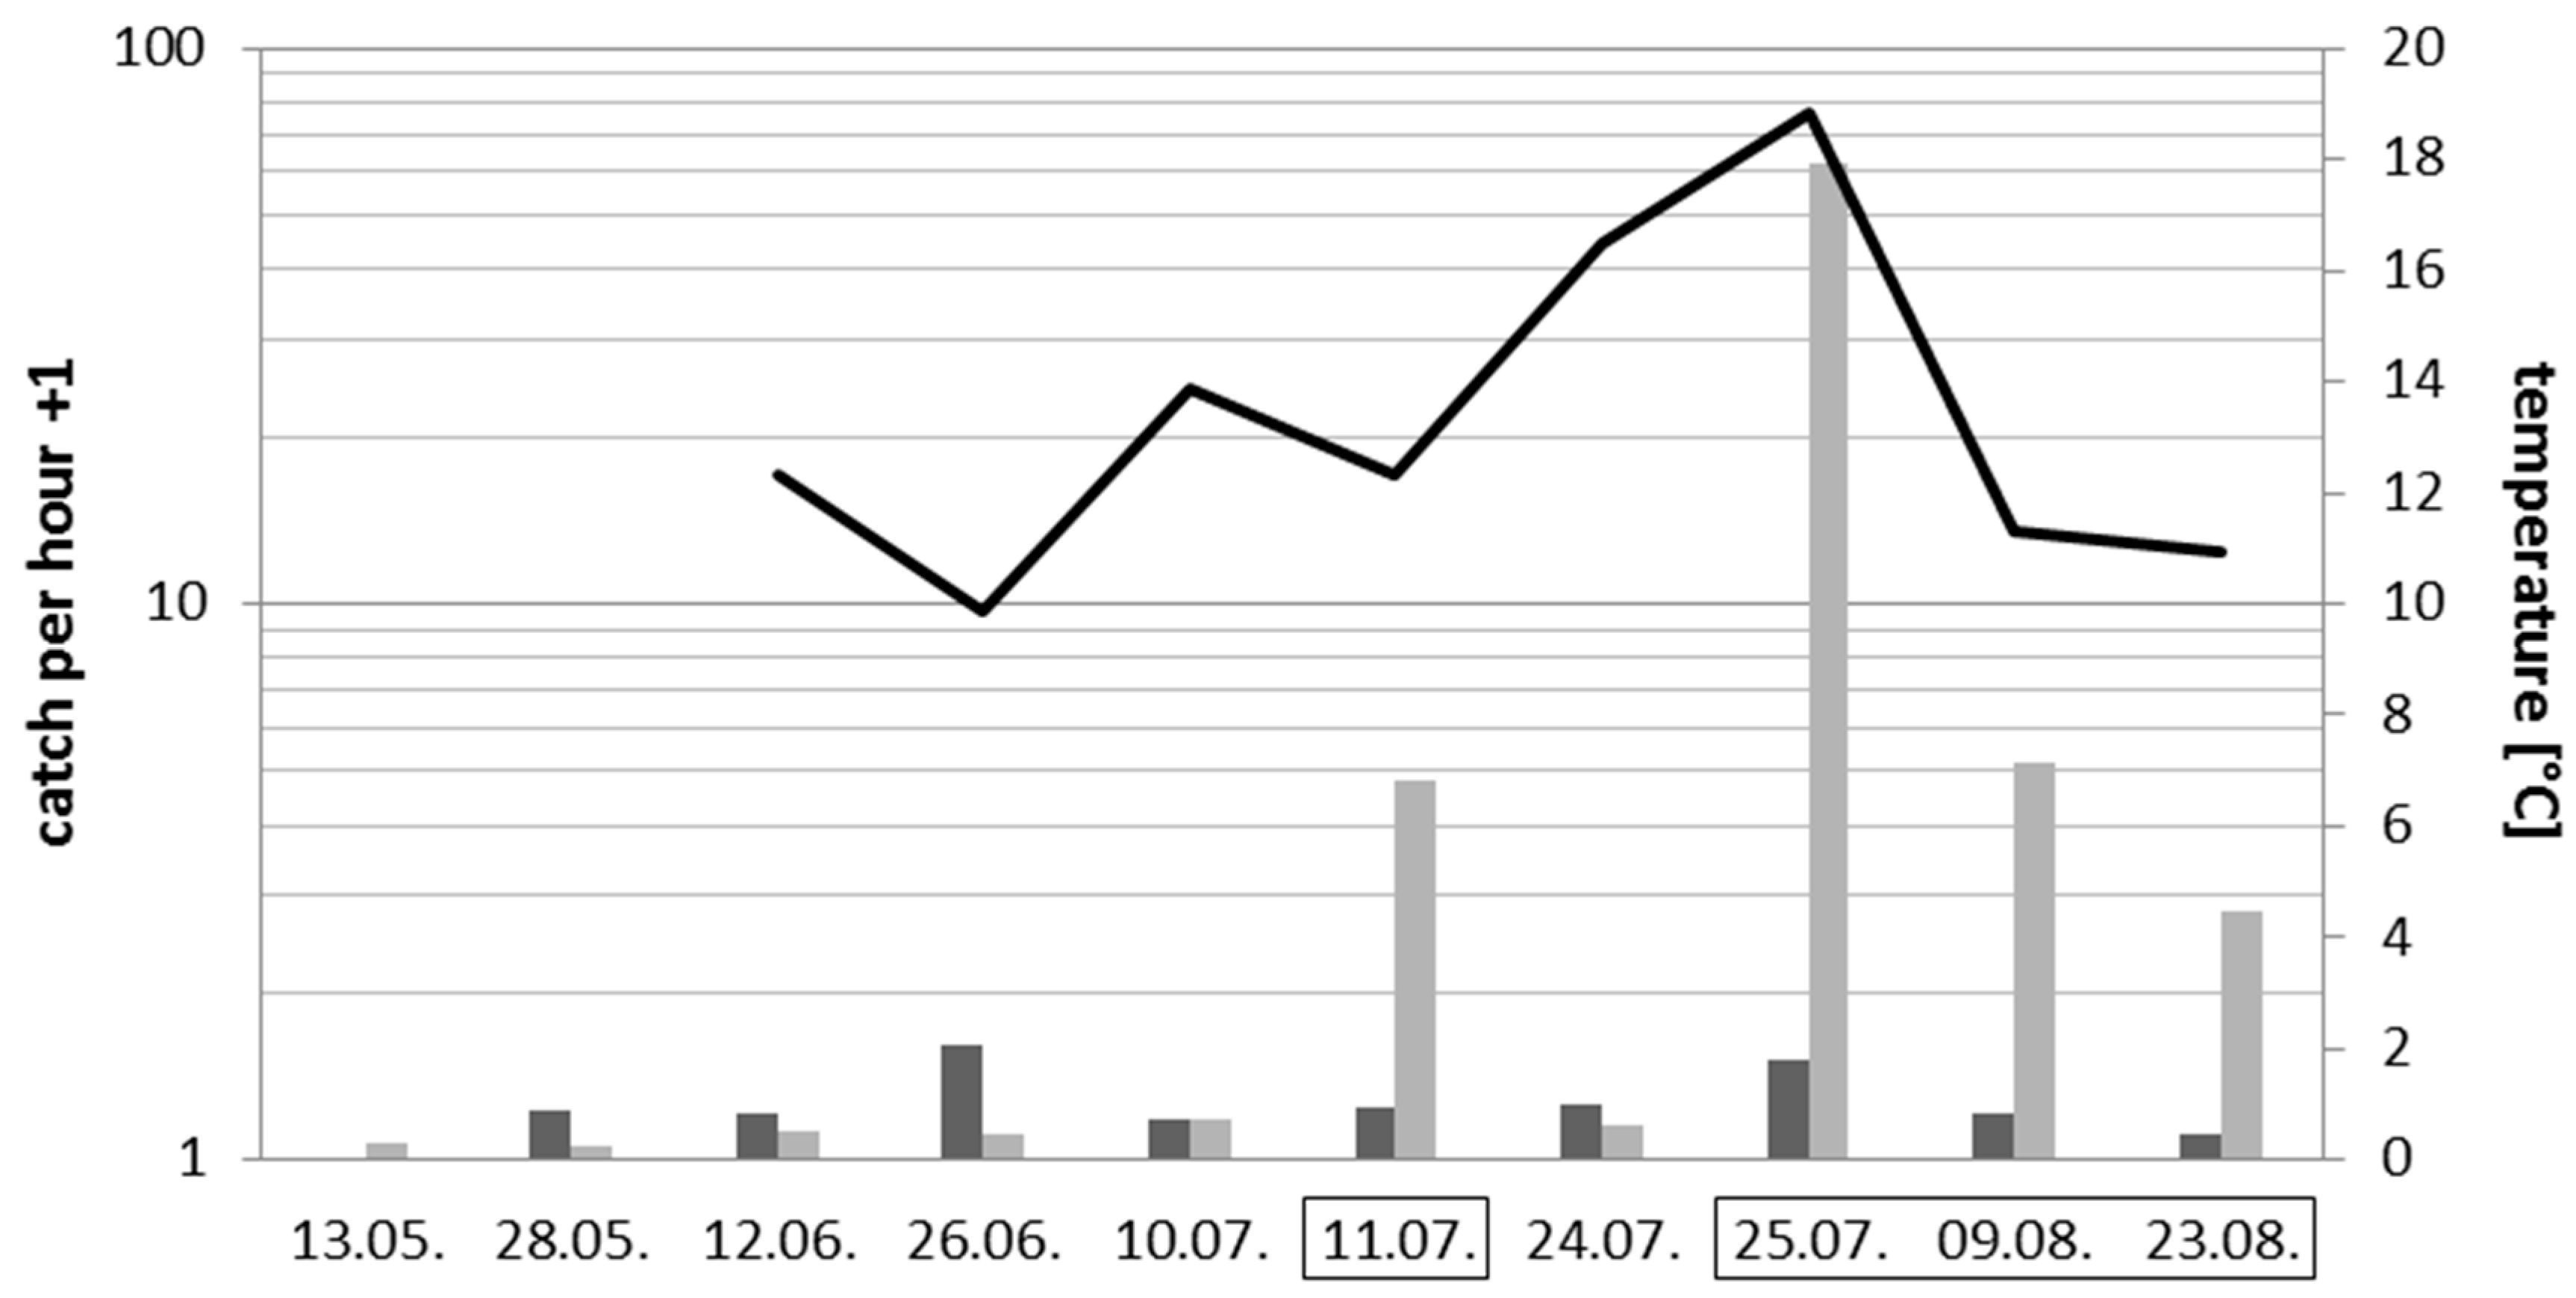
3.3. Effects of Introduced Artificial Light at Night on Insects and Spiders

A comparison of insect and spider catches on both sites over the whole sampling period revealed an increase in catches on the treatment site during the lit period (Figure 6). In the dark period in both sites, between 0 and 1 insect was caught per hour on each sampling date. In the lit period, up to 60 insects (25 July 2012) were caught per hour at lit lamps in the treatment site while the control site remained at between 0 and 1 insect per hour. Thus, on the 25 July the catch per hour performance of the lit site (6560 insects) was up to 120 times higher than in the dark site (55 insects).
Figure 6. Comparison of catch per hour (CPUE) in the air eclector traps in both sites over the whole period (dark and lit period), May–August 2012. The catch per hour values (of 12 traps) were added by one and displayed with a logarithmic y-axis to improve display for low catches. Dark bars: control site, light bars: lit site. Sampling dates during the lit period (illuminated streetlamps at the western site) are indicated by black borders. Black line: air temperature (°C) on dates of the first or third quarter moon with corresponding values on the Y-axis at right.
Sustainability 07 15593 g006
Mixed-model analysis detected no significant difference in arthropod quantity in the eclector traps between the two sites before illumination of the treatment (western) site. After illumination started, there was a significant difference between arthropod quantity in the traps of the lit (west) and the control (east) sites (Table 2). In the lit site, there was a significant difference in arthropod quantity in the traps between lit and unlit periods (Table 2). Up to 79% of the arthropod quantity in the traps was explained by the models, with the overnight-term effect (test illumination on 11 July) explaining 78% of the total quantity and 79% of the aquatic insect quantity in the traps. Over the whole period, the model explained 60% (total arthropod) and 68% (aquatic insect) quantity in the traps.
The differences in total quantity in the traps observed between the sites during the lit period also occurred in nearly every order. Coleoptera (beetles), Diptera (flies), and Hemiptera (true bugs) were most abundant in the traps at the treatment site, with 3970, 1512, and 1028 individuals, respectively. The most abundant orders in the traps at the control site were Coleoptera, Diptera, and Hymenoptera (sawflies, wasps, bees, and ants) albeit in lower abundance (50, 43, and 6 individuals, respectively). This difference was also observed in catches of Lepidoptera (moths and butterflies), where a total of 539 were caught at the lit treatment site compared to only two individuals at the control. With 80 individuals, spiders (Araneae) in the lit site traps were six times more abundant than in the dark site traps, which had 12 individuals.
Table 2. Mixed models for overnight-term effect and effect within the period of the pilot study with marginal pseudo-R (R2m), best likelihood ratio test (χ²), degrees of freedom (Df) and significance for total arthropod and aquatic insects abundance standardized by catch per unit (hour) of effort (CPUE). Significant pairwise comparisons are shown. Effect of treatment and site (TS): before-east (BE); before-west (BW); after-east (AE), after-west (AW). *** = p <0.001.
ModelGroupχ²DfR2mComparison
overnight termtotal arthropods109.75 ***30.78AW/AE ***
AW/BE ***
AW/BW ***
aquatic insects148.29 ***30.79AW/AE ***
AW/BE ***
AW/BW ***
period of pilot studytotal arthropods233.89 ***30.60AW/AE ***
AW/BE ***
AW/BW ***
aquatic insects278.65 ***30.68AW/AE ***
AW/BE ***
AW/BW ***

4. Discussion

The experiment constitutes the first long-term project of which we are aware to establish street lighting in a light-naïve riparian landscape in order to study the effects of ALAN on an ecosystem. Our experiment will deliver biotic and abiotic data that will enable us to assess the short and long-term impacts on the abundance, distribution, physiology, and behavior of individual species, as well as impacts on community structure, food webs, and carbon flux. The continuous monitoring provides the means to observe spatial and temporal relationships in organism reactions. The preliminary results thereby show no statistically significant differences between the two sites before illumination in terms of aquatic and terrestrial environmental parameters as well as insect quantity in the traps. This provides an estimate of the a priori probability of corroboration of the effects of ALAN.
Existing infrastructure that has been established in the Netherlands and Great Britain contribute to different aspects of light-pollution research in terms of type of ecosystem and experimental design. The study area presented here is situated in grassland habitat adjacent to an agricultural drainage ditch system, using squares of street lights and luminaires with commonly used high-pressure sodium lamps which have a yellowish spectrum and a color temperature of 2000 K. The Dutch study sites are located at forest edges and apply different color spectra of light in single rows of street lights [26], while the British experiment encompasses experimental grassland “mesocosms” located in a grassland area with selected model species and two different artificial light treatments using light-emitting diodes (LEDs) [27].
For our study area in the Westhavelland the illuminance levels and overall uniformity are comparable to those found in urban street lighting conditions. Hence, the study area meets the requirements to assess the effects of common urban street illumination and of ALAN in general on the environment. Nevertheless, as we aim at studying how different species are affected, it is necessary to consider the fact that illuminance and luminance include human photopic sensitivity and thus do not necessarily represent a proper measure for the biological action of light on animals (CIE 158:2004, [21]). However, in combination with the spectrum emitted by the street lights further parameters could be evaluated, like the individual perception of light by different species. If action functions are available, as addressed in DIN V 5031-100:2009 [23], stimuli for the specified biological action could also be obtained.
The attraction of ALAN was clearly demonstrated by the immense and immediate increase of insect catches at the lit street lights in comparison to both the catches of the control site and those during the previous dark period. The captured insects presumably originate not only from the immediate area, but could have been attracted by the streets lights from long distances. Typical attraction radii for flying insects described in the literature range from 3–130 m e.g., [63,64,65]. The setup with three rows of street lights parallel to the drainage ditch will be used to derive the direction of origin for some insect orders, i.e., from the drainage ditch or the forest side. The strong effect of artificial light particularly on aquatic insects emphasizes the need to analyze land-water interactions in the riparian ecosystem. Diptera, for example, were trapped rather on the water-facing side, due to the high proportion of Chironomidae, a group with a high amount aquatic species [66]. Similarly, aquatic insects like Ephemeroptera and water beetles like Hydrophilidae and Dytiscidae were highly abundant in the traps near the drainage ditch (data not shown). Furthermore, the advantage of an experimental 3 × 4 matrix of streetlights is that it allows for the estimation of the attraction radii of street lights and to calculate whether a row of street lights acts as a barrier. If light does not work as a barrier to invertebrate migration, we would expect to capture equal numbers at corner-, wing- (i.e., lights that are on the edge of the matrix, but not at the corners), and middle-light traps.
An analysis on the family and species level is in progress to examine the individual reaction of species with different ecological requirements. This is also necessary to distinguish whether spiders are trapped by light or profit from the attracted prey near the luminaires. Further recordings of insect catches during the next years will enable us to quantify the loss of biomass and to detect a change in the composition of orders and species. Composition changes have only recently been observed at established street lights [32], emphasizing the need for a detailed analysis of the catches and the impacts of introduced street lights in this ecosystem. Thereby, the accompanying observations of movement behavior and foraging of birds and bats might add to the study.
Insect catches are strongly influenced by weather conditions, especially by temperature [30]. Nocturnal insects are more active at higher temperatures, which is reflected by decreased catches after 25 July. The continuously recorded abiotic factors characterizing e.g., weather conditions will therefore be part of future analyses and enable the identification of light-induced effects. It seems that a relation between temperature and catches especially of the western site can be observed in the lit period. After the 25 July the western site catches decreased on each sampling with decreasing temperature. With increasing temperature the catches in the eastern site increased in a moderate way. However, a statistical analysis of the effects of temperature on catches per hour is not available to date due to the low numbers of insect catches during the lit period in the dark eastern site and during the dark period in both experimental sites.
The work at the Verlust der Nacht experimental sites remains at an early stage. The sites have been studied since 2011, and one has been illuminated since July 2012. To maximally utilize the setup and to gain as much information as possible on ecological changes in response to illumination, it should also serve as a nucleus for future experiments that may help to understand how ALAN affects natural ecosystems. Initial results from this experimental site about the skyglow level [44] and the impact of ALAN on microbial diversity and community respiration in freshwater sediments [12] have been recently published. Other researchers are explicitly invited to contact the corresponding authors if they would like to perform a study at the facility. The knowledge collected in this project will contribute to the development of improved lighting concepts and to the identification of sustainable illumination technologies.

Supplementary Files

Supplementary File 1

Acknowledgments

The experimental setup is part of the interdisciplinary research project Verlust der Nacht (Loss of the Night). Verlust der Nacht was founded in 2010 and encompasses 14 subprojects, which quantify ALAN and study its ecological, health-related, cultural, and socioeconomic effects. Verlust der Nacht has been financially supported by the German Federal Ministry of Education and Research (BMBF-033L038A). This work was partially carried out within the SMART Joint Doctorate funded with the support of the Erasmus Mundus programme of the EU. The authors would like to thank Peter Krenz for his contribution to the photometric measurements. The manuscript was greatly improved by comments of Elizabeth K Perkin, Anja Ruß (née Nordt), and Sibylle Schroer. We also thank Stefano Larsen for comments on an earlier draft of the manuscript. We are grateful for the comments of four anonymous referees who helped improve the quality of the manuscript.

Author Contributions

Franz Hölker, Steffen Franke, Reinhard Klenke, Christian C. Voigt, Michael T. Monaghan, and Christopher C. M. Kyba are part of the group of researchers who conceived the study. Steffen Franke and Sebastian Schneider carried out the photometric characterization, Christopher C. M. Kyba measured the skyglow. Reinhard Klenke and Christian C. Voigt are responsible for the bird study and the bat monitoring, respectively. Bat activity was monitored by Daniel Lewanzik. Martin Oehlert carried out the arthropod sampling, Alessandro Manfrin conducted the statistical analysis of both the arthropod and the abiotic sampling, while Anika Brüning contributed the fish study. Stefan Heller was responsible for the sampling of abiotic data, Alessandro Manfrin for the included analysis. Helga Kuechly contributed Figure 1. Stephanie I. J. Holzhauer coordinated the installation of the study area and the different studies taking place. All authors contributed to writing the manuscript.

Conflicts of Interest

The authors declare no conflict of interest.

References

  1. Hölker, F.; Moss, T.; Griefahn, B.; Kloas, W.; Voigt, C.C.; Henckel, D.; Hänel, A.; Kappeler, P.M.; Völker, S.; Schwope, A.; et al. The dark side of light: A transdisciplinary research agenda for light pollution policy. Ecol. Soc. 2010, 15. Article 13. [Google Scholar]
  2. Bennie, J.; Davies, T.; Duffy, J.; Inger, R.; Gaston, K.J. Contrasting trends in light pollution across Europe. Sci. Rep. 2014. [Google Scholar] [CrossRef] [PubMed] [Green Version]
  3. Gaston, K.J.; Bennie, J.; Davies, T.W.; Hopkins, J. Reducing the ecological consequences of night-time light pollution: Options and developments. J. Appl. Ecol. 2012, 49, 1256–1266. [Google Scholar] [CrossRef] [PubMed] [Green Version]
  4. Longcore, T.; Rich, C. Ecological light pollution. Front. Ecol. Environ. 2004, 2, 191–198. [Google Scholar] [CrossRef]
  5. Hölker, F.; Wolter, C.; Perkin, E.K.; Tockner, K. Light pollution as a biodiversity threat. Trends Ecol. Evol. 2010, 25, 681–682. [Google Scholar] [CrossRef] [PubMed]
  6. Gaston, K.J.; Visser, M.E.; Hölker, F. The biological impacts of artificial light at night: The research challenge. Philos. Trans. R. Soc. B 2015. [Google Scholar] [CrossRef] [PubMed]
  7. Gosh, T.; Anderson, S.J.; Elvidge, C.D.; Sutton, P.C. Using nighttime satellite imagery as a proxy measure of human well-being. Sustainability 2013, 5, 4988–5019. [Google Scholar] [CrossRef]
  8. Rich, C.; Longcore, T. Ecological Consequences of Artificial Night Lighting; Island Press: Washington, DC, USA, 2006. [Google Scholar]
  9. Moore, M.V.; Kohler, S.J.; Cheers, M.S. Artificial light at night in freshwater habitats and its potential ecological effects. In Ecological Consequences of Artificial Night Lighting; Rich, C., Longcore, T., Eds.; Island Press: Washington, DC, USA, 2006. [Google Scholar]
  10. Nightingale, B.; Longcore, T.; Simenstad, C.A. Artificial night lighting and fishes. In Ecological Consequences of Artificial Night Lighting; Rich, C., Longcore, T., Eds.; Island Press: Washington, DC, USA, 2006. [Google Scholar]
  11. Perkin, E.K.; Hölker, F.; Richardson, J.S.; Sadler, J.P.; Wolter, C.; Tockner, K. The influence of artificial light on freshwater and riparian ecosystems: Questions, challenges, and perspectives. Ecosphere 2011, 2, 122. [Google Scholar] [CrossRef]
  12. Hölker, F.; Wurzbacher, C.; Weißenborn, C.; Monaghan, M.T.; Holzhauer, S.I.J.; Premke, K. Microbial diversity and community respiration in freshwater sediments influenced by artificial light at night. Philos. Trans. R. Soc. B 2015. [Google Scholar] [CrossRef] [PubMed]
  13. Kummu, M.; de Moel, H.; Ward, P.J.; Varis, O. How close do we live to water? A global analysis of population distance to freshwater bodies. PLoS ONE 2011, 6, e20578. [Google Scholar] [CrossRef] [PubMed]
  14. Kuechly, H.U.; Kyba, C.C.M.; Ruhtz, T.; Lindemann, C.; Wolter, C.; Fischer, J.; Hölker, F. Aerial survey and spatial analysis of sources of light pollution in Berlin, Germany. Remote Sens. Environ. 2012, 126, 39–50. [Google Scholar] [CrossRef]
  15. Brüning, A.; Hölker, F.; Franke, S.; Preuer, T.; Kloas, W. Spotlight on fish: Light pollution affects circadian rhythms of European perch but does not cause stress. Sci. Total Environ. 2015, 511, 516–522. [Google Scholar] [CrossRef] [PubMed]
  16. Perkin, E. K.; Hölker, F.; Tockner, K.; Richardson, J. S. Artificial light as a disturbance to light-naïve streams. Freshw. Biol. 2014, 59, 2235–2244. [Google Scholar] [CrossRef]
  17. Riley, W.D.; Bendall, B.; Ives, M.J.; Edmonds, N.J.; Maxwell, D.L. Street lighting disrupts the diel migratory pattern of wild Atlantic salmon, Salmo salar L., smolts leaving their natal stream. Aquaculture 2012, 330–333, 74–81. [Google Scholar] [CrossRef]
  18. Riley, W. D.; Davison, P. I.; Maxwell, D. L.; Newman, R. C.; Ives, M. J. A laboratory experiment to determine the dispersal response of Atlantic salmon (Salmo salar) fry to street light intensity. Freshw. Biol. 2015, 60, 1016–1028. [Google Scholar] [CrossRef]
  19. Perkin, E. K.; Hölker, F.; Tockner, K. The effects of artificial lighting on adult aquatic and terrestrial insects. Freshw. Biol. 2014, 59, 368–377. [Google Scholar] [CrossRef]
  20. Meyer, L.A.; Sullivan, S.M.P. Bright lights, big city: influences of ecological light pollution on reciprocal stream-riparian invertebrate fluxes. Ecol. Appl. 2013, 23, 1322–1330. [Google Scholar] [CrossRef] [PubMed]
  21. International Commission on Illumination. CIE 158:2004: Ocular Lighting Effects on Human Physiology and Behavior; International Commission on Illumination: Vienna, Austria, 2004. [Google Scholar]
  22. International Commission on Illumination. CIE 126:1997: Guidelines for Minimizing Sky Glow; International Commission on Illumination: Vienna, Austria, 1997. [Google Scholar]
  23. German Institute for Standardisation. B. DIN V 5031–100:2009: Optical Radiation Physics and Illuminating Engineering—Part 100: Non-visual Effects of Ocular Light on Human Beings—Quantities, Symbols and Action Spectra; Beuth: Berlin, Germany, 2009. (In German) [Google Scholar]
  24. German Institute for Standardisation. B. DIN SPEC 67600:2013: Biologically Effective Illumination—Design Guidelines; Beuth: Berlin, Germany, 2013. (In German) [Google Scholar]
  25. International Commission on Illumination. CIE 150:2003: Guide on the Limitation of the Effects of Obstrusive Light from Outdoor Lighting Installations; International Commission on Illumination: Vienna, Austria, 2003. [Google Scholar]
  26. Spoelstra, K.; van Grunsven, R.H.A.; Donners, M.; Gienapp, P.; Huigens, M.E.; Slaterus, R.; Berendse, F.; Visser, M.E.; Veenendaal, E. Experimental illumination of natural habitat—An experimental set-up to assess the direct and indirect ecological consequences of artificial light of different spectral composition. Philos. Trans. R. Soc. B 2015, 370, 20140129. [Google Scholar] [CrossRef] [PubMed]
  27. Bennie, J.; Davies, T.W.; Cruse, D.; Inger, R.; Gaston, K.J. Cascading effects of artificial light at night: Resource-mediated control of herbivores in a grassland ecosystem. Philos. Trans. R. Soc. B 2015. [Google Scholar] [CrossRef] [PubMed]
  28. Perkin, E.K.; Hölker, F.; Heller, S.; Berghahn, S. Artificial light and nocturnal activity in gammarids. PeerJ 2014, 2, 279. [Google Scholar] [CrossRef] [PubMed]
  29. Thurber, W.A.; Komar, O. Turquoise-browed motmot (Eumomota superciliosa) feeds by artificial light. Wilson Bull. 2002, 114, 525–526. [Google Scholar] [CrossRef]
  30. Eisenbeis, G. Artificial night lighting and insects: Attraction of insects to streetlamps in a rural setting in germany. In Ecological Consequences of Artificial Night Lighting; Rich, C., Longcore, T., Eds.; Island Press: Washington, DC, USA, 2006. [Google Scholar]
  31. Lebbin, D.J.; Harvey, M.G.; Lenz, T.C.; Andersen, M.J.; Ellis, J.M. Nocturnal migrants foraging at night by artificial light. Wilson J. Ornithol. 2007, 119, 506–508. [Google Scholar] [CrossRef]
  32. Davies, T.W.; Bennie, J.; Gaston, K.J. Street lighting changes the composition of invertebrate communities. Biol. Lett. 2012, 8, 764–767. [Google Scholar] [CrossRef] [PubMed]
  33. Oksanen, L. Logic of experiments in ecology: is pseudoreplication a pseudoissue? Oikos 2001, 94, 27–38. [Google Scholar] [CrossRef]
  34. Landesamt für Umwelt, G.u.V.L., Brandenburg, Germany. Naturpark Westhavelland. Available online: http://www.lugv.brandenburg.de/cms/detail.php/bb1.c.331126.de (accessed on 13 November 2015).
  35. International Dark Sky Association (IDA). International Dark Sky Reserves: Westhavelland (Germany). Available online: http://darksky.org/idsp/reserves/westhavelland/ (accessed on 13 November 2015).
  36. Pinheiro, J.; Bates, D.; DebRoy, S.; Sarkar, D.; Team, R.C. Nlme: Linear and Nonlinear Mixed Effects Models. R Package Version 3.1–120. Available online: http://CRAN.R-project.org/package=nlme (accessed on 13 November 2015).
  37. R Core Team. R: A Language and Environment for Statistical Computing. Available online: http://www.R-project.org (accessed on 13 November 2015).
  38. Fox, J.; Weisberg, S. An R Companion to Applied Regression, 2nd ed.; Sage Publications: Thousand Oaks, CA, USA, 2011. [Google Scholar]
  39. Fox, J. Applied Regression Analysis and Generalized Linear Models, 2nd ed.; Sage: Thousand Oaks, CA, USA, 2008. [Google Scholar]
  40. Cinzano, P. Night Sky Photometry with Sky Quality Meter. Available online: http://www.unihedron.com/projects/darksky/sqmreport_v1p4.pdf (accessed on 13 November 2015).
  41. Schnitt, S.; Ruhtz, T.; Fischer, J.; Hölker, F.; Kyba, C.C.M. Temperature stability of the sky quality meter. Sensors 2013, 13, 12166–12174. [Google Scholar] [CrossRef] [PubMed]
  42. Kyba, C.C.M.; Ruhtz, T.; Fischer, J.; Hölker, F. Cloud coverage acts as an amplifier for ecological light pollution in urban ecosystems. PLoS ONE 2011, 6, e17307. [Google Scholar] [CrossRef] [PubMed]
  43. Lolkema, D.E.; Haaima, M.; den Outer, P.N.; Spoelstra, H. Effects of meteorological and atmospheric parameters on night sky brightness. RIVM Rapp. 2011. [Google Scholar] [CrossRef]
  44. Kyba, C.C.M.; Tong, K.P.; Bennie, J.; Birriel, I.; Birriel, J.J.; Cool, A.; Danielsen, A.; Davies, T.W.; Outer, P.N.D.; Edwards, W.; et al. Worldwide variations in artificial skyglow. Sci. Rep. 2015, 5, 8409. [Google Scholar] [CrossRef] [PubMed] [Green Version]
  45. Cinzano, P.; Falchi, F.; Elvidge, C.D. The first world atlas of the artificial night sky brightness. Mon. Notices R. Astron. Soc. 2001, 328, 689–707. [Google Scholar] [CrossRef]
  46. Kyba, C.C.M.; Lolkema, D.E. A community standard for the recording of skyglow data. Astron. Geophys. 2012, 53, 6.17–6.18. [Google Scholar] [CrossRef]
  47. Schaffrath, U. Zur Käferfauna am Edersee (Insecta, Coleoptera). Philippia 1999, 9, 1–94. (In German) [Google Scholar]
  48. Bates, D.; Maechler, M.; Bolker, B. Lme4: Linear Mixed-Effects Models Using s4 Classes. 2013. Available online: http://www.cran.r-project.org/ (accessed on 13 November 2015).
  49. Pinheiro, J.C.; Bates, D.M. Mixed-Effects Models Methods and Classes for S and S-plus. Available online: https://www.biostat.wisc.edu/sites/default/files/tr_89.pdf (accessed on 13 November 2015).
  50. Shapiro, S.S.; Wilk, M.B. An analysis of variance test for normality (complete samples). Biometrika 1965, 52, 591–611. [Google Scholar] [CrossRef]
  51. Nakagawa, S.; Schielzeth, H. A General and Simple Method for Obtaining R2 from Generalized Linear Mixed-Effects Models. Methods Ecol. Evol. 2014, 4, 133–142. [Google Scholar] [CrossRef]
  52. Barton, K. Mumin: Multi-Model Inference. R Package Version 0.3.10. 2011. Available online: http://R-Forge.R-project.org/projects/mumin (accessed on 13 November 2015).
  53. De Rosario-Martinez, H. Phia: Post-Hoc Interaction Analysis. R Package Version 0.1–5. 2013. Available online: http://CRAN.R-project.org/package=phia (accessed on 13 November 2015).
  54. Holm, S. A simple sequentially rejective multiple test procedure. Scand. J. Stat. 1979, 6, 65–70. [Google Scholar]
  55. Rydell, J. Bats and their insect prey at street lights. In Ecological Consequences of Artificial Night Lighting; Rich, C., Longcore, T., Eds.; Island Press: Washington, DC, USA, 2006. [Google Scholar]
  56. Rowse, E.G.; Lewanzik, D.; Stone, E.L.; Harris, S.; Jones, G. Dark matters: the effects of artificial lighting on bats. In Bats in the Anthropocene: Conservation of Bats in a Changing World; Voigt, C.C., Kingston, T., Eds.; Springer: Berlin, Germany, 2016; in press. [Google Scholar]
  57. Rydell, J. Exploitation of insects around streetlamps by bats in Sweden. Funct. Ecol. 1992, 6, 744–750. [Google Scholar] [CrossRef]
  58. Rydell, J.; Racey, P.A. Street lamps and the feeding ecology of insectivorous bats. Symp. Zool. Soc. Lond. 1995, 67, 291–307. [Google Scholar]
  59. Schnitzler, H.U.; Kalko, E.K.V. Echolocation by insect-eating bats. Bioscience 2001, 51, 557–569. [Google Scholar] [CrossRef]
  60. Kempenaers, B.; Borgström, P.; Loës, P.; Schlicht, E.; Valcu, M. Artificial night lighting affects dawn song, extra-pair siring success, and lay date in songbirds. Curr. Biol. 2010, 20, 1735–1739. [Google Scholar] [CrossRef] [PubMed]
  61. Bridge, E.S.; Bonter, D.N. A low-cost radio frequency identification device for ornithological research. Journal of field ornithology. J. Field Ornithol. 2011, 82, 52–59. [Google Scholar] [CrossRef]
  62. Bonter, D.N.; Bridge, E.S. Applications of radio frequency identification (rfid) in ornithological research: A review. J. Field Ornithol. 2011, 82, 1–10. [Google Scholar] [CrossRef]
  63. Frank, K. Effects of artificial night lighting on moths. In Ecological Consequences of Artificial Night Lighting; Rich, C., Longcore, T., Eds.; Island Press: Washington, DC, USA, 2006. [Google Scholar]
  64. Truxa, C.; Fiedler, K. Attraction to light—From how far do moths (Lepidoptera) return to weak artificial sources of light? Eur. J. Entomol. 2012, 109, 77–84. [Google Scholar] [CrossRef]
  65. Beck, J.; Linsenmair, K.E. Feasibility of light-trapping in community research on moths: Attraction radius of light, completeness of samples, nightly flight times and seasonality of Southeast-Asian hawkmoths (Lepidoptera: Sphingidae). J. Res. Lepidoptera 2006, 39, 18–36. [Google Scholar]
  66. McCafferty, W.P. Aquatic Entomology: The Fisherman’s and Ecologists’ Illustrated Guide to Insects and Their Relatives; Science Books International, Inc.: Boston, MA, USA, 1981. [Google Scholar]

