Article

Spatial–Temporal Evolution and Regional Differentiation Features of Urbanization in China from 2003 to 2013

1
College of Resources and Environmental Sciences, Nanjing Agricultural University, Nanjing 210095, China
2
Department Computational Landscape Ecology, Helmholtz Centre for Environmental Research—UFZ, Permoserstr. 15, D-04318 Leipzig, Germany
3
Lab for Landscape Ecology, Department of Geography, Humboldt University of Berlin, Rudower Chaussee 16, 12489 Berlin, Germany
*
Author to whom correspondence should be addressed.
ISPRS Int. J. Geo-Inf. 2019, 8(1), 31; https://doi.org/10.3390/ijgi8010031
Submission received: 14 November 2018 / Revised: 9 January 2019 / Accepted: 10 January 2019 / Published: 15 January 2019
(This article belongs to the Special Issue Human-Centric Data Science for Urban Studies)

Abstract

:
Quantifying the temporal and spatial patterns of impervious surfaces (IS) is important for assessing the environmental and ecological impacts of urbanization. In order to better extract IS, and to explore the divergence in urbanization in different regions, research on the regional differentiation features and regional change difference features of IS are required. To extract China’s 2013 urban impervious area, we used the 2013 night light (NTL) data and the Moderate Resolution Imaging Spectroradiometer Normalized Difference Vegetation Index and enhanced vegetation index (EVI) temporal series data, and used three urban impervious surface extraction indexes—Human Settlements Index, Vegetation-Adjusted NTL Urban Index, and the EVI-adjusted NTL index (EANTLI)—which are recognized as the best and most widely used indexes for extracting urban impervious areas. We used the classification results of the Landsat-8 images as the benchmark data to visually compare and verify the results of the urban impervious area extracted by the three indexes. We determined that the EANTLI index better reflects the distribution of the impervious area. Therefore, we used the EANTLI index to extract the urban impervious area from 2003 to 2013 in the study area, and researched the spatial and temporal differentiation in urban IS. The results showed that China’s urban IS area was 70,179.06 km2, accounting for 0.73% of the country’s land area in 2013, compared with 20,565.24 km2 in 2003, which accounted for 0.21% of the land area, representing an increase of 0.52%. On a spatial scale, like economic development, the distribution of urban impervious surfaces was different in different regions. The overall performance of the urban IS percentage was characterized by a decreasing trend from Northwest China, Southwest China, the Middle Reaches of the Yellow River, Northeast China, the Middle Reaches of the Yangtze River, Southern Coastal China, and Northern Coastal China to Eastern Coastal China. On the provincial scale, the urban IS expansion showed considerable differences in different regions. The overall performance of the Urban IS Expansion index showed that the eastern coastal areas had higher values than the western inland areas. The cities or provinces of Beijing, Tianjin, Jiangsu, and Shanghai had the largest growth in impervious areas. Spatially and temporally quantifying the change in urban impervious areas can help to better understand the intensity of urbanization in a region. Therefore, quantifying the change in urban impervious area has an important role in the study of regional environmental and economic development, policy formulation, and the rational use of resources in both time and space.

1. Introduction

Impervious surfaces (ISs) are defined as human-made land covers where water cannot infiltrate the soil, including the rooftops of buildings, roads, driveways, sidewalks, airports, parking, and so on [1,2,3]. Urban IS is often used as a quantitative indicator to study the relationship between urban development, population, and economy; to determine the potential for urban development [4,5]; to provide a basis for relevant policy planning; and to promote the optimal allocation of urban energy and resources [4,6,7,8]. Urban IS has been used frequently in studies of urban environments and ecology, with an increased focus on environmental issues being given [6,9,10,11]. The impervious surfaces in a city prevent precipitation from quickly infiltrating into the soil, thereby affecting the supply of groundwater and the circulation of water in the area [12,13]. ISs increase surface runoff, which increases the frequency of floods and the surface runoff, correspondingly [13,14]. Urban toxic and hazardous substances are flushed into rivers, resulting in non-point source pollution of water areas such as rivers and lakes. As the flow of water spreads, the affected areas continue to expand [15,16,17]. This inevitably affects water quality and hydrology in the area, causing negative ecological and other effects [18,19]. Urban ISs have the ability to absorb solar radiation on the earth’s surface, and the absorbed energy is released by the means of long-wave radiation, changing the latent heat flux of the city and increasing the urban heat island effect [20,21,22]. The expansion reduces biodiversity, and affects the rational use of energy and resources of a region [18,22,23]. Therefore, accurately quantifying impervious surface area and understanding the details of urban changes are conducive to the study of urban environments and ecosystems. This quantification allows us to explore temporal and spatial changes for the allocation of resources and energy, formulating policies, protecting the environment, and maintaining the sustainable development of urban areas.
Due to its coherence and speed, remote sensing has been used to rapidly and accurately study urbanization and its change across a variety of temporal and spatial scales [17,24]. Numerous methods have been developed to estimate impervious surface area [2,16,25,26]. These methods include sub-pixel and per-pixel classifications based on medium-and high-resolution images of individual cities or small-scale areas [9,25,27], such as Spectral Mixture Analysis (SMA), the spatially adaptive SMA (SASMA) technique, and the normalized spectral mixture analysis (NSMA) method, based on the vegetation-impervious surface-soil (V-I-S) model [28,29,30,31,32]. These studies were mostly based on the ISs of individual cities or small-scale areas. However, urbanization is not only a challenge for individual cities or on small scales, but it is also a regional and global problem. Although medium–high-resolution remote sensing images have high spatial resolution, the spatial extent of each image is limited. Therefore, medium- and high-resolution remote sensing images have some limitations in extracting large-scale urban impervious areas [5,6,26]. The wide coverage of low- and medium-resolution remote sensing images is an advantage when extracting large-scale urban impervious areas. Due to the Defense Meteorological Satellite Program (DMSP)’s operational line-scan system (OLS), which produces nighttime light (NTL) data as coarse spatial resolution images, they have larger spatial coverage and a shorter satellite return visit period. These data capture stable artificial light luminosity on the earth’s surface, and provide long-term data records [7,24,33] that are closely related to human activities, such as urban settlements, population density, economic activity, energy use, and carbon emissions [5,6,34,35]. NTL data have been widely used for regional or global large-scale urban impervious surface mapping and dynamics [36,37,38]. However, these data suffer from saturation due to the limited range of the dynamic digital number (from 0 to 63), especially in urban centers, and there is a common mixed pixel problem in coarse- or medium-resolution imagery [5,6,7,25,34]. Therefore, the IS result derived from NTL data has uncertainty, and the diversity of cities is not accurately displayed. Many researchers have attempted to solve this problem [6,7,39,40]. The most effective method was the joint use of a vegetation index combined with NTL data [25,34,41,42]. For example, Lu et al. [6] proposed a human settlement index (HSI) in 2008, and Zhang et al. [7] developed a vegetation-adjusted NTL urban index (VANUI) in 2013. These indexes are able to extract the urban impervious area, and these indexes have also been widely applied. However, this index does not perform well in cities that have experienced rapid urbanization. In addition, the DMSP-OLS data still suffer from the blooming effect [7,34]. Zhuo et al. [43] developed the enhanced vegetation index (EVI)-adjusted NTL index (EANTLI) combining DMSP-OLS NTL with Moderate Resolution Imaging Spectroradiometer (MODIS) EVI in order to further reduce the performance of the saturation effect of DMSP-OLS, especially in the core of the city.
The above research mostly focused on the extraction method of urban impervious surfaces in a small scale area, or on the extraction method of urban IS in large-scale areas based on a single period image. Few have explored the temporal and spatial variations in urban impervious area on a large scale. We are not aware of how urban development varies in time and across different regions. However, researching the temporal and spatial variability in urban development will help us to further understand the state of urban development and its impact on the ecological environment. Therefore, studying the spatial–temporal differentiation of urban impervious surfaces is required.
Since the 1980s, the Chinese economy has developed rapidly [44,45], so we chose China as the research area. The mid- to low-resolution NTL data, MODIS NDVIA, EVI, and the Normalized Difference Water Index (NDWI) data from 2013 were used to calculate the above-mentioned three indexes (HIS, VANUI, and EANTLI). These are the three most common methods for extracting impervious surfaces, both domestically and in foreign countries. We used these three indexes to extract the IS of China in 2013. We used the high-resolution Landsat-8 urban impervious area data as the benchmark data to verify the accuracy of the urban impervious surface extracted by the three indexes. Through visual comparison and accuracy verification, we selected the index that was most suitable for extracting the urban IS, and to explore the spatial and temporal differentiation of urban impervious surfaces in the study area from 2003 to 2013. We wanted to explore the differences in urbanization in different regions by discussing the laws of urbanization and urban development in China in the 10-year period of 2003 to 2013. The results provide new ideas and methods for urbanization research, and they provide a basis for decision-making for the allocation of resources and energy for urban planning and regional development in the future.

2. Study Area and Data Acquisition
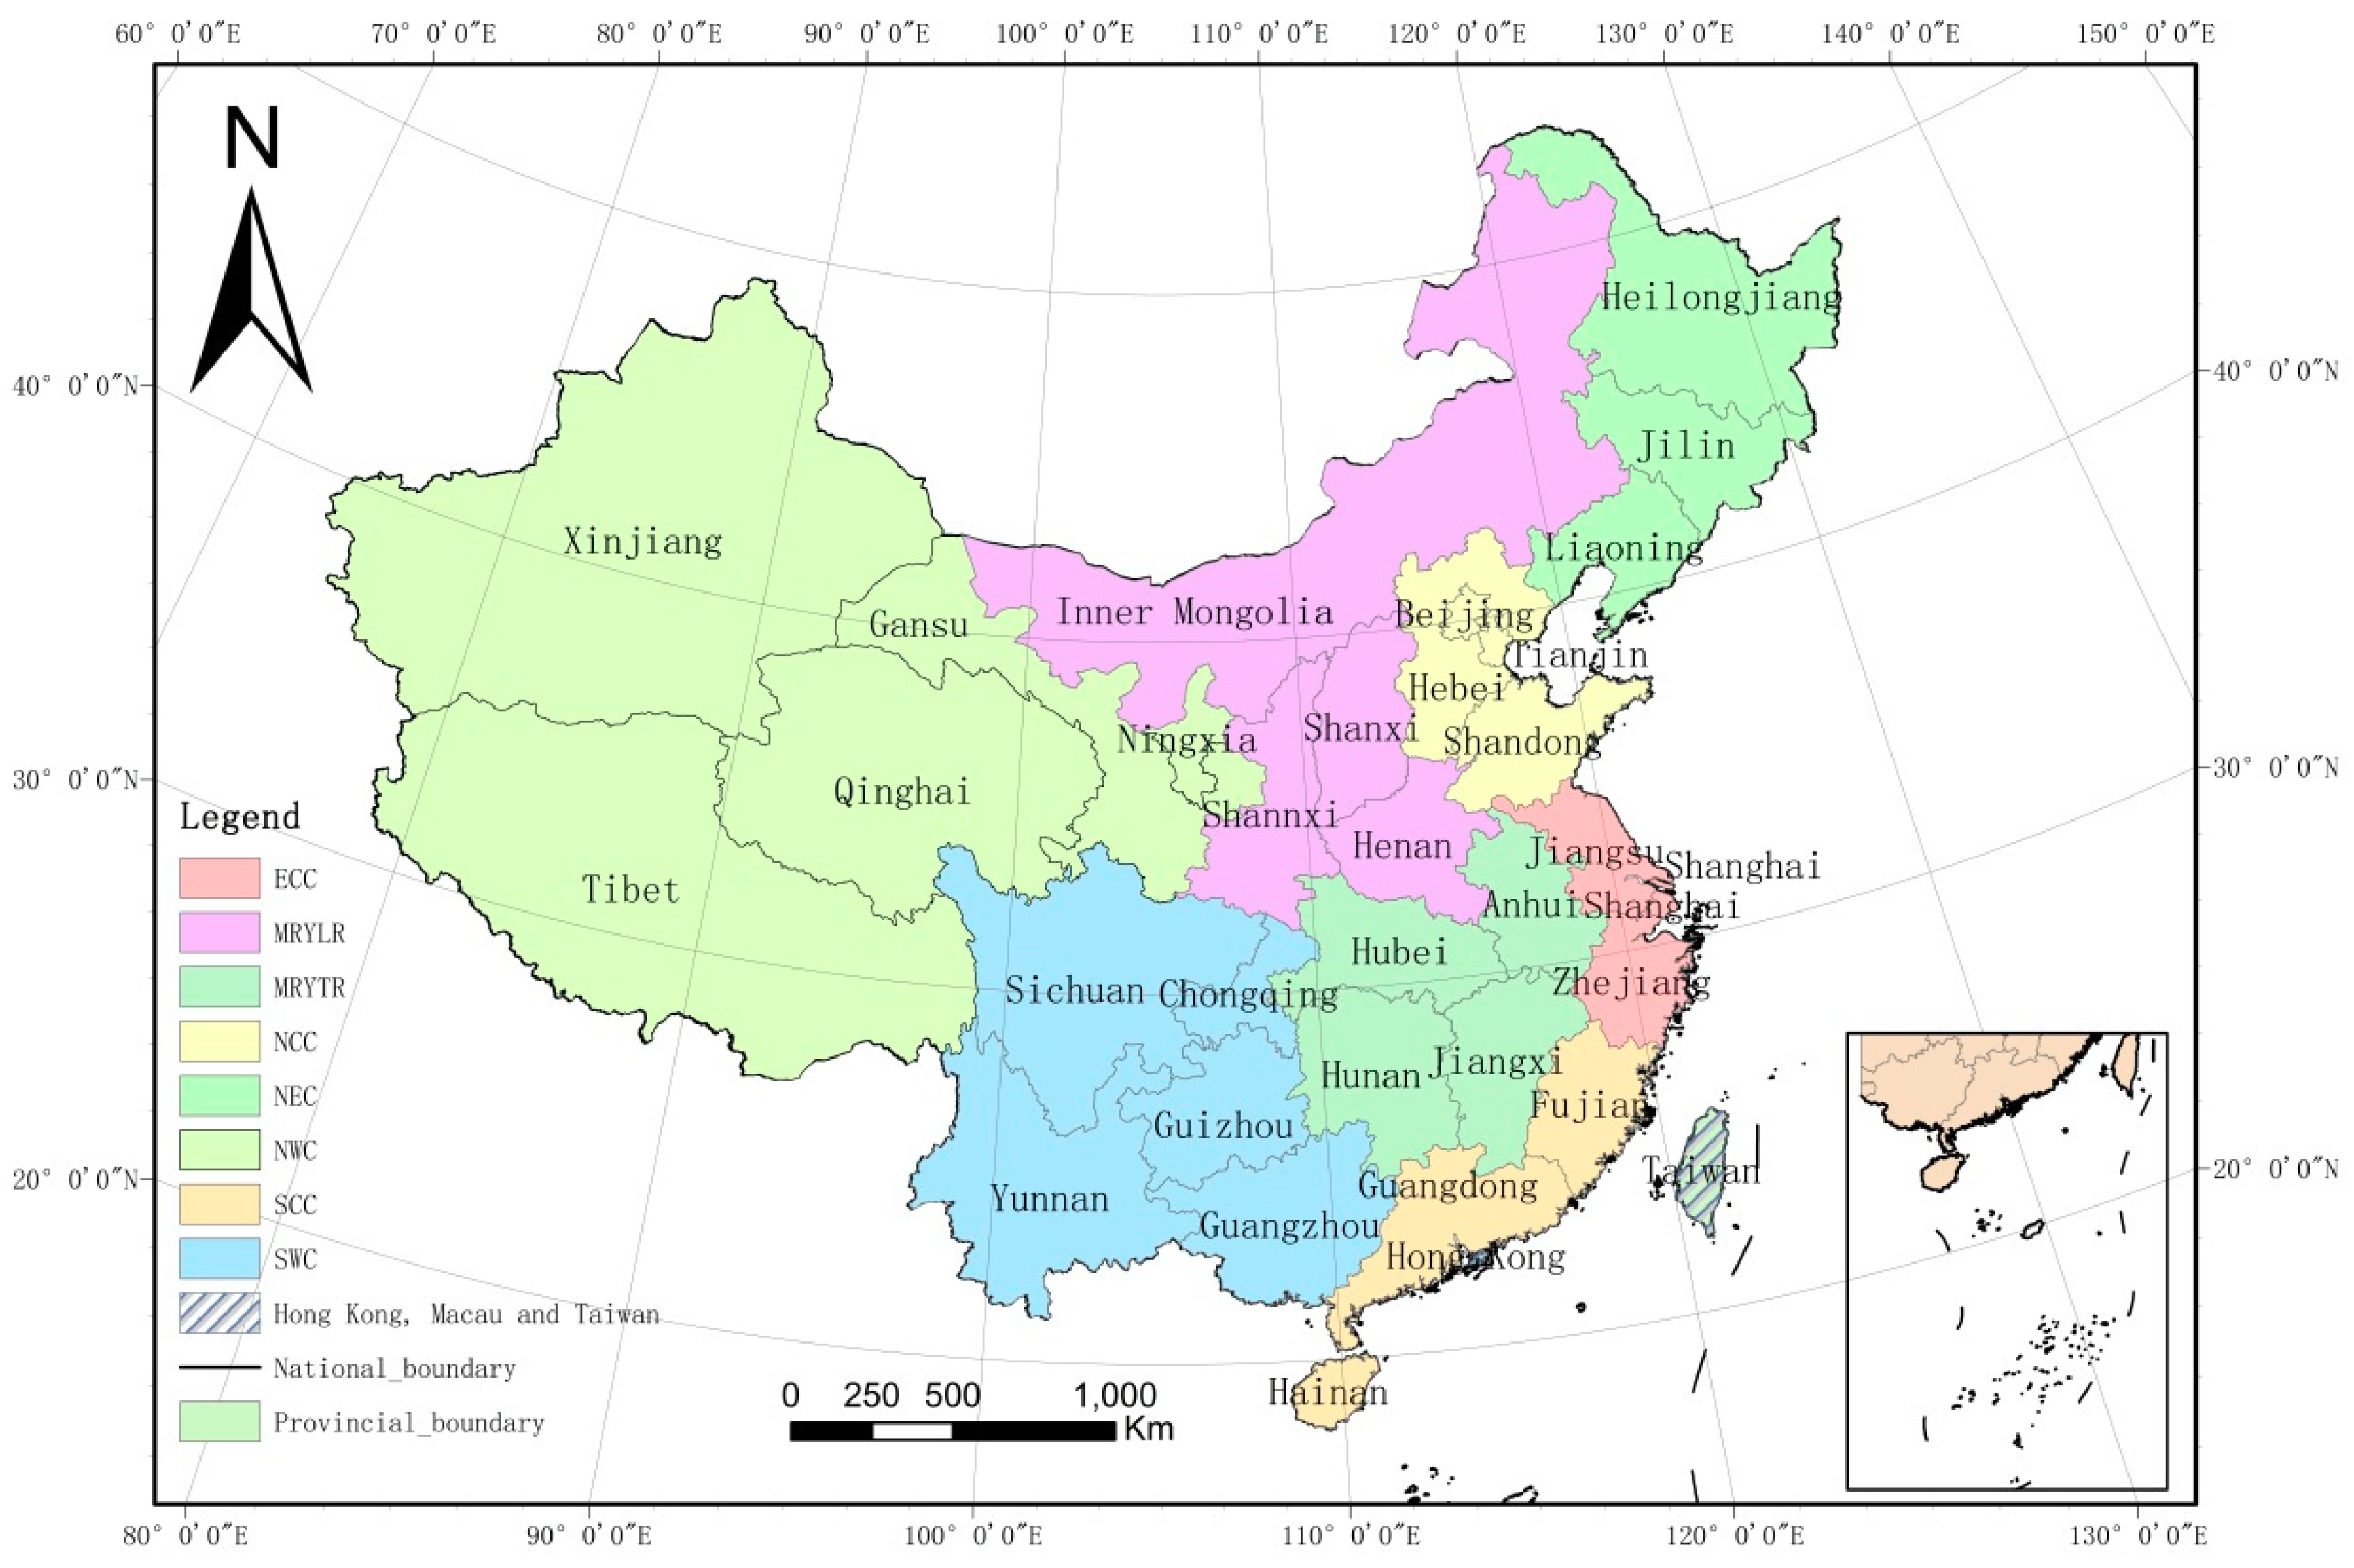
2.1. Study Area

In this study, China was chosen as the study site as the country has been experiencing rapid urbanization with its economic reform process since the 1980s. In 2011, more than half the population of China was living in urban areas [5,6,25,26]. The rapid expansion of cities is accompanied by the rapid expansion of urban impervious surfaces. Therefore, we needed to accurately quantify China’s urban IS area. We wanted to research the law of urban development in different regions to deeply understand the impact of urban expansion on the urban ecological environment, to enable the reasonable deployment of energy and resources, and to intelligently provide policy support for socio-economic development. The study area is shown in Figure 1.

2.2. Data Acquisition
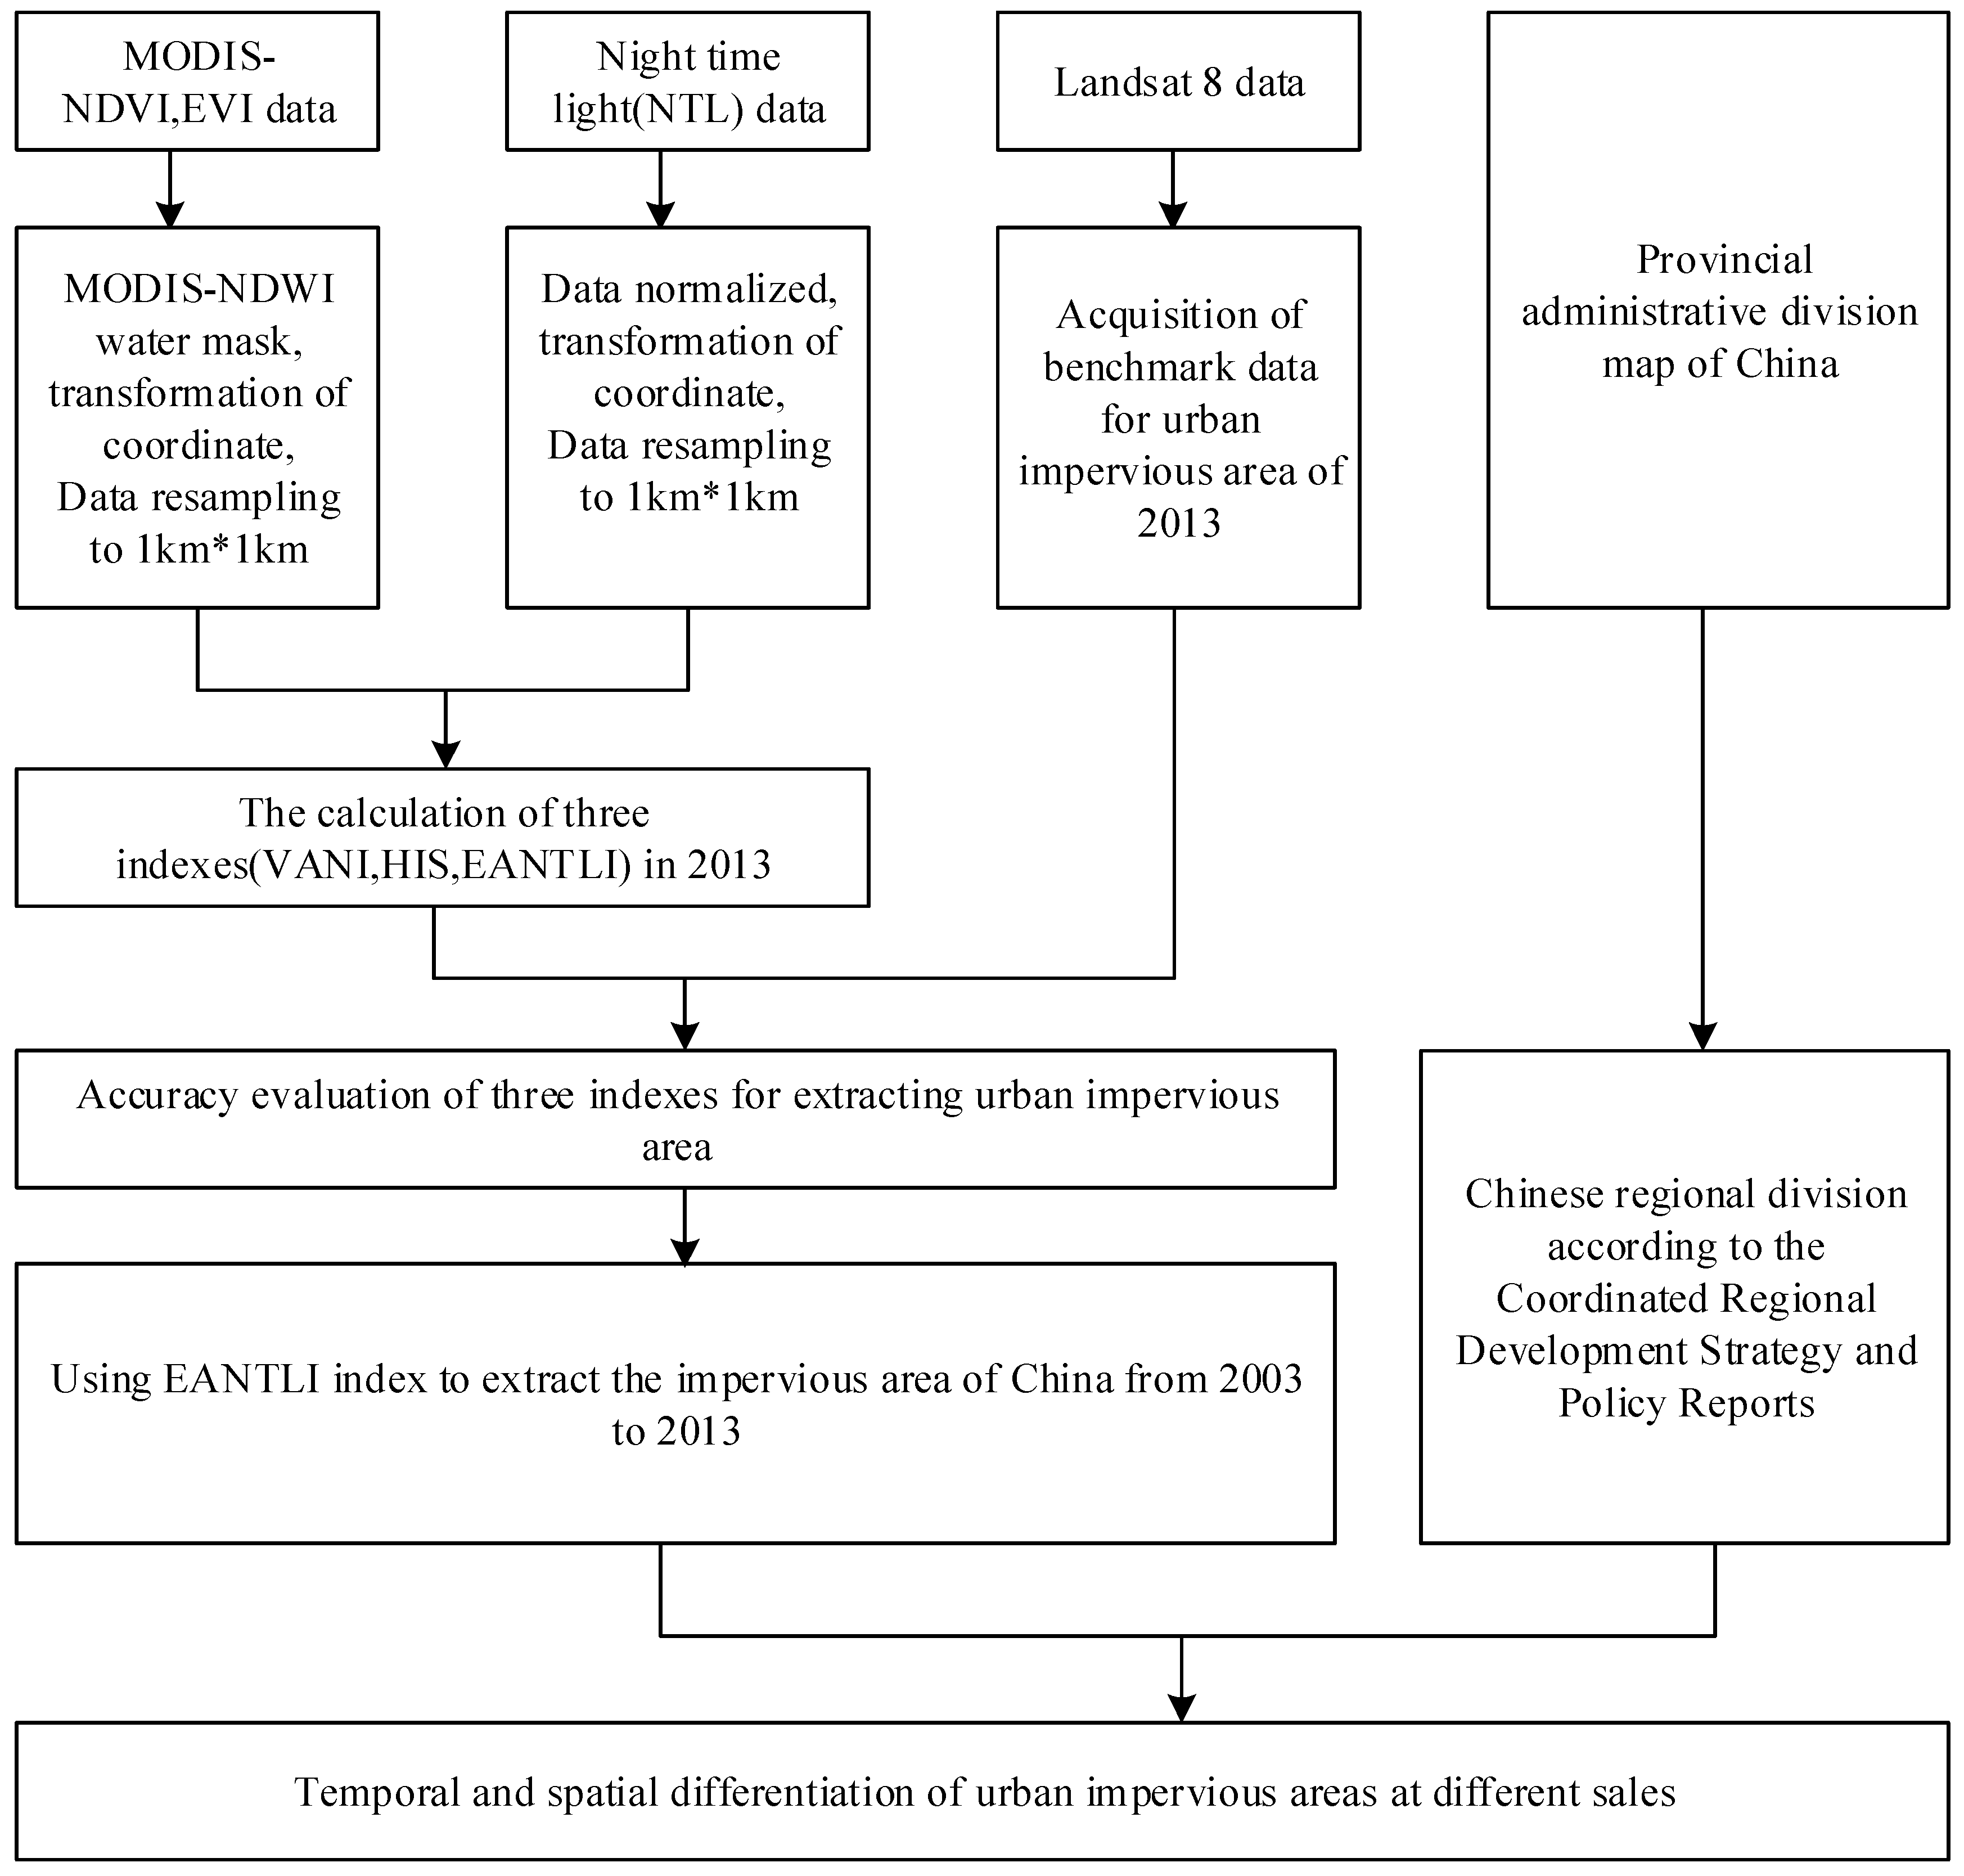
Three types of satellite data were selected to extract the urban IS area and to research the spatio-temporal change characteristics: the coarse resolution of the nighttime light (NTL) series data from DMSP’s OLS, the MODIS Normalized Difference Vegetation Index (NDVI) and enhanced vegetation index (EVI) series data, and the high-resolution Landsat-8 Operational Land Imager (OLI) data and the data from Google Earth. Google Earth images often have a spatial resolution of less than 5 m. They are synthesized by multiple images, including Aerial Imagery, Quick Bird, IKONOS, and SPOT [5]. The details of the data used are shown in Table 1.
Version 4 DMSP-OLS NTL stable light annual image composites (geographic projection with datum from WGS84; spatial resolution: 1 km) from the corresponding DMSP satellite—F15 (2003), F16 (2008), and F18 (2013)—were downloaded from the National Oceanic and Atmospheric Administration (NOAA)/National Geophysical Data Center (NGDC) website (http://ngdc.noaa.gov/eog/dmsp/downloadV4cposites.html, accessed on December 28, 2012). We considered that these stable lighting data were mostly from human settlements because the effects of unstable light information were removed and adjusted from the primary date, including moonlight, stray light, clouds, ephemeral fires, ship lights, and forest fires [5,26,34]. We re-projected and resampled the data, resampled the pixel size to 1 × 1 km using the nearest neighbors resampling algorithm, and re-projected the geographic projection with the WGS84 data.
In this study, we used the MODIS 16-day composited NDVI and EVI data with a spatial resolution of 1 km (MOD13A2) from 2003, 2008, and 2013, and used the date of the global water mask with a spatial resolution of 250 m (MOD44W). These products were downloaded from the National Aeronautical and Space Administration (NASA) Earth Observing System Data and Information System website (https://ladsweb.modaps.eosdis.nasa.gov/). Then, we used the MODIS re-projection tool to project the MODIS 16-day composited NDVI, EVI, and NDWI images. The nearest neighbor resampling algorithm was used to resample these data to maintain a pixel size of 1 km and for geographic projection with the WGS84 data.
Landsat-8 data, from the Operational Land Imager (OLI) sensors, have high spatial resolution, so the data are often used to study impervious surface changes on small scales [10,46]. In this study, we used the data from Landsat-8 (OLI) in 2013 for some Chinese cities (including Beijing, Shanghai, Guangzhou, Nanjing, Wuhan, Xi’an, Urumqi, and Lanzhou). These products were downloaded from the Geospatial Data Cloud website (http://www.gscloud.cn/). Detailed data information is provided in Table 1. Google Earth images were selected from the soft Google map. Some data for Beijing, Shanghai, Guangzhou, Nanjing, Wuhan, Xi’an, Urumqi, and Lanzhou originated from Google Maps.

3. Methods

Our method for determining the spatiotemporal patterns of urban IS included five steps (Figure 2): (1) extracting urban IS using the HIS, VANUI, and EANTLI indexes in 2013; (2) acquiring benchmark data of urban IS using the land use data for 2013; (3) verifying the accuracy of urban impervious areas extracted by the three indexes; (4) selecting the EANTLI index, which had the best extraction accuracy, to extract the urban impervious area from 2003 to 2013; and (5) exploring the differences in urban impervious areas on different time and space scales.

3.1. Selection of Urban Impervious Surface Extraction Index in the Study Area

3.1.1. Calculation of the Three Indexes

We used the following equations to calculate the three indexes to extract urban impervious surface (IS) in 2013 [6,7,43]:
HIS = ( 1 NDVI max ) + OLS nor ( 1 OLS nor ) + OLS nor NDVI max
VANUI = ( 1 N D V I m e a n ) OLS nor
EANTLI = 1 + N T L n o r E V I 1 N T L n o r E V I N T L
where NDVI m e a n is the annual mean of NDVI data derived from MODIS in 2013, NDVI max is the annual maximum NDVI derived from MODIS in 2013, NTL is the original value of the DMSP-OLS image, EVI is derived from the maximum annual MODIS EVI image, and   OLS nor is the normalized value of the NTL data.
In order to ensure the simplicity of the formula and the unity of the parameters, we used the same parameters in the three formulae, which may be different from the original formula. However, the formula and parameters were not changed. The maximum and mean values of NDVI were calculated from Equations (4) and (5), respectively, and OLS nor was calculated using Equation (6).
NDVI max = MAX ( NDVI 1 , NDVI 2 , , NDVI n )
NDVI mean = MEAN ( NDVI 1 , NDVI 2 , , NDVI n )
OLS nor = OLS OLS min OLS max OLS min
where OLS min and OLS max are the minimum and maximum values in the DMSP-OLS image, respectively, and NDVI 1 ,   NDVI 2 , , NDVI n are the whole annual multi-temporal MODIS 16-day NDVI composite images in 2013. In general, NDVI images have values ranging from −1 to +1. The land surface covers, however, range between 0 and 1. In the NDVI images, the values are usually positive, except for water bodies and glaciers, which usually have negative NDVI values [5,6,7]. Therefore, we constrained the NDVI range to 0 to 1.

3.1.2. Acquisition of Benchmark Urban Impervious Surface Data Based on Landsat-8

In order to determine the accuracies of the three indexes, we used the results extracted from high-resolution Landsat-8 images as the benchmark to verify the accuracy of the above index extraction results. We wanted to choose a method that was the most suitable for the extraction of impervious surfaces in the study area. Therefore, the accuracy of the Landsat-8 benchmark data extraction was directly related to the accuracy of the final result.
In this study, we selected a representative study area covering eight important provincial capitals and municipalities with different economic development levels in China, including Beijing, Shanghai, Guangdong, and Wuhan with higher economic development; Lanzhou and Urumqi with lower economic development; and Nanjing and Xi’an with medium economic development. These cities are distributed from the south to north, and from east to west in China, which could help to reduce the uncertainty of the result due to seasonal situation and geographical location. Lanzhou and Urumqi are located in Northwest China; Guangdong, Nanjing, Shanghai, and Wuhan are located in Southeast China; Beijing is located in East China.
We used support vector machine (SVM) classification to extract the urban impervious surface the from Landsat-8 images, and to verify the accuracies of the three index extraction results. SVM classification is a supervised machine learning method based on statistical learning theory, which has been widely used in remote sensing data classification, and which has achieved better classification accuracy [47]. Thus, SVM has a higher classification accuracy and better generalization than other machine learning methods [47]. With the combination of machine learning methods and big data, SVM is being increasingly used for object recognition and classification. We used SVM to classify the spectra and textures of Landsat-8 images. We selected Google Earth images to verify the accuracy of Landsat-8 imagery in three cities: Guangdong, Xi’an, and Urumqi. Four types of land use types—vegetation, city, water, and bare land—were selected for accuracy verification. The overall classification accuracy was 86.72%, the Kappa coefficient was 0.74, and the protraction accuracy of urban IS was 90.32%. Relative to the NTL data (1 × 1 km), the classification result of Landsat-8 (30 × 30 m) can accurately represent the actual land use type.

3.1.3. Practicability of the Three Indexes

We resampled the obtained urban impervious benchmark dataset, resampled its pixel size to 1 × 1 km raster data using the nearest neighbor sampling method, and selected the verification sample from this benchmark dataset. We selected 480-pixel urban and non-urban areas, and 140-pixel water body verification samples. A hybrid matrix was used to verify the accuracies of the urban impervious area of the three indexes. The total accuracy and Kappa coefficient were used as evaluation indicators of the classification accuracy. The equations are as follows:
Overall   Accuracy = A u t h e n t i c   P i x e l T o t a l   P i x e l
Kappa   coefficient = P 0 P e 1 P e
P e = a 1 × b 1 + a 2 × b 2 + a c × b c n × n
where P 0 is overall classification accuracy, a c represents the actual sample number of each class, b 2 c is the number of samples for each type predicted, and n is the total number of samples.

3.2. Quantifying the Spatiotemporal Patterns of Urban IS

3.2.1. Determination of Quantitative Indicators

Through comparative analysis of the above three indexes, we first used the index that was most suitable to extract the impervious areas in different years for the study area. Then, we used the urban IS percentage (UISP) index [5] to quantify the increase in urban impervious surface on different scales: country, region, and province. The UISP equation is as follows:
UISP = UISA TA × 100 %
where UISP is the urban IS percentage (%), UISA represents the total impervious surface area of the space area (km2), and TA is the total area of the space area (km2).
We used the relative urban IS expansion index (UISEr) to research the temporal variation in the impervious area on different scales: country, region, and province, with the following equation [5]:
UISE r = UISA j UISA i TA × 100 %
where UISEr represents the relative urban IS expansion index (%), UISAi is the total urban IS area in the ith year (km2), UISAj is the total urban IS area in the jth year (km2), and TA is the total area of the space area (km2).
In order to explore the differentiation in urban impervious change in different regions, we used the Year-On-Year Growth rate (YOYG) index to illustrate the changes in urban impervious area for the different time periods. YOYG is an economic concept that is calculated as follows:
YOYG = UISA j UISA i USIA i × 100 %
where YOYG represents the year-on-year growth rate, USIA j represents the urban impervious rate of the jth year, and USIA i represents the urban impervious rate of the ith year.

3.2.2. Classification of Regional Characteristics of the Study Area

On the regional scale, we divided China into eight regions based on the Coordinated Regional Development Strategy and Policy Reports in China in 2005 (Development Research Center of the State Council of China, 2005) (Figure 1): Northeast China (NEC), Northern Coastal China (NCC), Eastern Coastal China (ECC), Southern Coastal China (SCC), the Middle Reaches of the Yellow River (MRYLR), the Middle Reaches of the Yangtze River (MRYTR), Southwest China (SWC), and Northwest China (NWC) [5]. For provinces, we divided them according to China’s administrative divisions.

4. Result and Discussion

4.1. Selecting the Best Index for Urban Impervious Surface Extraction

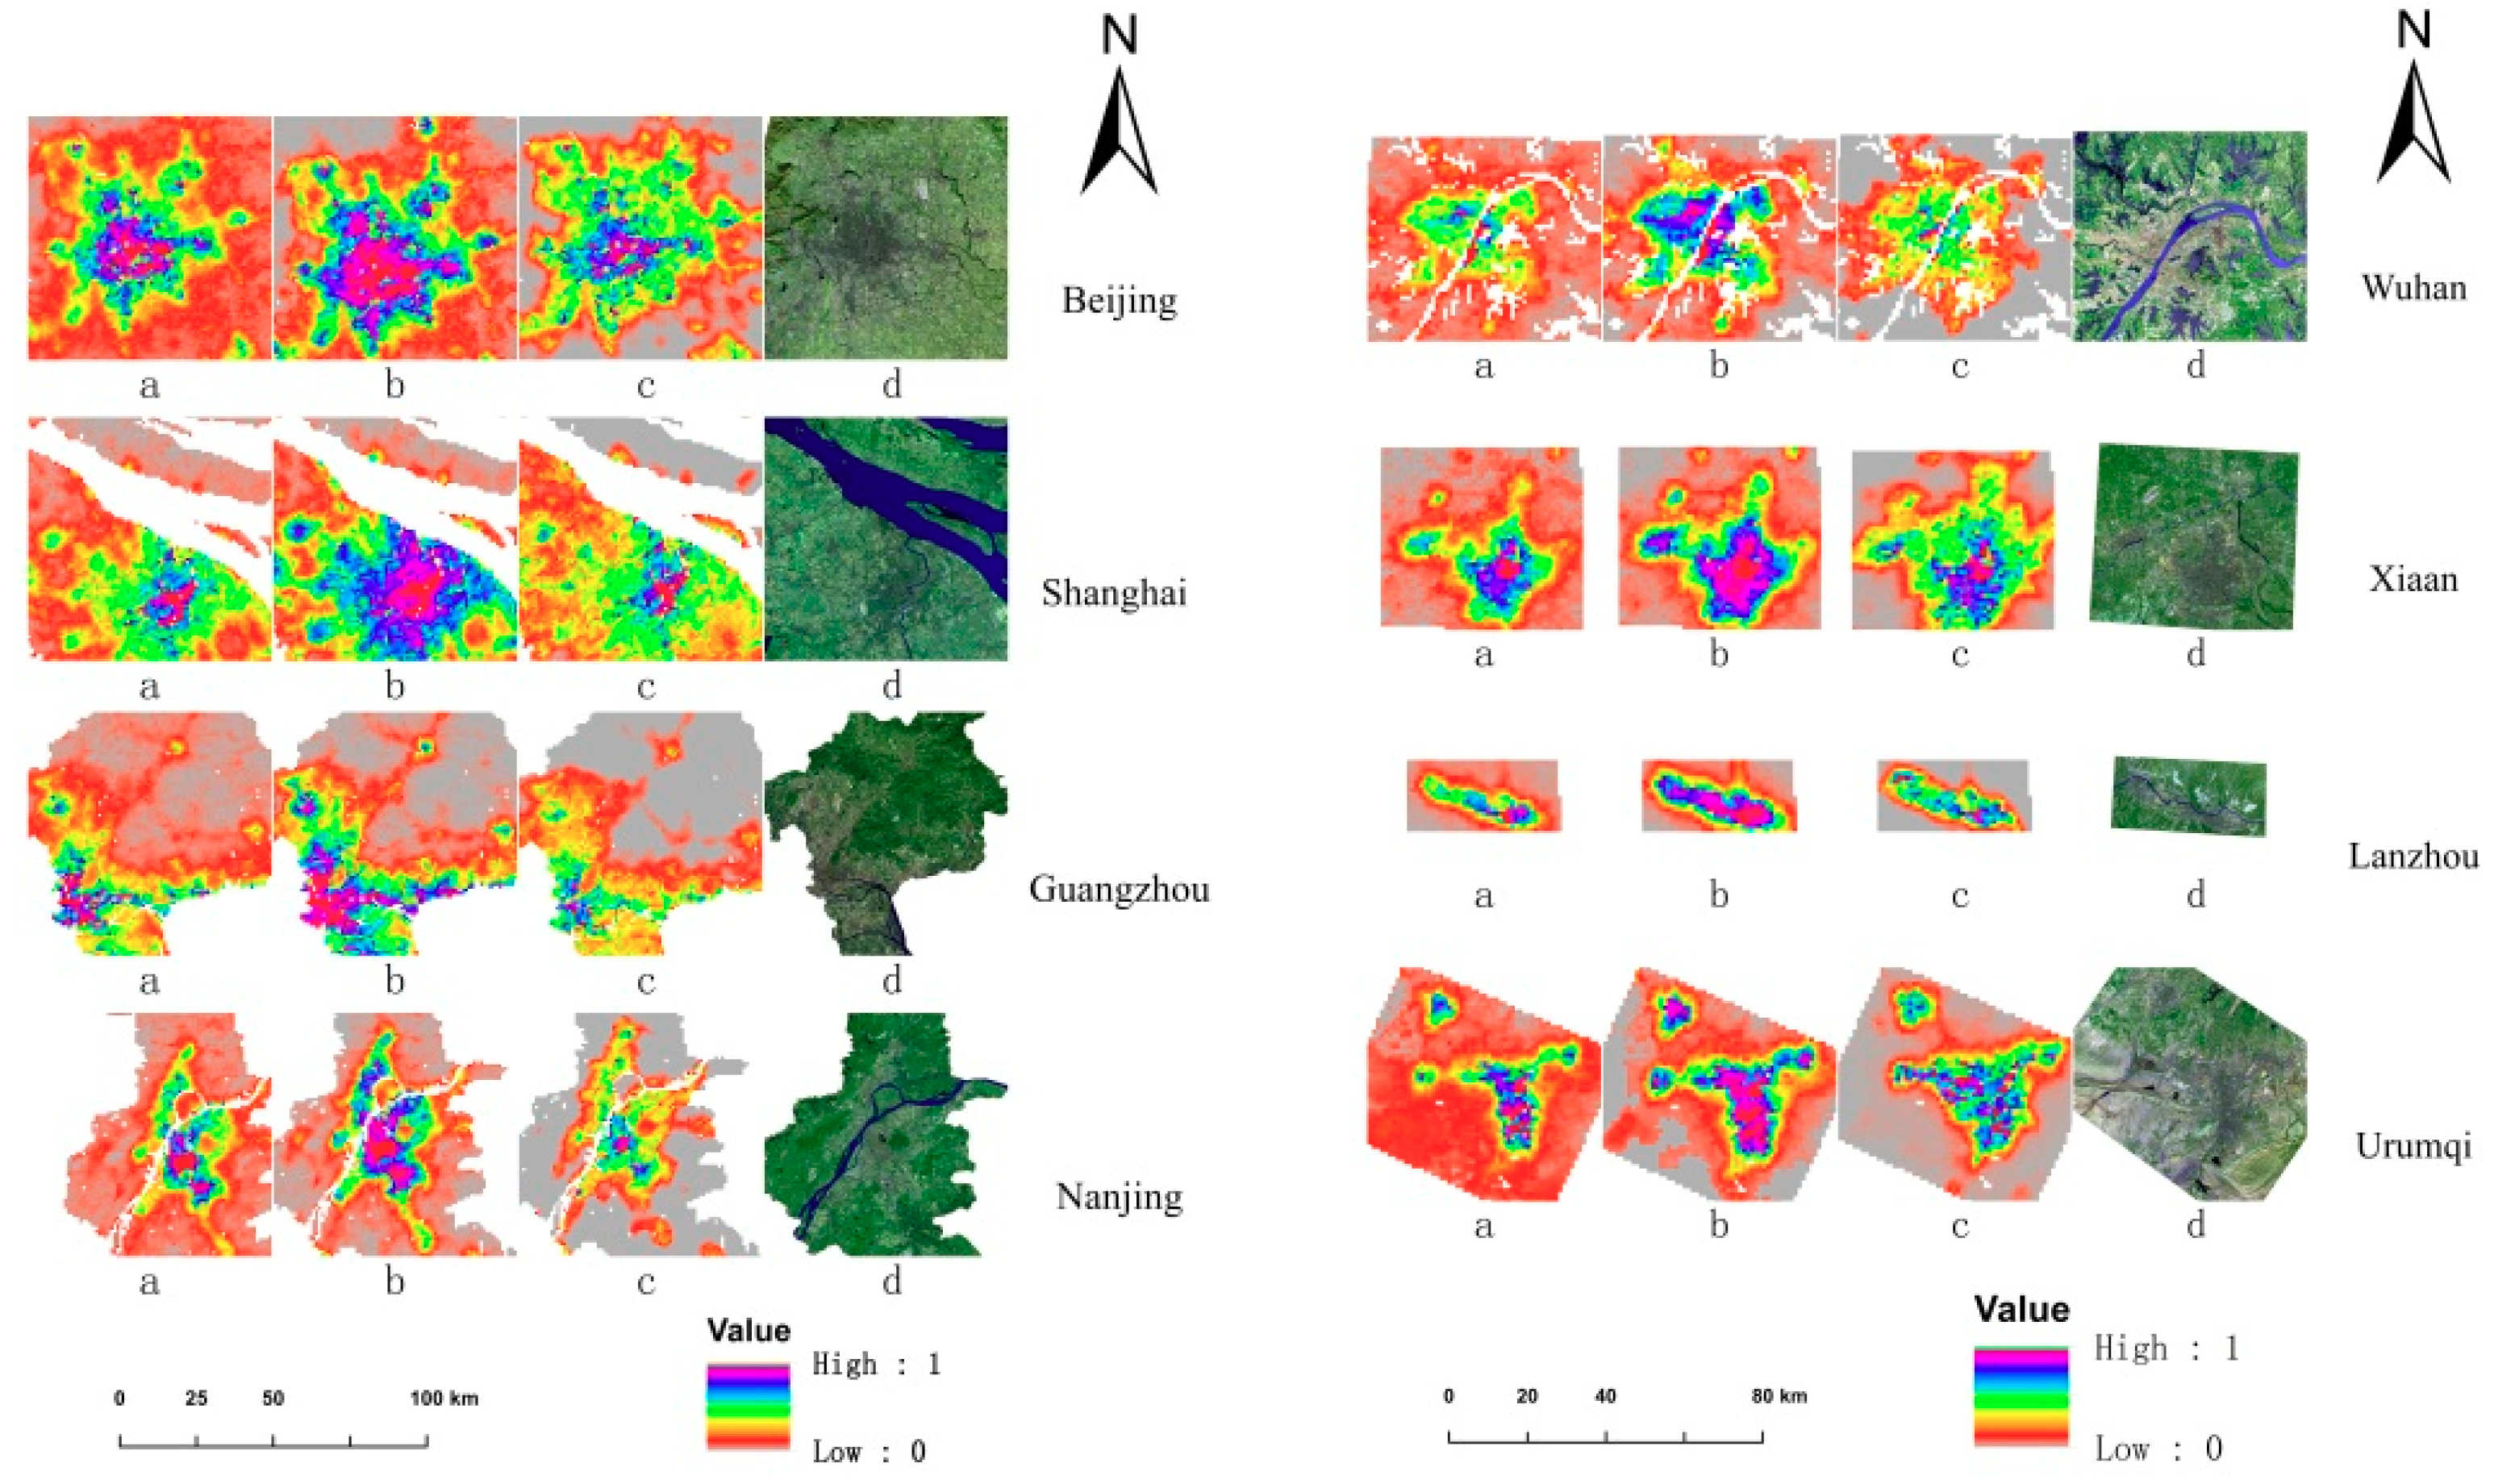
4.1.1. Comparative Analysis of the Results of Three Indexes of Urban Impervious Surface Extraction

We extracted the urban impervious surface using three different indexes. Visual comparison with the high-resolution Landsat-8 images illustrated the differences in the three indexes for extracting urban impervious information. As shown in Figure 3, the three indexes performed similarly for all cities, but the differences between them were obvious. Firstly, the HIS value was lower in areas where the urban buildings were sparsely distributed. The extraction result for the cities was inferior to the background vacant areas. The extracted result produced a lower value and was generally the same red color. This phenomenon was particularly prominent in Urumqi, where the vegetation cover is limited in the arid desert region of Northwestern China. This indicates that the urban impervious surface extracted based on the HIS index is greatly affected by the NDVI index. Lu et al. [6] stated that if the investigator knows more about the relationship between different vegetation covers and low-intensity residential areas in the study area, the accuracy of the result extracted by this index was higher. In the northwestern region with low vegetation coverage, differentiating between bare land and city is difficult. This weakened the gradual change in the color of the extracted result, and seemed to create an illusion that the HIS extraction results were better than the VANUI index in the city centers.
Secondly, saturated pixels were found in the index extraction results in each city subset. This was mainly reflected in the single color abundance. The image color was mostly concentrated in the low value area. The image color was red to green. This phenomenon was extremely prominent in Urumqi and Lanzhou. This is probably related to the higher non-urban background value and the low vegetation cover in the northwest. This indicates that the index itself has excellent results for the impervious areas in the cities in Southern China that have higher vegetation coverage, but the indexes still had certain limitations for the northwestern region of China that has low vegetation coverage. Therefore, the index is not suitable for the study of IS of large cities in China.
The VANUI index classification result was better than the HIS index in the removal of the background value and in the reduction of low nighttime light data saturation. This is consistent with the results of previous studies [5,7]. The colors of the classification map were evenly distributed in the low-, medium-, and high-value areas. As shown in Figure 3b, the saturation of the pixels was particularly prominent in developed cities such as Beijing and Shanghai. Most of the image color appeared as a high-value magenta areas. However, for the medium-developed cities, such as Wuhan’s Xi’an, and those with relatively less developed economies, such as Lanzhou and Urumqi, the saturated pixels in the central city were significantly reduced. The reason for this phenomenon is that developed cities have more nighttime light saturated pixels, and the index has higher stability requirements for vegetation types. China is a country that is constantly evolving and changing. The urban vegetation is not sufficiently stable. There is no unique type or pattern of stable vegetation for each city. Therefore, the VANI index was still limited in the extraction of impervious surfaces for all of China. As the original founder of this index, Zhang [7] stated, that in Beijing, a developing city with a quickly changing vegetation, the difference in the extraction results was weaker in terms of the inter-urban variability of the city. Therefore, the index seems to have some shortcomings in extracting the ISs of cities in China.
As shown in Figure 3, the EANTLI index, constructed using the largest EVI index of the year, was able to accurately remove the influence of non-urban background values from the extraction results, and maximize the difference between bare land and city. Therefore, the index better distinguished between bare land and urban areas, as shown in Urumqi, which is located in the northwest of China. With the low vegetation coverage, it was difficult to distinguish between urban and sandy soil backgrounds, using the HIS and VANUI indexes in this region, but we clearly could see the location and size of the city. EANTLI effectively distinguished between urban and non-urban background values. Secondly, EANTLI appropriately reduced the saturation of nighttime light data in the central area of the city and better showed the difference between cities. The gradual change in image color was more uniform, such as Guangdong, Shanghai, Nanjing, and Wuhan, which are located in Southeast China with the high vegetation coverage. From Figure 3, regardless of the level of economic development, EANTLI was able to highlight the differences between the cities, and reduce the saturation of the data. These findings are analogous to those of the creator of the index [43]. The index can solve the problem of data saturation in the central area of the city [34]. However, Zhuo [43] neither discussed the difference between urban and bare land values, nor the inter-urban variability of the city. This may be related to the use of the annual average EVI value. The annual average EVI value itself weakens the vegetation abundance in one area, and stabilizes the vegetation change [2,7,36].
In this paper, the EANTLI index was calculated by using the maximum EVI for a whole year, which can maximize the difference between the vegetation in different regions, which creates differences in the impervious surfaces of different regions. Therefore, EANTLI is not only suitable for the extraction of urban impervious surfaces in the southeastern region with high vegetation coverage, but also for the northwest region with low vegetation coverage.

4.1.2. Verification of the Accuracy of the Three Indexes

We compared the results of the 2013 urban impervious area extracted by the EANTLI index (Figure 4) with the Landsat-8 image supervised classification results of the eight cities. The hybrid matrix verification accuracies of the three index extraction results are shown in Table 2. The results show that the three indexes could extract the urban impervious surfaces of the study area. The total classification accuracies were higher than 85% for all three indexes. However, the urban impervious area obtained by the VANUI index was significantly better than the HIS index. This was the same as the results obtained by Ma et al. [5] and Zhang et al. [11]. The EVI for the whole year was able to maximize the vegetation abundance between the regions and distinguish between urban impervious surfaces and non-impervious surfaces [48,49]. So, the EANTLI index, which was calculated using the maximum EVI of the whole year, had a higher classification accuracy than the VANUI and HIS index, with an overall accuracy of 95.41% and a kappa coefficient of 0.91. The EANTLI index was more suitable than VAUI and HIS in extracting the urban impervious area for the study area.

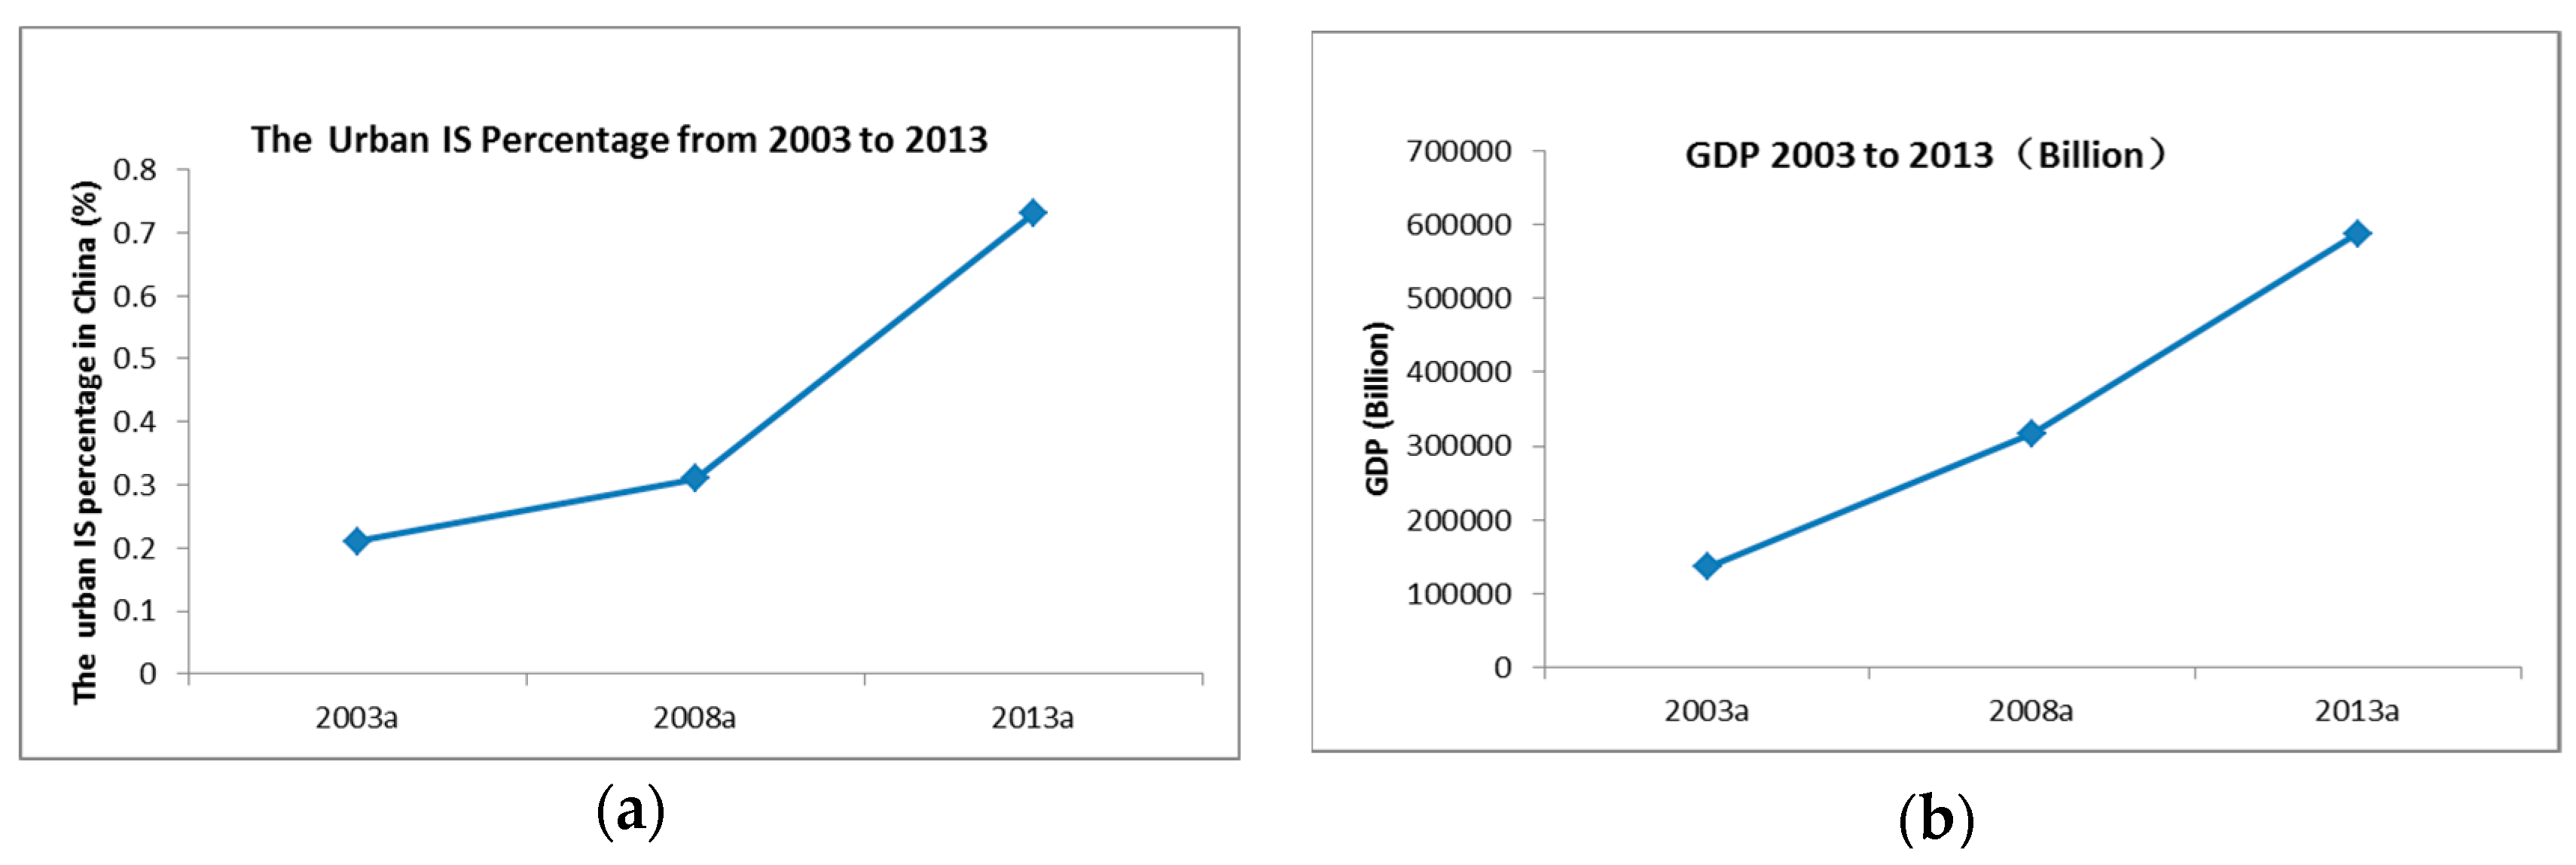
4.2. Spatial and Temporal Differentiation of Impervious Surfaces over 2003–2013

We selected the EANTLI index to extract the urban impervious area of the study area from 2003 to 2013. The results show that, by 2013, the impervious area of China’s cities was 70,179.06 km2, accounting for 0.73% of the country’s total land area. Compared with 30,119.44 km2 and 20,565.24 km2 in 2008 and 2003, respectively, the UISP index increased by 0.42% and 0.52%, respectively. On a time scale, the impervious area of Chinese cities in the five years from 2008 to 2013 grew faster than the five years from 2003 to 2008 (Figure 5a). This seems to be consistent with the results of China’s gross domestic product (GDP) growth trend from 2003 to 2013 (Figure 5b). This shows that urban IS area is related to urban economic development. The results of Wu et al. [50], Wang [51], and Wu [52] also support this point.
On a spatial scale, the expansion of urban impervious areas had different manifestations in different spatial regions. The overall UISP performance was characterized by a decreasing trend from NWC, SWC, MRYLR, NEC, MRYTR, SCC, and NCC, to ECC (Figure 6). The UISP values in different regions were considerably different. In 2013, the urban impervious surface coverage (UISP) of ECC was 7.26%, whereas the NWC area was only 0.11. This shows that UISP is directly related to the degree of economic development. In terms of economic development, UISP was widely different in different regions. For example, areas with relatively good economic development, such as Beijing (NCCC) and Shanghai (ECC), had high UISP values. In areas with relatively lower economic development, such as Gansu and Xinjiang (MRYTL), their UISP values were relatively lower.
Relative to a specific period, the differentiation in urbanization expansion speed in different periods was less obvious. Therefore, we used the Year-On-Year Growth rate (YOYG) to illustrate this problem. As shown in Figure 7, the impervious area of cities in seven regions, except SCC, increased by more than 200% in 2013, compared to 2003. This shows that China’s urban impervious area has at least doubled in the 10 years. However, the expansion of the impervious area of the city in the MRYTR and MRYLR areas during this decade was more obvious. The growth rate of the urban impervious area increased four-fold over the 10 years. This seems to be different from our understanding, but we can explain this phenomenon from another aspect. The growth rate of the saturation of urban development is slow when it develops to a certain extent. So, the urban impervious area tends to be stable. Figure 7 proves this point. From the figure, we can see that the urban growth rate from 2003 to 2008 was higher than the five years from 2008 and 2013.
In order to quantify the changes in the urban impervious area during the 10-year period from 2003 to 2013 on different spatial scales, we calculated the UISEr rate of the impervious surface in the entire study area, and produced a graph of the UISEr (Figure 8). From this figure, Beijing, Tianjin, Jiangsu, and Shanghai had the greatest growths in impervious areas, followed by Zhejiang and Guangdong from 2003 to 2013. This shows that, in the 10 years, the urban expansions of Beijing, Tianjin, Jiangsu, and Shanghai were the highest in the country. Combined with the research on urban expansion and ecological environment changes [12,53], we think that these cities may have a greater impact on the changes in the original ecological environment. Therefore, the population, resources, and environmental issues in these areas may become more prominent. These changes may cause regional policies to change. Understanding these changes will become an indispensable factor in policy development in the future.
In general, through the study of the temporal and spatial changes in the impervious surface of cities, we can clarify the speed of urban expansion in a city or region, and understand the urbanization process in a region. More importantly, by studying the UISEr in cities on different time and space scales, we better understand the intensity of urbanization in a region. The problems faced by the ecology and environment in high-UISEr areas are becoming increasingly prominent. The UISEr index provides a new method for understanding the differences between cities.

5. Conclusions

By calculating the values of three urban impervious area indexes—Human Settlements Index (HSI), vegetation-adjusted NTL urban index (VANUI), and the EVI-adjusted NTL index (EANTLI)—using 2013 NTL data and MODIS-NDVI and EVI data, the IS area was extracted. Landsat-8 data were used as the benchmark to verify the IS accuracy extracted by the three indexes. We used the index with the best accuracy to extract the urban impervious surface area of the study area from 2003 to 2013, and explored the temporal and spatial variation in urban impervious surfaces using the urban IS percentage (UISP) index, YOYG, and UISEr. We obtained the following conclusions:
(1)
The three indexes can extract the impervious surface of the city, and the total classification accuracy was at least 85% for the three indexes. EANTLI had a higher classification accuracy than the VANUI and HIS indexes, with an overall accuracy of 95.41% and a kappa coefficient of 0.91. Therefore, EANTLI has a better recognition accuracy in extracting the urban impervious area in China.
(2)
China’s urban impervious area was 70,179.06 km2, accounting for 0.73% of the country’s land area. Compared with 2008 and 2003, this value was an increase of 0.42% and 0.52%, respectively. The growth rate of the impervious areas in Chinese cities from 2008 to 2013 was higher than that from 2003 to 2008.
(3)
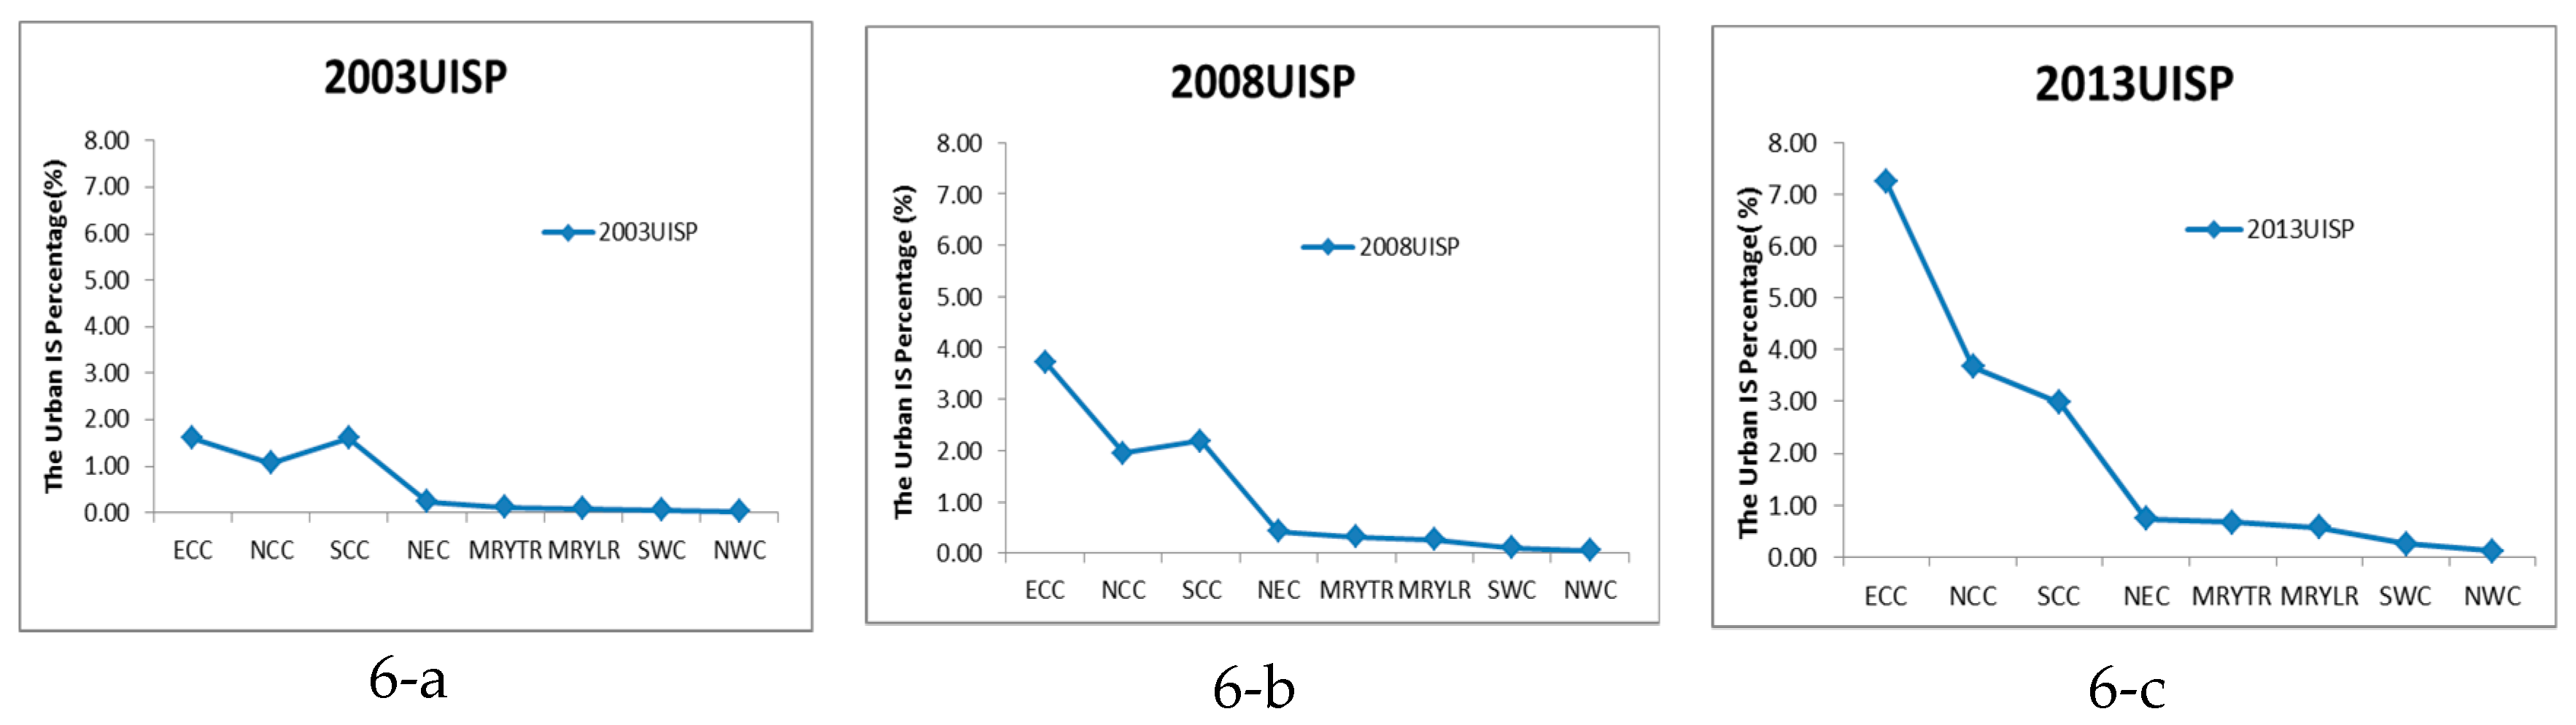
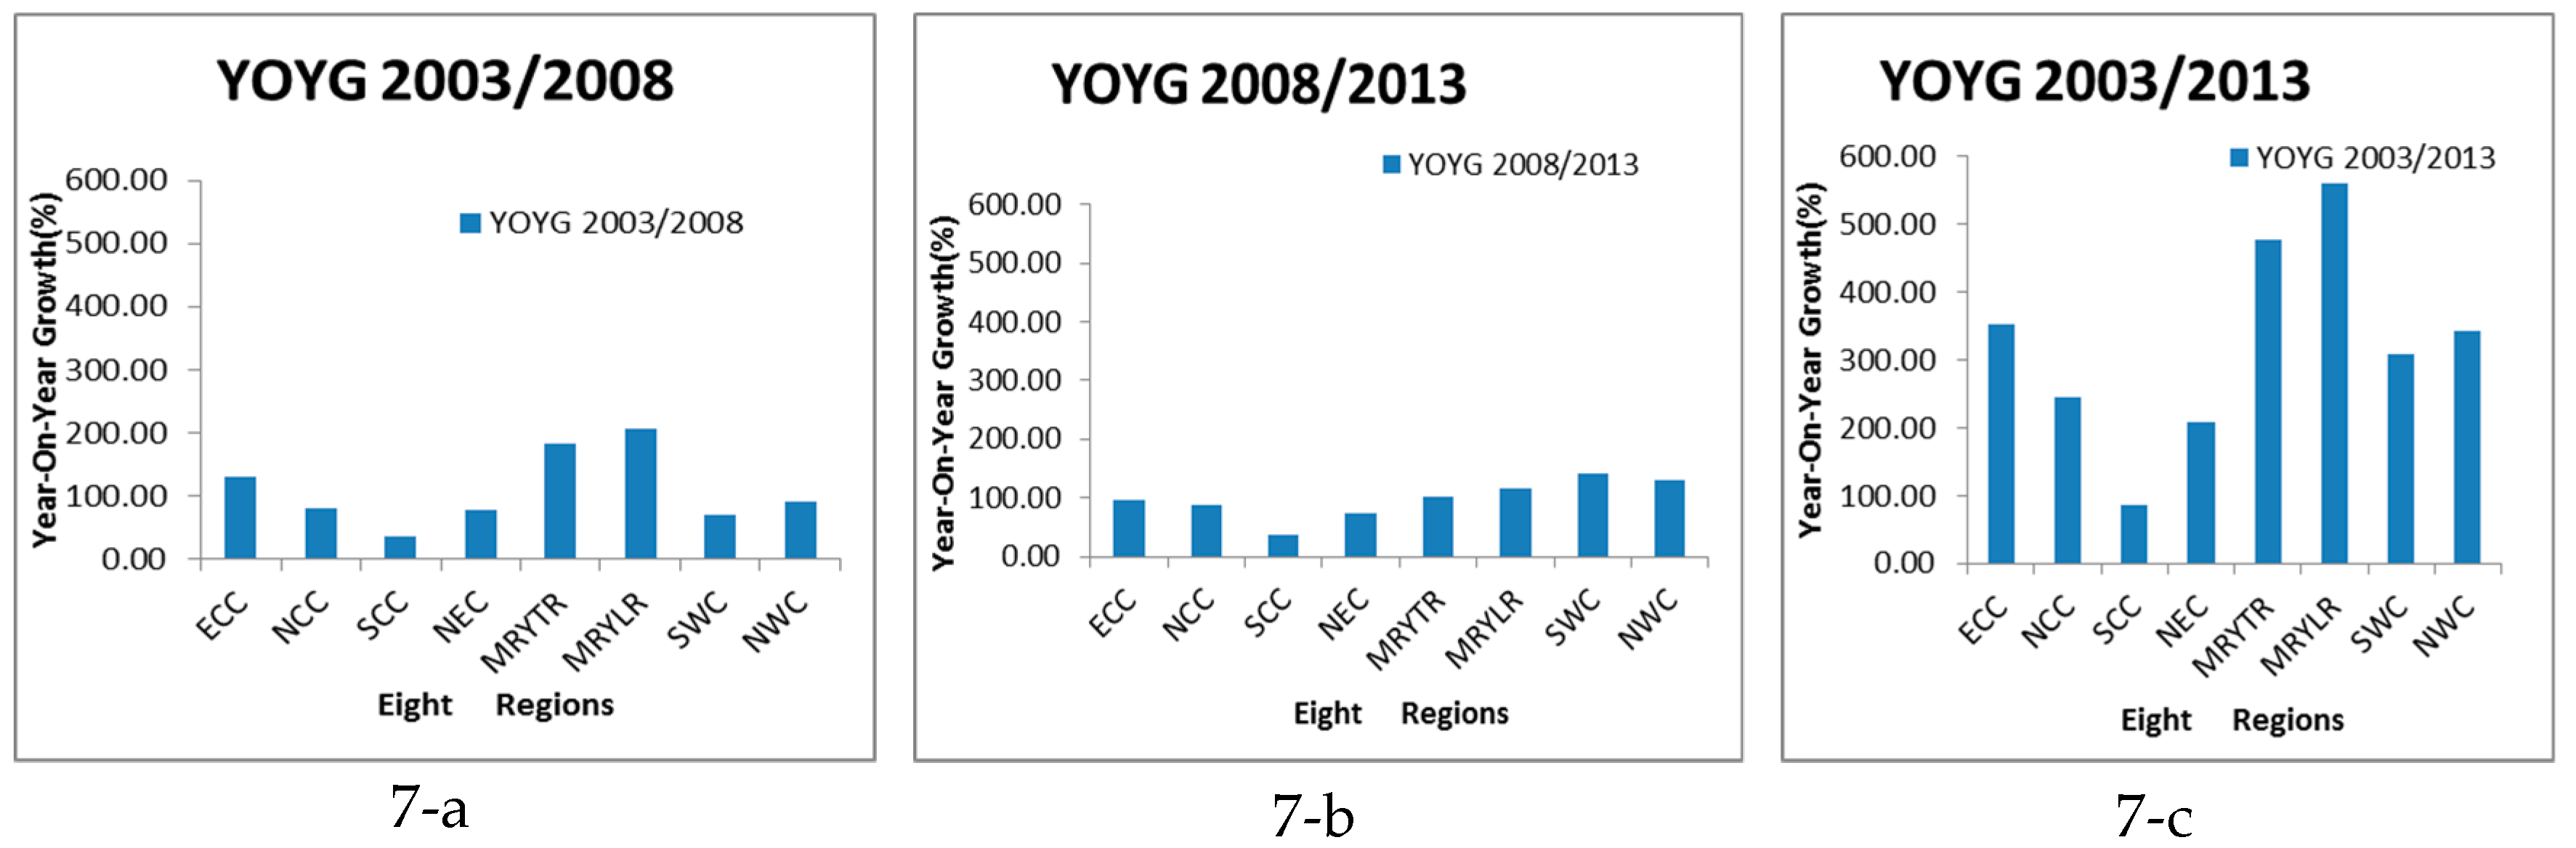
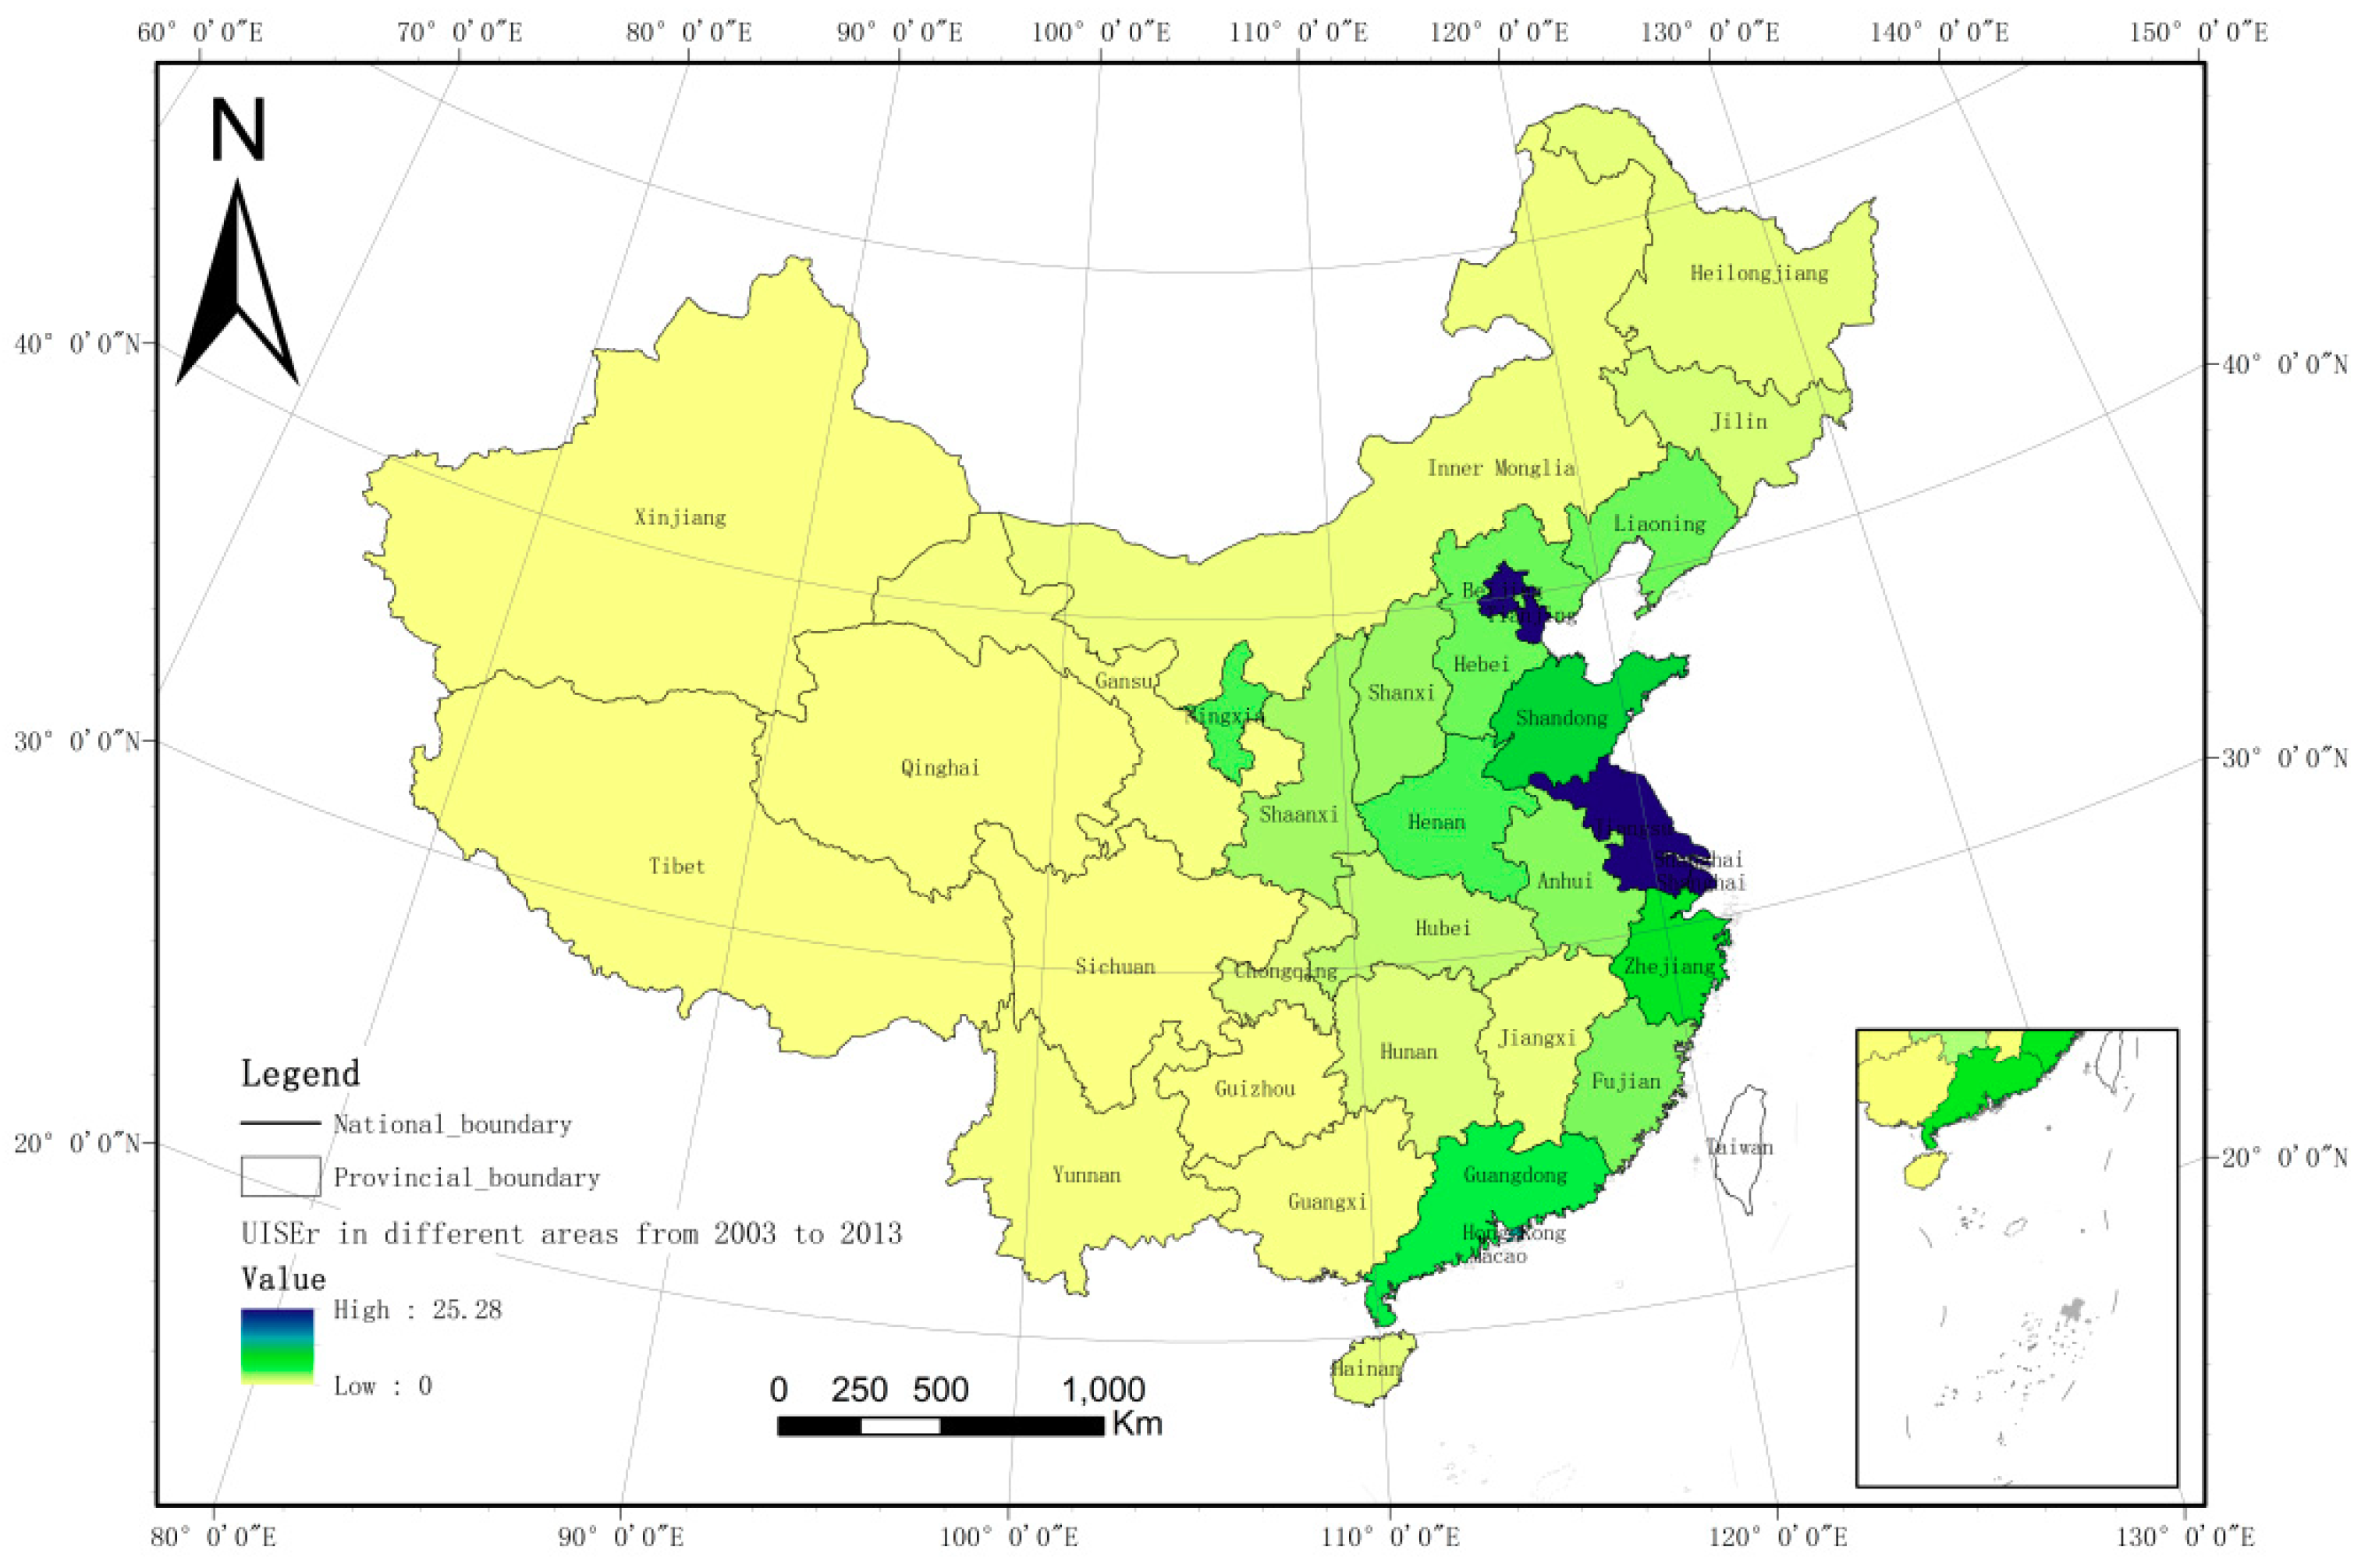
On a spatial scale, impervious surface distribution is extremely uneven in different areas of China. The urban IS percentage (UISP) performance was characterized by a decreasing trend from NWC, SWC, MRYLR, NEC, MRYTR, SCC, and NCC, to ECC in 2013. UISEr demonstrated the considerable imbalance in different areas of China from 2003 to 2013. The expansion of the impervious area in the MRYTR and MRYLR areas during this decade was more obvious.
In short, the urban impervious surface of the whole study area presented an increasing trend from 2003 to 2013. However, the urban impervious surface coverage percentage differed considerably in different regions. This means that there is a large difference in urbanization in different regions. The urban IS expansion index (UISEr) was considerably different in different regions from 2003 to 2013. Combined with research on urban expansion and ecological environment changes, we should pay more attention to the regions where the impervious surface area is rapidly increasing, because these areas might have a greater impact on changes in the original ecological environment.

Author Contributions

P.Z. envisioned and designed this research and wrote the paper. J.P. provided suggestions and modified the paper. H.B., L.X., and Y.Z. processed the data and designed the charts and conducted the analysis. T.Z. and P.Z. revised the manuscript draft.

Funding

This research was funded by National Natural Science Foundation of China: Research on the Methodology of Soil Survey Methods in Plain Agricultural Area Based on Micro-Landscape grant number [41771247].

Acknowledgments

This research was supported by the National Natural Science Foundation of China: Research on the Methodology of Soil Survey Methods in Plain Agricultural Area Based on Micro-Landscape (41771247). We are also very grateful for the data support provided by the National Aeronautics and Space Administration (NASA) for our research.

Conflicts of Interest

The authors declare no conflict of interest.

References

  1. Arnold, C.L.; Gibbons, C.J. Impervious Surface Coverage: The Emergence of a Key Environmental Indicator. J. Am. Plan. Assoc. 1996, 62, 243–258. [Google Scholar] [CrossRef]
  2. Weng, Q. Remote Sens. of impervious surfaces in the urban areas: Requirements, methods, and trends. Remote Sens. Environ. 2012, 117, 34–49. [Google Scholar] [CrossRef]
  3. Yang, J.; He, Y. Automated mapping of impervious surfaces in urban and suburban areas: Linear spectral unmixing of high spatial resolution imagery. Int. J. Appl. Earth Obs. Geoinf. 2017, 54, 53–64. [Google Scholar] [CrossRef]
  4. He, C.; Ma, Q.; Liu, Z.; Zhang, Q. Modeling the spatiotemporal dynamics of electric power consumption in Mainland China using saturation-corrected DMSP/OLS nighttime stable light data. Int. J. Digit. Earth 2013, 7, 993–1014. [Google Scholar] [CrossRef]
  5. Ma, Q.; He, C.; Wu, J.; Liu, Z.; Zhang, Q.; Sun, Z. Quantifying spatiotemporal patterns of urban impervious surfaces in China: An improved assessment using nighttime light data. Landsc. Urban Plan. 2014, 130, 36–49. [Google Scholar] [CrossRef]
  6. Lu, D.; Tian, H.; Zhou, G.; Ge, H. Regional mapping of human settlements in southeastern China with multisensor remotely sensed data. Remote Sens. Environ. 2008, 112, 3668–3679. [Google Scholar] [CrossRef]
  7. Zhang, Q.; Schaaf, C.; Seto, K.C. The Vegetation Adjusted NTL Urban Index: A new approach to reduce saturation and increase variation in nighttime luminosity. Remote Sens. Environ. 2013, 129, 32–41. [Google Scholar] [CrossRef]
  8. Milesi, C.; Elvidge, C.D.; Nemani, R.R.; Running, S.W. Assessing the impact of urban land development on net primary productivity in the southeastern United States. Remote Sens. Environ. 2003, 86, 401–410. [Google Scholar] [CrossRef]
  9. Deng, C.; Wu, C. A spatially adaptive spectral mixture analysis for mapping subpixel urban impervious surface distribution. Remote Sens. Environ. 2013, 133, 62–70. [Google Scholar] [CrossRef]
  10. Xu, J.; Zhao, Y.; Zhong, K.; Zhang, F.; Liu, X.; Sun, C. Measuring spatio-temporal dynamics of impervious surface in Guangzhou, China, from 1988 to 2015, using time-series Landsat imagery. Sci. Total Environ. 2018, 627, 264–281. [Google Scholar] [CrossRef]
  11. Zhang, L.; Weng, Q.; Shao, Z. An evaluation of monthly impervious surface dynamics by fusing Landsat and MODIS time series in the Pearl River Delta, China, from 2000 to 2015. Remote Sens. Environ. 2017, 201, 99–114. [Google Scholar] [CrossRef]
  12. Shuster, W.D.; Bonta, J.; Thurston, H.; Warnemuende, E.; Smith, D.R. Impacts of impervious surface on watershed hydrology: A review. Urban Water J. 2005, 2, 263–275. [Google Scholar] [CrossRef]
  13. Pappas, E.A.; Smith, D.R.; Huang, C.; Shuster, W.D.; Bonta, J.V. Impervious surface impacts to runoff and sediment discharge under laboratory rainfall simulation. Catena 2008, 72, 146–152. [Google Scholar] [CrossRef]
  14. Weng, Q. Modeling Urban Growth Effects on Surface Runoff with the Integration of Remote Sensing and GIS. Environ. Manag. 2014, 28, 737–748. [Google Scholar] [CrossRef]
  15. Brabec, E.; Schulte, S.; Richards, P.L. Impervious surfaces and water quality: A review of current literature and its implications for watershed planning. J. Plan. Lit. 2002, 16, 499–514. [Google Scholar] [CrossRef]
  16. Ebrahimian, A.; Wilson, B.N.; Gulliver, J.S. Improved methods to estimate the effective impervious area in urban catchments using rainfall-runoff data. J. Hydrol. 2016, 536, 109–118. [Google Scholar] [CrossRef]
  17. Jartun, M.; Ottesen, R.T.; Steinnes, E.; Volden, T. Runoff of particle bound pollutants from urban impervious surfaces studied by analysis of sediments from stormwater traps. Sci. Total Environ. 2008, 396, 147–163. [Google Scholar] [CrossRef] [PubMed]
  18. Goetz, S.; Fiske, G. Linking the diversity and abundance of stream biota to landscapes in the mid-Atlantic USA. Remote Sens. Environ. 2008, 112, 4075–4085. [Google Scholar] [CrossRef]
  19. Xian, G.; Homer, C. Updating the 2001 National Land Cover Database Impervious Surface Products to 2006 using Landsat Imagery Change Detection Methods. Remote Sens. Environ. 2010, 114, 1676–1686. [Google Scholar] [CrossRef]
  20. Yao, R.; Wang, L.; Gui, X.; Zheng, Y.; Zhang, H.; Huang, X. Urbanization Effects on Vegetation and Surface Urban Heat Islands in China’s Yangtze River Basin. Remote Sens. 2017, 9, 540. [Google Scholar] [CrossRef]
  21. Yuan, F.; Bauer, M.E. Comparison of impervious surface area and normalized difference vegetation index as indicators of surface urban heat island effects in Landsat imagery. Remote Sens. Environ. 2007, 106, 375–386. [Google Scholar] [CrossRef]
  22. Imhoff, M.L.; Zhang, P.; Wolfe, R.E.; Bounoua, L. Remote Sens. of the urban heat island effect across biomes in the continental USA. Remote Sens. Environ. 2010, 114, 504–513. [Google Scholar] [CrossRef]
  23. Pickett, S.T.; Cadenasso, M.L.; Grove, J.M.; Groffman, P.M.; Band, L.E.; Boone, C.G.; Burch, W.R.; Grimmond, C.S.; Hom, J.; Jenkins, J.C.; et al. Beyond urban legends: An emerging framework of urban ecology, as illustrated by the baltimore ecosystem study. Am. Inst. Biol. Biosci. 2008, 58, 139–150. [Google Scholar] [CrossRef]
  24. Zhou, Y.; Smith, S.J.; Elvidge, C.D.; Zhao, K.; Thomson, A.; Imhoff, M. A cluster-based method to map urban area from DMSP/OLS nightlights. Remote Sens. Environ. 2014, 147, 173–185. [Google Scholar] [CrossRef]
  25. Zhang, L.; Weng, Q. Annual dynamics of impervious surface in the Pearl River Delta, China, from 1988 to 2013, using time series Landsat imagery. ISPRS J. Photogramm. Remote Sens. 2016, 113, 86–96. [Google Scholar] [CrossRef]
  26. Guo, W.; Lu, D.; Wu, Y.; Zhang, J. Mapping Impervious Surface Distribution with Integration of SNNP VIIRS-DNB and MODIS NDVI Data. Remote Sens. 2015, 7, 12459–12477. [Google Scholar] [CrossRef] [Green Version]
  27. Wu, C. Quantifying high-resolution impervious surfaces using spectral mixture analysis. Int. J. Remote Sens. 2009, 30, 2915–2932. [Google Scholar] [CrossRef]
  28. Ridd, M.K. Exploring a V-I-S (vegetation-impervious surface-soil) model for urban ecosystem analysis through Remote Sensing: Comparative anatomy for cities. Int. J. Remote Sens. 1995, 16, 2165–2185. [Google Scholar] [CrossRef]
  29. Wu, C.; Murray, A.T. Estimating impervious surface distribution by spectral mixture analysis. Remote Sens. Environ. 2003, 84, 493–505. [Google Scholar] [CrossRef]
  30. Wu, C. Normalized spectral mixture analysis for monitoring urban composition using ETM+ imagery. Remote Sens. Environ. 2004, 93, 480–492. [Google Scholar] [CrossRef]
  31. Fan, F.; Fan, W.; Weng, Q. Improving urban impervious surface mapping by linear spectral mixture analysis and using spectral indexes. Can. J. Remote Sens. 2015, 41, 577–586. [Google Scholar] [CrossRef]
  32. Chen, F.; Wang, K.; Van de Voorde, T.; Tang, T.F. Mapping urban land cover from high spatial resolution hyperspectral data: An approach based on simultaneously unmixing similar pixels with jointly sparse spectral mixture analysis. Remote Sens. Environ. 2017, 196, 324–342. [Google Scholar] [CrossRef]
  33. Zhao, N.; Zhou, Y.; Samson, E.L. Correcting incompatible dn values and geometric errors in nighttime lights time-series images. IEEE Trans. Geosci. Remote Sens. 2015, 53, 2039–2049. [Google Scholar] [CrossRef]
  34. Pok, S.; Matsushita, B.; Fukushima, T. An easily implemented method to estimate impervious surface area on a large scale from MODIS time-series and improved DMSP-OLS nighttime light data. ISPRS J. Photogramm. Remote Sens. 2017, 133, 104–115. [Google Scholar] [CrossRef]
  35. Zhang, X.; Li, P. A temperature and vegetation adjusted NTL urban index for urban area mapping and analysis. ISPRS J. Photogramm. Remote Sens. 2018, 135, 93–111. [Google Scholar] [CrossRef]
  36. Shao, Z.; Liu, C. The Integrated Use of DMSP-OLS Nighttime Light and MODIS Data for Monitoring Large-Scale Impervious Surface Dynamics: A Case Study in the Yangtze River Delta. Remote Sens. 2014, 6, 9359–9378. [Google Scholar] [CrossRef] [Green Version]
  37. Xie, Y.; Weng, Q. Spatiotemporally enhancing time-series DMSP/OLS nighttime light imagery for assessing large-scale urban dynamics. ISPRS J. Photogramm. Remote Sens. 2017, 128, 1–15. [Google Scholar] [CrossRef]
  38. Xie, Y.; Weng, Q. Detecting urban-scale dynamics of electricity consumption at Chinese cities using time-series DMSP-OLS (Defense Meteorological Satellite Program-Operational Linescan System) nighttime light imageries. Energy 2016, 100, 177–189. [Google Scholar] [CrossRef]
  39. Chen, J.; Jönsson, P.; Tamura, M.; Gu, Z.; Matsushita, B.; Eklundh, L. A simple method for reconstructing a high-quality NDVI time-series data set based on the Savitzky–Golay filter. Remote Sens. Environ. 2004, 91, 332–344. [Google Scholar] [CrossRef]
  40. Schneider, A.; Friedl, M.A.; Potere, D. Mapping global urban areas using MODIS 500-m data: New methods and datasets based on ‘urban ecoregions’. Remote Sens. Environ. 2010, 114, 1733–1746. [Google Scholar] [CrossRef]
  41. Schneider, A. Monitoring land cover change in urban and peri-urban areas using dense time stacks of Landsat satellite data and a data mining approach. Remote Sens. Environ. 2012, 124, 689–704. [Google Scholar] [CrossRef]
  42. Elvidge, C.D.; Tuttle, B.T.; Sutton, P.S.; Baugh, K.E.; Ara, T. Howard; Milesi, C.; Bhaduri, B.L.; Nemani, R. Global distribution and density of constructed impervious surfaces. Sensors 2007, 7, 1962–1979. [Google Scholar] [CrossRef] [PubMed]
  43. Zhuo, L.; Zheng, J.; Zhang, X.; Li, J.; Liu, L. An improved method of night-time light saturation reduction based on EVI. Int. J. Remote Sens. 2015, 36, 4114–4130. [Google Scholar] [CrossRef]
  44. Bai, X.; Chen, J.; Shi, P. Landscape urbanization and economic growth in China: Positive feedbacks and sustainability dilemmas. Environ. Sci. Technol. 2012, 46, 132–139. [Google Scholar] [CrossRef] [PubMed]
  45. Tan, M.; Li, X.; Xie, H.; Lu, C. Urban land expansion and arable land loss in China—a case study of Beijing–Tianjin–Hebei region. Land Use Policy 2005, 22, 187–196. [Google Scholar] [CrossRef]
  46. Xu, J.; Zhao, Y.; Zhong, K.; Ruan, H.; Liu, X. Coupling Modified Linear Spectral Mixture Analysis and Soil Conservation Service Curve Number (SCS-CN) Models to Simulate Surface Runoff: Application to the Main Urban Area of Guangzhou, China. Water 2016, 8, 550. [Google Scholar] [CrossRef]
  47. Zhou, T.; Pan, J.; Zhang, P.; Wei, S.; Han, T. Mapping Winter Wheat with Multi-Temporal SAR and Optical Images in an Urban Agricultural Region. Sensors 2017, 17, 1210. [Google Scholar] [CrossRef]
  48. Yuan, W.; Liu, S.; Yu, G.; Bonnefond, J.-M.; Chen, J.; Davis, K.; Desai, A.R.; Goldstein, A.H.; Gianelle, D.; Rossi, F.; et al. Global estimates of evapotranspiration and gross primary production based on MODIS and global meteorology data. Remote Sens. Environ. 2010, 114, 1416–1431. [Google Scholar] [CrossRef] [Green Version]
  49. Pan, Y.; Li, L.; Zhang, J.; Liang, S.; Zhu, X.; Sulla-Menashe, D. Winter wheat area estimation from MODIS-EVI time series data using the Crop Proportion Phenology Index. Remote Sens. Environ. 2012, 119, 232–242. [Google Scholar] [CrossRef]
  50. Wu, J. Urban sustainability: An inevitable goal of landscape research. Landsc. Ecol. 2010, 25, 1–4. [Google Scholar] [CrossRef]
  51. Wang, S.; Li, Q.; Fang, C.; Zhou, C. The relationship between economic growth, energy consumption, and CO2 emissions: Empirical evidence from China. Sci. Total Environ. 2016, 542 Pt A, 360–371. [Google Scholar] [CrossRef]
  52. Wu, J.; Xiang, W.N.; Zhao, J. Urban ecology in China: Historical developments and future directions. Landsc. Urban Plan. 2014, 125, 222–233. [Google Scholar] [CrossRef]
  53. Weng, Q.; Lu, D. A sub-pixel analysis of urbanization effect on land surface temperature and its interplay with impervious surface and vegetation coverage in Indianapolis, United States. Int. J. Appl. Earth Obs. Geoinf. 2008, 10, 68–83. [Google Scholar] [CrossRef]
Figure 1. China—the location of the study area and its provincial divisions: Northeast China (NEC), Northern Coastal China (NCC), Eastern Coastal China (ECC), Southern Coastal China (SCC), the Middle Reaches of the Yellow River (MRYLR), the Middle Reaches of the Yangtze River (MRYTR), Southwest China (SWC), and Northwest China (NWC).
Ijgi 08 00031 g001
Figure 2. The steps of the spatiotemporal patterns of urban imperious surfaces (IS).
Ijgi 08 00031 g002
Figure 3. Comparative analysis of the extraction results of the three indexes and the Landsat-8 image baseline data in eight representative cities (Beijing, Shanghai, Guangdong, Nanjing, Wuhan, Xian, Lanzhou, and Urumqi.). Urban impervious surface and distribution map extracted using (a) Human Settlements Index (HIS), (b) Vegetation-Adjusted NTL Urban Index (VANUI), and (c) the EVI-adjusted NTL index (EANTLI) index; (d) 7-, 6-, and 4-band combinations of Landsat-8 images for city and building identification.
Ijgi 08 00031 g003
Figure 4. Urban impervious area distribution map in 2013.
Ijgi 08 00031 g004
Figure 5. The change in (a) urban impervious surface percent (UISP) and (b) gross domestic product (GDP) from 2003 to 2013.
Ijgi 08 00031 g005
Figure 6. Urban impervious rate in (a) 2003, (b) 2008, and (c) 2013 in the eight regions.
Ijgi 08 00031 g006
Figure 7. The variety of urban impervious rate (year-on-year growth rate) from (a) 2003 to 2008, (b) 2008 to 2013 and (c) 2003 to 2013 in the eight regions.
Ijgi 08 00031 g007
Figure 8. Provincial city impervious area growth rate change chart from 2003 to 2013.
Ijgi 08 00031 g008
Table 1. Main types and characteristics of data used in this study.
Type of DataData Position and TimeData Characterization
DMSP-OLS
(Version 4)
2003, 2008, and 2013.Stable light annual image composites product spatial resolution: 1 km.
MODIS-(NDVI\EVI)
(MOD13A2)
Data of whole China.
Annual data from 2003, 2008, and 2013 (h21v03, h22v03–h22v04, h23v03–h23v05, h24v03–h21v06, h25v03–h21v06, h26v03–h21v06, h27v04–h21v06, h28v04–h21v07, h29v05–h21v06, h30v06).
The total number of scenes: 644 × 3.
MODIS 16-day-composited Normalized Difference Vegetation Index (NDVI) and enhanced vegetation index (EVI) series data level-3 products.
Annual data from different periods within one year (23 cycle of one year, 28 views of one cycle, 3 years).
Spatial resolution: 1 km.
Landsat 8-OLI
Multispectral data
Center path/row:Data timeSix 30 m resolution multispectral bands and one 15 m resolution panchromatic band.


Two 100 m resolution infrared bands were not used, due to their low resolution.
For the cloud-influenced clipped images, the errors due to the influence of clouds in the extraction result were removed.
The result was resampled to 1 km.
116/40:4 November 2013
122/32:17 November 2013
113/23:29 November 2013
114/30:3 June 2013
103/36:23 July 2013
87/45:28 August 2013
109/35:13 September 2013
118/32:11 August 2013
MOD44WGlobal land water mask.
Data from 2003, 2008, and 2013
Global land water mask was used to eliminate the effects of water on the classification results.
Spatial resolution: 250 m.
The result was resampled to 1 km.
Google earth imageData from Google Earth in 2013Some data for eight regions including Beijing, Shanghai, Guangzhou, Nanjing, Wuhan, Xi’an, Urumqi, and Lanzhou.
The result was resampled to 5 m.
Table 2. Evaluation of classification accuracy of three index extraction results in 2013.
IndexCategoryPrecision Verification
Urban Impervious SurfaceNon-Urban Impervious SurfaceWaterOverall Accuracy (%)Kappa
(pixels)(pixels)(pixels)
EANTLI48048014095.410.91
VANUI48048014092.130.87
HIS48048014088.750.78

