Letter

Spatiotemporal Patterns of COVID-19 Impact on Human Activities and Environment in Mainland China Using Nighttime Light and Air Quality Data

1
NSF Spatiotemporal Innovation Center, George Mason Univ., Fairfax, VA 22030, USA
2
Department of Geography and Geoinformation Science, George Mason Univ., Fairfax, VA 22030, USA
3
College of Land Science and Technology, China Agricultural University, Beijing 100083, China
4
School of Business Management, East China Normal University, 3663 Zhongshanbei Road, Shanghai 200062, China
5
School of Mathematical Sciences, East China Normal University, 3663 Zhongshanbei Road, Shanghai 200062, China
6
Department of Geographical Sciences, University of Maryland, College Park, MD 20742, USA
7
School of Geographical Sciences, Nanjing University of Information Science Technology, 219 Ningliu Road, Nanjing 210044, China
8
Center for Geographic Analysis, Harvard University, Cambridge, MA 02138, USA
*
Author to whom correspondence should be addressed.
Remote Sens. 2020, 12(10), 1576; https://doi.org/10.3390/rs12101576
Submission received: 27 April 2020 / Revised: 10 May 2020 / Accepted: 13 May 2020 / Published: 15 May 2020
(This article belongs to the Section Remote Sensing Communications)

Abstract

:
The sudden outbreak of the COVID-19 pandemic has brought drastic changes to people’s daily lives, work, and the surrounding environment. Investigations into these changes are very important for decision makers to implement policies on economic loss assessments and stimulation packages, city reopening, resilience of the environment, and arrangement of medical resources. In order to analyze the impact of COVID-19 on people’s lives, activities, and the natural environment, this paper investigates the spatial and temporal characteristics of Nighttime Light (NTL) radiance and Air Quality Index (AQI) before and during the pandemic in mainland China. The monthly mean NTL radiance, and daily and monthly mean AQI are calculated over mainland China and compared before and during the pandemic. Our results show that the monthly average NTL brightness is much lower during the quarantine period than before. This study categorizes NTL into three classes: residential area, transportation, and public facilities and commercial centers, with NTL radiance ranges of 5–20, 20–40 and greater than 40 (nW· cm 2 · sr 1 ), respectively. We found that the Number of Pixels (NOP) with NTL detection increased in the residential area and decreased in the commercial centers for most of the provinces after the shutdown, while transportation and public facilities generally stayed the same. More specifically, we examined these factors in Wuhan, where the first confirmed cases were reported, and where the earliest quarantine measures were taken. Observations and analysis of pixels associated with commercial centers were observed to have lower NTL radiance values, indicating a dimming behavior, while residential area pixels recorded increased levels of brightness after the beginning of the lockdown. The study also discovered a significant decreasing trend in the daily average AQI for mainland China from January to March 2020, with cleaner air in most provinces during February and March, compared to January 2020. In conclusion, the outbreak and spread of COVID-19 has had a crucial impact on people’s daily lives and activity ranges through the increased implementation of lockdown and quarantine policies. On the other hand, the air quality of mainland China has improved with the reduction in non-essential industries and motor vehicle usage. This evidence demonstrates that the Chinese government has executed very stringent quarantine policies to deal with the pandemic. The decisive response to control the spread of COVID-19 provides a reference for other parts of the world.

Graphical Abstract

1. Introduction

China, the largest developing country in the world, has been using fossil fuels as their major energy supply for many years. This results in China being one of the most polluted places in the world. At the same time, along with the unprecedented development of the economy in the past decades, large scale urbanization has introduced a rich leisure life and wide utilization of artificial light, especially at night. At the end of 2019, the sudden outbreak of the coronavirus disease (COVID-19) in Wuhan City, China, required mitigation and containment measures that brought the most populous country and second-largest economy in the world to a halt [1]. Coincidently with the Chinese spring festival migration, cases quickly spread across the whole country. Despite China’s effective efforts to contain the outbreak since late January, within about three months COVID-19 has been found in 185 countries and had taken more than 162,000 lives. Worldwide, more than two million cases have been confirmed by the second half of April 2020, and the number is still growing rapidly. Wuhan City was locked down on 23 January 2020, as soon as the outbreak and contagious nature of the novel coronavirus was confirmed. In ten days, most of the provinces in mainland China implemented strict policies to limit non-essential activities, transportation, and production. Hundreds of millions of people volunteered to stay at home and practice self-isolation. Consequently, drastic changes suddenly took place in everyone’s lives, influencing their work and living environments.
Currently, with the recent reopening of Wuhan, the spread of COVID-19 was considered to have been initially controlled in China. However, the pandemic situation is still severe and grim in the other parts of the world; there are more than 700,000 confirmed cases in the U.S., as of 18 April 2020. A detailed analysis of the impact that COVID-19 has had on people’s lives, activities, and the environment, as well as the citizens’ response to the policies, enacted that to control the disease in China is urgent and significantly important for the reference of other countries. Studies and analytics have been conducted to estimate, assess, and predict the spread of this pandemic using temperature [2,3], humidity [4,5], air quality [6], geometry [7], and migration data [8], and how the control measures impact the outbreak [9]. However, very few published articles in the scientific literature illustrate the impact of virus mitigation and containment measures on the environment and people’s daily lives. Our study aims to fill this gap because understanding the impact of COVID-19 is important for decision making in regards to post-pandemic reopening strategies, economic loss assessments, and environment regulations.
Remote sensing data and technologies are widely used in the study of natural disasters and the spread of epidemics [10,11,12,13]. Nighttime Light (NTL) images have the capability to not only tell people where the facilities are but also depict when and how they are used. Therefore, the citizens’ reaction to the lockdown and quarantine policies can be reflected and monitored. NASA has released some comparisons between the NTL imagery before and during the lockdown of Wuhan [14] and has demonstrated that some districts and highways are visually dimming, attributed to the COVID-19 shutdown. However, there are no quantitative statistics regarding exactly which areas are less bright. Some questions remain to be answered, such as: Are all the parts of the city getting dimmer? Are the conditions similar in other provinces? Could some areas stay the same or even get brighter at night? Answers to these questions are crucial in understanding the changes in policy-driven patterns caused by the pandemic, which in turn is important for analyzing the influence of COVID-19 and decision making on the response methods. To answer these questions, this study first calculates and compares the monthly average NTL radiance values before and during the pandemic for each province, then categorizes them into three classes: (1) residential areas, (2) transportation facilities and urban infrastructures, and (3) commercial centers, and finally analyzes the change of Number of Pixels (NOP) in each category. Spatiotemporal analytics on average NTL is also conducted to achieve a better comprehension of the impact. Through these categorizations and investigations, the influence of COVID-19 on human activities can be efficiently depicted.
Air quality is believed to have a robust interaction with COVID-19. It was reported to influence the mortality outcome of COVID-19 [15], researchers found that an increase of only 1 μg/ m 3 in PM 2.5 is associated with a 15% increase in the death rate. [5] studied the association between meteorological factors and COVID-19 transmission and illustrated that bad air quality with strong wind will accelerate the spread of the virus. On the other hand, the pandemic situation also impacts air quality indirectly. Both NASA and the European Space Agency (ESA) have observed plummets in airborne Nitrogen Dioxide ( NO 2 ) over China using modified Copernicus Sentinel 5P data [16,17]. Moreover, [18] illustrated that the outbreak of COVID-19 has forced China to enact lockdown procedures, suppressing its industrial activities and, hence, dropped its NO 2 and carbon emissions by 30% and 25%, respectively. All of these discoveries focused on the change of one or two pollutants induced by COVID-19, but the total air quality cannot be determined without the consideration of other air pollutants, such as Sulfur Dioxide ( SO 2 ), Carbon Monoxide (CO), Ozone, and Particulate Matters (PMs). Our study investigates the ground-based Air Quality Index (AQI), which has been derived from the concentration of five major air pollutants before and during the COVID-19 crisis for every province in mainland China and offers a better vision of the COVID-19 impact on the overall air quality.
Our study is one of the first to analyze the pattern of human behaviors and air environment induced by the COVID-19 crisis. The changes in overall NTL radiance and categorial differences indicate the change of human working and consumption habits during the pandemic. The analytics in air quality can be utilized in similar studies of other environmental issues during COVID-19, and the decreasing trend in the air pollution index is a crucial basis and evidence for environmental governance [19]. These results offer suggestions and a basis for decision-makers and citizens to assess economic losses, arrange medical resources, adjust budget plans, and adapt to the new lifestyle caused by the crisis [20].

2. Materials and Methods

2.1. Dataset

The daily NTL data used in the study were the VNP46A1 product derived from the Visible Infrared Imaging Radiometer Suite (VIIRS) sensor Day Night Band (DNB) onboard the Suomi National Polar-orbiting Partnership (NPP) Satellite and archived at NASA’s LAADS DAAC data center (https://ladsweb.modaps.eosdis.nasa.gov/), with a study period from 1 December 2019 to 26 March 2020. Additional experiments were done during the same period in the former year, from 1 December 2018 to 31 March 2019, as a control group of data set to exclude the influence of seasonal impact. These data were corrected for clouds, atmospheric conditions, terrain, vegetation, snow, lunar illumination, and stray light effects, using the Black Marble algorithm [21] and gridded to 500 m globally. The VIIRS/DNB has substantial improvements in sensor resolution and calibration to guarantee fewer over-glow and saturation effects when compared to the previous era of Defense Meteorological Satellite Program/Operational Linescan System’s (DMSP/OLS) nighttime lights image products. The VIIRS/DNB has a spectral range of 500–900 nm that is highly sensitive to very low levels of visible light and can significantly improve the ability to detect anthropogenic lighting from buildings, roads, and other city infrastructures at night without moonlight influence [22]. The cloud masks associated with NTL imagery were performed using the VIIRS thermal band (band M15) with a spectral range of 10.26–11.26 µm [23]. Although there are NTL data with higher spatial resolutions such as Luojia1-01, they are not fully accessible for international users.
The AQI was collected from the China National Environmental Monitoring Center (CNEMC) (http://www.cnemc.cn/) during the period from 1 January 2020 to 28 March 2020. These data were calculated from the concentration of air pollutants such as PM 2.5 , PM 10 , Ozone ( O 3 ), Nitrogen Dioxide ( NO 2 ), Sulfur Dioxide ( SO 2 ) and Carbon Monoxide (CO) [24] and used to measure the severity of the air pollution.

2.2. Data Preprocessing

2.2.1. NPP/VIIRS NTL Data

VIIRS NTL data were preprocessed as follows:
1. All the granules of DNB images covering mainland China were merged with longitude, latitude and cloud mask information;
2. Clouds impacted the NTL by reducing the intensity of the lights and blurring the spatial detail of the light features [25]; as a result, the “confidentially” and “probably” cloudy pixels were marked as invalid according to the cloud mask;
3. Monthly nighttime radiance maps were obtained by averaging cloud-free pixels’ brightness of each grid in every month during the study periods, which were December of 2019 and January, February, and March of 2020;
4. The NTL maps derived from step 3 were rectified with the Chinese provincial using a base map;
5. The statistical parameters, such as monthly average radiance and the NOP of each NTL category were calculated for every province and the whole country. Our study focused on the human activities and artificial lights that mainly exist in residential, urban, and built-up areas. The pixels with radiance values lower than 5 nW· c m 2 · sr 1 were excluded, which is the spectral range for vegetation, water, snow, and rural areas [26].

2.2.2. AQI Data

The preparation of AQI data includes the following steps:
1. Rectify meteorological stations with the provincial base map;
2. Calculation of the daily and monthly average AQI for each station from the original hourly data;
3. Calculation of the mean value of all the stations in each province and the whole country.

2.3. NTL Radiance Categorization
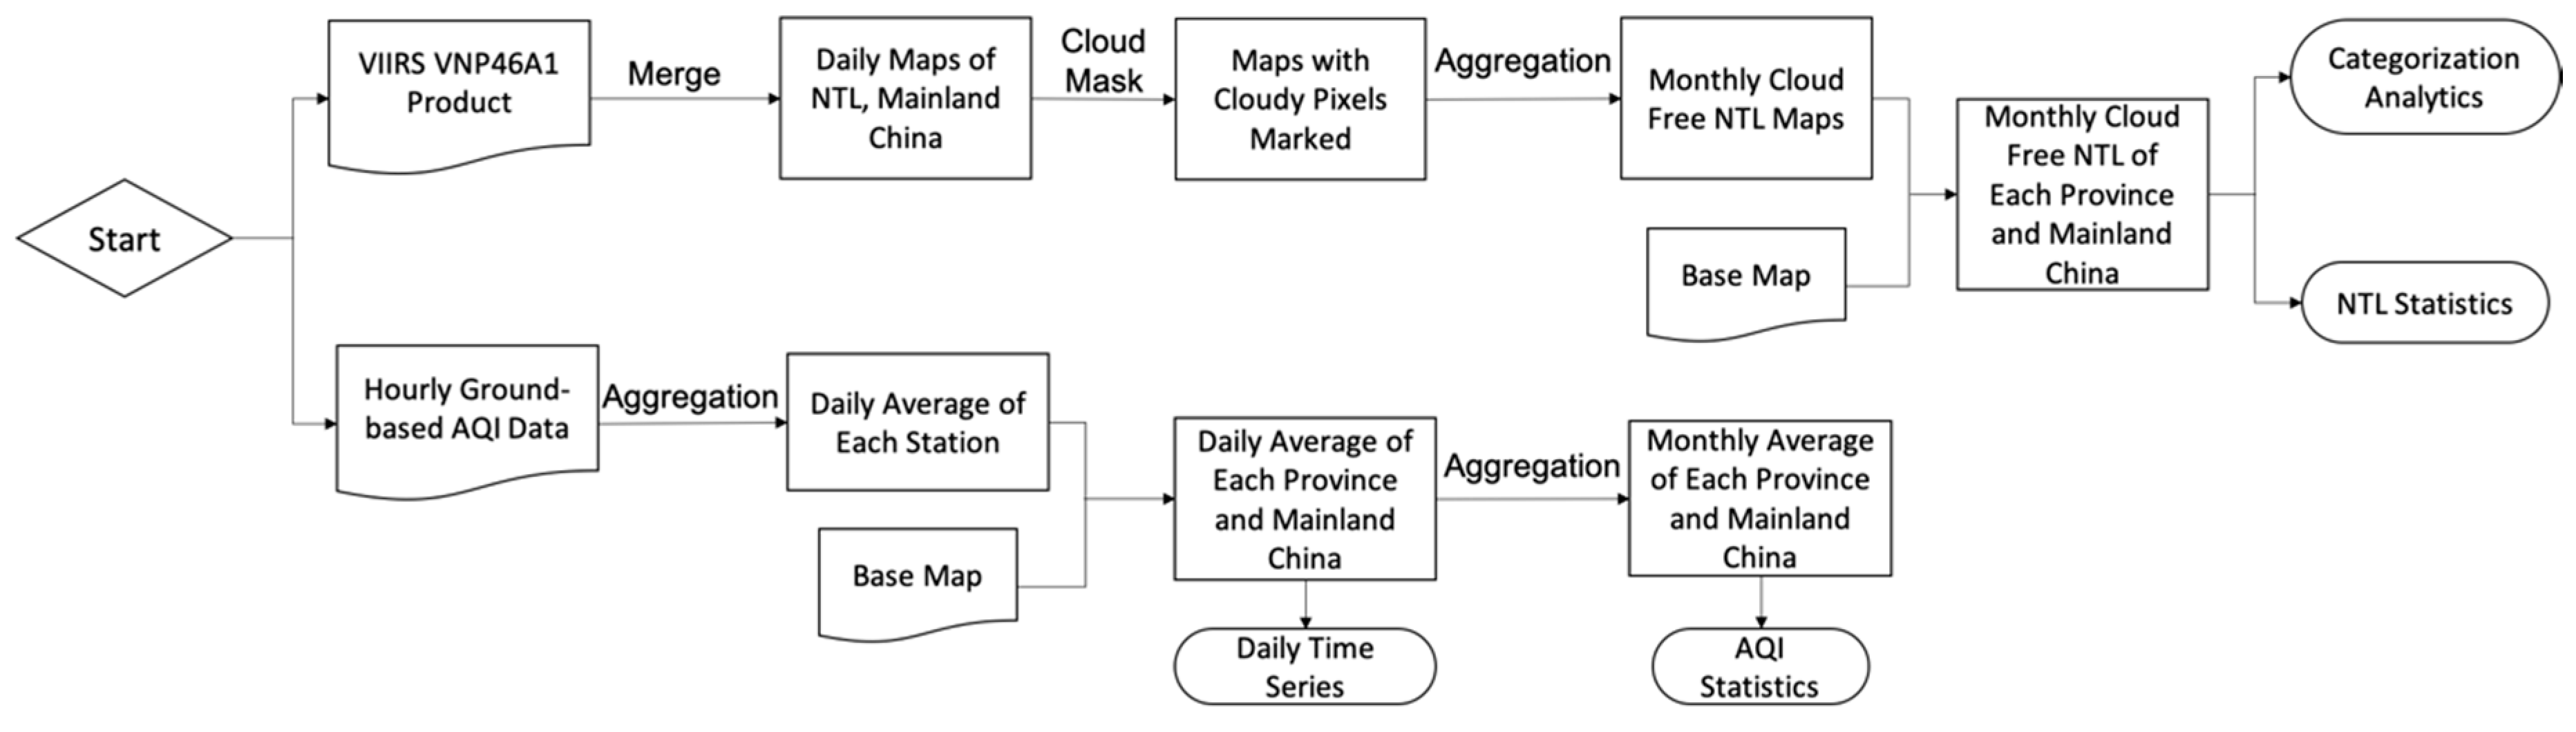
COVID-19 crisis mitigation and containment require people to reduce their outdoor activities, crowding, and traveling. In order to analyze these changes on human activities, this paper categorizes the NTL radiances into three classes according to the brightness values, effectively reflecting the different anthropogenic functional zones, including residential areas, transportation and public facilities, and commercial centers. Previous research adopted NTL radiance thresholds to identify these regions [27,28,29,30,31]. [26] investigated the pixel-level relationship between the VIIRS DNB-derived NTL, Landsat-derived land-use/land-cover, and a map of Point of Interest (POI) density over China, especially the artificial surfaces in urban land. According to their results, 5–20, 20–40, and greater than 40 (nW· cm 2 · sr 1 ) are appropriate radiance ranges for residential areas, transportation and public facilities, and commercial centers, respectively.

2.4. Workflow

Figure 1 shows the workflow of the entire analytical process which is described in Section 2.2 and Section 2.3.

3. Results

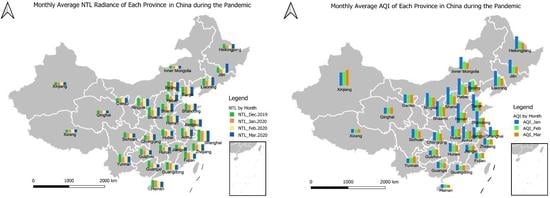
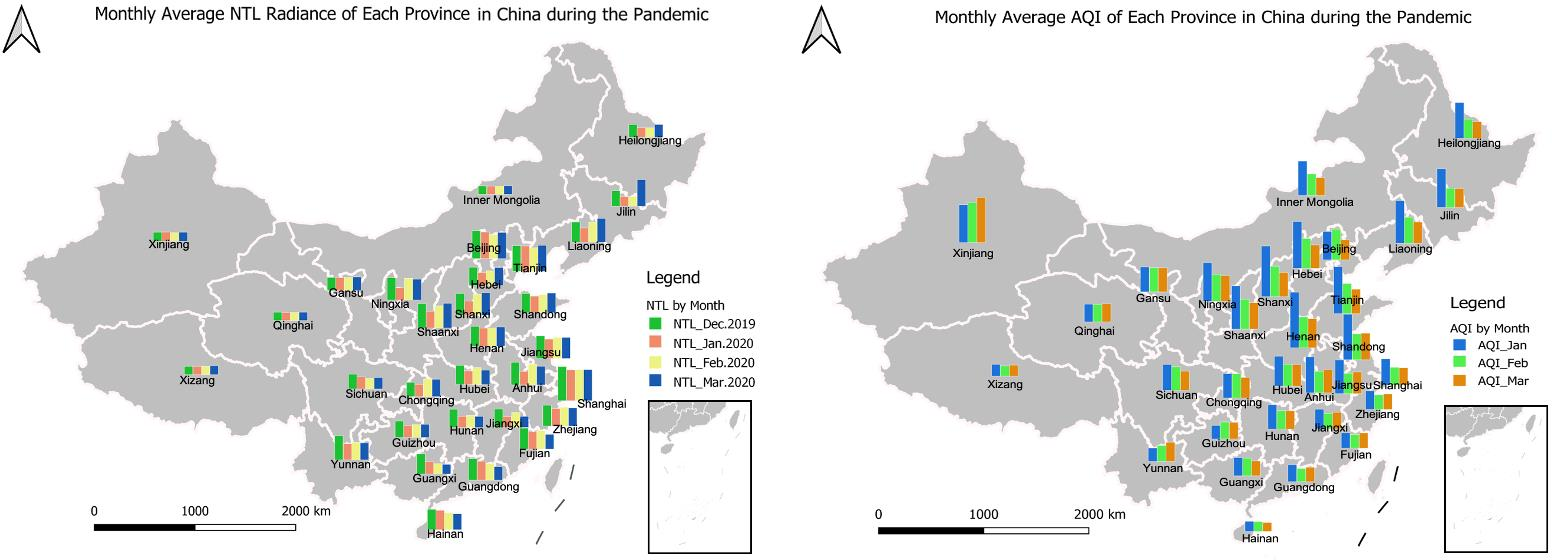
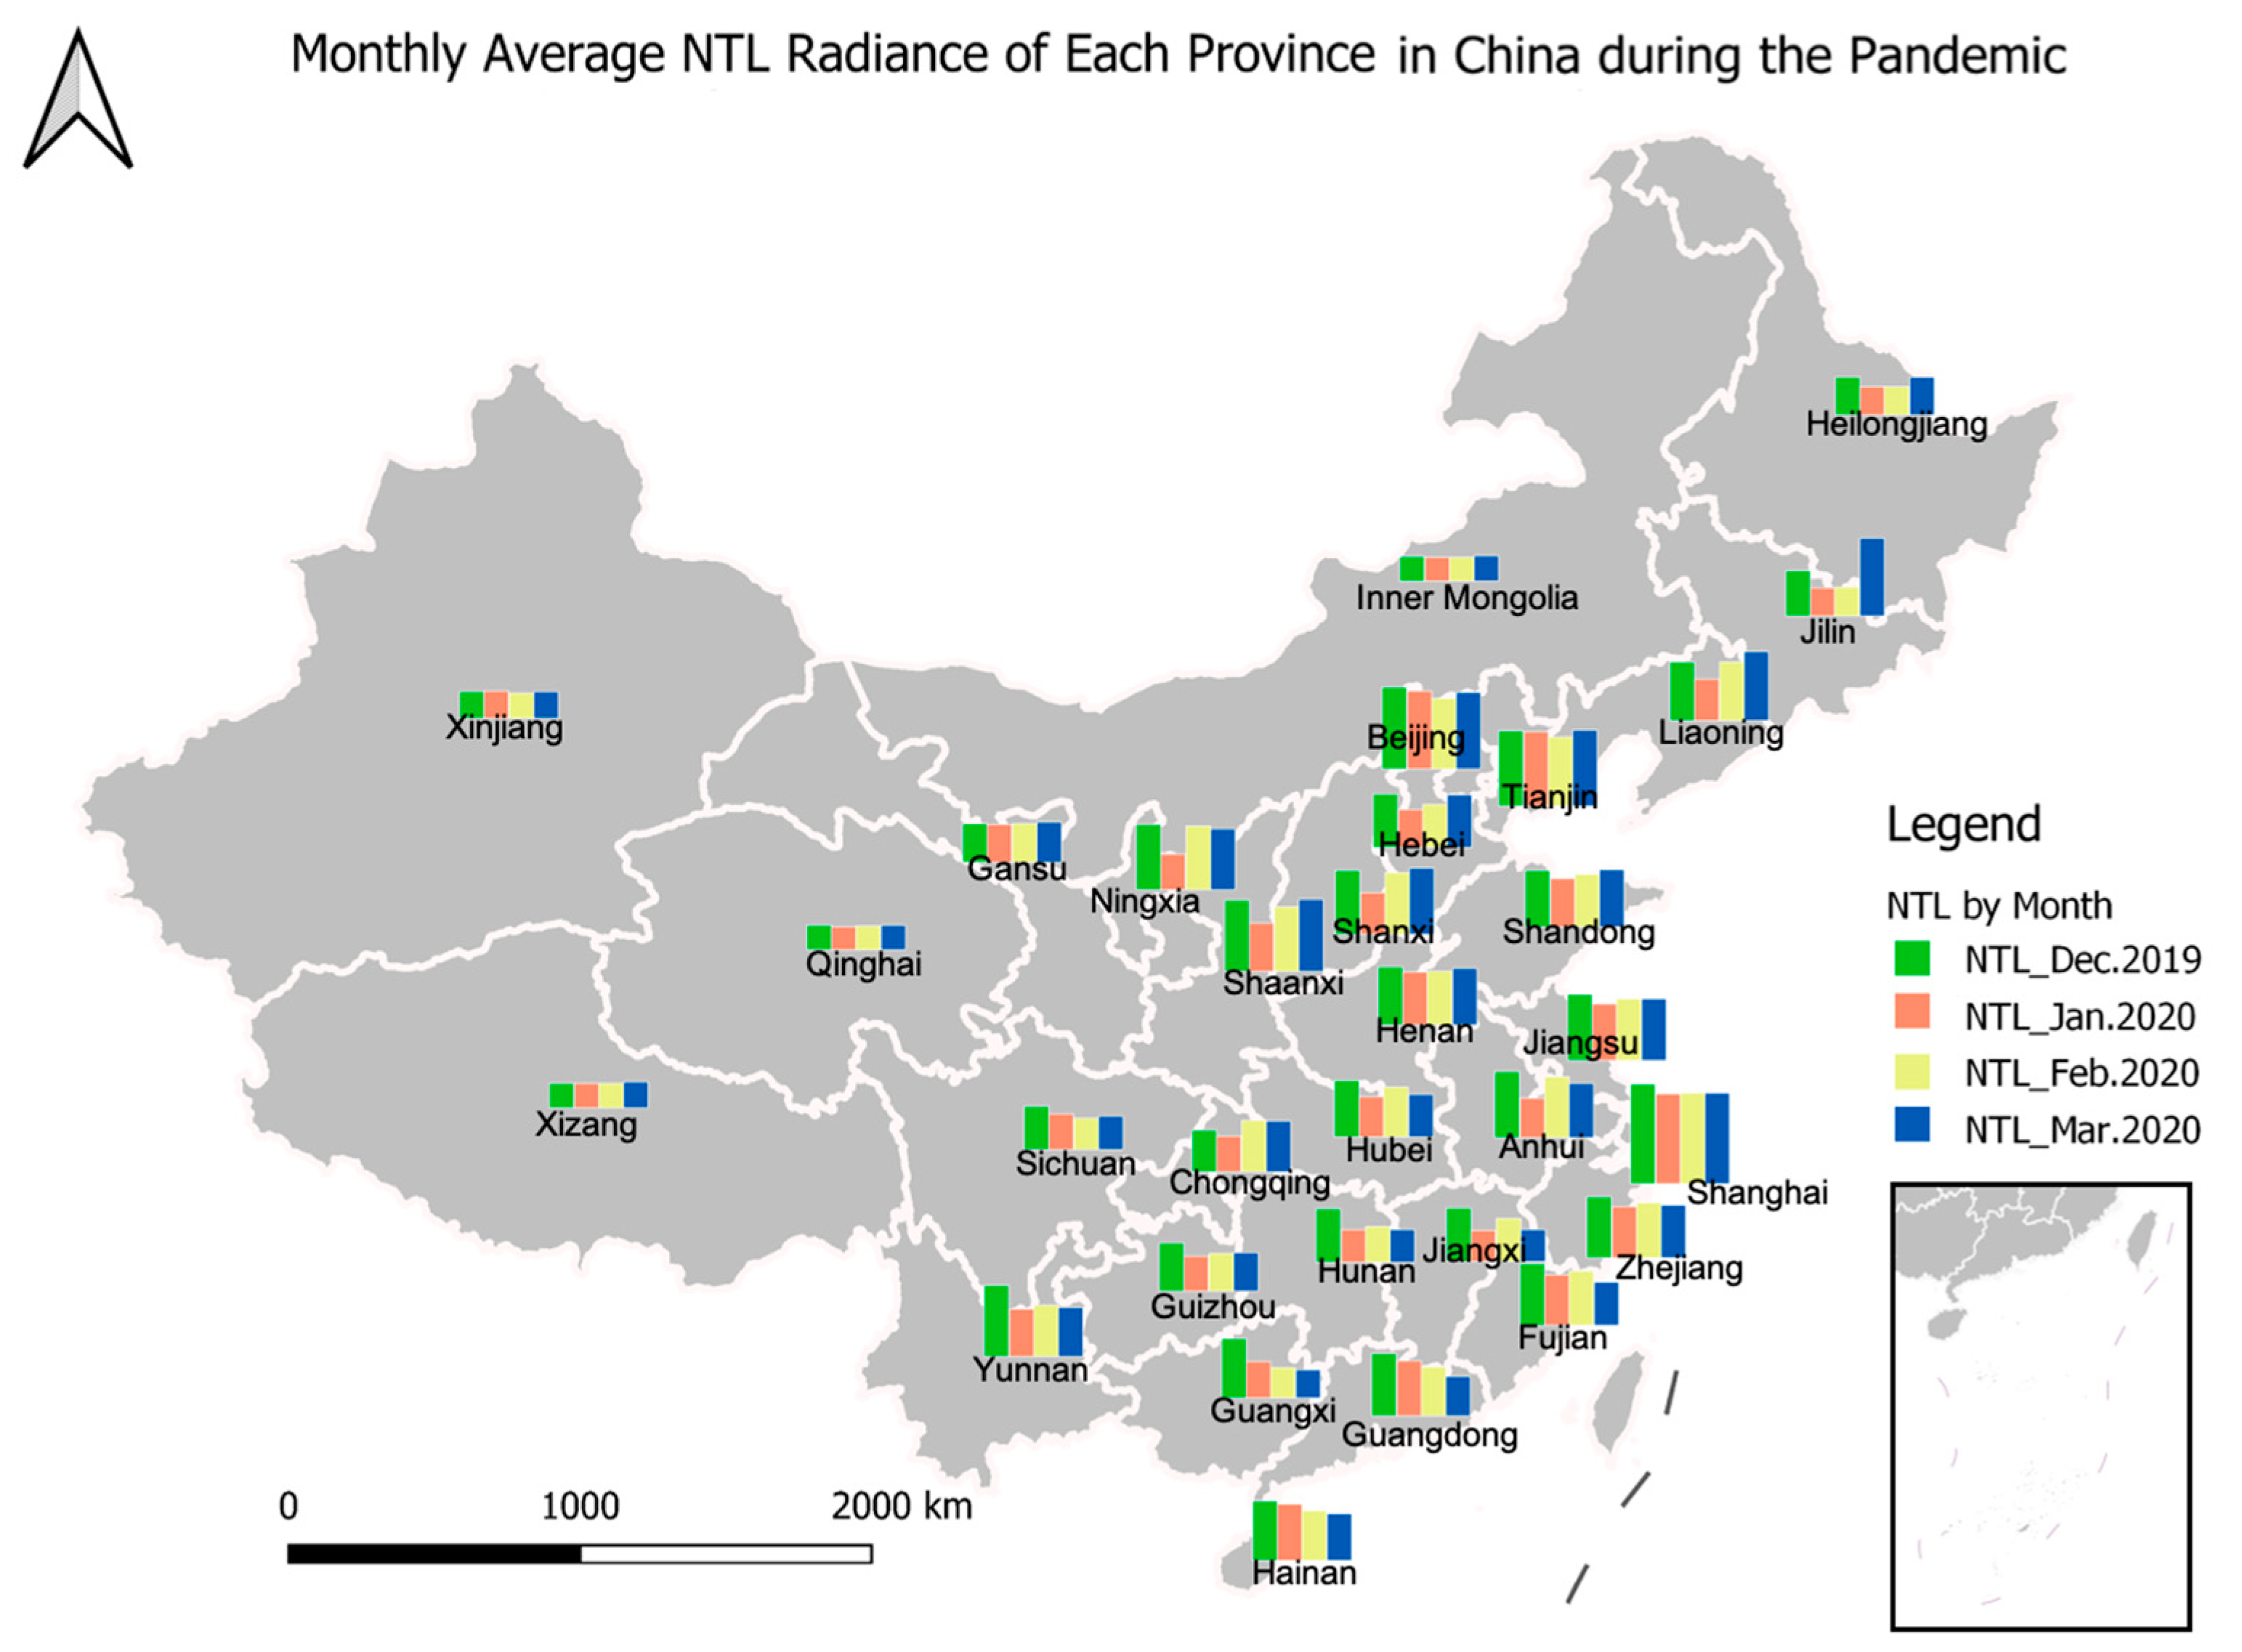
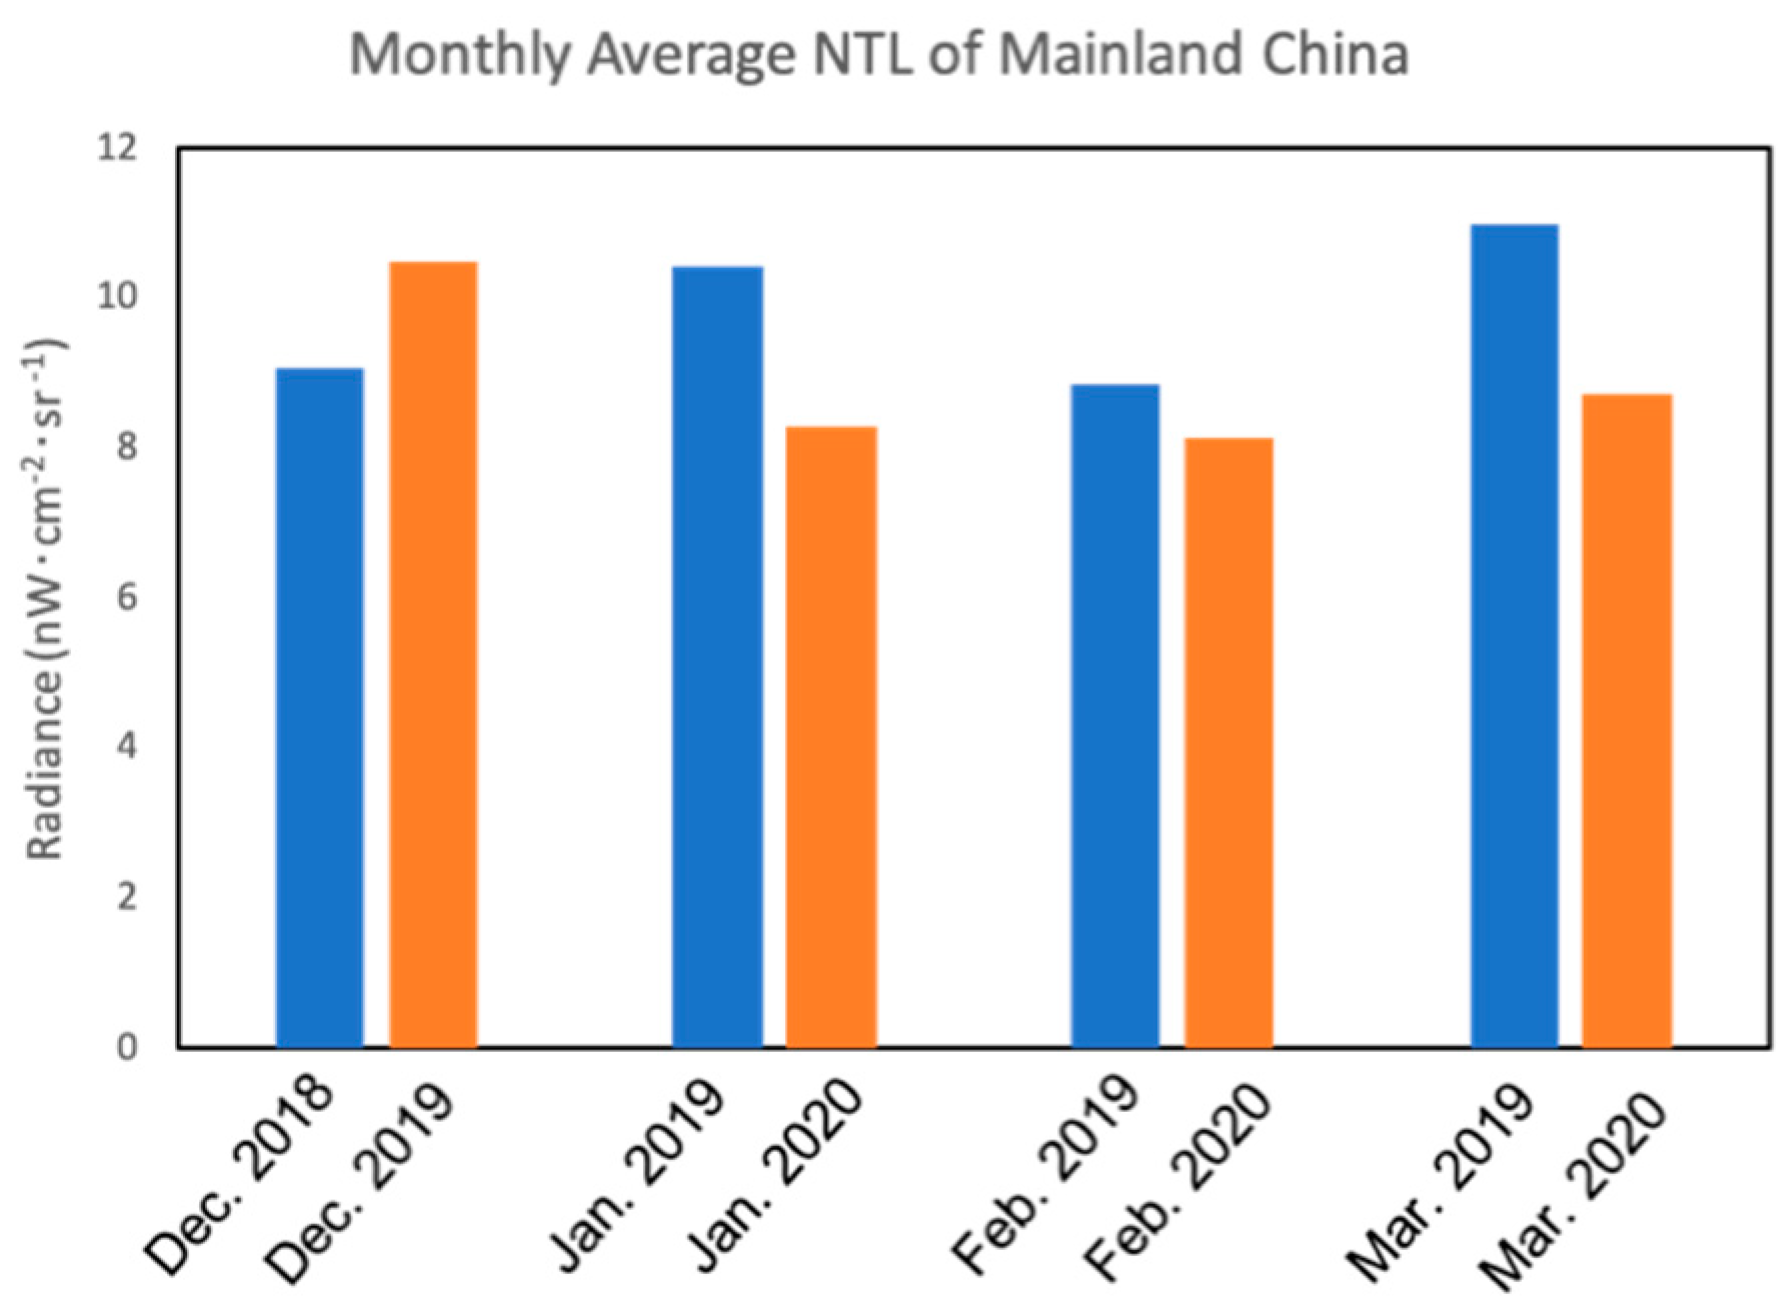
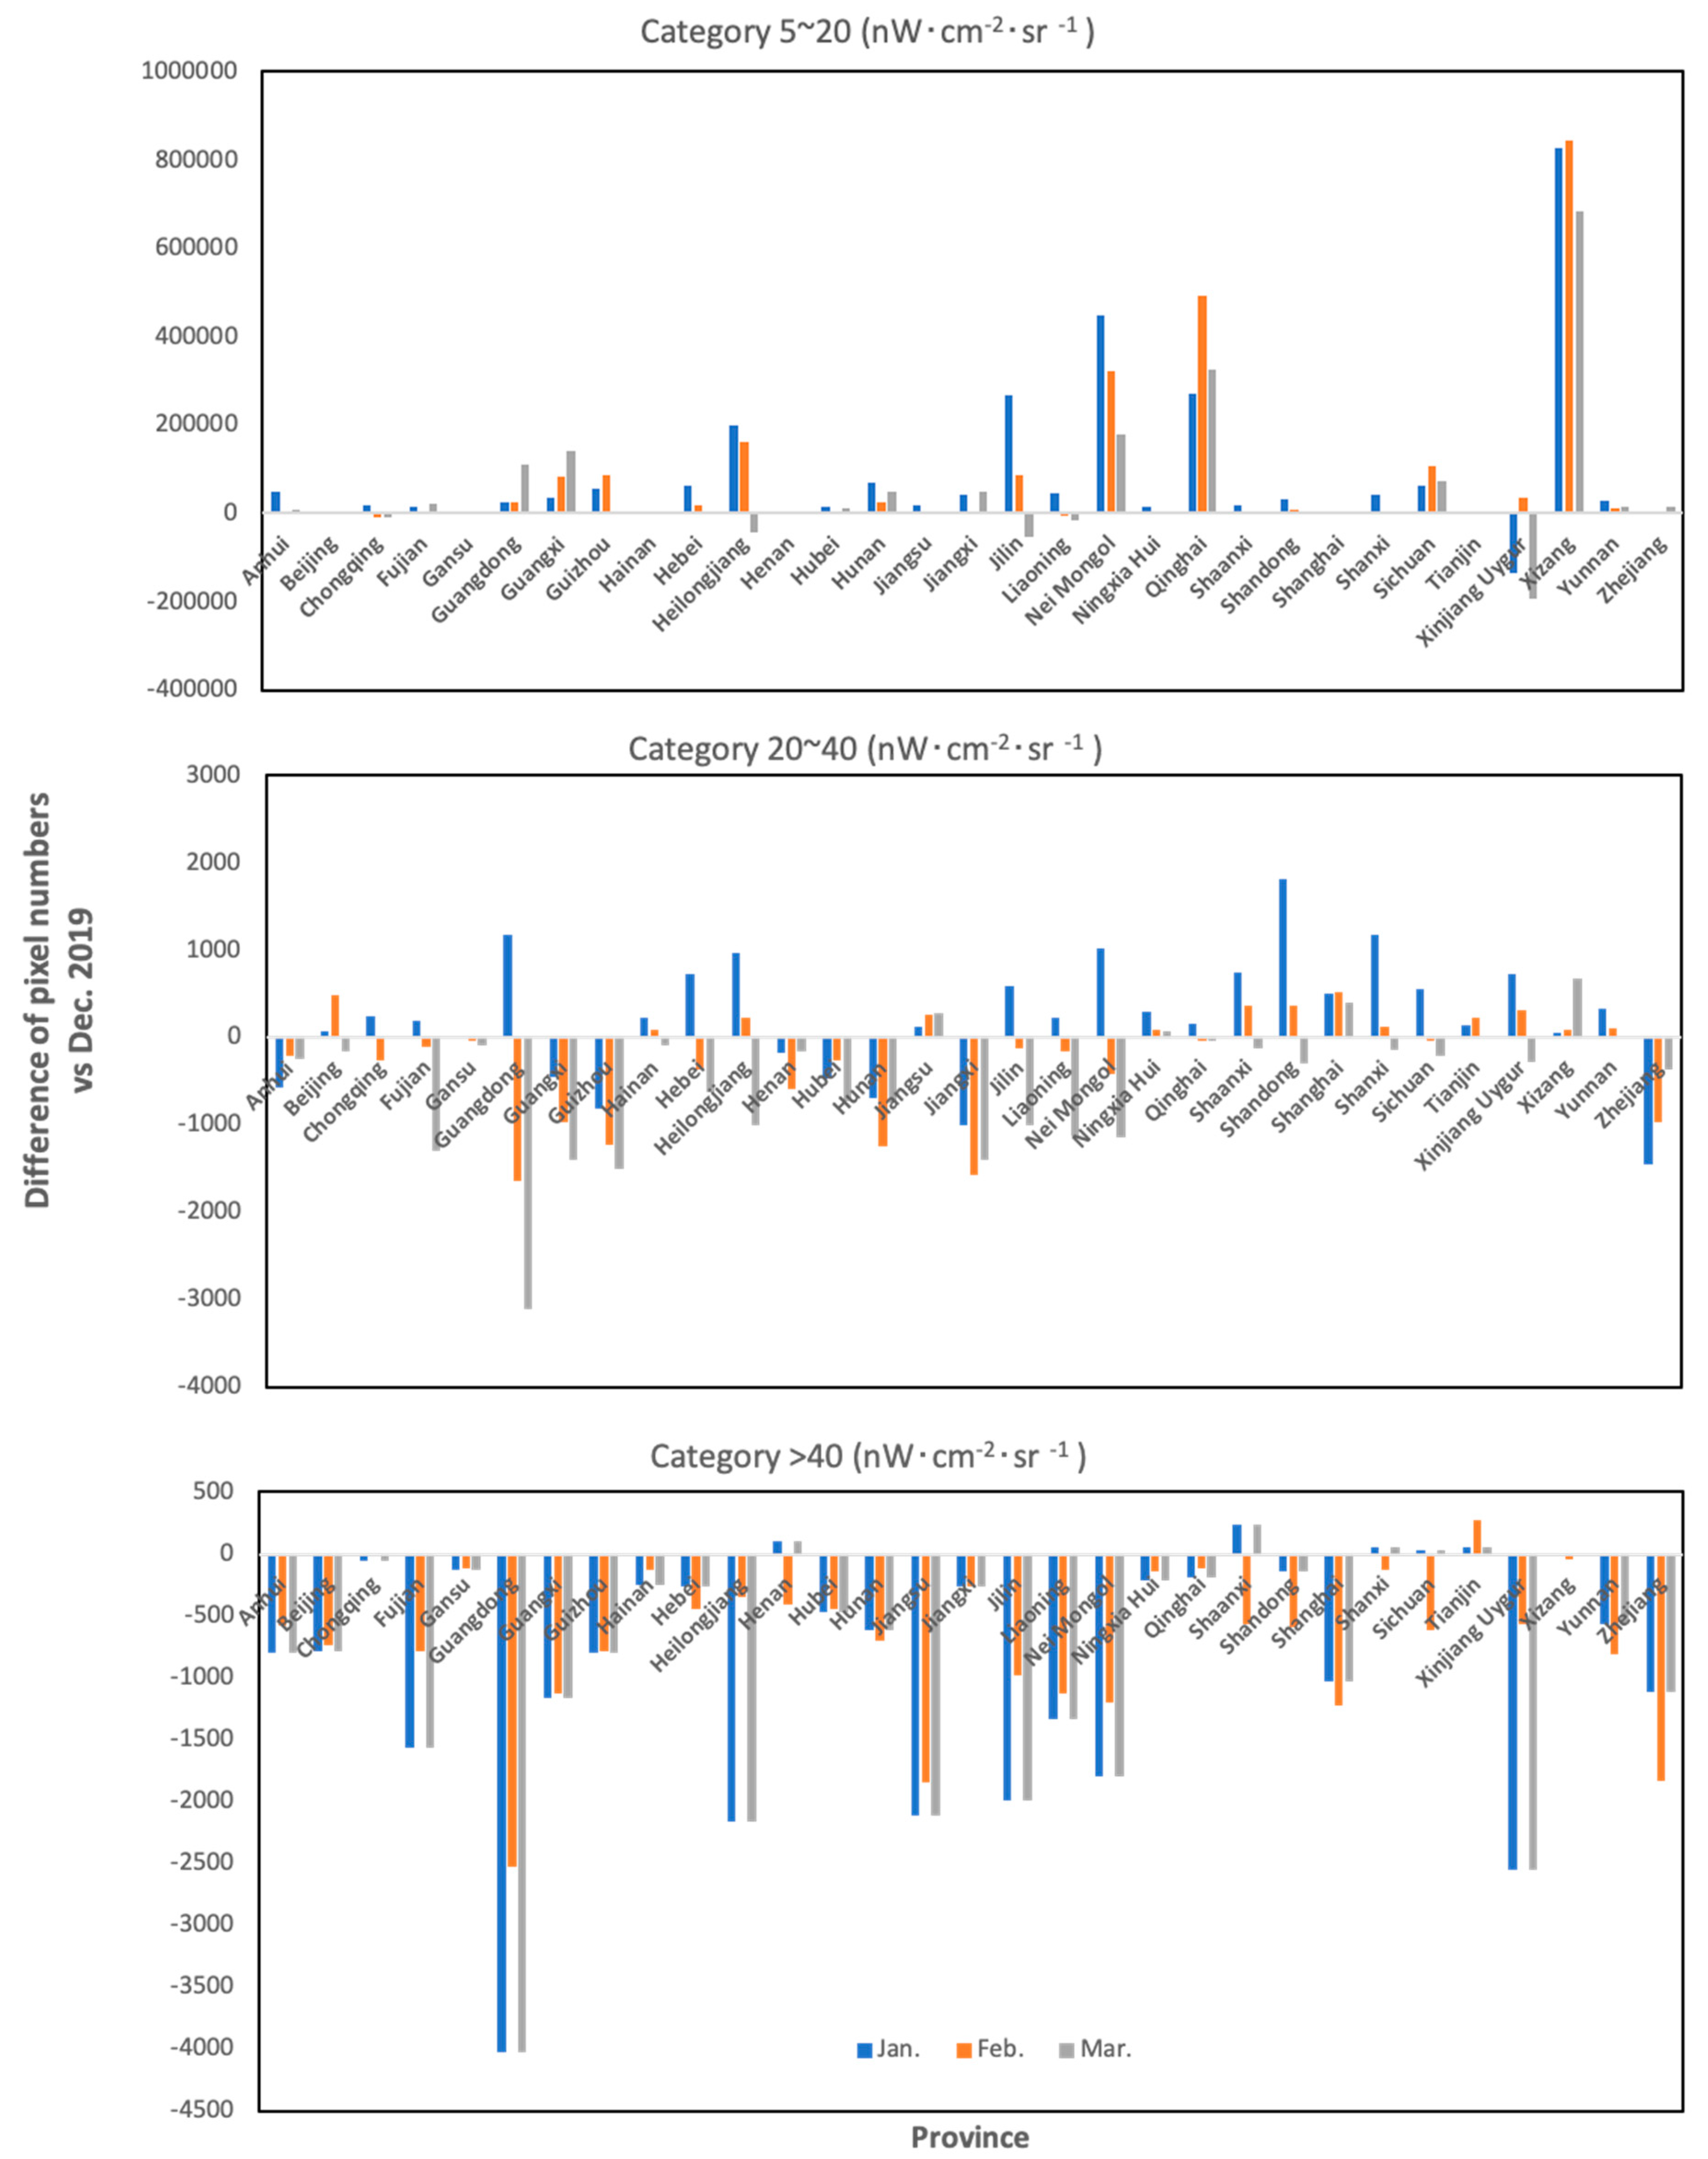
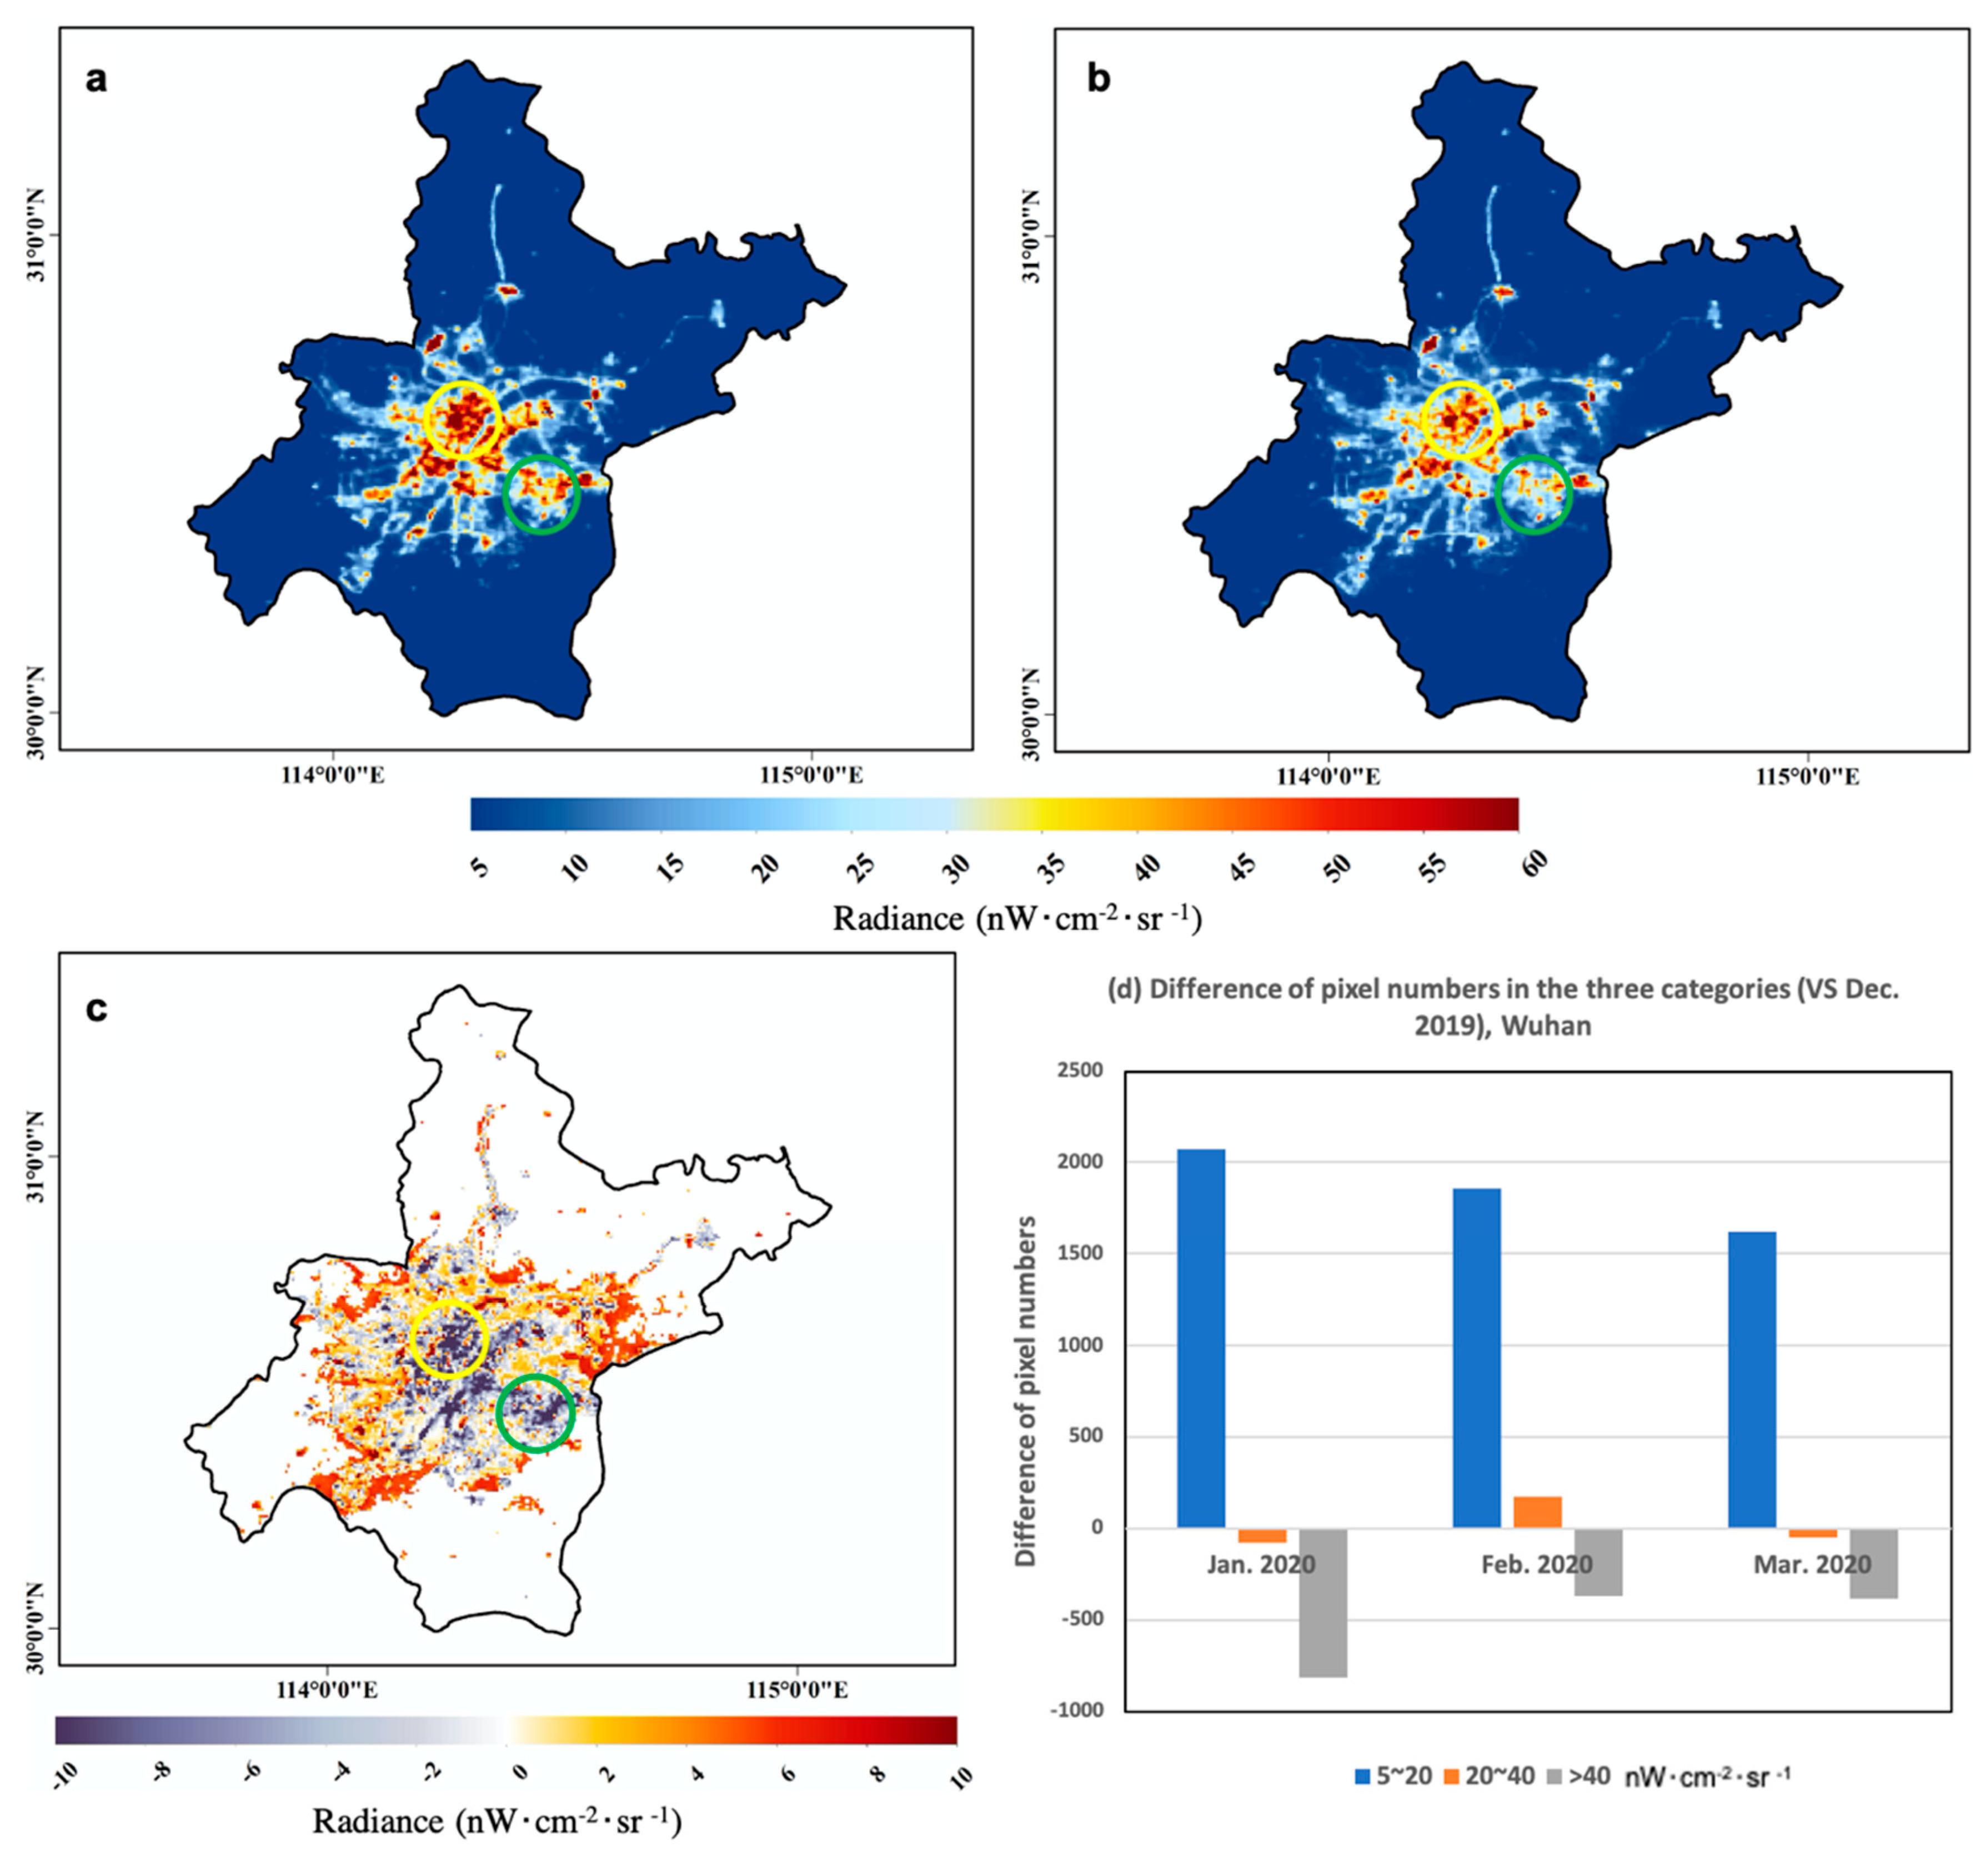
3.1. Impact of COVID-19 on Human Activity Observed by NTL

Figure 2 shows the average NTL radiance for every province from December 2019 to March 2020. During January and February 2020, COVID-19 broke out across China, and most provinces implemented strict quarantine policies, resulting in the majority of people spending their time at home. The average artificial NTL radiance levels during this period are generally lower than December 2019 in most provinces, except for Inner Mongolia, Xinjiang, Xizang and Qinghai, where the crisis is not severe, with 194, 76, 1, and 18 cases, respectively. Additionally, the NTL of these provinces prior to the outbreak is not bright compared to the other provinces. With the reopening of most provinces in March 2020, the average NTL brightness has increased in comparison to January and February. However, exceptions to this have been observed in Hubei province, with its capital city Wuhan being the center of the outbreak and several other provinces near it that contain larger numbers of confirmed cases, such as Hunan (1019 cases), Jiangxi (937 cases), and Guangdong (1585 cases).
Figure 3 shows NTL radiance of mainland China for the same season during 2018/2019 and 2019/2020, which are December 2018–March 2019 and December 2019–March 2020. As the blue bars show in Figure 1, March and January 2019 exhibit overall higher radiance levels than the other two months in the control: December 2018 and February 2019. However, this has obviously changed since the outbreak of COVID-19, as the orange bars show. Because the lockdown policy was officially implemented in January 2020 and lasted almost two months, the mean radiance value in both January and February has clearly decreased. Although some recovery was observed in March 2020, the value is still lower than that of December 2019. One possible explanation is that the reopening measure has been slowly carried out at varying paces in different provinces of China since March. In addition, it is clear to see that the mean values for January, February, and March 2020 are all lower than those for 2019.
Figure 4 shows the differences of NOP in the three NTL categories between the first three months (January, February and March) of 2020 and December 2019 (the former minus the latter), in each province and all of China. Because of the quarantine policies conducted in most provinces, people stopped going shopping, getting together, and working in the office, which mostly takes place in commercial centers, or so-called Central Business Districts (CBDs) at night. Instead, most people stayed at home in the residential areas. These changes in human activity are reflected in the statistical results of the NTL categorization.
For the 5–20 nW· cm 2 · sr 1 category, indicative of residential areas, 20 provinces have higher NOP in all three of the studied months of 2020 than in December 2019. Only Xingjiang in January, and Chongqing, Heilongjiang, Jilin, Liaoning, and Xinjiang in March have decreasing numbers larger than 10,000. All the negative differences are smaller than 10,000 in February 2020, when the crisis was most rigorous. These spatiotemporal patterns are due to the stay-at-home policies and more people spending their nights at home.
For the 20–40 nW· cm 2 · sr 1 group, which reflects the anthropogenic NTL of transportation facilities and public infrastructures, the numbers increased in January 2020 and decreased in February 2020 and March 2020 for most provinces. The quarantine policies were implemented at the end of January 2020 and the transportation and public facilities were busier in the first three weeks than in December 2019 due to the approaching Spring Festival. The corresponding areas are therefore brighter in January 2020, on average. Negative values are found in most provinces for February 2020 and March 2020 because the virus spread rapidly, and the public and transportation infrastructures were not utilized as frequently as usual.
For the commercial-center pixels, with NTL brightness higher than 40 nW· cm 2 · sr 1 , their numbers decreased significantly during all three months, compared to before in most provinces. People tended to avoid going to shopping and entertainment centers due to the quarantine policies and fear of getting infected. Although most cities have reopened and loosened their restrictive policies, people are still cautious to gather in crowds, and most shopping malls are closing earlier in the evenings. There are positive values in Henan, Shaanxi, and Tianjin but the increases are all under 500 pixels, which can be due to differences in seasonal variations, sensor’s condition, or snowfall.
We further investigate the NTL of Wuhan City and the results are shown in Figure 5. Figure 5a,b are the NTL images of Wuhan before and during the lockdown, and Figure 5c is the difference between Figure 5a,b. The regions in the yellow and green circles are the Jianghan and Guanggu commercial centers, respectively, which are two of the most prosperous and crowded areas in Wuhan. We can observe that these regions are dimmer during the lockdown, in February 2020, compared to December 2019. The differences also show mostly negative values in these two circles. Contrastingly, residential areas outside of the commercial centers are brighter in January, and the differences are obviously positive in those regions. However, the pixels on highways and main roads are not clearly getting brighter or dimmer, they tend to show a mixed texture. This phenomenon can also be verified in the difference map (Figure 5c).
Figure 5d is the NOP difference in the three categories between the first three months of 2020 and December 2019 (the former minus latter). For all the months during the city lockdown, there are significantly more pixels in the residential category and fewer pixels in the commercial centers than before. The number of transportation and public facilities lights decreased in January and March but increased in February. Besides the explanations that have already been discussed, in February, large amounts of food, living, and medical resources were transported to Wuhan from all over China and some other countries around the world; national and private medical teams volunteered to support and traveled to Wuhan through highways and airports; temporary hospitals such as Huoshenshan and Leishenshan were built rapidly. Consequently, the NOP in this category was higher during February than December.

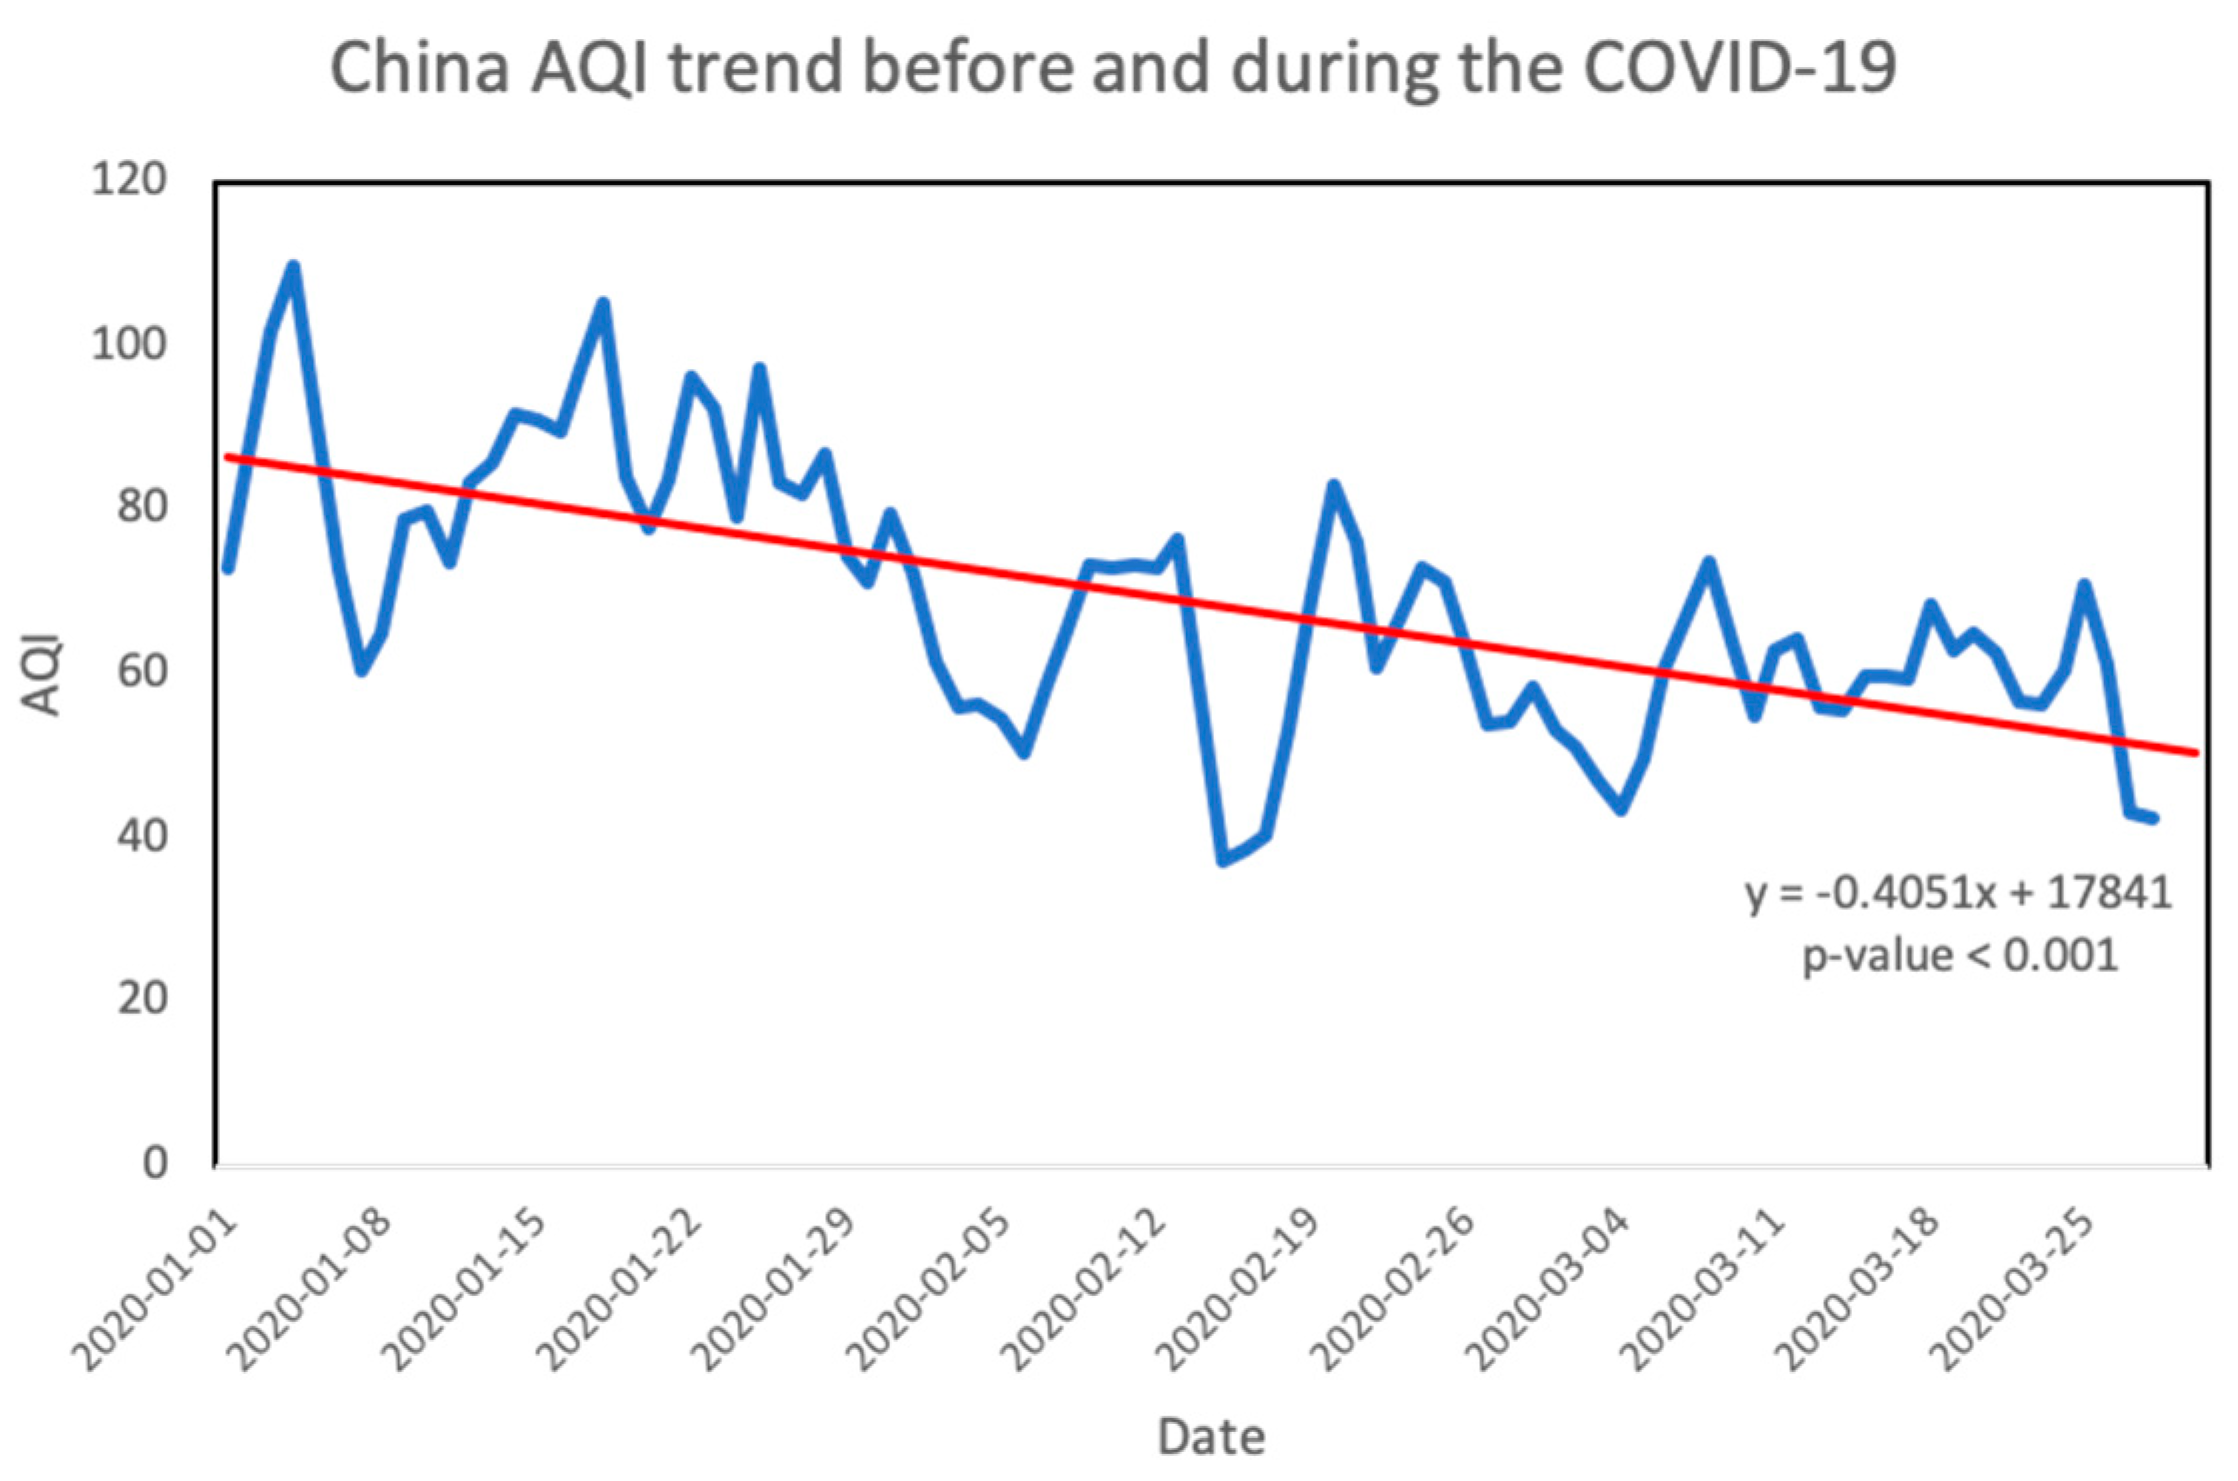
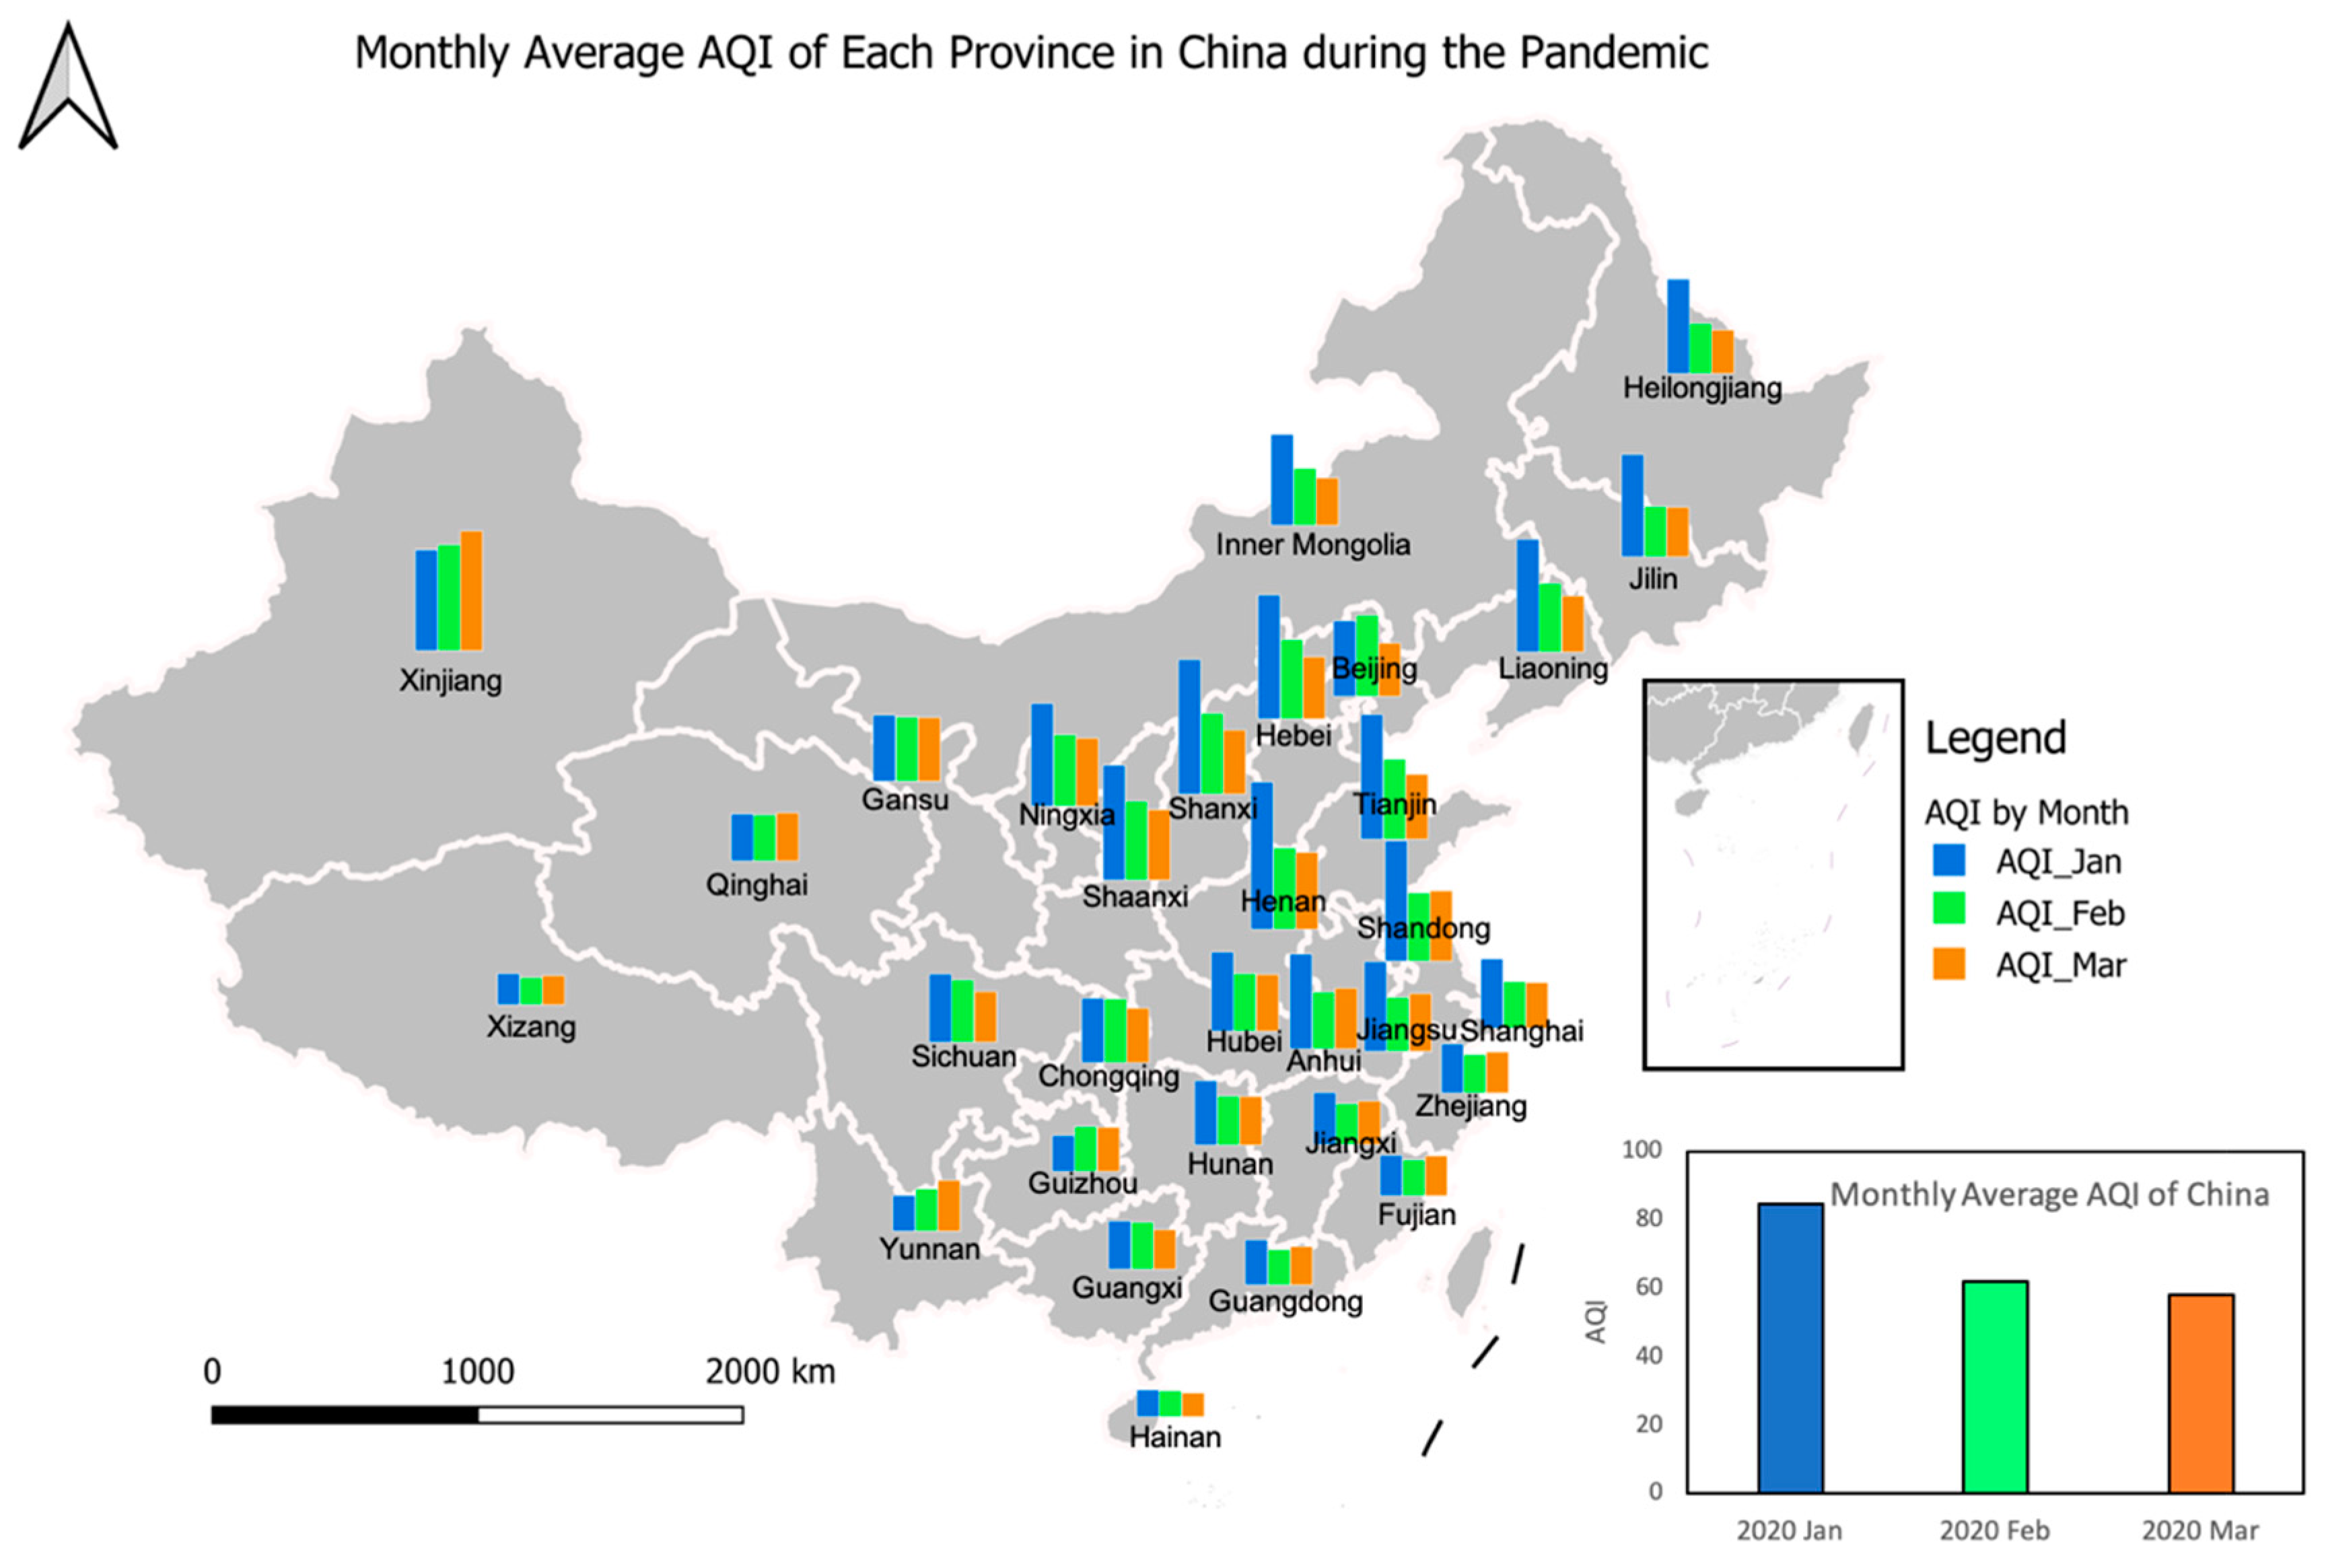
3.2. Impact of COVID-19 on Air Quality

The main air pollution sources in China are power plants, industrial facilities, automobiles, biomass burning, and fossil fuels used in homes and factories for heating [32,33,34]. Figure 6 is the daily average AQI time series of China from 1 January 2020 to 26 March 2020. A significant decreasing trend can be seen through the data with a p-value smaller than 0.001. With the breakout of COVID-19, Chinese central and local governments executed strict policies on restricting the production of non-essential industries, traveling by private motor vehicles, which are among the primary sources of air pollutant emissions. As a consequence, the total air quality improved and the AQI decreased in this period. A valley point can be observed on 15 February 2020, nearly a week after most cities in China ordered shutdown policies around 7–10 February 2020. Although the production and travel restrictions orders were applied, the dispersion and deposition of air pollutants is not an instantaneous procedure but needs a period of time depending on the atmospheric conditions, including wind speed and directions, temperature, air pressure, etc. [35], as well as geographic characteristics such as vegetation and mountains [36]. Therefore, the time series shows a time lag of several days for the atmospheric response.
Figure 7 is the monthly average AQI of each province and the whole of mainland China (lower right corner) from January to March 2020. The air pollution of most provinces was less severe in February and March than January, especially for the Northeast, Northwest, east coast, and central China. The reduction in many non-essential industries and private vehicles are the main reasons for better air quality. Although Wuhan began its lockdown on 23 January 2020, all other cities were still open until the first week of February. The pollutant emissions from the industries and vehicles did not change much during January. Exceptions can be found in Xinjiang, Qinghai, Gansu, Yunnan, and Guizhou where the air quality became worse in February and March. For these provinces, the number of confirmed COVID-19 cases was relatively small, totaling 78, 18, 139, 184, and 147, respectively, as of 20 April 2020. Therefore, the quarantine policies were not as strict as in other areas and many industries kept working during the study period. Moreover, the winter season, with its dry air conditions, is not conducive to the dispersion of air pollutants [35]. The total air quality condition of China also showed improvement over the three months.

4. Discussion

The COVID-19 crisis has introduced crucial impacts on people’s daily lives, production, and the environment by restricting people to stay at home and reduce non-essential production. The aim of this study was to investigate spatiotemporal patterns in artificial nighttime light and the air environment, as induced by COVID-19 and the related prevent-and-control policies. By obtaining the spatiotemporal information of these changes, decision makers and citizens can have a comprehensive understanding of the responses of both humans and the environment to the pandemic. For example, the economy has been stricken because people are spending less time in commercial centers and more time at home during the pandemic. Additionally, patients with diseases of the respiratory system benefit from better air quality. This type of information offers suggestions, evidence, and a basis for government leaders, medical workers, and the public on how they may do more to stimulate the economy, treat patients, and balance daily activities. The impacts of the COVID-19 crisis on the atmospheric environment and human activities are studied in this paper by comprehensively investigating the NTL radiance and AQI of every province and the entire mainland China before and during the pandemic in both spatial and temporal dimensions. The activity ranges of citizens among different functional zones changed dramatically due to the COVID-19 related policies. The CBD and commercial centers became less bright in the NTL images and residential regions lit up. Most people followed the instructions and suggestions of the government and health department strictly to fight against the crisis and protect themselves. Although these changes and impacts bring unprecedented inconvenience to people’s daily lives and work, the spread of COVID-19 was initially controlled in about two months. This gives an efficient reference for the rest of the world to make their own policies, strategies, and decisions regarding how to control the spread of the virus. Since people stayed at home for nearly two months, some of their consumption and working habits have changed. For example, more people will be accustomed to online purchases and working from home, which will influence economic structures and the incomes of retailers. It has already been proven that NTL has a close relationship with the economy [37,38]; it should be used in the investigation of post-pandemic socioeconomic situations.
In spite of all the worldwide catastrophes it has brought to human lives, health, economies, and medical resources, COVID-19 has made our air cleaner. This may have some positive influences on the recovery of other respiratory diseases. Analysis of medical data involved would be worthwhile, which will give the decision makers more comprehensive support on the medical and first-aid resources arrangement. Regarding the overall environment in China, the COVID-19 pandemic may have had some positive influences. Due to the cut down of the production of non-essential industries, the emission of liquid and solid contaminations should have been greatly reduced. Moreover, as restricted by the stay-at-home policy, the wastes created by tourism and entertainment should also have decreased during this period of time. On the other hand, the utilization of medical materials and resources such as masks, ventilators, and protection suites is significantly increased. The production and consumption of these materials may cause a negative influence on the natural environment. Therefore, the overall impact of the pandemic on the environment needs to be comprehensively analyzed in future studies. The pandemic situation can also provide an opportunity to experiment on environmental management and pollution monitoring with many of the anthropogenic factors excluded.
This paper tends to offer short-term qualitative analytics on how people and environments respond to the COVID-19 crisis. Other factors will be considered in our future work, such as the moonlight contamination and incident angle of artificial light that can cause variations in radiance statistics [21,39,40,41]. In addition, the seasonal cycles, construction development, policies, and technological adjustments on electrical circuits, would also bring uncertainties to the quantitative analysis of nighttime light. In the future, all these factors will be addressed and removed from the trends by investigating long-term historic data to conduct quantitative analysis on correlation, regression, and prediction. Specifically, when the second version of the VNP46 product is released, with adjustments made to address the moonlight issue, we will conduct a more comprehensive study using the advanced dataset.
Despite the effort made by this paper and all the other research, more work is needed to be done on the impact of COVID-19, including:
  • Implement strict data quality control procedure to remove noise from the nighttime light signal;
  • The socioeconomic impact of COVID-19 will be examined by monitoring the change in economic conditions such as GDP, individual income, and unemployment rate using NTL and census data;
  • As some analytics and news illustrated, the infection and death rates of COVID-19 have various patterns in different communities [42]. The NTL and other high-resolution remote sensing data sources can be used to distinguish community types in terms of income levels, races, and occupations [43]. In the future, the COVID-19 spread and impact condition will be further studied in different human groups;
  • The investigation on air quality will be more detailed on some specific pollutants such as SO2, CO, and Ozone that are not addressed in the previous studies;
  • Since the COVID-19 has shown its effects on atmospheric conditions, will it influence the weather, or even the climate, if it cannot be controlled in a short time? Further research is needed on the impact of COVID-19 by modeling with more climatic and virus-spread factors [44].

5. Conclusions

This research provides detailed spatiotemporal analytics on the impact of COVID-19 on human lives as reflected by nighttime light and air quality. From the results of the experiments and statistics, we conclude:
  • The average NTL radiance decreases in most provinces and the entire country of mainland China with the implementation of shutdown policies. Some exceptions are shown in several provinces due to their small number of confirmed cases, quarantine policies, and low original NTL brightness;
  • Impacting by the lockdown and quarantine policies, the NTL radiance is lower in the first three months of 2020 than 2019;
  • The number of detected NTL pixels increases in the residential areas while it decreases in the commercial center regions, and generally stays the same in the transportation and public facilities during the studied pandemic time period. This reflects a transfer of human activities from shopping and entertainment centers to residential areas due to the quarantine policies;
  • The total air quality improved during the COVID-19 crisis because of the reduction in industrial production and vehicle usage;
  • The spread of COVID-19 and related policies have a significant impact on people’s daily lives and the environment.
These analytics can be further advanced with spatiotemporal and big data methodologies [43] for restraining the spread of COVID-19, medical resources arrangement, planning and implementing of reopening policies, estimating the economic loss and making financial plans in mainland China, and serve as a reference for other parts of the world.

Author Contributions

C.Y., Q.L., and P.H. came up with the original research idea; C.Y. advised Q.L., D.S. and W.L. on the experiment design and paper structure; Q.L. designed the experiments, developed the scripts for experiments, conducted the experiments, and analyzed the experiment results; H.L. supported computing for data processing; D.S. produced the provincial base map, NTL and AQI maps; Q.L. and W.L. produced the NTL results; L.Z., R.H., M.L., and T.H. acquired and cleaned the AQI data. Q.L. wrote the paper; C.Y., P.H., and C.F. revised the paper. All authors have read and agreed to the published version of the manuscript.

Funding

This research was funded by NSF (1841520 and 1835507).

Acknowledgments

The NSF Spatiotemporal Innovation Center Covid-19 Rapid Response Task Force provides foundational support to this research. VIIRS NTL data are obtained from the open accessible NASA GES DISC. The China National Environmental Monitoring Center provided the AQI data. Two anonymous reviewers provided constructive comments to improve the paper.

Conflicts of Interest

The authors declare no conflict of interest.

References

  1. Yang, C.; Sha, D.; Liu, Q.; Li, Y.; Lan, H.; Guan, W.W.; Hu, T.; Li, Z.; Zhang, Z.; Thompson, J.H.; et al. Taking the pulse of COVID-19: A spatiotemporal perspective. arXiv 2020, arXiv:2005.04224v1. [Google Scholar]
  2. Wang, J.; Tang, K.; Feng, K.; Lv, W. High Temperature and High Humidity Reduce the Transmission of Covid-19. 2020. Available online: https://ssrn.com/abstract=3551767 (accessed on 8 April 2020).
  3. Ma, Y.; Zhao, Y.; Liu, J.; He, X.; Wang, B.; Fu, S.; Yan, J.; Niu, J.; Zhou, J.; Luo, B. Effects of temperature variation and humidity on the death of COVID-19 in Wuhan, China. Sci. Total Environ. 2020. [Google Scholar] [CrossRef]
  4. Luo, W.; Majumder, M.; Liu, D.; Poirier, C.; Mandl, K.; Lipsitch, M.; Santillana, M. The role of absolute humidity on transmission rates of the COVID-19 outbreak. medRxiv 2020. [Google Scholar] [CrossRef]
  5. Oliveiros, B.; Caramelo, L.; Ferreira, N.C.; Caramelo, F. Role of temperature and humidity in the modulation of the doubling time of COVID-19 cases. medRxiv 2020. [Google Scholar] [CrossRef] [Green Version]
  6. Jia, J.; Ding, J.; Liu, S.; Liao, G.; Li, J.; Duan, B.; Wang, G.; Zhang, R. Modeling the control of covid-19: Impact of policy interventions and meteorological factors. arXiv 2020, arXiv:2003.02985. [Google Scholar]
  7. Sajadi, M.M.; Habibzadeh, P.; Vintzileos, A.; Shokouhi, S.; Miralles-Wilhelm, F.; Amoroso, A. Temperature and latitude analysis to predict potential spread and seasonality for COVID-19. 2020. Available online: https://ssrn.com/abstract=3550308 (accessed on 8 April 2020).
  8. Buckee, C.O.; Balsari, S.; Chan, J.; Crosas, M.; Dominici, F.; Gasser, U.; Grad, Y.H.; Grenfell, B.; Halloran, M.E.; Kraemer, M.U.; et al. Aggregated mobility data could help fight COVID-19. Science (N. Y.) 2020, 368, 145. [Google Scholar] [CrossRef] [Green Version]
  9. Kraemer, M.U.; Yang, C.H.; Gutierrez, B.; Wu, C.H.; Klein, B.; Pigott, D.M.; du Plessis, L.; Faria, N.R.; Li, R.; Hanage, W.P.; et al. The effect of human mobility and control measures on the COVID-19 epidemic in China. Science 2020, 368, 493–497. [Google Scholar] [CrossRef] [Green Version]
  10. Cao, C.; Chang, C.; Xu, M.; Zhao, J.; Gao, M.; Zhang, H.; Guo, J.; Guo, J.; Dong, L.; He, Q.; et al. Epidemic risk analysis after the Wenchuan Earthquake using remote sensing. Int. J. Remote Sens. 2010, 31, 3631–3642. [Google Scholar] [CrossRef]
  11. Xu, H.; Yu, T.; Gu, X.F.; Cheng, T.H.; Xie, D.H.; Liu, Q. The research on remote sensing dust aerosol by using split window emissivity. Spectrosc. Spectr. Anal. 2013, 33, 1189–1193. [Google Scholar]
  12. Liu, Q.; Li, Y.; Yu, M.; Chiu, L.S.; Hao, X.; Duffy, D.Q.; Yang, C. Daytime Rainy Cloud Detection and Convective Precipitation Delineation Based on a Deep Neural Network Method Using GOES-16 ABI Images. Remote Sens. 2019, 11, 2555. [Google Scholar] [CrossRef] [Green Version]
  13. Yang, C.; Yu, M.; Li, Y.; Hu, F.; Jiang, Y.; Liu, Q.; Sha, D.; Xu, M.; Gu, J. Big Earth data analytics: A survey. Big Earth Data 2019, 3, 83–107. [Google Scholar] [CrossRef] [Green Version]
  14. NASA. Nighttime Images Capture Change in China. 2020. Available online: https://earthobservatory.nasa.gov/images/146481/nighttime-images-capture-change-in-china (accessed on 8 April 2020).
  15. Wu, X.; Nethery, R.C.; Sabath, B.M.; Braun, D.; Dominici, F. Exposure to air pollution and COVID-19 mortality in the United States. medRxiv 2020. [Google Scholar] [CrossRef] [Green Version]
  16. NASA Earth Observation Team. Airborne Nitrogen Dioxide Plummets over China. 2020. Available online: https://earthobservatory.nasa.gov/images/146362/airborne-nitrogen-dioxide-plummets-over-china (accessed on 8 April 2020).
  17. United Space in Europe. COVID-19: Nitrogen dioxide over China. 2020. Available online: https://www.esa.int/Applications/Observing_the_Earth/Copernicus/Sentinel-5P/COVID-19_nitrogen_dioxide_over_China (accessed on 8 April 2020).
  18. Isaifan, R.J. The dramatic impact of Coronavirus outbreak on air quality: Has it saved as much as it has killed so far? Glob. J. Environ. Sci. Manag. 2020, 6, 275–288. [Google Scholar]
  19. Aili, L. Analysis of Environmental Quality Monitoring and Evaluation of Typical Villages by Promoting Governace with Awards. J. Green Sci. Technol. 2014, 3, 57. [Google Scholar]
  20. Shochat, T. Impact of lifestyle and technology developments on sleep. Nat. Sci. Sleep 2012, 4, 19. [Google Scholar] [CrossRef] [Green Version]
  21. Román, M.O.; Wang, Z.; Sun, Q.; Kalb, V.; Miller, S.D.; Molthan, A.; Schultz, L.; Bell, J.; Stokes, E.C.; Pandey, B.; et al. NASA’s Black Marble nighttime lights product suite. Remote Sens. Environ. 2018, 210, 113–143. [Google Scholar] [CrossRef]
  22. Hillger, D.; Kopp, T.; Lee, T.; Lindsey, D.; Seaman, C.; Miller, S.; Solbrig, J.; Kidder, S.; Bachmeier, S.; Jasmin, T.; et al. First Light Imagery from Suomi NPP VIIRS. Bull. Am. Meteorol. Soc. 2013, 94, 1019–1029. [Google Scholar] [CrossRef]
  23. Román, M.O.; Wang, Z.; Shrestha, R.; Yao, T.; Kalb, V. Black Marble User Guide Version 1.0; NASA: Washington, DC, USA, 2019. [Google Scholar]
  24. Zheng, S.; Cao, C.X.; Singh, R.P. Comparison of ground based indices (API and AQI) with satellite based aerosol products. Sci. Total Environ. 2014, 488, 398–412. [Google Scholar] [CrossRef]
  25. Baugh, K.; Hsu, F.C.; Elvidge, C.D.; Zhizhin, M. Nighttime lights compositing using the VIIRS day-night band: Preliminary results. Proc. Asia Pac. Adv. Netw. 2013, 35, 70–86. [Google Scholar] [CrossRef] [Green Version]
  26. Ma, T. An estimate of the pixel-level connection between visible infrared imaging radiometer suite day/night band (VIIRS DNB) nighttime lights and land features across China. Remote Sens. 2018, 10, 723. [Google Scholar] [CrossRef] [Green Version]
  27. Hasan, S.; Shi, W.; Zhu, X.; Abbas, S. Monitoring of land use/land cover and socioeconomic changes in south china over the last three decades using landsat and nighttime light data. Remote Sens. 2019, 11, 1658. [Google Scholar] [CrossRef] [Green Version]
  28. Xu, D.; Gao, J. The night light development and public health in China. Sustain. Cities Soc. 2017, 35, 57–68. [Google Scholar] [CrossRef]
  29. Li, X.; Zhao, L.; Li, D.; Xu, H. Mapping urban extent using Luojia 1-01 nighttime light imagery. Sensors 2018, 18, 3665. [Google Scholar] [CrossRef] [Green Version]
  30. Yin, Z.; Li, X.; Tong, F.; Li, Z.; Jendryke, M. Mapping urban expansion using night-time light images from Luojia1-01 and International Space Station. Int. J. Remote Sens. 2020, 41, 2603–2623. [Google Scholar] [CrossRef]
  31. Small, C.; Pozzi, F.; Elvidge, C.D. Spatial analysis of global urban extent from DMSP-OLS night lights. Remote Sens. Environ. 2005, 96, 277–291. [Google Scholar] [CrossRef]
  32. Rohde, R.A.; Muller, R.A. Air pollution in China: Mapping of concentrations and sources. PLoS ONE 2015, 10, e0135749. [Google Scholar] [CrossRef]
  33. Song, C.; Wu, L.; Xie, Y.; He, J.; Chen, X.; Wang, T.; Lin, Y.; Jin, T.; Wang, A.; Liu, Y.; et al. Air pollution in China: Status and spatiotemporal variations. Environ. Pollut. 2017, 227, 334–347. [Google Scholar] [CrossRef]
  34. Aunan, K.; Hansen, M.H.; Wang, S. Introduction: Air pollution in China. China Q. 2018, 234, 279–298. [Google Scholar] [CrossRef] [Green Version]
  35. Cichowicz, R.; Wielgosiński, G.; Fetter, W. Dispersion of atmospheric air pollution in summer and winter season. Environ. Monit. Assess. 2017, 189, 605. [Google Scholar] [CrossRef] [Green Version]
  36. Janhäll, S. Review on urban vegetation and particle air pollution–Deposition and dispersion. Atmos. Environ. 2015, 105, 130–137. [Google Scholar] [CrossRef]
  37. Li, X.; Xu, H.; Chen, X.; Li, C. Potential of NPP-VIIRS nighttime light imagery for modeling the regional economy of China. Remote Sens. 2013, 5, 3057–3081. [Google Scholar] [CrossRef] [Green Version]
  38. Yu, M.; Bambacus, M.; Cervone, G.; Clarke, K.; Duffy, D.; Huang, Q.; Li, J.; Li, W.; Li, Z.; Liu, Q.; et al. Spatiotemporal event detection: A review. Int. J. Digit. Earth 2020, 1–27. [Google Scholar] [CrossRef] [Green Version]
  39. Sánchez de Miguel, A. Spatial, Temporal and Spectral Variation of the Light Pollution and its Sources: Methodology and Results; Universidad Complutense de Madrid: Madrid, Spain, 2015. [Google Scholar]
  40. Coesfeld, J.; Anderson, S.J.; Baugh, K.; Elvidge, C.D.; Schernthanner, H.; Kyba, C. Variation of individual location radiance in VIIRS DNB monthly composite images. Remote Sens. 2018, 10, 1964. [Google Scholar] [CrossRef] [Green Version]
  41. Tong, K.P.; Kyba, C.C.; Heygster, G.; Kuechly, H.U.; Notholt, J.; Kollth, Z. Angular distribution of upwelling artificial light in Europe as observed by Suomi–NPP satellite. J. Quant. Spectrosc. Radiat. Transf. 2020, 249, 107009. [Google Scholar] [CrossRef]
  42. Wolf, Z.B. How the Coronavirus Is Devastating Communities of Color. 2020. Available online: https://www.cnn.com/2020/04/18/politics/what-matters-april-17/index.html (accessed on 8 April 2020).
  43. Chaturvedi, M.; Ghosh, T.; Bhandari, L. Assessing income distribution at the district level for India using nighttime satellite imagery. Proc. Asia Pac. Adv. Netw. 2011, 32, 192–217. [Google Scholar] [CrossRef]
  44. Yang, C.; Clarke, K.; Shekhar, S.; Tao, C.V. Big spatiotemporal data analytics: A research and innovation frontier. Int. J. Geogr. Inf. Sci. 2019, 1075–1088. [Google Scholar] [CrossRef] [Green Version]
Figure 1. Workflow of the analytical process.
Remotesensing 12 01576 g001
Figure 2. Monthly average NTL for each province from December 2019 to March 2020.
Remotesensing 12 01576 g002
Figure 3. Monthly mean NTL of mainland China from December 2019 to Mach. 2020. The same period of data from December 2018 to March 2019 is also plotted as a reference to see how the nighttime light changes during the pandemic.
Remotesensing 12 01576 g003
Figure 4. Differences of NOP in the three NTL categories between the first three months of 2020 and December 2019, in each province of China. The residential area NTL is increasing during the pandemic (top), the transportation and public facility NTL has a drop trend in most provinces (middle), while the commercial center NTL has a sharp drop in almost every province.
Remotesensing 12 01576 g004
Figure 5. (a) Monthly average NTL radiance of Wuhan before lockdown; (b) monthly average nighttime light radiance of Wuhan after lockdown; (c) difference between (b) and (c); (d) differences of NOP in the three NTL categories between first three months of 2020 and December 2019, in Wuhan.
Remotesensing 12 01576 g005
Figure 6. Daily average AQI time series of China from January 1, 2020 to March 26, 2020.
Remotesensing 12 01576 g006
Figure 7. Monthly average AQI of each province and mainland China (lower right corner) from January 2020 to March 2020.
Remotesensing 12 01576 g007

