


Abstract
Assessing the effect of light pollution, Microcystis aeruginosa was grown with and without low levels of night lighting. Significant differences were observed between the treatments in the maximum quantum yield of charge separation, the intracellular chlorophyll a concentration, the functional absorption cross-section of photosystem II, the number of Rubisco per cell and per chlorophyll a, the number of photosystem I per chlorophyll a, and the chlorophyll a fraction not bound to the photosystems and IsiA.
Artificial night lighting affects a broad range of terrestrial and aquatic organisms (Dodson, 1990; Moore et al., 2000; Longcore and Rich, 2004). The effects of light pollution on plant species have been explored for a variety of light sources (Cathey and Campbell, 1975a, b; Raven and Cockell, 2006), and the roles of different phytochromes have been elucidated (Smith, 2000). No studies, however, have looked specifically at the influence of artificial night lighting on phytoplankton, including cyanobacteria, even though light is known to influence several metabolic processes (Mullineaux, 2001). These include photosynthesis, the regulation (through photoreceptors) of circadian rhythms (Ditty et al., 2003; Yang et al., 2010; Rust et al., 2011), and several other regulatory processes (Montgomery, 2007). Among them, toxin production in Microcystis aeruginosa has been positively correlated to photosynthetically active radiation (Wiedner et al., 2003).
Here we use M. aeruginosa as a model of a widespread photosynthetic organism in the environment and explore the possibility that its photophysiology might be influenced by light pollution. This species is well known for its blooms in freshwater, and its hepatotoxin, microcystin, when in high concentrations, leads to public health concerns (Lambert et al., 1994).
We devised a laboratory experiment to simulate light conditions encountered by M. aeruginosa in environments with and without light pollution. Three cultures of M. aeruginosa (CPCC 299, Canadian Phycological Culture Centre) were grown in the laboratory at 25°C in 3 L turbidostats. One crashed and had to be discarded, but replicates of the other two in time provided reproducible results. Light transmission was measured in one culture every minute at 740 nm and both cultures were diluted with modified BG11 medium based on this measurement (Andersen, 2005; Appendix A and references therein). We used a before-and-after experimental design strengthened by a return to ‘before’ conditions. The experiment lasted 25 days. Following a 9-day acclimation period without night lighting, the first sampling occurred on Days 10 and 11 (Week 1). Then, a high pressure sodium (HPS; Globe Electric Company, Inc., Canada) lamp placed above the cultures was turned on at night on Day 12 to simulate light pollution, and cultures were acclimated until sampling Days 17 and 18 (Week 2). Finally, night lighting was turned off on Day 19, and the last sampling period occurred on Days 24 and 25 (Week 3). Samples were drawn every 2 h except for protein and microcystin samples, which were collected every 4 h to avoid depleting the volume. Chlorophyll a (Chla) concentration (µg/L) in both cultures was maintained between 200 and 350 µg/L (with a diel variation of ∼40% due to changes in the light transmission to Chla ratio). Eight fluorescent tubes (Philips #147454 F54T5/865/HO/ALTO, Netherlands), whose spectra were modified towards that of sunlight using ‘Special Lavender’ filters (LEE #137, LEE Filters, UK), provided daylight. Irradiance was computer-controlled to follow a sinusoidal 14 h:10 h light:dark cycle with a maximum of 1200 μmol m−2s−1 outside the vessels at 12:00. The HPS lamp was covered with neutral density filters to obtain an irradiance of 0.08 µmol m−2 s−1 (∼6.6 lux). This matched the irradiance measured on the shore of Lac des Nations (45.395°N, −71.913°W) in Sherbrooke, Quebec, Canada, using a US-SQS/L scalar probe (Heinz Walz GmbH, Germany) attached to a Li-250A light meter (Li-COR, USA). For comparison, the typical irradiance in a lighted parking lot is 10 lux (Rich and Longcore, 2005). The pH was measured every minute and maintained between 8.3 and 8.4 by bubbling CO2.
As our experiment is the first study on the impact of artificial night lighting on cyanobacteria, we measured a broad range of variables to identify potential effects. Cell counts and diameters were measured using a Multisizer 4 Coulter Counter (Beckman Coulter, USA) 2 days after the end of the experiment from samples preserved in a 0.7% Lugol's solution. Chla concentrations were determined by fluorometry using the non-acidification method (Welschmeyer, 1994). Chla from filtered samples was extracted in 3/2 (v/v) acetone 90%/DMSO solution for 15 min (MacIntyre and Cullen, 2005). Afterwards, samples were lightly centrifuged before the fluorescence was measured using a Trilogy fluorometer (Turner Designs, USA) fitted with a Chla Non-Acidification Module (Turner Designs, USA). Variable fluorescence was measured after 30 min of dark-acclimation using a 3500 Fluorometer (Photon Systems Instruments, Czech Republic) with a 630 nm LED as the excitation source. The results were normalized to rhodamine dye to account for potential instrument drift and modified BG11 medium was used for blanks (fluorescence values were the same as the culture filtrate). Fluorescence induction was sampled every microsecond during an 80 µs 34 000 µmol photons m−2 s−1 flash. The Fo and Fm parameters, representing the minimum and maximum values of the fluorescence transient and the absorption cross-section of photosystem II at 630 nm (σPSII[630], angstrom2 photon−1) were obtained by fitting a fluorescence induction model (Kolber et al., 1998) to the data. Fv is the difference between Fm and Fo. Photosynthesis vs. irradiance (PvsE) curves (Nielsen, 1975) were measured by adding 888 kBq H14CO3 (GE Healthcare, USA) to 15 mL samples from which 0.5 mL subsamples were distributed into 20 containers illuminated for 20 min at irradiances varying between 0 and 3300 µmol photons m−2 s−1. Turning the lights off and rapidly acidifying terminated incubation. Samples were left overnight to allow inorganic 14C to escape before liquid scintillation counting in a Tri-Carb 2910 TR (Perkin Elmer, USA). Curves were fitted to an exponential model (Nielsen, 1975) to obtain the photosynthetic parameters. Normalization to Chla provided the maximum chlorophyll-specific rate of photosynthesis at light saturation ( , mg C mg Chl−1 h−1) and the chlorophyll-specific initial slope of the PvsE curve [αchl, mg C mg Chl−1 h−1 (µmol m−2 s−1)−1]. Intracellular microcystin was sampled by filtering 12 mL of culture onto GF75 glass fiber filters (Advantec, Japan) that were kept at −80°C before quantitation with a competitive ELISA assay (Beacon Analytical Systems, USA). Samples for photosynthetic protein assays were filtered onto GF75 glass fiber filters (nominal pore size 0.3 µm, Advantec, Japan) and kept at −80°C before being assayed for concentrations of PsbA (a subunit of photosystem II with 1:1 stoichiometry with photosystem II, referred to as PSII), PsaC (a subunit of photosystem I with 1:1 stoichiometry with photosystem I, referred to as PSI), RbcL (a subunit of Rubisco with 8:1 stoichiometry with Rubisco) and IsiA, following the methods of Brown et al. (Brown et al., 2008).
To test whether the observed differences were significant we used a paired t-test. Data were paired by sampling times and day (either the first or second day of sampling of a given week) for each culture. The differences were computed for the ‘no-light pollution’ to ‘light pollution’ transition (four differences) and for the ‘light pollution’ to ‘no-light pollution’ transition (four differences). Averages and t-values (ρ ≤ 5%) of the eight differences for each sampling time were computed. The differences were considered statistically significant (* and ** in Fig. 1, underlined in Table I) when the confidence interval for the mean differences did not overlap 0. Normality of the differences was verified with Kolmogorov–Smirnov and Shapiro–Wilk tests (ρ ≤ 5%).
Means ± standard deviations (in italics below the means) for Pchlmax, αchl, photosystem I and photosystem II concentration, total cellular protein content and microcystin content
| Variable | Night lighting | 6:40 | 8:40 | 10:40 | 12:40 | 14:40 | 16:40 | 18:40 | 20:40 | 22:40 | 00:40 | 02:40 | 04:40 |
|---|---|---|---|---|---|---|---|---|---|---|---|---|---|
| αchl mg C mg Chl−1h−1 (µmol m−2 s−1)−1 | Without | 0.042 0.004 | 0.038 0.006 | 0.036 0.002 | 0.033 0.006 | 0.036 0.007 | 0.039 0.006 | 0.040 0.005 | 0.047 0.003 | 0.051 N/A | 0.052 N/A | 0.046 N/A | 0.035 N/A |
| With | 0.043 0.005 | 0.035 0.006 | 0.05 0.02 | 0.045 0.02 | 0.039 0.02 | 0.038 0.007 | 0.045 0.02 | 0.038 0.02 | N/A | 0.058 N/A | N/A | 0.057 N/A | |
 mg C mg Chl−1h−1 mg C mg Chl−1h−1 | Without | 6.9 1 | 7.2 0.8 | 7.1 0.5 | 8.5 1.4 | 9.0 4 | 9.6 5 | 7.8 0.7 | 8.0 0.8 | 8.9 N/A | 7.2 N/A | 6.1 N/A | 7.3 N/A |
| With | 6.8 0.3 | 7.4 1 | 8.5 0.8 | 8.7 0.4 | 7.0 1 | 8.0 2 | 7.4 2 | 6.4 2 | N/A | 7.4 N/A | N/A | 6.7 N/A | |
| Photosystem I (PsaC) amol/cell | Without | 0.71 0.5 | N/A | 0.74 0.4 | N/A | 0.65 0.3 | N/A | 0.51 0.2 | N/A | 0.46 0.3 | N/A | 0.46 0.2 | N/A |
| With | 0.27 0.08 | N/A | 0.25 0.02 | N/A | 0.27 0.04 | N/A | 0.22 0.04 | N/A | 0.24 0.02 | N/A | 0.28 0.03 | N/A | |
| Photosystem II (PsbA) mmol/mol Chla | Without | 1.28 0.4 | N/A | 1.38 0.7 | N/A | 1.51 0.6 | N/A | 1.60 0.7 | N/A | 1.48 0.7 | N/A | 1.31 0.7 | N/A |
| With | 1.09 0.4 | N/A | 1.14 0.5 | N/A | 1.26 0.7 | N/A | 1.30 0.6 | N/A | 0.94 0.2 | N/A | 1.02 0.3 | N/A | |
| Photosystem II (PsbA) amol/cell | Without | 0.17 0.04 | N/A | 0.20 0.1 | N/A | 0.20 0.08 | N/A | 0.17 0.06 | N/A | 0.17 0.07 | N/A | 0.19 0.09 | N/A |
| With | 0.16 0.05 | N/A | 0.19 0.09 | N/A | 0.20 0.1 | N/A | 0.15 0.08 | N/A | 0.12 0.03 | N/A | 0.15 0.04 | N/A | |
| Total protein content pg/cell | Without | 0.68 0.2 | N/A | 0.67 0.1 | N/A | 0.65 0.2 | N/A | 0.56 0.1 | N/A | 0.54 0.1 | N/A | 0.53 0.1 | N/A |
| With | 0.59 0.2 | N/A | 0.69 0.2 | N/A | 0.78 0.2 | N/A | 0.59 0.1 | N/A | 0.57 0.1 | N/A | 0.56 0.1 | N/A | |
| Microcystin fmol/cell | Without | 0.24 0.1 | N/A | 0.16 0.1 | N/A | 0.34 0.2 | N/A | 0.18 0.1 | N/A | 0.25 0.1 | N/A | 0.21 0.1 | N/A |
| With | 0.27 0.1 | N/A | 0.25 0.2 | N/A | 0.15 0.1 | N/A | 0.19 0.1 | N/A | 0.11 0.05 | N/A | 0.26 0.2 | N/A |
| Variable | Night lighting | 6:40 | 8:40 | 10:40 | 12:40 | 14:40 | 16:40 | 18:40 | 20:40 | 22:40 | 00:40 | 02:40 | 04:40 |
|---|---|---|---|---|---|---|---|---|---|---|---|---|---|
| αchl mg C mg Chl−1h−1 (µmol m−2 s−1)−1 | Without | 0.042 0.004 | 0.038 0.006 | 0.036 0.002 | 0.033 0.006 | 0.036 0.007 | 0.039 0.006 | 0.040 0.005 | 0.047 0.003 | 0.051 N/A | 0.052 N/A | 0.046 N/A | 0.035 N/A |
| With | 0.043 0.005 | 0.035 0.006 | 0.05 0.02 | 0.045 0.02 | 0.039 0.02 | 0.038 0.007 | 0.045 0.02 | 0.038 0.02 | N/A | 0.058 N/A | N/A | 0.057 N/A | |
| mg C mg Chl−1h−1 | Without | 6.9 1 | 7.2 0.8 | 7.1 0.5 | 8.5 1.4 | 9.0 4 | 9.6 5 | 7.8 0.7 | 8.0 0.8 | 8.9 N/A | 7.2 N/A | 6.1 N/A | 7.3 N/A |
| With | 6.8 0.3 | 7.4 1 | 8.5 0.8 | 8.7 0.4 | 7.0 1 | 8.0 2 | 7.4 2 | 6.4 2 | N/A | 7.4 N/A | N/A | 6.7 N/A | |
| Photosystem I (PsaC) amol/cell | Without | 0.71 0.5 | N/A | 0.74 0.4 | N/A | 0.65 0.3 | N/A | 0.51 0.2 | N/A | 0.46 0.3 | N/A | 0.46 0.2 | N/A |
| With | 0.27 0.08 | N/A | 0.25 0.02 | N/A | 0.27 0.04 | N/A | 0.22 0.04 | N/A | 0.24 0.02 | N/A | 0.28 0.03 | N/A | |
| Photosystem II (PsbA) mmol/mol Chla | Without | 1.28 0.4 | N/A | 1.38 0.7 | N/A | 1.51 0.6 | N/A | 1.60 0.7 | N/A | 1.48 0.7 | N/A | 1.31 0.7 | N/A |
| With | 1.09 0.4 | N/A | 1.14 0.5 | N/A | 1.26 0.7 | N/A | 1.30 0.6 | N/A | 0.94 0.2 | N/A | 1.02 0.3 | N/A | |
| Photosystem II (PsbA) amol/cell | Without | 0.17 0.04 | N/A | 0.20 0.1 | N/A | 0.20 0.08 | N/A | 0.17 0.06 | N/A | 0.17 0.07 | N/A | 0.19 0.09 | N/A |
| With | 0.16 0.05 | N/A | 0.19 0.09 | N/A | 0.20 0.1 | N/A | 0.15 0.08 | N/A | 0.12 0.03 | N/A | 0.15 0.04 | N/A | |
| Total protein content pg/cell | Without | 0.68 0.2 | N/A | 0.67 0.1 | N/A | 0.65 0.2 | N/A | 0.56 0.1 | N/A | 0.54 0.1 | N/A | 0.53 0.1 | N/A |
| With | 0.59 0.2 | N/A | 0.69 0.2 | N/A | 0.78 0.2 | N/A | 0.59 0.1 | N/A | 0.57 0.1 | N/A | 0.56 0.1 | N/A | |
| Microcystin fmol/cell | Without | 0.24 0.1 | N/A | 0.16 0.1 | N/A | 0.34 0.2 | N/A | 0.18 0.1 | N/A | 0.25 0.1 | N/A | 0.21 0.1 | N/A |
| With | 0.27 0.1 | N/A | 0.25 0.2 | N/A | 0.15 0.1 | N/A | 0.19 0.1 | N/A | 0.11 0.05 | N/A | 0.26 0.2 | N/A |
Results that are significantly different are underlined.
Means ± standard deviations (in italics below the means) for Pchlmax, αchl, photosystem I and photosystem II concentration, total cellular protein content and microcystin content
| Variable | Night lighting | 6:40 | 8:40 | 10:40 | 12:40 | 14:40 | 16:40 | 18:40 | 20:40 | 22:40 | 00:40 | 02:40 | 04:40 |
|---|---|---|---|---|---|---|---|---|---|---|---|---|---|
| αchl mg C mg Chl−1h−1 (µmol m−2 s−1)−1 | Without | 0.042 0.004 | 0.038 0.006 | 0.036 0.002 | 0.033 0.006 | 0.036 0.007 | 0.039 0.006 | 0.040 0.005 | 0.047 0.003 | 0.051 N/A | 0.052 N/A | 0.046 N/A | 0.035 N/A |
| With | 0.043 0.005 | 0.035 0.006 | 0.05 0.02 | 0.045 0.02 | 0.039 0.02 | 0.038 0.007 | 0.045 0.02 | 0.038 0.02 | N/A | 0.058 N/A | N/A | 0.057 N/A | |
| mg C mg Chl−1h−1 | Without | 6.9 1 | 7.2 0.8 | 7.1 0.5 | 8.5 1.4 | 9.0 4 | 9.6 5 | 7.8 0.7 | 8.0 0.8 | 8.9 N/A | 7.2 N/A | 6.1 N/A | 7.3 N/A |
| With | 6.8 0.3 | 7.4 1 | 8.5 0.8 | 8.7 0.4 | 7.0 1 | 8.0 2 | 7.4 2 | 6.4 2 | N/A | 7.4 N/A | N/A | 6.7 N/A | |
| Photosystem I (PsaC) amol/cell | Without | 0.71 0.5 | N/A | 0.74 0.4 | N/A | 0.65 0.3 | N/A | 0.51 0.2 | N/A | 0.46 0.3 | N/A | 0.46 0.2 | N/A |
| With | 0.27 0.08 | N/A | 0.25 0.02 | N/A | 0.27 0.04 | N/A | 0.22 0.04 | N/A | 0.24 0.02 | N/A | 0.28 0.03 | N/A | |
| Photosystem II (PsbA) mmol/mol Chla | Without | 1.28 0.4 | N/A | 1.38 0.7 | N/A | 1.51 0.6 | N/A | 1.60 0.7 | N/A | 1.48 0.7 | N/A | 1.31 0.7 | N/A |
| With | 1.09 0.4 | N/A | 1.14 0.5 | N/A | 1.26 0.7 | N/A | 1.30 0.6 | N/A | 0.94 0.2 | N/A | 1.02 0.3 | N/A | |
| Photosystem II (PsbA) amol/cell | Without | 0.17 0.04 | N/A | 0.20 0.1 | N/A | 0.20 0.08 | N/A | 0.17 0.06 | N/A | 0.17 0.07 | N/A | 0.19 0.09 | N/A |
| With | 0.16 0.05 | N/A | 0.19 0.09 | N/A | 0.20 0.1 | N/A | 0.15 0.08 | N/A | 0.12 0.03 | N/A | 0.15 0.04 | N/A | |
| Total protein content pg/cell | Without | 0.68 0.2 | N/A | 0.67 0.1 | N/A | 0.65 0.2 | N/A | 0.56 0.1 | N/A | 0.54 0.1 | N/A | 0.53 0.1 | N/A |
| With | 0.59 0.2 | N/A | 0.69 0.2 | N/A | 0.78 0.2 | N/A | 0.59 0.1 | N/A | 0.57 0.1 | N/A | 0.56 0.1 | N/A | |
| Microcystin fmol/cell | Without | 0.24 0.1 | N/A | 0.16 0.1 | N/A | 0.34 0.2 | N/A | 0.18 0.1 | N/A | 0.25 0.1 | N/A | 0.21 0.1 | N/A |
| With | 0.27 0.1 | N/A | 0.25 0.2 | N/A | 0.15 0.1 | N/A | 0.19 0.1 | N/A | 0.11 0.05 | N/A | 0.26 0.2 | N/A |
Results that are significantly different are underlined.
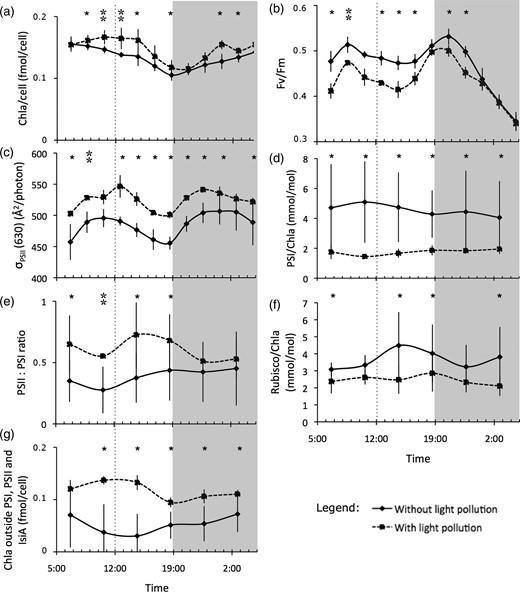
Diel patterns (means ± standard deviation error bars) of the variables that showed significant differences (*) at most sampling times during the light pollution treatment: (a) intracellular chlorophyll a concentration, (b) maximum quantum yield of charge separation, (c) photosystem II (PSII) functional absorption cross-section at 630 nm, (d) ratio of photosystem I (PSI) to chlorophyll a, (e) ratio of PSII to PSI, (f) ratio of the number of Rubisco to chlorophyll molecules and (g) chlorophyll a not bound to the two photosystems and IsiA. Significant differences where normality could not be verified are represented by **. Darkened areas represent the nighttime. The maximum of the sinusoidal irradiance regime was reached at 12:00 (dotted line). Spline curve fits to the measurement points were added as a visual aid.
Daytime irradiance conditions remained constant over the 3 weeks in both cultures (data not shown). An increase in Chla concentration in culture 1 (∼400 µg/L compared with 300 µg/L in culture 2) was observed during the last week, but this did not lead to any changes in other biomass-specific properties compared with Week 1 in this culture. The chlorophyll-binding protein IsiA was detected in low quantities (between 3 and 17 IsiA / PSI trimer, not shown) in Week 1, but not in the following weeks. The results for intracellular microcystin,  , αchl, PSII per cell or per Chla, PSI per cell, the total protein content per cell and the growth rate (not shown) did not show significant differences in the presence of light pollution for most of the sampling times (Table I). Other variables (Fig. 1), however, did show significant differences with light pollution.
The Chla per cell (Fig. 1a) was higher and a maximum at midday appeared in the presence of light pollution. In cyanobacteria, Chla is mostly associated with PSI (e.g. Rakhimberdieva et al., 2001). Since the number of Chla molecules per PSI is fixed (Ferreira et al., 2004), the Chla increase suggests an increase either in the number of PSI per cell or the presence of Chla in other chlorophyll-binding proteins. The values of Fv/Fm showed strong diel variations whether or not there was night lighting (Fig. 1b) and were significantly lower during daylight in the presence of nighttime light pollution. The differences between the presence and the absence of light pollution were significant during daylight and the first 4h of the dark period. The values of σPSII(630) were significantly higher in the presence of light pollution. The σPSII(630) followed similar diel patterns both in the presence and absence of light pollution and varied by as much as 15% during daylight (Fig. 1c).
The number of PSI per Chla was lower in the presence of light pollution (a factor of about three during daytime, Fig. 1d). Since the decrease in PSI per Chla was greater than the decrease in PSI per cell, which was a factor of ∼2 (see Table I), this suggests that the chlorophyll outside the PSI also increased. As the PSII concentration did not change in the presence of nighttime lighting (see Table 1), the ratio of PSII to PSI was thus higher during the daylight hours in the presence of light pollution (Fig. 1e). Because the Chla concentration per cell increased in the presence of light pollution, the Rubisco normalized to Chla (Fig. 1f) was significantly lower in the presence of light pollution at most sampling times.
Using a value of 100 Chla per PSI, 36 Chla per PSII and 12 Chla per IsiA (Fraser et al., 2013), we found that the fraction of chlorophyll not bound to these protein complexes was much higher during the light pollution treatment (Fig. 1g). Taken together, these results suggest that this extraneous Chla is likely associated with chlorophyll-binding proteins other than IsiA. These chlorophyll-binding proteins may act as an antenna and pass the absorbed light energy to PSI under light pollution. Moreover, because these extraneous Chla molecules can fluoresce but would not have any variable fluorescence due to their association to PSI, this would artificially reduce Fv/Fm. This increase in PSI absorption was apparently compensated by an increase in phycocyanin absorption at PSII (higher σPSII[630]).
There are no other studies on the effects of light pollution on phytoplankton. However, in the absence of light pollution, our results are consistent with previous studies on cyanobacteria. The decrease in values of Fv/Fm during the maximum irradiance period could be attributed to photoinhibition. This is comparable with what has been observed during the daytime in outdoor photobioreactors containing cultures of Spirulina platensis (Torzillo et al., 1998) as well as in nature for various species (Zhang et al., 2008). Diel Chla variations per cell observed in the absence of light pollution are similar to those measured in the laboratory for Prochlorococcus strains by Jacquet et al. (Jacquet et al., 2001), who showed an increase at night and a minimum during the day.
We attempted to reproduce the nearshore surface conditions of an urban lake lit by lampposts. We observed substantial effects in the laboratory, and further fieldwork is now required to extrapolate these findings to the natural environment. We did not see an effect on growth rates, but our study showed that nighttime irradiance levels comparable with nearshore light pollution in lakes can influence other aspects of the photophysiology of M. aeruginosa.
FUNDING
This study was supported through a Natural Sciences and Engineering Research Council of Canada Discovery Grant, the Fonds québécois de la recherche sur la nature et les technologies du Québec (FQRNT) New Researcher Start-Up Program, and the Canada Research Chair program to YH. In addition, FQRNT's Programme de recherche pour les enseignants de collège supported MHL.
ACKNOWLEDGMENTS
We thank Audrey Barnett, Doug Campbell and his team, Patrick Cliche, Mariette Lambert, Jean-Philippe Morin, Rosalie Parent, Catherine Brown, Geneviève Levasseur, Christophe Provencher-Rouette and Jackie Zorz for their help on different aspects of this study.
REFERENCES
Author notes
Corresponding editor: Beatrix E. Beisner
