

Abstract
The scale and extent of global urbanization are unprecedented and increasing. As urbanization generally encroaches on natural habitats and the urban ecological footprint reaches far beyond the city limits, how urbanization affects biodiversity has received increasing attention from the scientific community. Nonetheless, the comprehensive syntheses of urbanization consequences for biodiversity, including diverse taxonomic groups, across multiple spatial scales and spanning a wide gradient range of urbanization intensity are still insufficient. Here, based on the urban-rural gradient approach, we assessed the effects of urbanization on Chinese mammal and amphibian richness across the entire urbanization gradient (i.e., urbanization level from 0 to 1) at the national, regional and urban agglomeration scales. We used the global mammal and amphibian distribution data along with corresponding background climate, habitat conditions and socioeconomic activities data for analysis. Our results revealed a detailed and diverse pattern of Chinese mammal and amphibian richness along the entire spectrum of urbanization gradient across three spatial scales. And an approximately monotonic decrease only existed in certain urban agglomerations. The imprint of urbanization on mammal and amphibian richness were largely masked by the overall primacy of background climate at the national and regional scales. As the scale of analysis shifting from the country to urban agglomerations, urbanization-associated variables and locally specific limiting factors started to play important roles in driving the richness patterns. Moreover, the environmental Kuznets curve hypothesis can explain the relationship between biodiversity pressure and urbanization activities in certain Chinese urban agglomerations. However, the findings of urbanization effects on biodiversity using the urban-rural gradient analysis should be interpreted with caution because many possible driving forces simultaneously present along the urban-rural gradient and are very challenging to attribute.
Export citation and abstract BibTeX RIS

Original content from this work may be used under the terms of the Creative Commons Attribution 4.0 licence. Any further distribution of this work must maintain attribution to the author(s) and the title of the work, journal citation and DOI.
1. Introduction
The maintenance of biodiversity is vital for ecosystem function and services delivery, including supplying nutritious food, fresh air and clean water, regulating climate and disease, and providing recreational, cultural and spiritual benefits (McKinney 2002, Miller 2005, Botzat et al 2016). However, in the context of global environmental change (e.g., climate change, air and water pollution) and increasing influence of anthropogenic activities, many of the Earth's biota are facing unprecedented threats (Novacek and Cleland 2001). More than 28,000 species worldwide are currently threatened with extinction, accounting for 27% of the total of all assessed species, among which one-quarter are mammals and over 40% are amphibians, and the number is still rising (McGill et al 2015). Urbanization, as the most drastic and irreversible land-use transformation process on earth, has been widely identified as one of the major causes for biodiversity loss and biotic homogenization (Grimm et al 2008, Hahs et al 2009, Seto et al 2012). Urbanization encroaches on natural habitats driving habitat loss and fragmentation, negatively affecting the viability and persistence of local species communities, especially for those with larger body size and home range (Šálek et al 2015, Saito and Sonoda 2017). Urbanization also has indirect impacts on biodiversity via a suite of urbanization-induced environmental changes (e.g., urban heat island effects and pollution, Seto et al 2013, Zhou et al 2014). In addition, the socioeconomic activities associated with urban development often coincide with the consumption of large amounts of natural resources and the discharge of pollutants, increasing the environmental stresses to biodiversity (Kinzig et al 2005, Faeth et al 2011, McDonald et al 2019).
More importantly, the existing urban footprints and planned urban expansion has already and will continue to affect biodiversity in the Alliance for Zero Extinction (AZE) sites, protected areas and Earth's most biologically rich yet threatened hotspots (McDonald et al 2008, Seto et al 2011, Seto et al 2012). With the inevitable global urbanization progress encroaching on more and more natural habitats, cities have become important habitats for many species, leading to growing research on urban wildlife over the past two decades (Magle et al 2012, Rupprecht et al 2015). Many studies have examined the effects of urbanization on species richness from different perspectives, but the results of these studies are often context- and scale-dependent. For example, the natural habitat loss, habitat fragmentation and degradation caused by urbanization may lead to the decrease in richness or abundance of 'urban avoider' species whereas 'urban adapter' or 'urban exploiter' species might benefit from the heterogeneous landscape and human-provided resources in urban areas (McKinney 2002). Hope et al (2003) reported that plant diversity in Phoenix, Arizona, a city in the desert, increased with urbanization thanks to intensive human management such as irrigation and fertilization in urban landscape. In a global analysis of urbanization impacts, Aronson et al (2014) found that despite most of birds and plants in these cities were native, the species density in urban areas were much lower than that in non-urban areas; the anthropogenic factors including land cover and urban age accounted more for the current species density and species density loss than the non-anthropogenic factors (e.g. geography, climate and topography). A review made by McKinney (2008) indicated that plant and animal species richness tended to decrease in urban areas with extreme urbanization but plant richness in most of the studies peaked at intermediate levels of urbanization. It is therefore imperative to explore urbanization effects on different taxonomic groups, across multiple spatial scales and spanning a wide gradient range of urbanization intensity for a robust and generalized understanding of urbanization consequences for biodiversity.
China is one of the Earth's megadiverse countries with large numbers of endemic species (Brooks et al 2006), it is also among seven nations responsible for more than half of global biodiversity loss (Waldron et al 2017). China has witnessed unprecedented urbanization over the past several decades (Zhao et al 2015a, Zhao et al 2015b) and is expected to be the key region where future global urban expansion will occur by 2030 (Seto et al 2012). As a biologically rich but deeply threatened environment, combined with the vast territory, diverse climates and landscapes, and unprecedented pace of urbanization, China provides an ideal setting in which to study urbanization impacts on biodiversity, yet comprehensive research is still lacking in China, particularly over large geographic regions (Magle et al 2012, Mao et al 2015).
Because temporal data of urbanization dynamics are often difficult to obtain, particularly across large spatial areas, the urban-rural gradient has been widely used as an effective space-for-time substitution to assess urbanization effects (e.g., McDonnell and Pickett 1990, Zhao et al 2016, Jia et al 2018). Typically, the increasing replacement of natural habitats by impervious surfaces from rural areas to urban centers is a significant characteristic of urbanization, therefore the ratio of impervious surfaces can be used as a quantitative indicator of the urban-rural gradient. Most of the existing urban-rural gradient work on urbanization consequences for biodiversity focused on limited urbanization gradient (e.g., three levels of low, moderate and high) and/or individual or a few cities (e.g., Klimant et al 2015, MacGregor-Fors et al 2015, Lagucki et al 2017).
In this study, based on the urban-rural gradient approach, we assessed the effects of urbanization on Chinese mammal and amphibian richness across the entire urbanization gradient (i.e., urbanization level from 0 to 1) at the national, regional and urban agglomeration scales using the global mammal and amphibian distribution data, along with corresponding background climate, habitat conditions and socioeconomic activities. We aimed to answer the following questions: (1) what are the patterns and drivers of mammal and amphibian richness along the urban-rural gradients in China? (2) do the patterns and drivers vary among different spatial scales? and (3) do the patterns and drivers vary between mammals and amphibians?
2. Methods
2.1. Study area
China, as one of the Earth's megadiverse countries, has 58 families, 248 genera, 693 mammalian species and 11 families, 64 genera, 398 amphibian species (including 20 subspecies and 4 introduced species) (Yao 2014, Jiang et al 2015). Here we examined the patterns and drivers of Chinese mammal and amphibian richness along the urban-rural gradients at national, regional and urban agglomeration scales, respectively. China consists of six major geographical regions: North China, Northeast China, East China, Central-south China, Southwest China and Northwest China (Fang et al 2001, Zhao et al 2018). Eight urban agglomerations we selected are Yangtze River Delta (YRD), Pearl River Delta (PRD), Beijing-Tianjin-Hebei (BTH), Shandong Peninsula (SDP), Liaodong Peninsula (LDP), Wuhan (WH), Central Henan (CH), Chengyu (CY) (figure 1).

Figure 1. The study area with the background showing the land cover map of China in the year 2000. The study was conducted on multiple scales of entire country, six regions and eight urban agglomerations.
Download figure:
Standard image High-resolution image2.2. Biodiversity data
The biodiversity data were derived from the global mammal and amphibian richness grid data compiled by International Union for Conservation of Nature (IUCN) and Columbia University's Center for International Earth Science Information Network (CIESIN). Spatial resolution of the data was 1 km by 1 km. The presence grid data for mammals and amphibians were developed for the year around 2008 and 2004, respectively.
2.3. Climate data
Climate data were extracted from WorldClim (version 2.0), a global gridded climate dataset with a spatial resolution of 1 km by 1 km, including average monthly climate data of minimum, mean, and maximum temperature and precipitation for 1970–2000 (Fick and Hijmans 2017). Following recent advances in the understanding of extreme climate events and their relevance to biodiversity (Ummenhofer and Meehl 2017, Wieczynski et al 2018, Maxwell et al 2019), besides Annual Mean Temperature (AMT) and Annual Precipitation (AP), we also chose four relevant extreme climate variables to reflect diurnal and seasonal asymmetry of climate change. They were Mean Diurnal Range (MDR, monthly maximum and minimum temperature differences), Max Temperature of Warmest Month (MTWM), Min Temperature of Coldest Month (MTCM), and Precipitation of Driest Month (PDM).
2.4. Habitat conditions
The habitat conditions for the year 2000 were derived from China's National Land Use and Cover Change (CNLUCC) dataset with a spatial resolution 30 m by 30 m (Xu et al 2018). We reclassified the habitat types into six categories: Woodland, Grassland, Wetland, Arable land, Impervious surface and Other land (figure 1 and table S1 is available online at stacks.iop.org/ERC/2/125002/mmedia). The area fraction of each habitat type within 1 km by 1 km grid was calculated. The Shannon's Diversity Index (SHDI) (Shannon 1949, Nagendra 2002), which reflects both the richness and evenness of landscape components was also calculated as:

where N represents the number of habitat types and Pi the proportion occupied by habitat type i in each 1 km by 1 km grid. The index (≥0) increases as the number of different habitat type increases and/or the proportional distribution of area among habitat types becomes more equitable. When SHDI equals to 0 it means there is only one habitat type in the grid.
2.5. The urban-rural gradient approach
The urban-rural gradient approach, adopted the concept of gradient analysis developed from the study on spatial patterns of vegetation (Whittaker 1975). This approach has been applied in urban ecology to investigate the urbanization impacts on urban flora and fauna as well as ecosystem properties (e.g., Ahrné et al 2009, Aronson et al 2015). The physical and biological parameters change along a transect that crosses various parts of the urban to rural environment (Luck and Wu 2002, McKinney 2006). It is well-believed that a higher ratio of impervious surfaces is associated with a higher degree of anthropogenic disturbance (McKinney 2002, Peng et al 2018). Hence in this study, the urbanization intensity (UI), expressed as the fraction of impervious surface area in each 1 km by 1 km grid was used to define the entire urban-rural gradient from 0 (least-disturbed) to 1 (most-disturbed). The UI was derived and calculated using the same CNLUCC dataset as the habitat conditions. And the CNLUCC data showed that the urbanization intensity of China in 2000 was higher in the eastern coastal areas and gradually decreased toward inland areas (figure S1).
In addition, the nighttime lights (NL), a good proxy for population and economic phenomena, were included to reflect socioeconomic activities (Tang et al 2013, Nordhaus and Chen 2015). The nighttime lights data were extracted from the DMSP-OLS Night-time lights Dataset (Version 4), which was processed and distributed by the National Oceanic and Atmospheric Administration's National Geophysical Data Center (NOAA-NGDC). These night-time satellite imageries recorded the amount of light emissions observed from the Earth's surface, and the stable lights data collected by the DMSP satellite F15 in 2000 were used in this study.
2.6. Analyses
The patterns of Chinese mammal and amphibian richness within each urbanization intensity bin (i.e., 0.05 interval) across the entire urbanization gradient (i.e., urbanization level from 0 to 1) were first generated. To identify possible drivers of Chinese mammal and amphibian richness along the urban-rural gradients, 14 aforementioned variables including six climate variables, six habitat condition variables, two urbanization-related variables (UI and NL) were then used as the driving factors. Pearson correlations and stepwise multiple linear regressions were performed to identify the best predictors and their explanatory power for the richness patterns. These analyses were conducted at national, regional and urban agglomeration scales, respectively. The ArcMap 10.2, R 4.0.2 and SPSS 16.0 were used for the analyses.
3. Results
3.1. Richness distribution patterns and drivers at the national scale
The richness of Chinese mammals and amphibians per grid cell across the country ranged from 1 to 141 and from 1 to 48, respectively (figures 2, S2). The variation in amplitude of amphibian richness was smaller than that of mammals but both taxa's richness exhibited a similar spatial distribution pattern along the urban-rural gradient across the country. From the least-disturbed to the lowly-disturbed area (0 ≤ UI < 0.25, the average richness of both taxa mounted up to their peaks and then declined. And from the lowly-disturbed area to the highly-disturbed area (0.25 ≤ UI < 0.95), the average richness of Chinese mammals slowly climbed up with increasing urbanization intensity, while increasing trend of amphibian richness was relatively slight. Besides, a significant decline in richness was observed for both taxa from the highly- disturbed area to the most-disturbed area (0.95 ≤ UI ≤ 1).
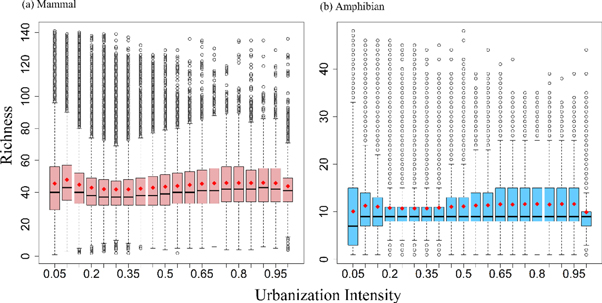
Figure 2. Richness distribution patterns of mammals (a) and amphibians (b) along the urban-rural gradient across China. The urbanization intensity was expressed by the fraction of impervious surface in a 1 km by 1 km grid. The medians, the 25th and 75th percentiles were showed in the bars. The red diamonds and circles represent the means and outliers.
Download figure:
Standard image High-resolution imageAt the national scale both Chinese mammal and amphibian richness's variation along the urban-rural gradient can be well explained by the climate factors (57.7% for mammals; 72.1% for amphibians; table 1). In addition, the fraction of woodland area (38.4%) also played an important role in explaining the variation in mammal richness. When considering the co-effects of all independent variables, mammal richness was negatively correlated to Mean Diurnal Range (51.2%) and Min Temperature of Coldest Month (5.5%), while positively correlated to urbanization intensity (0.7%). Contrastingly, the amphibian richness was negatively affected by urbanization intensity (18.7%). Both taxa's richness was negatively correlated with the fraction of other land area.
Table 1. Pearson correlation (r) and stepwise multiple linear regression (R2) analyses to identify possible drivers for urban-rural distribution of mammal and amphibian richness at the national scale.
| Mammal | Amphibian | |||||
|---|---|---|---|---|---|---|
| Variables | r | beta | R2 | r | beta | R2 |
| AMT | −0.17* | 0.313** | ||||
| MDR | −0.322** | −0.041 | 51.2% | −0.629*** | ||
| MTWM | −0.475*** | −0.095 | ||||
| MTCM | 0.042 | −0.481 | 5.5% | 0.531*** | ||
| AP | 0.502*** | 0.684 | 1.0% | 0.849*** | 0.876 | 72.1% |
| PDM | 0.350*** | 0.734*** | ||||
| UI | −0.041 | 0.623 | 0.7% | 0.094 | −0.043 | 18.7% |
| Woodland | 0.620*** | 1.117 | 38.4% | 0.274** | 0.665 | 2.1% |
| Grassland | 0.449*** | 0.099 | ||||
| Wetland | 0.203* | 0.200* | ||||
| Arable Land | −0.212* | −0.226* | ||||
| Other land | 0.145 | −0.196 | 0.6% | −0.104 | −0.358 | 3.0% |
| SHDI | −0.39*** | −0.103 | ||||
| NL | 0.072 | 0.149 | ||||
| Total Explanation | 97.4% | 95.9% | ||||
*p-value <0.05 **p-value <0.01 ***p-value <0.001.
3.2. Richness distribution patterns and drivers at the regional scale
At the regional scale, both similarities and differences in the spatial distribution patterns and drivers of richness among regions and between taxa were observed (figures 3 and 4). For example, mammal and amphibian richness in East China and Central-south China exhibited a similar horizontal 'S' mode distribution pattern along the urban-rural gradient (figures 3(c), (d), (i), (j)). That is, their average richness first decreased (0 ≤ UI < 0.25) then increased till the urbanization intensity reached around 0.9, and both taxa's richness declined afterwards. As for mammals in Northwest and Northeast China and for amphibians in North China, their average richness remained nearly constant with increasing urbanization intensity, except that there was an obvious decrease (figure 3(b)) or increase (figures 3(f), (g)) in richness from the least-disturbed to the lowly-disturbed area. The average richness of mammals and amphibians in Southwest China exhibited a first- increase- then- decrease pattern along the urban-rural gradient (figures 3(e), (k)). Contrastingly, the average richness of mammals in North China and amphibians in Northeast China showed a concave distribution along the urban-rural gradient (figures 3(a), (h)).
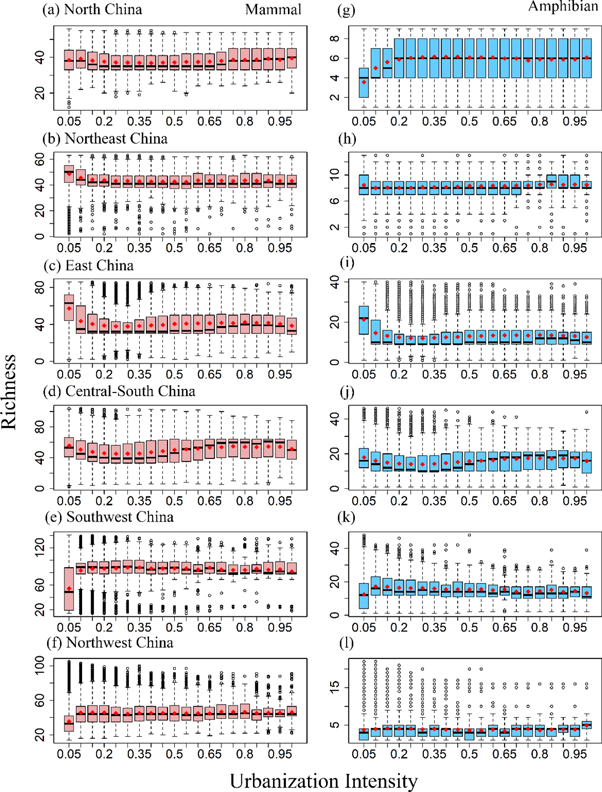
Figure 3. Richness distribution patterns of mammals and amphibians along the urban-rural gradient at the regional scale. North China (a), (g), Northeast China (b), (h), East China (c), (i), Central-south China (d), (j), Southwest China (e), (k) and Northwest China (f), (l). The box plot parameters are the same as figure 2.
Download figure:
Standard image High-resolution image
Figure 4. Pearson correlation (a) and stepwise multiple linear regression (b) analyses to identify possible drivers for urban-rural distribution of mammal and amphibian richness in six regions. Pearson correlation coefficients shown in blank are statistically insignificant (p > 0.05), otherwise significant. The circles in the multiple regressions represent positive linear regression coefficients, otherwise negative.
Download figure:
Standard image High-resolution imageThe distribution patterns of mammal and amphibian richness along the urban-rural gradients in six regions were related to climate background, habitat conditions and urbanization-related factors (figures 4(a), (c)). For both taxa, there were significant positive correlations between Annual Mean Temperature, Annual Precipitation, Precipitation of Driest Month and average richness in most regions whereas the Mean Diurnal Range of Temperature, Shannon's Diversity Index were significantly negatively correlated with average richness in most cases (p < 0.05). Urbanization intensity was significantly positively correlated to mammal and amphibian average richness in North China and Central-south China, while negatively correlated in East China. In Northeast China the urbanization intensity was negatively correlated to mammal average richness but positively correlated to amphibian average richness. The correlation between night-time lights and both taxa's richness was analogous to that of urbanization intensity (figures 4(a), (c)).
When considering all driving factors for richness patterns, the dominant drivers and their explanatory powers varied between two taxa among different regions (figures 4(b), (d)). In North China, Shannon's diversity index was the most important drivers for mammals (59.3%) while Annual Precipitation played a more important role for amphibians (93.1%). In Northeast China, mammal richness was most negatively affected by Max Temperature of Warmest Month (80.4%) whereas amphibian richness was most affected by Precipitation of Driest Month (85.1%). In Southwest China, temperature-related factors including Min Temperature of Coldest Month (52.9%) and Annual Mean temperature (24.6%) contributed more to mammal average richness than water-related factors, while the amphibian average richness was negatively affected by Urbanization Intensity (39.9%) and positively affected by Precipitation of Driest Month (21.2%). In Northwest China, both mammal and amphibian average richness were positively affected by Annual Precipitation, while the ratio of other land area negatively affected richness patterns of mammals and amphibians. In some instances, similar drivers and effects were observed for both taxa in different regions. For example, precipitation-related drivers explained more than 80% of the variation in richness patterns in both taxa along the urban-rural gradients in East China and Central-south China. The primary driving factor was Annual Precipitation for East China and Precipitation of Driest Month for Central-south China, respectively.
3.3. Richness distribution patterns and drivers at the urban-agglomeration scale
At the urban-agglomeration scale, the patterns of richness distribution were more converged between taxa and among urban agglomerations relative to those at the national and regional scales (figure 5). Both mammals in Liaodong Peninsula, Wuhan and amphibians in Central Henan, Chengyu urban agglomerations exhibited a simple downward spatial distribution pattern along the urban-rural gradients (figures 5(e), (f), (o), (p)). The average richness for mammals and amphibians in Pearl River Delta and amphibians in Shandong Peninsula, Liaodong Peninsula and Wuhan urban agglomerations remained nearly unchanged along the urban-rural gradients (figures 5(b), (j), (l), (m), (n)). The average richness of mammals and amphibians in Yangtze River Delta showed a first-decrease-then-increase distribution pattern with increasing urbanization, followed by a further decrease from the highly-disturbed area to the most-disturbed area (0.95 ≤ UI < 1, figures 5(a), (i)). There existed a U-shaped pattern of mammal richness with higher values at two ends along the urban-rural gradients in Beijing-Tianjin-Hebei and Central Henan urban agglomerations (figures 5(c), (g)).

Figure 5. Richness distribution patterns of mammals and amphibians along the urban-rural gradient at the administrative scales. Yangtze River Delta (a), (i), Pearl River Delta (b), (j), Beijing-Tianjin-Hebei (c), (k), Shandong Peninsula (d), (l), Liaodong Peninsula (e), (m), Wuhan (f), (n), Central Henan (g), (o), Chengyu (h), (p). The box plot parameters are the same as figure 2.
Download figure:
Standard image High-resolution imageThe climate factors still played an important role in both taxa's richness distribution, generally with temperature-related factors and water-related factors being the dominant drivers for mammals and amphibians in the urban agglomerations, respectively (figures 6(b), (d)). However, at this spatial scale, the impacts of urbanization and habitat conditions on mammal and amphibian richness started to manifest. A significantly positive correlation between urbanization intensity and mammal average richness emerged in most of the urban agglomerations except Liaodong Peninsula, Wuhan, Chengyu urban agglomerations. In contrast, the urbanization intensity was negatively correlated to amphibian average richness under most circumstances excluding in Pearl River Delta and Beijing-Tianjin-Hebei urban agglomerations (figures 6(a), (c)). When considering all driving factors, the urbanization intensity also contributed to mammal richness distribution patterns in Pearl River Delta (35%) and Wuhan urban agglomerations (33.2%). However, the impacts of urbanization intensity on amphibians in all urban agglomerations were masked by other explanatory variables (figures 6(b), (d)). For example, the Night-time lights contributed to amphibian richness distribution patterns in half of the urban agglomerations, especially in Central Henan (63.1%, figure 6(d)). Meanwhile, in most urban agglomerations, the ratio of woodland area and grassland area had positive impacts on both taxa's richness distribution, whereas the ratio of arable land area had the opposite effects. It should be noted that the mammal richness distribution in Beijing-Tianjin-Hebei was greatly and negatively affected by the Shannon diversity index (58.4%, figures 6(a), (b)).

Figure 6. Pearson correlation (a) and stepwise multiple linear regression (b) analyses to identify possible drivers for urban-rural distribution of mammal and amphibian richness in eight urban agglomerations. The correlation and regression plot parameters are the same as figure 4.
Download figure:
Standard image High-resolution image
4. Discussion
4.1. The urban-rural gradient of Chinese mammal and amphibian richness
The patterns of biodiversity along the urban-rural gradient can reveal the urbanization influence on biodiversity because spatial urbanization gradients have been regarded as a substitution of temporal trajectories of urbanization (La Sorte et al 2018). Using a continuous measure of urbanization intensity from 0 to 1 to define the entire spectrum of urban-rural gradient, we found a detailed and diverse pattern of Chinese mammal and amphibian richness with increasing urbanization across the entire country and within the regions and urban agglomerations.
Along the urban-rural gradient across the country, a humped-shaped pattern existed within the low urbanization gradient with the peak at the urbanization intensity of approximately 0.1, followed by a slight upward trend with increasing urbanization, and then an evident decline occurred under extreme urbanization for both mammal and amphibian richness, which comprised a bimodal richness distribution pattern (figure 2). This finding clearly suggests that rural sites are not always the most biodiverse place and caution should be used when assessing urbanization effects on biodiversity, particularly across large spatial scales. Extremely high urbanization reduced the richness of Chinese mammal and amphibian, which agreed well with empirical perception because extreme expansion of urban extent will strongly reduce the available habitats for species, especially for the animals with larger body size and home range (Noss et al 1996, Riley et al 2003, Randa and Yunger 2006). A review of urbanization effects on plant and animal species richness derived from the studies across a wide geographic realm also concluded that non-avian terrestrial vertebrates possessed the most consistent lowest richness at high urbanization gradient. But the urban-rural gradients of that review were simply divided into three urbanization levels of low, intermediate and high, where the high urbanization level was defined as urbanization intensity over 0.5 (McKinney 2008). This study, spanning a very wide range of urbanization intensity from 0 to 1, also indicated that in some instances a distinct reduction in Chinese mammal and amphibian richness would occur with an urbanization intensity over 0.95.
The urban-rural gradient of Chinese mammal and amphibian richness within geographic regions showed diverse distribution patterns including horizontal 'S' mode distribution, hump-shaped distribution, concave distribution, no response, L-shaped and inverted L-shaped distribution (figure 3). A decreasing distribution pattern along the urban-rural gradient started to emerge at the urban agglomeration scale (figure 5). Some important observations can be made from the aforementioned urban-rural distribution patterns of Chinese mammal and amphibian richness. First, it is very challenging to identify any generalities on biodiversity patterns along the urban-rural gradient even though we examined the entire spectrum of urban-rural gradient and urbanization intensity was linearly increasing in this study. Urbanization is a complex phenomenon that involves human-nature coupled transformation in multiple dimensions including enormous changes in physical, environmental and socioeconomic characteristics and processes, and other natural and anthropogenic drivers might be nonlinear and/or may place contrasting impacts on the richness distribution along the urban-rural gradient (Pickett et al 2005, Zhao et al 2018). Second, diverse richness patterns along the urban-rural gradients revealed in this study can be related to that fact that we conducted a multi-scale assessment along an entire continuous spectrum of urbanization intensity across China spanning a wide range of natural ecological contexts as patterns are often background-context and scale dependent (McGill et al 2015). Third, with the focus of analysis shifting from large to small geographic spatial scale, the distribution characteristics locally constrained manifested. For example, in the Northwest region of China where water-energy are not sufficient, and both mammal and amphibian richness was the lowest among six geographic regions (table S2 and figure S3), richness of both taxa tended to increase in relatively high urbanization locations, suggesting that the urban environment (e.g., urban heat island effect) and management strategies (e.g., irrigation) might compensate for the natural constraints on the persistence of biodiversity (Shochat et al 2006). An approximately monotonic decrease in richness with increasing urbanization along the entire spectrum of urban-rural gradient only existed in certain urban agglomerations. The urban agglomerations, a cluster of highly integrated cities, are often emblematic signals of China's rapid urbanization (Fang et al 2018). If urbanization has linearly adverse effects on biodiversity due to fragmenting and destroying natural habitats, it should be demonstrated in the urban agglomerations.
4.2. Urbanization effects were overshadowed by background climate at large spatial scales
At national and regional spatial scales, the climate factors were usually the most influential, affecting both mammal and amphibian richness patterns along the urban-rural gradient. Both temperature and precipitation variables were significant drivers for Chinese mammal distribution while amphibians were mainly affected by the annual precipitation at national and regional scales (table 1 and figure 4). This indicates that due to the differences in physiological characteristics, the abilities of different organisms to cope with climate changes are diverse (Greenville et al 2012). As endotherms, mammals can maintain their body temperature by shifts in their metabolic rates, whereas amphibians, like other ectotherms, can only maintain their body temperature by thermal exchange with the environment. Previous study has found that amphibian species distribution was more subjected to climate changes than mammals, especially to the changes in water availability because of their biphasic complex life cycle (Scheele et al 2012).
The dominant climate factors driving the richness patterns were scale dependent or region specific. For example, Mean Diurnal Range of Temperature was the dominant driver affecting the richness of mammals along the urban-rural gradient across the entire China. Endotherms like mammals use thermoregulation to maintain steady internal body temperature to survive under changing ambient environment. Maintaining body temperature consumes energy, thus, thermoregulatory costs under a remarkable diurnal temperature regime would compromise the energy diverted to optimize their persistence (Buckley et al 2012, Briga and Verhulst 2015, Levesque et al 2016). In contrast, Maximum Temperature of Warmest Month was the most important driver of mammal richness pattern in Northeast China, the coldest geographic region among China (table S2). This is consistent with the water energy dynamics hypothesis that asserts that energy availability represents the strongest predictor of broad-scale pattern of mammal diversity in high latitudes or cold climates (Hawkins et al 2003, O'Brien 2006). We also found that an extreme increase of energy during the period when water availability is limiting placed a strong negative effect on Chinese mammal richness pattern. In addition, Precipitation of Driest Month provided the strongest explanation (i.e., more than 90%) for both mammal and amphibian richness pattern in Central-south China, which means that the species might be more subjected to the extreme precipitation events in this region with enough water and energy instead of the average climate conditions. Furthermore, different regions have their own 'shortcomings' based on different background climate. These results can be supported by the study of Greenville et al (2012) where the populations of small mammals in Simpson Desert were more likely to be driven by the extreme rainfalls (>95th quantile) instead of annual minimum and maximum temperatures.
At national and regional scales, the habitat conditions and urbanization-related factors were not as important as climate factors to both taxa's richness distribution except habitat Shannon's Diversity Index for mammals in North China and urbanization intensity for amphibians in Southwest China. Nevertheless, the habitat conditions indicated by the fraction of woodland did add an additional 38.4% explanation for mammal distribution along the urban-rural gradient across the country (table 1), which agreed well with earlier understanding on spatial patterns of mammal diversity that habitat heterogeneity is an important determinant of its broad-scale distribution (Kerr and Packer 1997, Stein et al 2015). It should be noted that the indirect impacts of urbanization on biodiversity can be substantial but are often challenging to be disentangled from other environmental changes across large spatial scales.
4.3. The impacts of urbanization on richness distribution patterns
Although the effects of urbanization on richness patterns along the urban-rural gradient were largely masked by the overall primacy of background climate, they were manifested through the following observations. First, the impact of urbanization intensity became evident at the urban agglomeration scale. It was the most important driver of mammal richness pattern in Pearl River Delta and Wuhan urban agglomerations, with an explanatory power of 35% and 33.2%, respectively. Moreover, urbanization intensity presented a positive influence in the former but a negative effect in the latter (figure 6(b)). This might indicate that the environmental Kuznets curve tested in many empirical studies, postulating that economic development, in initial stages tends to cause environmental degradation and after reaching a certain point over the course of development, it promotes the environmental conditions (Kuznets 1955, Stern 2004), can be applicable to characterizing the relationship between environmental pressure and urbanization activities. The comprehensive development degree of an urban agglomeration can reflect the stage of urban development to a certain extent (Fang 2011). The higher the comprehensive development degree of urban agglomeration is, the longer the urban development profile. The Pearl River Delta urban agglomeration was far ahead of Wuhan urban agglomeration in rank order of the comprehensive development degree, and its richness was more diverse than that of Wuhan urban agglomeration despite the fact that they are located in the same geographic region (table S3 and figure S4).
Second, habitat conditions became playing an increasingly important role at the urban agglomeration scale. For example, woodland area individually explained 26% and 52.3% of richness variation of mammals and amphibians along the urban-rural gradient in Yangtze River Delta urban agglomeration, respectively (figures 6(b), (d)). Urbanization can be a double-edged sword with respect to habitat modification. On one edge, urbanization replaces and fragments natural habitats such as woodland, posing primary threats to biodiversity. On the other edge, urbanization can be associated with an increase in managed green areas, such as street trees, lawns, and parks, which create new important habitats for a majority of urban wildlife (Wania et al 2006, Ávila et al 2017). We did find in an earlier study that urban expansion of Shanghai, the center city in Yangtze River Delta urban agglomeration, was accompanied by a continued increase of urban green spaces (Zhao et al 2006). Woodlands can act as a natural shelter for animals to prevent them from the threats of human activities, especially for those with bigger body size and larger home-range like mammals (Lehrer and Schooley 2010, Šálek et al 2015). Hence, planting and maintaining trees in urban areas would be viable strategies to preserve and promote the biodiversity in urban ecosystems.
Third, urbanization-associated environmental changes (e.g., urban heat stress and pollution) and human interventions (e.g., socioeconomic activities and urban landscape managements) can indirectly affect biodiversity. The indirect impacts of urbanization, which stretch far beyond the city limits and have largely been neglected, might be more important than the direct effects of urbanization on biodiversity (McDonald et al 2019). A clear footprint of the nighttime lights, a proxy for socioeconomic activities, on amphibian richness in Central Henan urban agglomeration was revealed (R2 = 63.1%; figure 6(d)), indicating the indirect impacts of urbanization are potentially substantial but difficult to disentangle from the direct ones. In our previous work on urbanization effects on vegetation growth (Zhao et al 2016, Jia et al 2018), we separated the overall effects into direct and indirect components and revealed prevalent vegetation growth enhancement resulted from indirect impact of urbanization in urban environments of China and the Conterminous United States. How these indirect effects of urbanization on vegetation growth translate into biodiversity is a complex process and yet to be explored. To build a comprehensive understanding on urbanization consequences for biodiversity, more research is needed to quantify the indirect effects of urbanization on biodiversity.
It needs to be mentioned that China has been a traditional agriculture country since ancient times, with around 13.01 million hm2 arable land by 2000 (Hou and Ma 2019). Since agricultural expansion and intensification are as fierce as urbanization among the human-induced changes to the environment (Green et al 2005), and the rural areas in China with less artificial surface has been the central areas for agricultural activities, it is reasonable to infer that the downward tendency of Chinese amphibians and mammals species richness the low urbanization gradient end was mainly related to the increase of arable land area instead of urbanization. This can be verified by significant and negative correlations between arable land and mammal and amphibian richness in most cases of this study.
Given the paucity of long-term time series data for both urbanization and biodiversity, the urban-rural gradient approach provides a space for time substitution to quantify the effects of urbanization on biodiversity. Nonetheless, potential caveats exist to such gradient approach and the findings need to be interpreted carefully. For example, many possible driving forces simultaneously present along the urban-rural gradient, thus it is very challenging to explicitly interpret the observed patterns and more attention needs to be paid to attribution of drivers.
Acknowledgments
This study was supported by the National key R&D plan of China Grant (2018YFA0606104) and the National Natural Science Foundation of China Grants (41771093 and 42071120). The authors declare that they have no known competing financial interests or personal relationships that could have appeared to influence the work reported in this paper.
Data availability statement
Some data used during the study were provided by a third party. Direct requests for these materials may be made to the provider as indicated in the Methods section.