Where Does Nighttime Light Come From? Insights from Source Detection and Error Attribution


1
Ministry of Education Key Laboratory for Earth System modeling, Department of Earth System Science, Tsinghua University, Beijing 100084, China
2
Department of Land, Air, and Water Resources, University of California, Davis, CA 95616, USA
3
Tsinghua Urban Institute, Tsinghua University, Beijing 100084, China
4
Center for Healthy Cities, Institute for China Sustainable Urbanization, Tsinghua University, Beijing 100084, China
*
Author to whom correspondence should be addressed.
Remote Sens. 2020, 12(12), 1922; https://doi.org/10.3390/rs12121922
Submission received: 8 May 2020
/
Revised: 6 June 2020
/
Accepted: 11 June 2020
/
Published: 14 June 2020
(This article belongs to the Special Issue Urban Land Use Mapping and Analysis in the Big Data Era)
Abstract
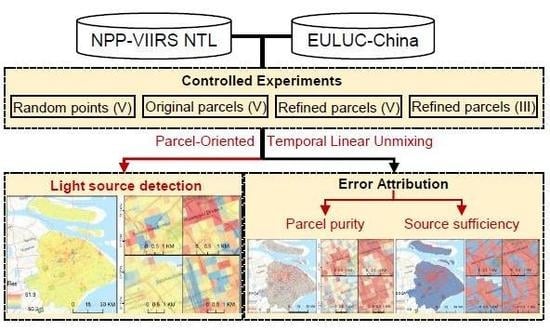
:Nighttime light remote sensing has aroused great popularity because of its advantage in estimating socioeconomic indicators and quantifying human activities in response to the changing world. Despite many advances that have been made in method development and implementation of nighttime light remote sensing over the past decades, limited studies have dived into answering the question: Where does nighttime light come from? This hinders our capability of identifying specific sources of nighttime light in urbanized regions. Addressing this shortcoming, here we proposed a parcel-oriented temporal linear unmixing method (POTLUM) to identify specific nighttime light sources with the integration of land use data. Ratio of root mean square error was used as the measure to assess the unmixing accuracy, and parcel purity index and source sufficiency index were proposed to attribute unmixing errors. Using the Visible Infrared Imaging Radiometer Suite (VIIRS) nighttime light dataset from the Suomi National Polar-Orbiting Partnership (NPP) satellite and the newly released Essential Urban Land Use Categories in China (EULUC-China) product, we applied the proposed method and conducted experiments in two China cities with different sizes, Shanghai and Quzhou. Results of the POTLUM showed its relatively robust applicability of detecting specific nighttime light sources, achieving an rRMSE of 3.38% and 1.04% in Shanghai and Quzhou, respectively. The major unmixing errors resulted from using impure land parcels as endmembers (i.e., parcel purity index for Shanghai and Quzhou: 54.48%, 64.09%, respectively), but it also showed that predefined light sources are sufficient (i.e., source sufficiency index for Shanghai and Quzhou: 96.53%, 99.55%, respectively). The method presented in this study makes it possible to identify specific sources of nighttime light and is expected to enrich the estimation of structural socioeconomic indicators, as well as better support various applications in urban planning and management.
1. Introduction
In addition to an environment-based remote sensing dataset such as Landsat and Moderate Resolution Imaging Spectroradiometer (MODIS), a nighttime light (NTL) remote sensing dataset is more recognized as human-oriented [1], reflecting the distribution and intensity of human activities. Therefore, more and more human-related studies have extracted the urban built-up areas [2], estimated socioeconomic variables such as gross domestic product (GDP) values [3,4], population [5], and carbon emissions [6,7], and studied its negative impact on estrogen-dependent diseases [8] through interaction with light and melatonin and circadian rhythms [9,10], with the help of an NTL dataset. Given the capability of bridging the gap between remote sensing and socioeconomic society, an NTL dataset has gained increasing popularity and has been widely used in deriving objective and third-party socioeconomic indicators and quantifying the effect of ambient light at night on ecology [11] and human health [12], where the estimation accuracy is highly demanded. In addition to the development of improved estimation methods [13,14], interpreting the physical human activity from each NTL pixel value should be a radical but underappreciated way to estimate socioeconomic indicators in more reasonable and accurate manners.
Urban areas, where the majority of humanity gathers, are prominent places to study and solve human-centered problems such as climate change [15] or sustainability development [16]. Within urban areas, human activities are guided and constrained by urban land use planning as well as altering land use distributions in turn [17]. On this basis, human activities can be classified as the categories of urban land use directly. Therefore, to understand where NTL pixel values come from is to calculate the fraction of different land use classes (referred to as light sources hereafter) contributing to NTL [18], which is a widely used remote sensing technology called unmixing.
Existing studies always apply pixel unmixing method to an NTL dataset directly [18]. The pixel spectral unmixing method assumes that pixel reflectance is the combination of endmembers (different pure light sources) reflectance and their respective fractions within the pixel, where the reflectance profile of light sources in multiple spectral bands is required. However, because of the single panchromatic band with an existing global NTL dataset [19], temporal mismatch between NTL dataset and land use dataset is inevitable, thus leading to unsatisfactory unmixed results. A number of recent studies have been devoted to detecting the relation between NTL and human activities through time series perspective, for example, interpreting human activities from the seasonal fluctuation of NTL datasets [20] by using points of interest (POI) or optical remote sensing datasets [21].
Another obstacle impeding the source detection of NTL is the lack of objective assessing indices. General assessments include calculating the root mean square error (RMSE) [22,23] between the original and remixed dataset (unmixed fraction matrix multiplied by endmember matrix), and correlation between unmixed results from the NTL dataset with different spatial resolution. These indices denote the mathematical errors of the results but fail to attribute the error to physical interpretation. Proposing error-attributing indices is helpful to guide the source detection of the NTL dataset.
Addressing these shortcomings, this study mainly focuses on detecting the NTL sources within the urban area through the parcel-oriented temporal linear unmixing method (POTLUM), and proposing two series of indices, namely the parcel purity index (PPI) and source sufficiency index (SSI), to attribute the unmixing error. Sample parcels of different light sources, or land use classes, are collected through a field trip to apply POTLUM, and the results are then tested by rRMSE. Controlled experiments were conducted. To verify the efficiency of PPI, multiple experiments were set by increasing the endmember purity while maintaining other variables. Light sources were manually merged, and different study areas were selected to check the practicability of SSI. This simple method proposed here is helpful to interpret long-term human activity footprint and can also be applied in a better and finer estimation of socioeconomic variables, or its relation to estrogen-dependent diseases. Two error-attributing indices here can direct the ways to increase unmixing accuracy. This study helps to excavate the potential usage of NTL, and better bridge remote sensing community and socioeconomic society.
2. Data
2.1. NPP-VIIRS NTL Remote Sensing Dataset
NTL remote sensing data in 2018 are monthly products with ~500 m spatial resolution, acquired from the Day/Night Band of VIIRS sensor on board Suomi-NPP satellite (https://eogdata.mines.edu/download_dnb_composites.html) [24]. More parameters of NPP-VIIRS nighttime light data are shown in Table 1. Since NPP-VIIRS data have all been calibrated on board [25], twelve-month data in 2018 are used directly hereafter.
2.2. EULUC-China 2018
Dataset of Essential Urban Land Use Categories in China (EULUC-China) for 2018 is a vector parcel-based product downloaded from http://data.ess.tsinghua.edu.cn/. This product was derived from a set of 10-m satellite images, OpenStreetMap, nighttime lights, point of interests, and Tencent location-based service data in 2018 using machine learning algorithms. Its two-level classification system was adapted from the Chinese Standard of Land Use Classification. Here we used its first level classification results as the input of our method (as Table 2 shows).
In addition to the EULUC-China 2018 dataset, the field trip samples hierarchically generated for training their classifiers were also collected. They are recorded in the form of categories, landmark buildings and facilities, and mixed land use situation and respective estimated proportions. They are used as original parcels here. More information on the EULUC-China product can be found in reference [26]. On this basis, parcels can be further refined by filtering through their recorded mixed situation and estimated proportions. No mixed parcel validated visually would be included in refined parcels. The original and refined parcels are used as endmembers in different cases to test the applicability of PPI.
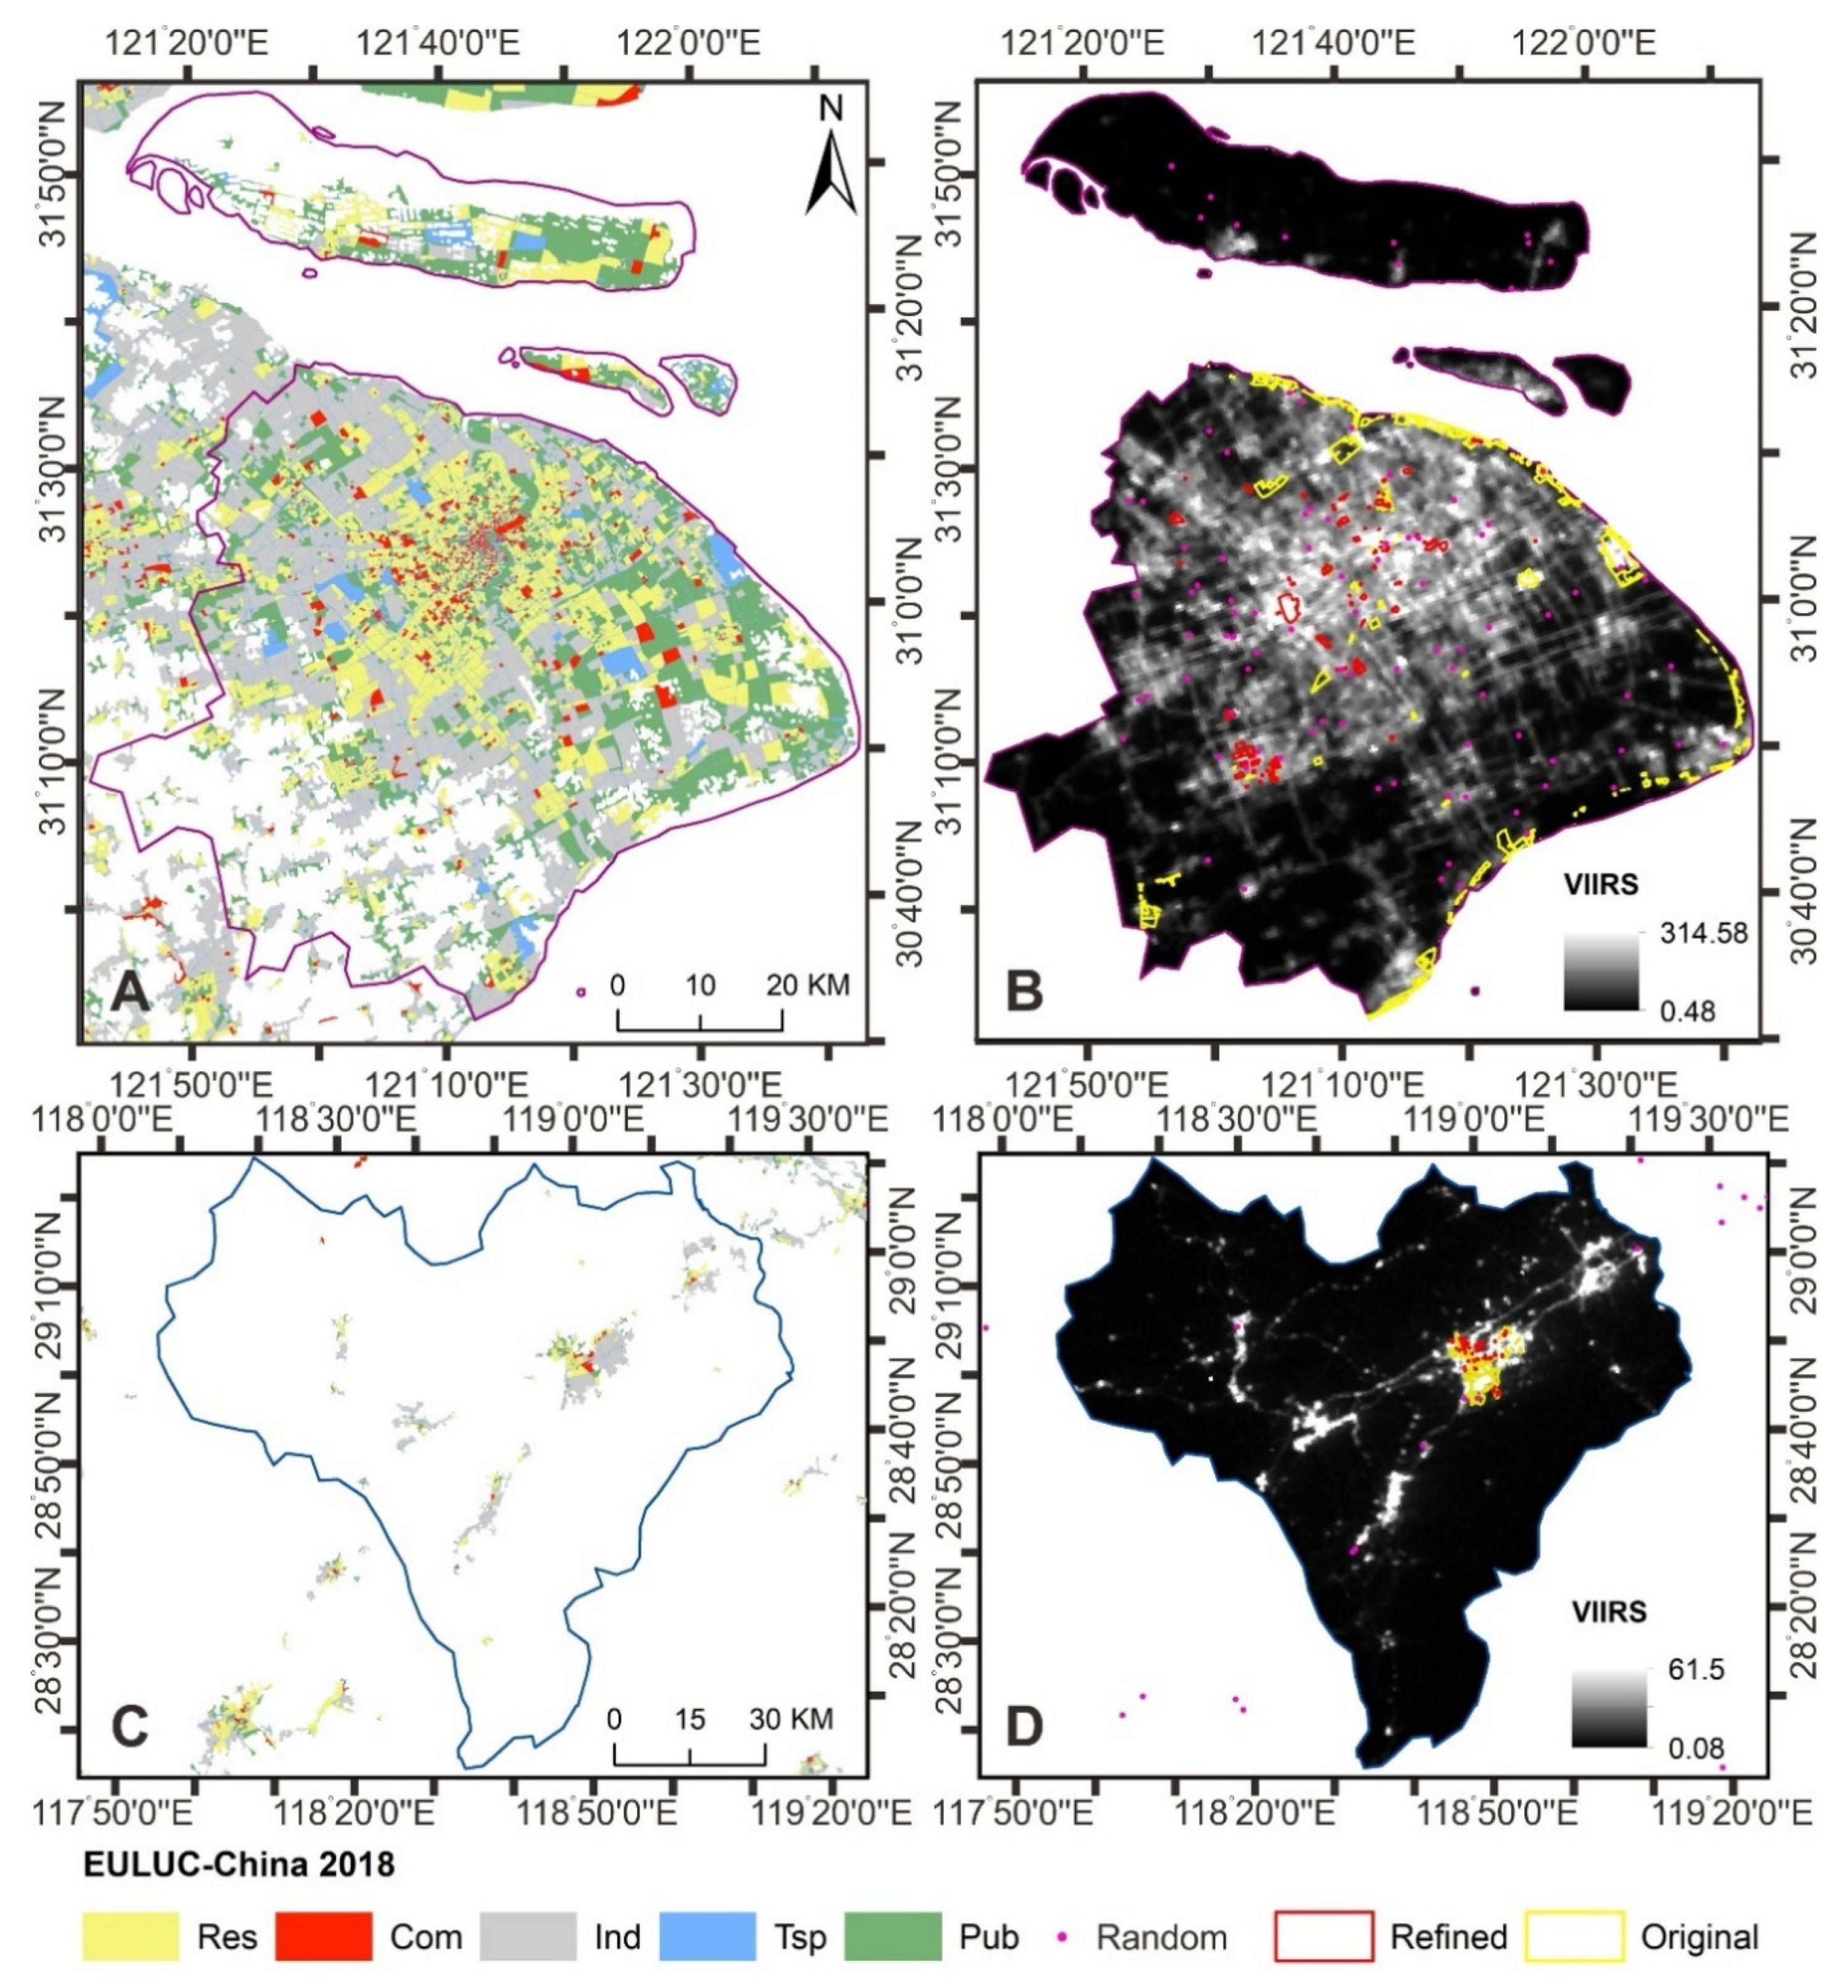
Shanghai is one of the most prosperous metropolitans in China, which gathers humans from various regions and partitions the land parcels into adequate land use classes. The NTL sources in Shanghai have been detected using POTLUM and assessed by rRMSE with three PPI and two SSI attributing the error. Figure 1 shows the study sites with NPP-VIIRS nighttime light remote sensing data, EULUC-China 2018 maps, original parcels, refined parcels, and random points.
3. Methods
To take advantage of spatial and temporal methods, the temporal unmixing method is adopted [23], which forms a reflectance profile in multiple temporal units instead of spectral bands. It further assumes that the proportion of each class reflectance in a certain pixel should not change within the selected period. Among various unmixing methods, linear unmixing is the most simple and clear one [22], which takes the pixel reflectance as the sum of endmembers reflectance multiplied by their respective fractions directly. NTL source detection is now turning into a parcel temporal linear unmixing problem, given the consensus that land use is a parcel-oriented concept rather than a pixel-oriented one [26]. A parcel-oriented temporal linear unmixing method (POTLUM) is therefore proposed.
Besides, this study proposed error-attributing indices from the constraints of pixel unmixing. Among possible influential factors, the accuracy of unmixing results are mainly constrained by three aspects [23]: (1) model practicability; (2) endmember purity; and (3) light source sufficiency. Ratio RMSE (RMSE divided by the average of endmember matrix) is adopted to assess the unmixing error and to evaluate the first constraint. Two more series of indices are proposed to attribute the unmixing error regarding the other two constraints, namely parcel purity index (PPI) and source sufficiency index (SSI).
3.1. Parcel-Oriented Temporal Linear Unmixing Method (POTLUM)
Regarding that monthly NTL dataset and annual EULUC-China are both in the year 2018, a fraction of each light source should remain the same, which meets the requirement of POTLUM. Besides, NTL pixel values of parcels in the same class are averaged to form the endmember profile throughout twelve months, mitigating the impact of non-land-use-related abruptions in certain parcels. With estimated endmember matrix and downloaded NTL dataset, source reflectance fraction in each NTL pixel can be estimated by the Equation (1):
where F denotes source fraction matrix, N denotes NTL matrix, E denotes endmember matrix, with subscripts denoting rows and columns of each matrix. In detail, p, c, m represents total pixel numbers, classes of light source, and months, respectively. The unmixing calculation is directly conducted according to this equation, without other constraints.
Fp,c = Np,m × E−1c,m
To get a pixel-based assessment, root square error (RSE) is adopted (Equation (2)), and the overall accuracy of POTLUM is assessed by rRMSE Equation (3).
where Ni,j denotes original NTL value for pixel i in month j, represents remixed NTL value, Mean (Ec,m) denotes the average of the whole matrix, with all parameters sharing the same meanings as above.
rRMSE = RMSE/Mean(Ec,m) × 100%
3.2. Parcel Purity Index
As shown in Equation (1), the calculation of E matrix controls the unmixing accuracy. Since E is calculated from sample parcels, it is the parcel purity that actually contributes much to the unmixing accuracy [27]. Although no existing index is set to assess the parcel purity, it is reasonable to infer from the unmixed results. Logically, unmixed light source fraction should meet Fp,c ∈ [0,1], indicating that source fraction should neither be lower than 0 nor exceed 1. On this basis, the parcel purity (PP) matrix is labeled as follows:
where pi and ci indicate the pith row and cith column in Fp,c, respectively.
With the help of the PP matrix, a pixel-based, a class-based and an overall PPI can be calculated as follows, and p, c denotes total pixel numbers and classes of light source, respectively, with all variables sharing the same meanings as above.
Pixel-based PPI is calculated by the qualified element numbers in the PP matrix divided by all element numbers within a pixel (one row in the PP matrix), which can be used as a quality assessment (PPQA) band. Class-based assessment PPI (PPCA) is calculated by the qualified element numbers divided by all element numbers within a class. Overall assessment PPI (PPOA) is calculated by all qualified element numbers divided by all element numbers in the whole matrix.
3.3. Source Sufficiency Index
To detect the NTL sources within the urban area through POTLUM lies on a basis that the light sources, or the land use classes, is sufficient. If the sources are just sufficient, the sum of source fraction of the same pixel should follow , otherwise the sum should either be lower than or exceed one. Between them, the sum lower than one but larger than zero is acceptable since the land use classes adapted from Chinese Standard of Land Use Classification cannot cover all classes within the urban area. Therefore, the source sufficiency (SS) matrix is labeled as follows.
Like PPI, a pixel-based and an overall index are proposed and similarly named as SSQA and SSOA, with all parameters sharing the same meanings.
4. Results
4.1. Practicability of POTLUM, PPI, and SSI
The endmember matrix for unmixing is generated from the average of NTL values of all samples in the same category each month, showing as profiles along the timeline (Figures S1–S3). To test the practicability of PPI and SSI, four types of samples are selected, namely random point samples, original parcel samples, refined parcel samples, and class-adjusted refined parcel samples. Commercial, industrial, and public service land use types of refined parcel samples are integrated into one category by averaging their NTL values, to generate purer parcel samples. On this basis, the sample purity increases in these four types of samples. Results from these controlled experiments in Shanghai and Quzhou verify this trend, and prove the practicability of PPI, as is summarized in Table 3 and Table 4. Comparing the last two lines in these tables, the SSOA of class-adjusted is lower than the non-adjusted one in both Shanghai and Quzhou, which also proves the practicability of SSI. Also, from the comparison between the first line to any of the rest, the privilege of parcel-oriented over point-oriented approach has been justified. Note that pixel-based assessments from RSE, PPQA, and SSQA are not summarized in these tables.
4.2. Nighttime Light Sources
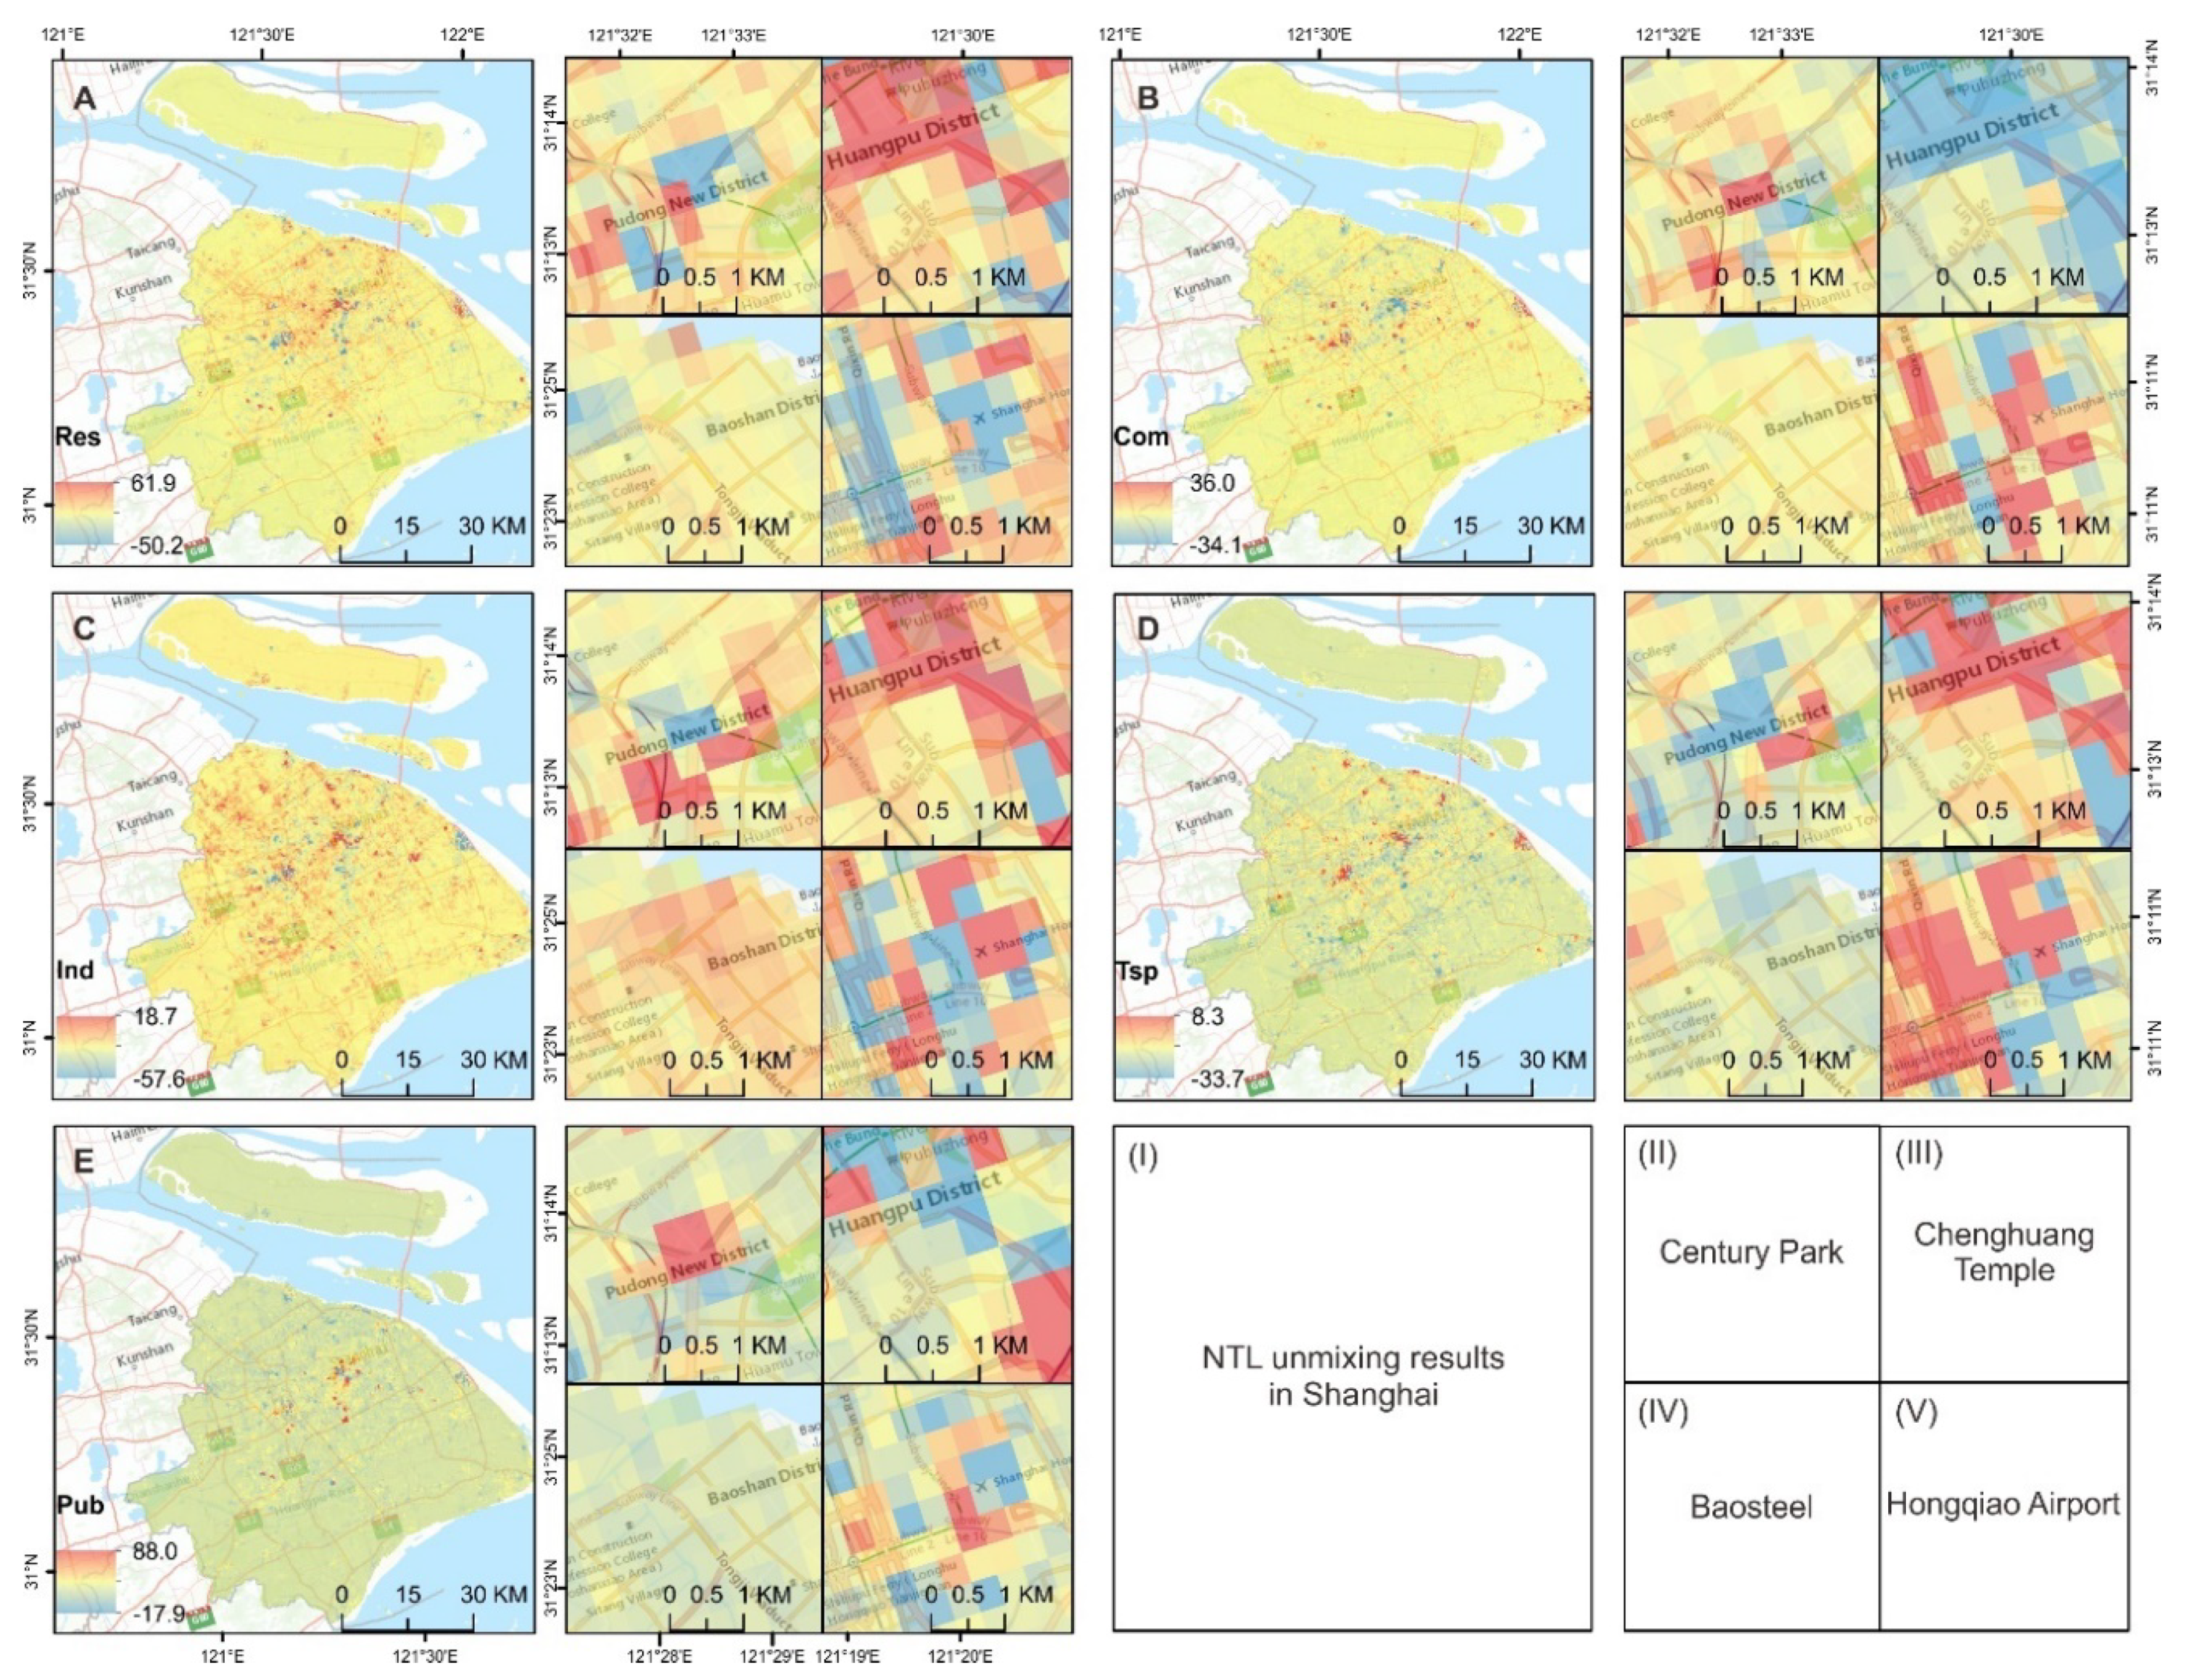
Overall, the unmixed source fractions depict the spatial pattern of different light sources throughout Shanghai. Five fraction pictures have been rendered in different colors (see left panel of each subfigure in Figure 2). Obviously, a high proportion of the residential areas are located next to the city center and the transportation with high intensity are evenly distributed throughout the city, but with a relatively small proportion in each pixel. Purer commercial areas are also distributed in order in Shanghai with the highest proportion in the city center and near two airports, and the higher proportional public management and service areas are highly concentrated in certain places, similar to the distribution of administrations or some famous parks. However, industrial places account for a large amount of area in Shanghai. Although some of them well describe the industrial districts, others may encounter misestimation. More detailed information can be shown in four famous landmarks, namely the Century Park, Chenghuang Temple, Baosteel corporation, and Hongqiao Airport. They mainly comprise administrations and leisure places, shopping and culture religion with dense highways, industrial parks and ferry stations, transportation and commercial service land uses, respectively. Four zoomed-in figures have well captured these variances.
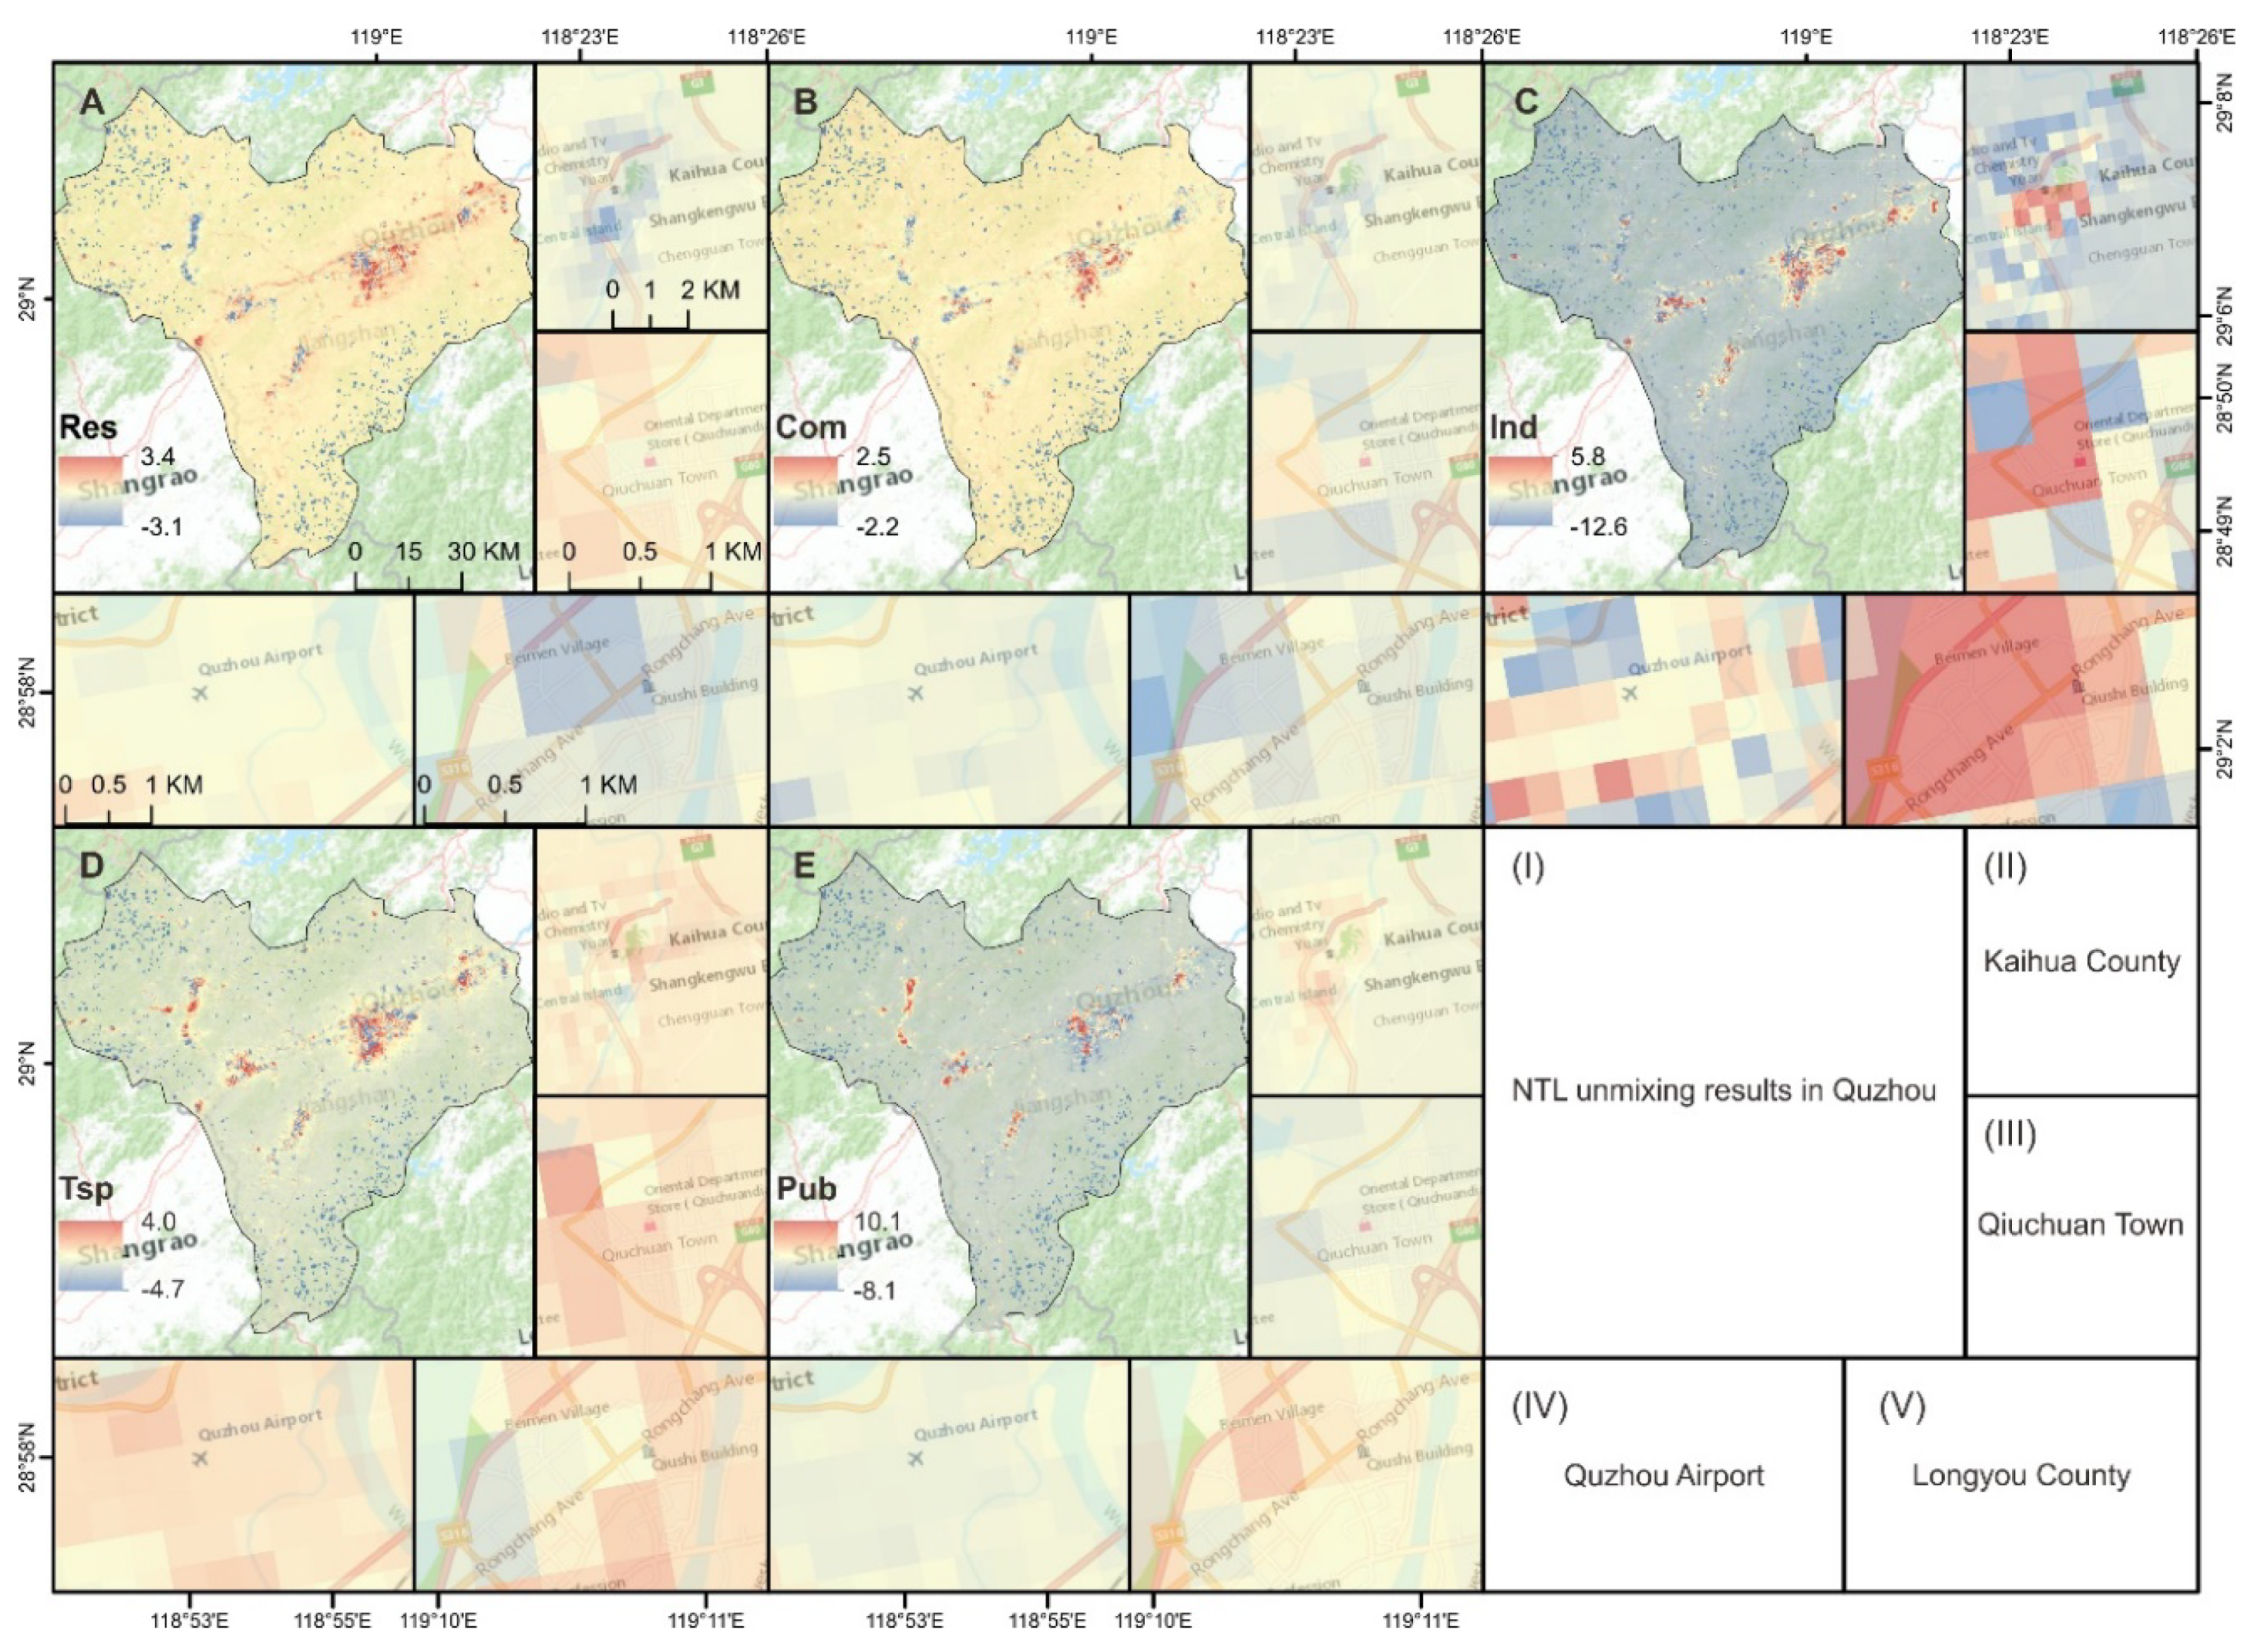
Differing from metropolitans such as Shanghai, NTL in Quzhou, a less developed prefecture but a traffic thoroughfare in Zhejiang province, is mainly attributed to residential (Figure 3A) and transportation categories (Figure 3D). Specifically, Kaihua (II) and Longyou (V) county are more developed regions, where public service (Figure 3E) and industrial types (Figure 3C) account for majority of NTL values, respectively. Qiuchuan town (III) and Quzhou airport (IV) are typical areas of residential NTL intensive (Figure 3A) and transportation NTL intensive (Figure 3D), respectively.
4.3. Unmixing Accuracy
Besides visual validation, quantitative validation figures are also provided. RSE calculates unmixing errors pixel by pixel. Although the results are acceptable through quantitative assessment in Table 1 and Table 2 and qualitative assessment in Figure 2 and Figure 3, there still exist misestimations in several pixels.
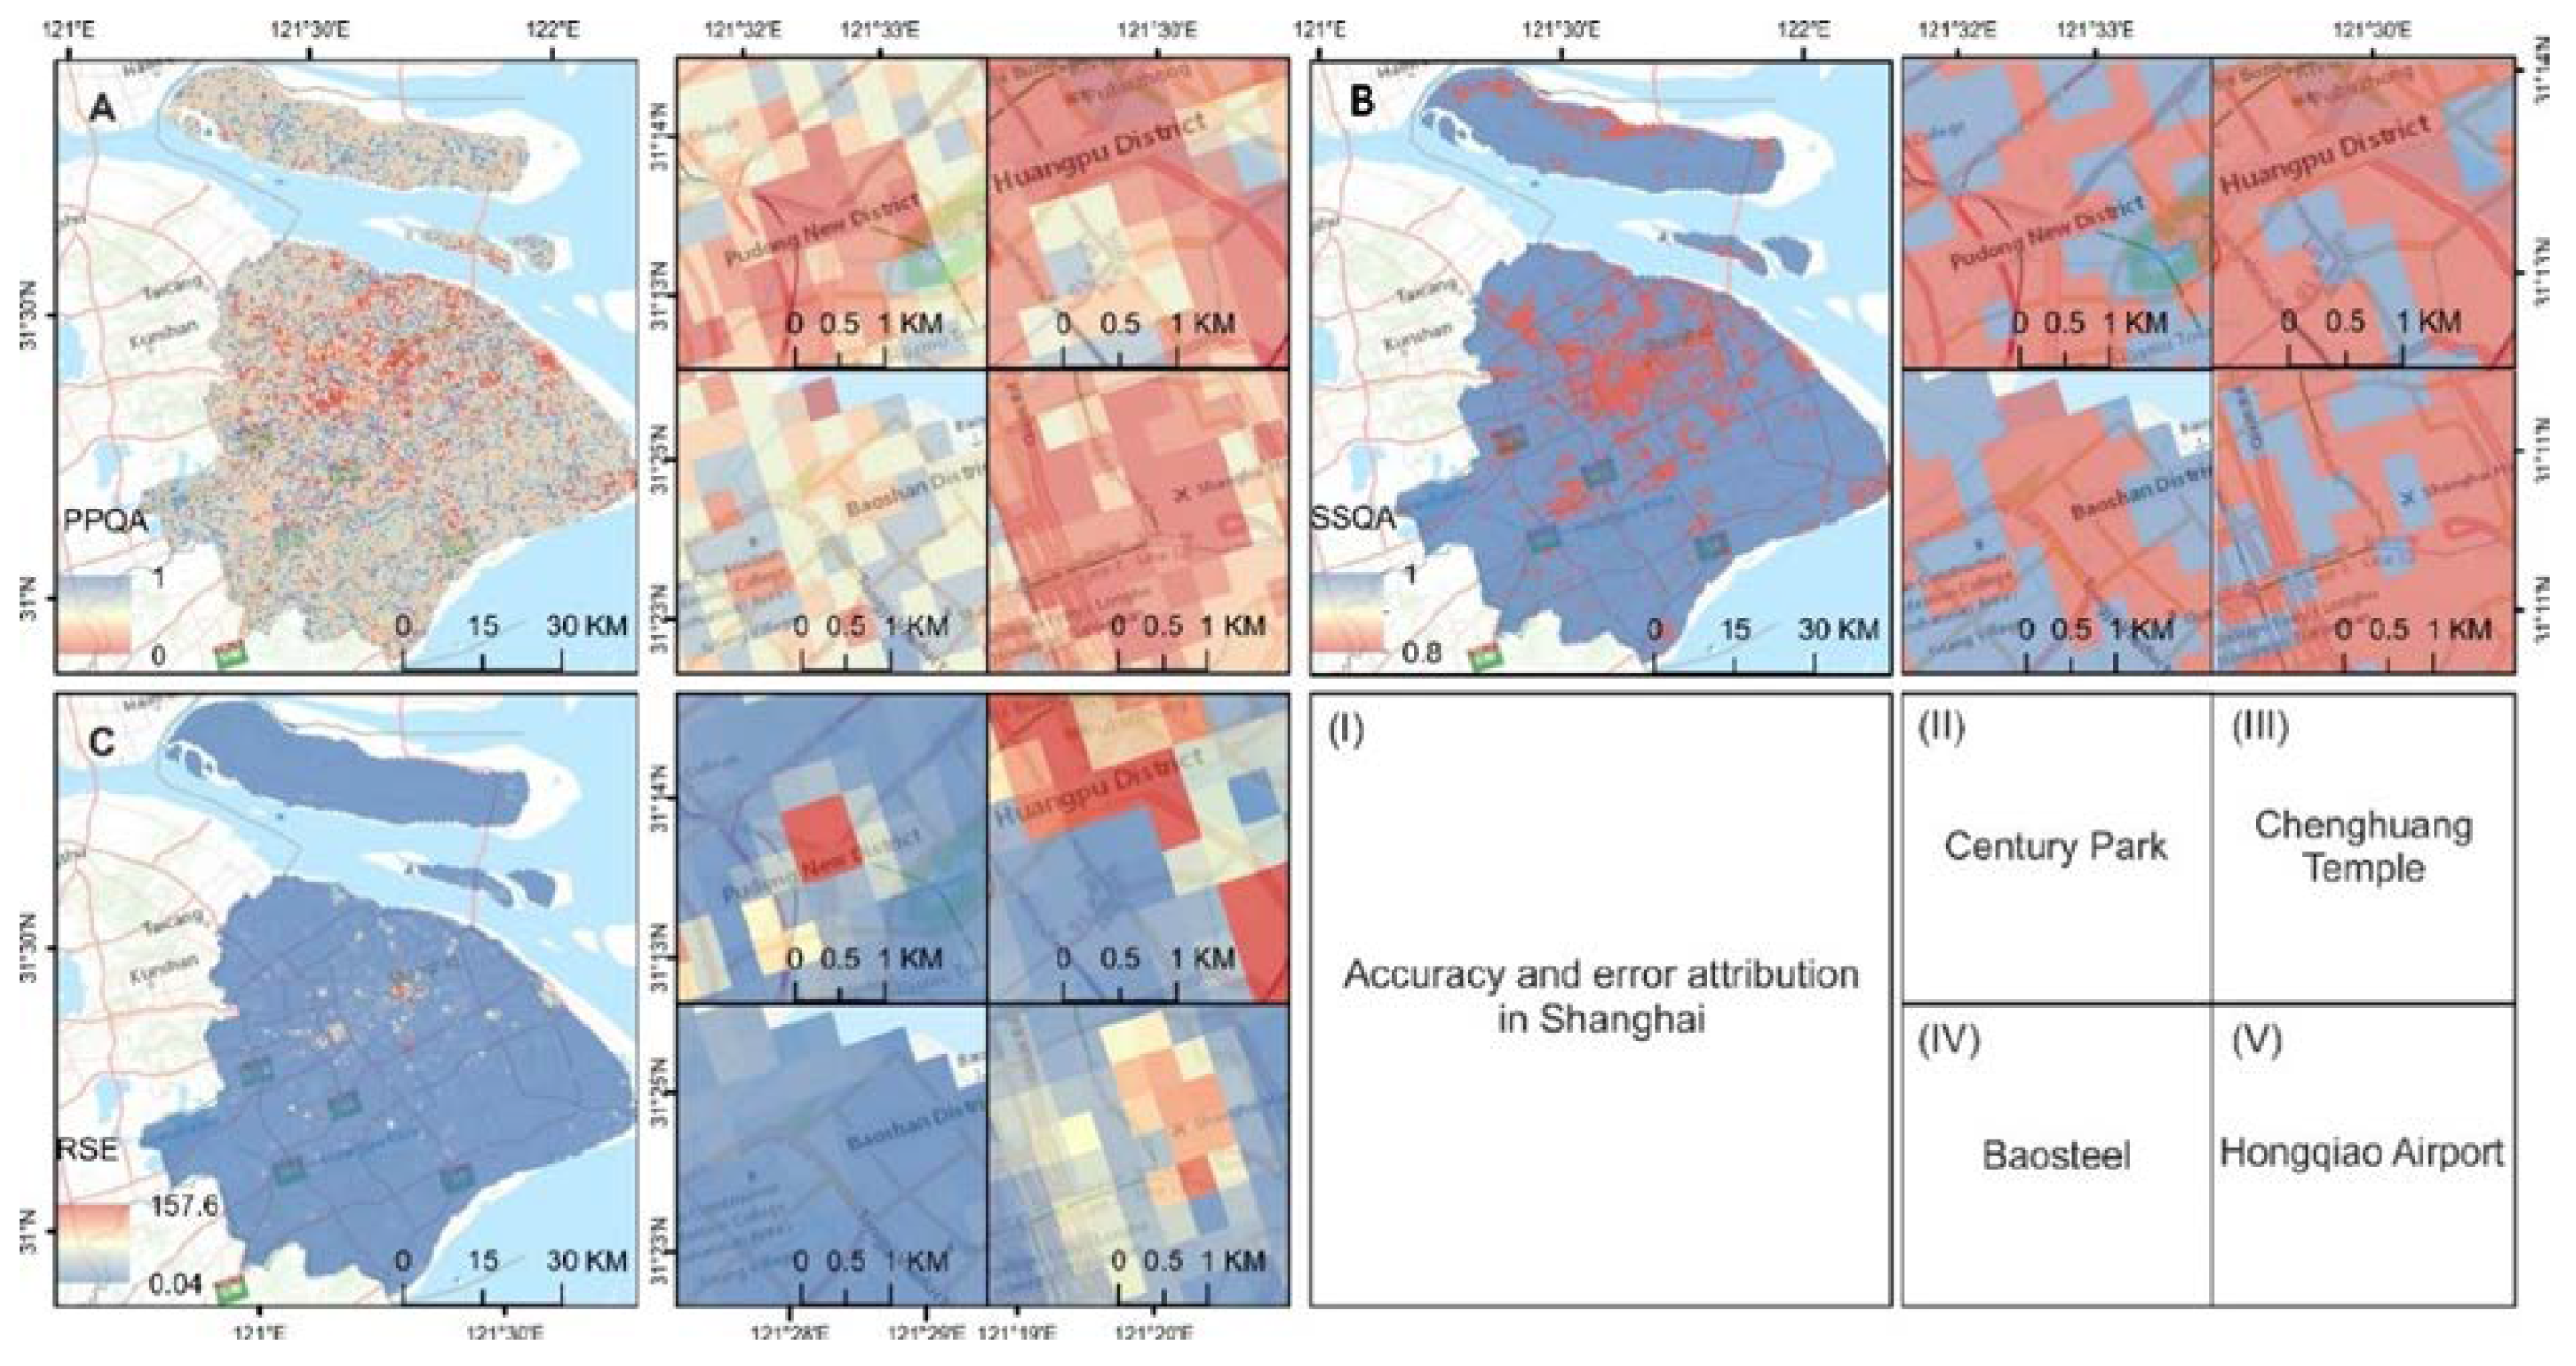
These pixels mainly clustered in city centers, airport, Disney Park, and along the Huangpu River in Shanghai, judging by the RSE maps. Having pointed out the erroneous pixels in RSE map, PPI, and SSI are further calculated to attribute these errors into parcel purity or source sufficiency problem. As can be seen from Figure 4(II to V), most erroneous pixels are consistent with lower values in PPQA and SSQA, indicating that these errors can be corrected after refining parcel purity and source sufficiency rather than changing unmixing methods.
In detail, errors in the Century Park and Chenghuang Temple result from both impure parcels and insufficient sources, and those in Hongqiao Airport mainly result from impure sources, with Baosteel corporation a satisfactory unmixing result. To be more specific, PPCA can be used to check which endmember includes the most impure parcels. As the third line in Table 3 shows, the PPOA, SSOA, rRMSE, and PPCA of other four sources are acceptable, while industrial parcel samples are the least pure, in accord with visual validation of Figure 2.
Quantitatively, NTL unmixed results in Quzhou are much better than those in Shanghai because of less mixed land use parcels, comparing values in Table 4 to those in Table 3. Erroneous pixels in Quzhou are similarly clustered in city downtown, for example, the more developed region in Kaihua (II) and Longyou (V) county (Figure 5C), which can also be improved after purifying the purity (Figure 5A).
5. Discussion
5.1. Comparison with Previous Works
NTL source detection has long been a tough problem and invited multiple experiments these years. For example, Li et al., incorporated nonnegative constraints when solving the Fp,c [18], to ensure that the unmixed result is reasonably meaningful. Moreover, Ma et al., plotted a cumulative distribution of pixel-level NTL radiance for different types of land cover [21]. The cumulative distributions demonstrate the one-to-one correspondence between NTL radiance and composition of different types. Meanwhile, Chen et al., utilized random forest to map information from different types of POI to NTL [20] and take contributions of different types to the mapping algorithm as the contribution to NTL, which also represents fractions. These studies detect NTL sources through multiple methods, but Li and Ma failed to objectively assess the error. While Chen assessed the error objectively, the physical interpretation of the contribution and error are not clear enough since random forest is a black box. So far, no study has devoted to attributing the error. Note that although POTLUM includes no further constraint such as nonnegative, the rRMSE is still acceptable. Thanks to this non-constrained unmixing procedure, PPI and SSI are proposed. The workflow put forward in this study combines detection light sources as well as attribute errors objectively.
However, NTL source fraction products share different interpretations from land use products such as EULUC-China. Each pixel value in NTL source fraction shows proportions of different light sources, suggesting a more intensive light source and indicating a higher intensity of human activities. In comparison, land use products such as EULUC-China focus on delineating the clearer boundary of a certain land use type, without enough intensity. They can be used in different cases according to their different emphases in future studies.
The development of PPI in this study is not only helpful to acquire a more precise NTL source fraction, but also applicable to explain the classification error in EULUC-China. Taking Shanghai as an example, whose land use complexity is similar to China, PPCA in Shanghai shows high correlation with User’s Accuracy (R = 0.883) and Producer’s Accuracy (R = 0.642) of EULUC-China classification results, using the same original parcels (refer to Table S1). As is reasonable to say that an impure parcel is rather difficult to be classified into one specific type, PPCA can be applied to select better training samples for parcel-oriented land use classifications.
5.2. Visual Validation, RMSE-Related Indices and Error Attributing Indices
Visual validation is the most prevailing method to label parcel class. However, two points should be considered, i.e., different methods to acquire parcels, and different understanding of validation. Field trip parcels in this study were generated from the polygons clipped by surrounding buffered roads [26], which unavoidably incorporates bias within parcels. With this bias, campaign researchers would label 100% purity to a parcel which comprises areas belonging to a pure type, without considering whether this parcel really represents the pure type. Since the average value of features within the segmented parcel is calculated and used to estimate endmembers, the difference between them can make a big difference, which invites us to propose these more objective indices.
Among objective indices, PPI and SSI are both mathematically and physically isolated from RMSE-related indices. RMSE evaluates the difference between original Ni,j and remixed Ni,j, and collects all errors without considering their attribution. In contrast, the calculation of PPI and SSI derives from the physical inference of the unmixed results and therefore attributes the errors detected in RSE map to either parcel purity or source sufficiency one (Figure 4 and Figure 5). For example, in Figure 4, the unmixed map in Shanghai, higher RSE in Chenghuang Temple area (III) can be attributed to both impure parcels and insufficient sources. Those not detected by PPI and SSI can then be attributed to model practicability. PPI and SSI are also not necessarily dependent. For example, in Chongming District, a northern island in Shanghai, a little higher RSE in the middle north of the island is mainly attributed to insufficient classes rather than impure parcels, since the area is covered with croplands instead of urban land use classes.
5.3. Uncertainty and Implications
This study proposed POTLUM, PPI, and SSI, whose practicability have been verified by controlled cases. There is no further a challenge in applying them to every administrative area. Still, there remains unknown whether they can be applied to all administrative units as a whole. Since PPOA and SSOA shows a big difference in Shanghai and Quzhou (Table 3 and Table 4), it’s clear that there exist systematic background differences between various cities. To mitigate the huge disparity of NTL values among regions is the key to successfully apply POTLUM, PPI, and SSI to the whole country or even the whole world at once, rather than one by one.
Land use products are essential to trace the human activity footprint. NTL source fractions here and land use dataset such as EULUC-China can both be applied to discover the human-environment connections historically, and be used as forcing factor to forecast future changes through simulation models such as WRF-Chem [28]. For forecasting, it has been a long time that models take land cover datasets as inputs. Until recently, researchers have found that modeling accuracy can be significantly improved in simulating heat, wind, and pollution-related variables, if finer classes within urban land cover category are input [29]. Since those variables are highly correlated with human activities, detailed simulation within urban has increasingly been emphasized. Among other improving models, a cooling tower scheme takes human-related sensible heat into consideration [30]. It needs to distinguish different types of air-conditioners in different human activity categories, where both NTL sources fraction and EULUC-China can play a role.
Regarding the simpleness and interpretation of POTLUM, it is easy to be used in multiple regions throughout a longer period of time. RMSE-related indices together with PPI and SSI helps to produce products for higher accuracy at the target regions and periods. If human activity intensity to a larger extent during a longer time can be traced, their footprint can be delineated and the simulated accuracy of aforementioned cooling tower scheme is more likely to improve. Besides, other similar human behavioral associated studies are upcoming [10].
6. Conclusions
This study sought to answer the challenging question-where does nighttime light come from? by detecting nighttime light sources and attributing its detection biases. Towards this ultimate goal, we have developed an urban NTL source detection method called parcel-oriented temporal linear unmixing method (POTLUM) and proposed two indices to attribute the unmixing errors. Results showed that with this simple and straightforward POTLUM, we could successfully detect urban NTL sources with plausible accuracies. We also identified that most unmixing errors could be attributed to endmember estimation and NTL sources definition rather than model selection, according to PPI and SSI. Various controlled experiments further verified the efficiency of PPI and SSI in their capability of capturing the parcel purity and source sufficiency, which could explain the error of parcel-oriented land use classification partially. With the help of PPI and SSI, finer endmembers and NTL sources could be estimated and adapted, so that POTLUM can further be applied to larger areas throughout a longer time. In conclusion, the method presented in this study makes it possible to identify specific sources of nighttime light and is expected to enrich estimation of structural socioeconomic indicators, as well as better support various applications in urban planning and management.
Supplementary Materials
The following are available online at https://www.mdpi.com/2072-4292/12/12/1922/s1, Figure S1: Temporal profile of original parcels (a) and refined parcels (b), Figure S2. Temporal violinplots of original pixel values throughout twelve month (from left to right and then from top to bottom), Figure S3. Temporal violinplots of refined parcel values throughout twelve month (from left to right and then from top to bottom), Table S1. Pearson’s correlation between PPCA and class accuracy of EULUC-China 2018 from original parcels.
Author Contributions
Conceptualization, Z.R.; methodology, Z.R.; software, Y.L.; validation, Z.R., and B.C.; data curation, Z.R., and B.C.; writing—original draft preparation, Z.R., and Y.L.; writing—review and editing, B.C.; visualization, Z.R.; supervision, B.X.; project administration, B.X.; funding acquisition, B.X. All authors have read and agreed to the published version of the manuscript.
Funding
This research was partially supported by the National Research Program of the Ministry of Science and Technology of the People’s Republic of China (2016YFA0600104), and donations from Delos Living LLC and the Cyrus Tang Foundation to Tsinghua University.
Acknowledgments
We thank Peng GONG from Tsinghua University for his review and very helpful suggestions.
Conflicts of Interest
The authors declare no conflict of interest. The funders had no role in the design of the study; in the collection, analyses, or interpretation of data; in the writing of the manuscript, or in the decision to publish the results.
References
- Li, D.; Zhao, X.; Li, X. Remote sensing of human beings—A perspective from nighttime light. Geo-Spat. Inf. Sci. 2016, 19, 69–79. [Google Scholar] [CrossRef] [Green Version]
- Chen, Z.; Yu, B.; Zhou, Y.; Liu, H.; Yang, C.; Shi, K.; Wu, J. Mapping Global Urban Areas From 2000 to 2012 Using Time-Series Nighttime Light Data and MODIS Products. IEEE J. Sel. Top. Appl. Earth Obs. Remote Sens. 2019, 12, 1143–1153. [Google Scholar] [CrossRef]
- Sutton, P.C.; Elvidge, C.D.; Ghosh, T. Estimation of gross domestic product at sub-national scales using nighttime satellite imagery. Int. J. Ecol. Econ. Stat. 2007, 8, 5–21. [Google Scholar]
- Yu, B.; Shi, K.; Hu, Y.; Huang, C.; Chen, Z.; Wu, J. Poverty evaluation using NPP-VIIRS nighttime light composite data at the county level in China. IEEE J. Sel. Top. Appl. Earth Obs. Remote Sens. 2015, 8, 1217–1229. [Google Scholar] [CrossRef]
- Sutton, P.; Roberts, D.; Elvidge, C.; Baugh, K. Census from Heaven: An estimate of the global human population using night-time satellite imagery. Int. J. Remote Sens. 2001, 22, 3061–3076. [Google Scholar] [CrossRef]
- Letu, H.; Hara, M.; Yagi, H.; Naoki, K.; Tana, G.; Nishio, F.; Shuhei, O. Estimating energy consumption from night-time DMPS/OLS imagery after correcting for saturation effects. Int. J. Remote Sens. 2010, 31, 4443–4458. [Google Scholar] [CrossRef]
- Shi, K.; Chen, Y.; Yu, B.; Xu, T.; Chen, Z.; Liu, R.; Li, L.; Wu, J. Modeling spatiotemporal CO2 (carbon dioxide) emission dynamics in China from DMSP-OLS nighttime stable light data using panel data analysis. Appl. Energy 2016, 168, 523–533. [Google Scholar] [CrossRef]
- Bauer, S.E.; Wagner, S.E.; Burch, J.; Bayakly, R.; Vena, J.E. A case-referent study: Light at night and breast cancer risk in Georgia. Int. J. Health Geogr. 2013, 12, 23. [Google Scholar] [CrossRef] [Green Version]
- Fonken, L.K.; Workman, J.L.; Walton, J.C.; Weil, Z.M.; Morris, J.S.; Haim, A.; Nelson, R.J. Light at night increases body mass by shifting the time of food intake. Proc. Natl. Acad. Sci. USA 2010, 107, 18664–18669. [Google Scholar] [CrossRef] [Green Version]
- Bharti, N.; Tatem, A.J.; Ferrari, M.J.; Grais, R.F.; Djibo, A.; Grenfell, B.T. Explaining seasonal fluctuations of measles in Niger using nighttime lights imagery. Science 2011, 334, 1424–1427. [Google Scholar] [CrossRef] [Green Version]
- Longcore, T.; Rich, C. Ecological light pollution. Front. Ecol. Environ. 2004, 2, 191–198. [Google Scholar] [CrossRef]
- Cho, Y.; Ryu, S.-H.; Lee, B.R.; Kim, K.H.; Lee, E.; Choi, J. Effects of artificial light at night on human health: A literature review of observational and experimental studies applied to exposure assessment. Chronobiol. Int. 2015, 32, 1294–1310. [Google Scholar] [CrossRef] [PubMed]
- Jean, N.; Burke, M.; Xie, M.; Davis, W.M.; Lobell, D.B.; Ermon, S. Combining satellite imagery and machine learning to predict poverty. Science 2016, 353, 790. [Google Scholar] [CrossRef] [PubMed] [Green Version]
- He, C.; Liu, Z.; Gou, S.; Zhang, Q.; Zhang, J.; Xu, L. Detecting global urban expansion over the last three decades using a fully convolutional network. Environ. Res. Lett. 2019, 14, 034008. [Google Scholar] [CrossRef]
- Chapman, R.; Howden-Chapman, P.; Capon, A. Understanding the systemic nature of cities to improve health and climate change mitigation. Environ. Int. 2016, 94, 380–387. [Google Scholar] [CrossRef] [PubMed]
- Stokes, E.C.; Seto, K.C. Characterizing urban infrastructural transitions for the Sustainable Development Goals using multi-temporal land, population, and nighttime light data. Remote Sens. Environ. 2019, 234, 111430. [Google Scholar] [CrossRef]
- Yang, J.; Siri, J.G.; Remais, J.V.; Cheng, Q.; Zhang, H.; Chan, K.K.; Sun, Z.; Zhao, Y.; Cong, N.; Li, X.; et al. The Tsinghua-Lancet Commission on Healthy Cities in China: Unlocking the power of cities for a healthy China. Lancet 2018, 391, 2140–2184. [Google Scholar] [CrossRef] [Green Version]
- Li, X.; Ge, L.; Chen, X. Quantifying Contribution of Land Use Types to Nighttime Light Using an Unmixing Model. IEEE Geosci. Remote Sens. Lett. 2014, 11, 1667–1671. [Google Scholar] [CrossRef]
- Levin, N.; Kyba, C.C.; Zhang, Q.; de Miguel, A.S.; Román, M.O.; Li, X.; Portnov, B.A.; Molthan, A.L.; Jechow, A.; Miller, S.D.; et al. Remote sensing of night lights: A review and an outlook for the future. Remote Sens. Environ. 2020, 237, 111443. [Google Scholar] [CrossRef]
- Chen, Z.; Yu, B.; Ta, N.; Shi, K.; Yang, C.; Wang, C.; Zhao, X.; Deng, S.; Wu, J. Delineating Seasonal Relationships Between Suomi NPP-VIIRS Nighttime Light and Human Activity Across Shanghai, China. IEEE J. Sel. Top. Appl. Earth Obs. Remote Sens. 2019, 12, 4275–4283. [Google Scholar] [CrossRef]
- Ma, T. An Estimate of the Pixel-Level Connection between Visible Infrared Imaging Radiometer Suite Day/Night Band (VIIRS DNB) Nighttime Lights and Land Features across China. Remote Sens. 2018, 10, 723. [Google Scholar] [CrossRef] [Green Version]
- Bierwirth, P. Mineral mapping and vegetation removal via data-calibrated pixel unmixing, using multispectral images. Int. J. Remote Sens. 1990, 11, 1999–2017. [Google Scholar] [CrossRef]
- Lobell, D.B.; Asner, G.P. Cropland distributions from temporal unmixing of MODIS data. Remote Sens. Environ. 2004, 93, 412–422. [Google Scholar] [CrossRef]
- Elvidge, C.D.; Baugh, K.; Zhizhin, M.; Hsu, F.C.; Ghosh, T. VIIRS night-time lights. Int. J. Remote Sens. 2017, 38, 5860–5879. [Google Scholar] [CrossRef]
- Shi, K.; Yu, B.; Huang, Y.; Hu, Y.; Yin, B.; Chen, Z.; Chen, L.; Wu, J. Evaluating the ability of NPP-VIIRS nighttime light data to estimate the gross domestic product and the electric power consumption of China at multiple scales: A comparison with DMSP-OLS data. Remote Sens. 2014, 6, 1705–1724. [Google Scholar] [CrossRef] [Green Version]
- Gong, P.; Chen, B.; Li, X.; Liu, H.; Wang, J.; Bai, Y.; Chen, J.; Chen, X.; Fang, L.; Feng, S.; et al. Mapping essential urban land use categories in China (EULUC-China): Preliminary results for 2018. Sci. Bull. 2020, 65, 182–187. [Google Scholar] [CrossRef] [Green Version]
- Maselli, F. Multiclass spectral decomposition of remotely sensed scenes by selective pixel unmixing. IEEE Trans. Geosci. Remote Sens. 1998, 36, 1809–1820. [Google Scholar] [CrossRef]
- Ching, J.; Brown, M.; Burian, S.; Chen, F.; Cionco, R.; Hanna, A.; Hultgren, T.; McPherson, T.; Sailor, D.; Taha, H.; et al. National urban database and access portal tool. Bull. Am. Meteorol. Soc. 2009, 90, 1157–1168. [Google Scholar] [CrossRef] [Green Version]
- He, X.; Li, Y.; Wang, X.; Chen, L.; Yu, B.; Zhang, Y.; Miao, S. High-resolution dataset of urban canopy parameters for Beijing and its application to the integrated WRF/Urban modelling system. J. Clean. Prod. 2019, 208, 373–383. [Google Scholar] [CrossRef]
- Yu, M.; González, J.; Miao, S.; Ramamurthy, P. On the Assessment of a Cooling Tower Scheme for High-Resolution Numerical Weather Modeling for Urban Areas. J. Appl. Meteorol. Climatol. 2019, 58, 1399–1415. [Google Scholar] [CrossRef]
Figure 1.
Study areas and data collection. EULUC-China 2018 products and NPP-VIIRS NTL layers in Shanghai are displayed in (A,B), and those in Quzhou are displayed in (C,D). Besides, random points, original parcels and refined parcels used for POTLUM are also delineated in (B,D) with dots and polygons. Res, Com, Ind, Tsp, and Pub represents residential, commercial, industrial, transportation, and public service land use types, respectively.

Figure 2.
Five source fraction maps, namely Res (A), Com (B), Ind (C), Tsp (D), Pub (E), from POTLUM unmixing method in Shanghai (I), using refined parcels as endmembers. Typical landmarks are zoomed in to show more details: Century Park (II), Chenghuang Temple (III), Baosteel corporation (IV), and Hongqiao Airport (V). Res, Com, Ind, Tsp, and Pub represents residential, commercial, industrial, transportation and public service land use types, respectively.

Figure 3.
Five source fraction maps, namely Res (A), Com (B), Ind (C), Tsp (D), Pub (E), from POTLUM unmixing method in Quzhou (I), using refined parcels as endmembers. Typical landmarks are zoomed in to show more details: Kaihua County (II), Qiuchuan Town (III), Quzhou Airport (IV), and Longyou County (V). Res, Com, Ind, Tsp, and Pub represents residential, commercial, industrial, transportation and public service land use types, respectively.

Figure 4.
Three accuracy assessment maps. Pixel by pixel PPQA (A), SSQA (B), and RSE (C) maps from POTLUM in Shanghai (I), Century Park (II), Chenghuang Temple (III), Baosteel corporation (IV), and Hongqiao Airport (V).
Figure 4.
Three accuracy assessment maps. Pixel by pixel PPQA (A), SSQA (B), and RSE (C) maps from POTLUM in Shanghai (I), Century Park (II), Chenghuang Temple (III), Baosteel corporation (IV), and Hongqiao Airport (V).

Figure 5.
Three accuracy assessment maps. Pixel by pixel PPQA (A), SSQA (B) and RSE (C) maps from POTLUM in Quzhou (I), Kaihua County (II), Qiuchuan Town (III), Quzhou Airport (IV), and Longyou County (V).
Figure 5.
Three accuracy assessment maps. Pixel by pixel PPQA (A), SSQA (B) and RSE (C) maps from POTLUM in Quzhou (I), Kaihua County (II), Qiuchuan Town (III), Quzhou Airport (IV), and Longyou County (V).


Table 1.
Main parameters of NPP-VIIRS nighttime light data.
| Passing Time | Band Range | Coverage | Spectral Resolution | Spatial Resolution | |
|---|---|---|---|---|---|
| NPP-VIIRS | 1:30 am | 0.5~0.9 μm | 65°S~70°N | 14-bit | 15 arc-sec |
Table 2.
Essential urban land use classification schemes-Level 1.
| Level 1 | 01 | 02 | 03 | 04 | 05 |
|---|---|---|---|---|---|
| Categories | Residential | Commercial | Industrial | Transportation | Public management and service |
Table 3.
Accuracy of unmixed results in Shanghai.
| Sample (Categories) | PPCA (%) | Overall Accuracy (%) | ||||||
|---|---|---|---|---|---|---|---|---|
| Res | Tsp | Com | Ind | Pub | PPOA | SSOA | rRMSE | |
| Point (V) | 42.01 | 50.14 | 57.79 | 52.83 | 38.04 | 48.16 | 93.19 | 5.32 |
| Original (V) | 67.27 | 71.12 | 35.76 | 34.37 | 46.92 | 51.09 | 96.70 | 3.44 |
| Refined (V) | 65.50 | 59.34 | 57.88 | 37.36 | 52.32 | 54.48 | 96.53 | 3.38 |
| Refined (III) | 66.08 | 68.76 | 43.87 | 59.57 | 93.32 | 3.57 | ||
Table 4.
Accuracy of unmixed results in Quzhou.
| Sample (Categories) | PPCA (%) | Overall Accuracy (%) | ||||||
|---|---|---|---|---|---|---|---|---|
| Res | Tsp | Com | Ind | Pub | PPOA | SSOA | rRMSE | |
| Point (V) | 67.35 | 71.52 | 27.20 | 65.48 | 22.30 | 50.77 | 96.53 | 0.71 |
| Original (V) | 59.53 | 21.04 | 7.05 | 95.41 | 82.18 | 53.04 | 99.50 | 0.87 |
| Refined (V) | 78.89 | 94.03 | 30.04 | 78.66 | 38.82 | 64.09 | 99.55 | 1.04 |
| Refined (III) | 74.70 | 95.97 | 57.39 | 76.02 | 99.36 | 1.33 | ||
© 2020 by the authors. Licensee MDPI, Basel, Switzerland. This article is an open access article distributed under the terms and conditions of the Creative Commons Attribution (CC BY) license (http://creativecommons.org/licenses/by/4.0/).
Share and Cite
MDPI and ACS Style
Ren, Z.; Liu, Y.; Chen, B.; Xu, B. Where Does Nighttime Light Come From? Insights from Source Detection and Error Attribution. Remote Sens. 2020, 12, 1922. https://doi.org/10.3390/rs12121922
AMA Style
Ren Z, Liu Y, Chen B, Xu B. Where Does Nighttime Light Come From? Insights from Source Detection and Error Attribution. Remote Sensing. 2020; 12(12):1922. https://doi.org/10.3390/rs12121922
Chicago/Turabian StyleRen, Zhehao, Yufu Liu, Bin Chen, and Bing Xu. 2020. "Where Does Nighttime Light Come From? Insights from Source Detection and Error Attribution" Remote Sensing 12, no. 12: 1922. https://doi.org/10.3390/rs12121922
Note that from the first issue of 2016, this journal uses article numbers instead of page numbers. See further details here.