
A Techno-Economic Comparison between Two Methanol-to-Propylene Processes

1
The Artie McFerrin Department of Chemical Engineering, Texas A&M University, College Station, TX 77843, USA
2
Faculty of Mechanical Engineering, Ruhr-University Bochum, Universitaetsstr. 150, 44801 Bochum, Germany
*
Author to whom correspondence should be addressed.
Processes 2015, 3(3), 684-698; https://doi.org/10.3390/pr3030684
Submission received: 2 June 2015
/
Accepted: 6 September 2015
/
Published: 11 September 2015
(This article belongs to the Special Issue Sustainable Products and Processes)
Abstract
:The significant increase in natural/shale gas production in the US is causing major changes in the chemical and petrochemical markets. These changes include the increased supply of methanol and the decreased supply of propylene. As such, there are promising opportunities for methanol-to-propylene processes in the US. This paper provides a top-level techno-economic analysis of two pathways: methanol to olefins (MTO) and methanol to propylene (MTP). Base-case scenarios are simulated using ASPEN Plus to obtain the key mass and energy balances as well as design data. For each process, two scenarios are considered for the feedstock: buying methanol versus making it from natural gas. The return on investment (ROI) is calculated for both processes under broad ranges of the prices of natural gas, methanol, and products. In addition to the techno-economic analysis, the CO2 emissions are evaluated and compared.
1. Introduction
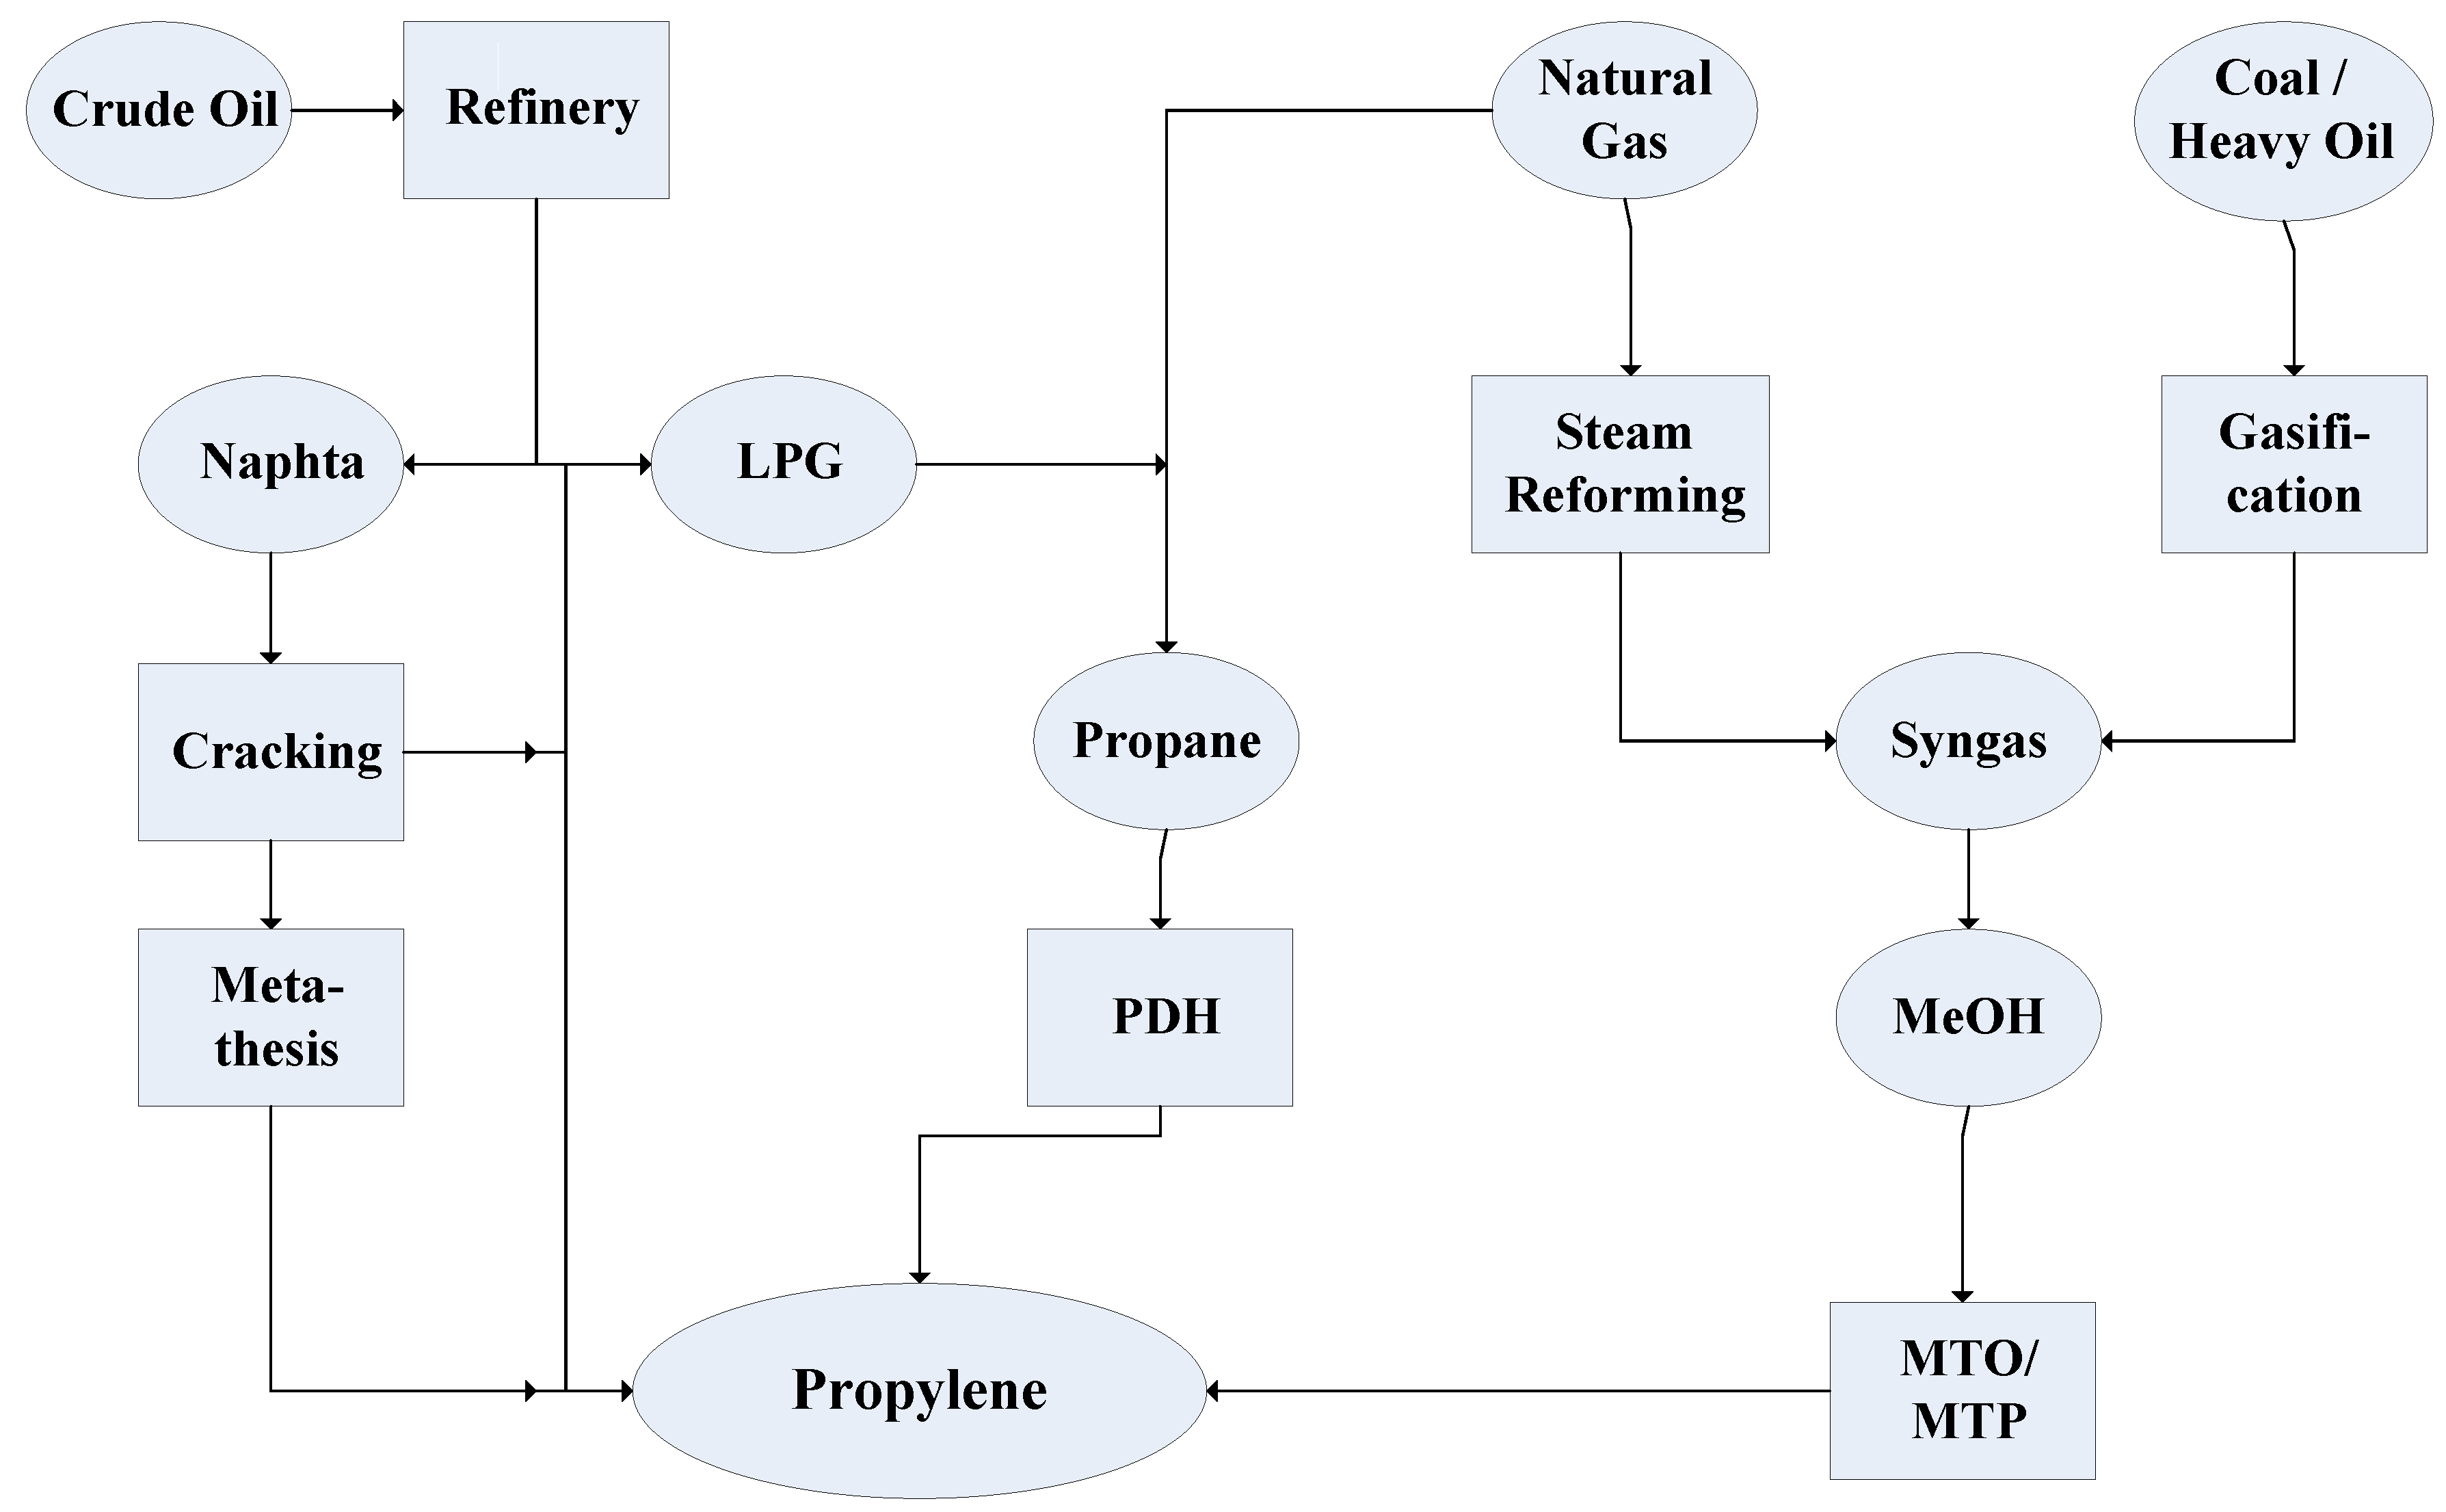
The recent and substantial discoveries of shale gas in the US are creating a high impact on the chemical industry. Substantial investments are expected to be made by chemical companies to monetize shale gas [1]. These investments will be in the form of new plants, retrofitted processes, and integrated eco-industrial parks [2,3]. One of the primary products to be made from shale gas is methanol [4]. Several new methanol plants are anticipated in the US Gulf Region (especially in Texas and Louisiana) with record capacities [5]. The additional supply of methanol will create opportunities for the cost-effective manufacture of various chemicals such as olefins, formaldehyde, dimethyl ether, MTBE, and acetic acid [2,6,7,8]. Olefins are among the various possible intermediates and final products that will be highly influenced by the downstream processing of shale gas. Not only will there be additional supplies of methanol that can be converted to olefins but also the future supply and demand of olefins make them particularly attractive products. While the escalating demand for olefins continue around the world (to make polymers, fibers, and other chemicals), the supply of olefins (especially propylene) is likely to be significantly reduced because of shale gas processing. Until recently, about 88% of propylene was obtained as a byproduct of steam cracking of naphtha to produce ethylene and fluid catalytic cracking to product gasoline [9]. As the majority of ethylene manufacturers in the US substitute naphtha with ethane (from shale gas) as the feedstock for ethylene production, propylene co-production from ethylene plants will be essentially eliminated. This switch is expected to create a substantial gap in propylene supply while the demand is expected to grow [10]. In order to deal with this growing gap, there has been a growing interest in “on-purpose” production of propylene especially [9]. There are several possibilities for on-purpose production of propylene including propane dehydration (PDH), metathesis, methanol-to-olefin (MTO) and methanol-to-propylene (MTP). The different process routes to produce propylene are represented in Figure 1.
Figure 1.
Propylene value chain.

Motivated by the increasing supplies of methanol from shale gas and the decreasing supply of propylene in the US market, this paper focuses on assessing two options for producing propylene from methanol: MTP and MTO. Compared to the more established routes for producing propylene, both MTP and MTO are much less commercially mature with no commercial installations in the US. The purpose of this paper is to provide a top-level techno-economic and environmental analysis for the MTO and MTP processes. A base-case flowsheet is first developed for each process then simulated to identify the key technical and design data. Next, a high-level economic analysis is carried out. Estimates of greenhouse gas emissions are also developed. Based on the US market conditions, a sensitivity analysis is conducted for several scenarios.
2. Base-Case Process Description
To obtain a basis to evaluate the economic viability and the environmental impact of the methanol related processes to produce propylene, the UOP/Hydro MTO process with a combined Olefin Cracking Process (OCP) by Total and the Lurgi MTP process were selected as the basis for the process flowsheets. Because of the lack of detailed data about these processes, key information were extracted from the publicly available literature then an ASPEN Plus simulation model was developed to detail input/output data and the design information. As such, the results obtained in this paper should be regarded as sample findings for MTO and MTP and not necessarily representing the performance of the processes developed by UOP/Hydro, Total, or Lurgi.
3. The UOP/Hydro MTO Process
First, we provide a brief description of the UOP/Hydro MTO process and the Lurgi MTP process. Both processes consist of three main sections: (1) methanol production; (2) methanol to olefin reaction; and (3) product purification and separation. The first section is omitted if methanol is to be purchased and to be the feedstock to the plant. The simulation and techno-economic data for the methanol production from shale gas have been provided in literature [4]. The reaction for MTO can be shown in two steps [11]. The first step is the conversion of methanol to dimethyl ether (DME) and water:
2CH3OH → CH3OCH3 + H2O
Next, DME is converted to both ethylene and propylene. The ratio between ethylene and propylene production depends on the catalyst, reaction parameters and the technology.
CH3OCH3 → C2H4 + H2O
3CH3OCH3 → 2C3H6 + 3H2O
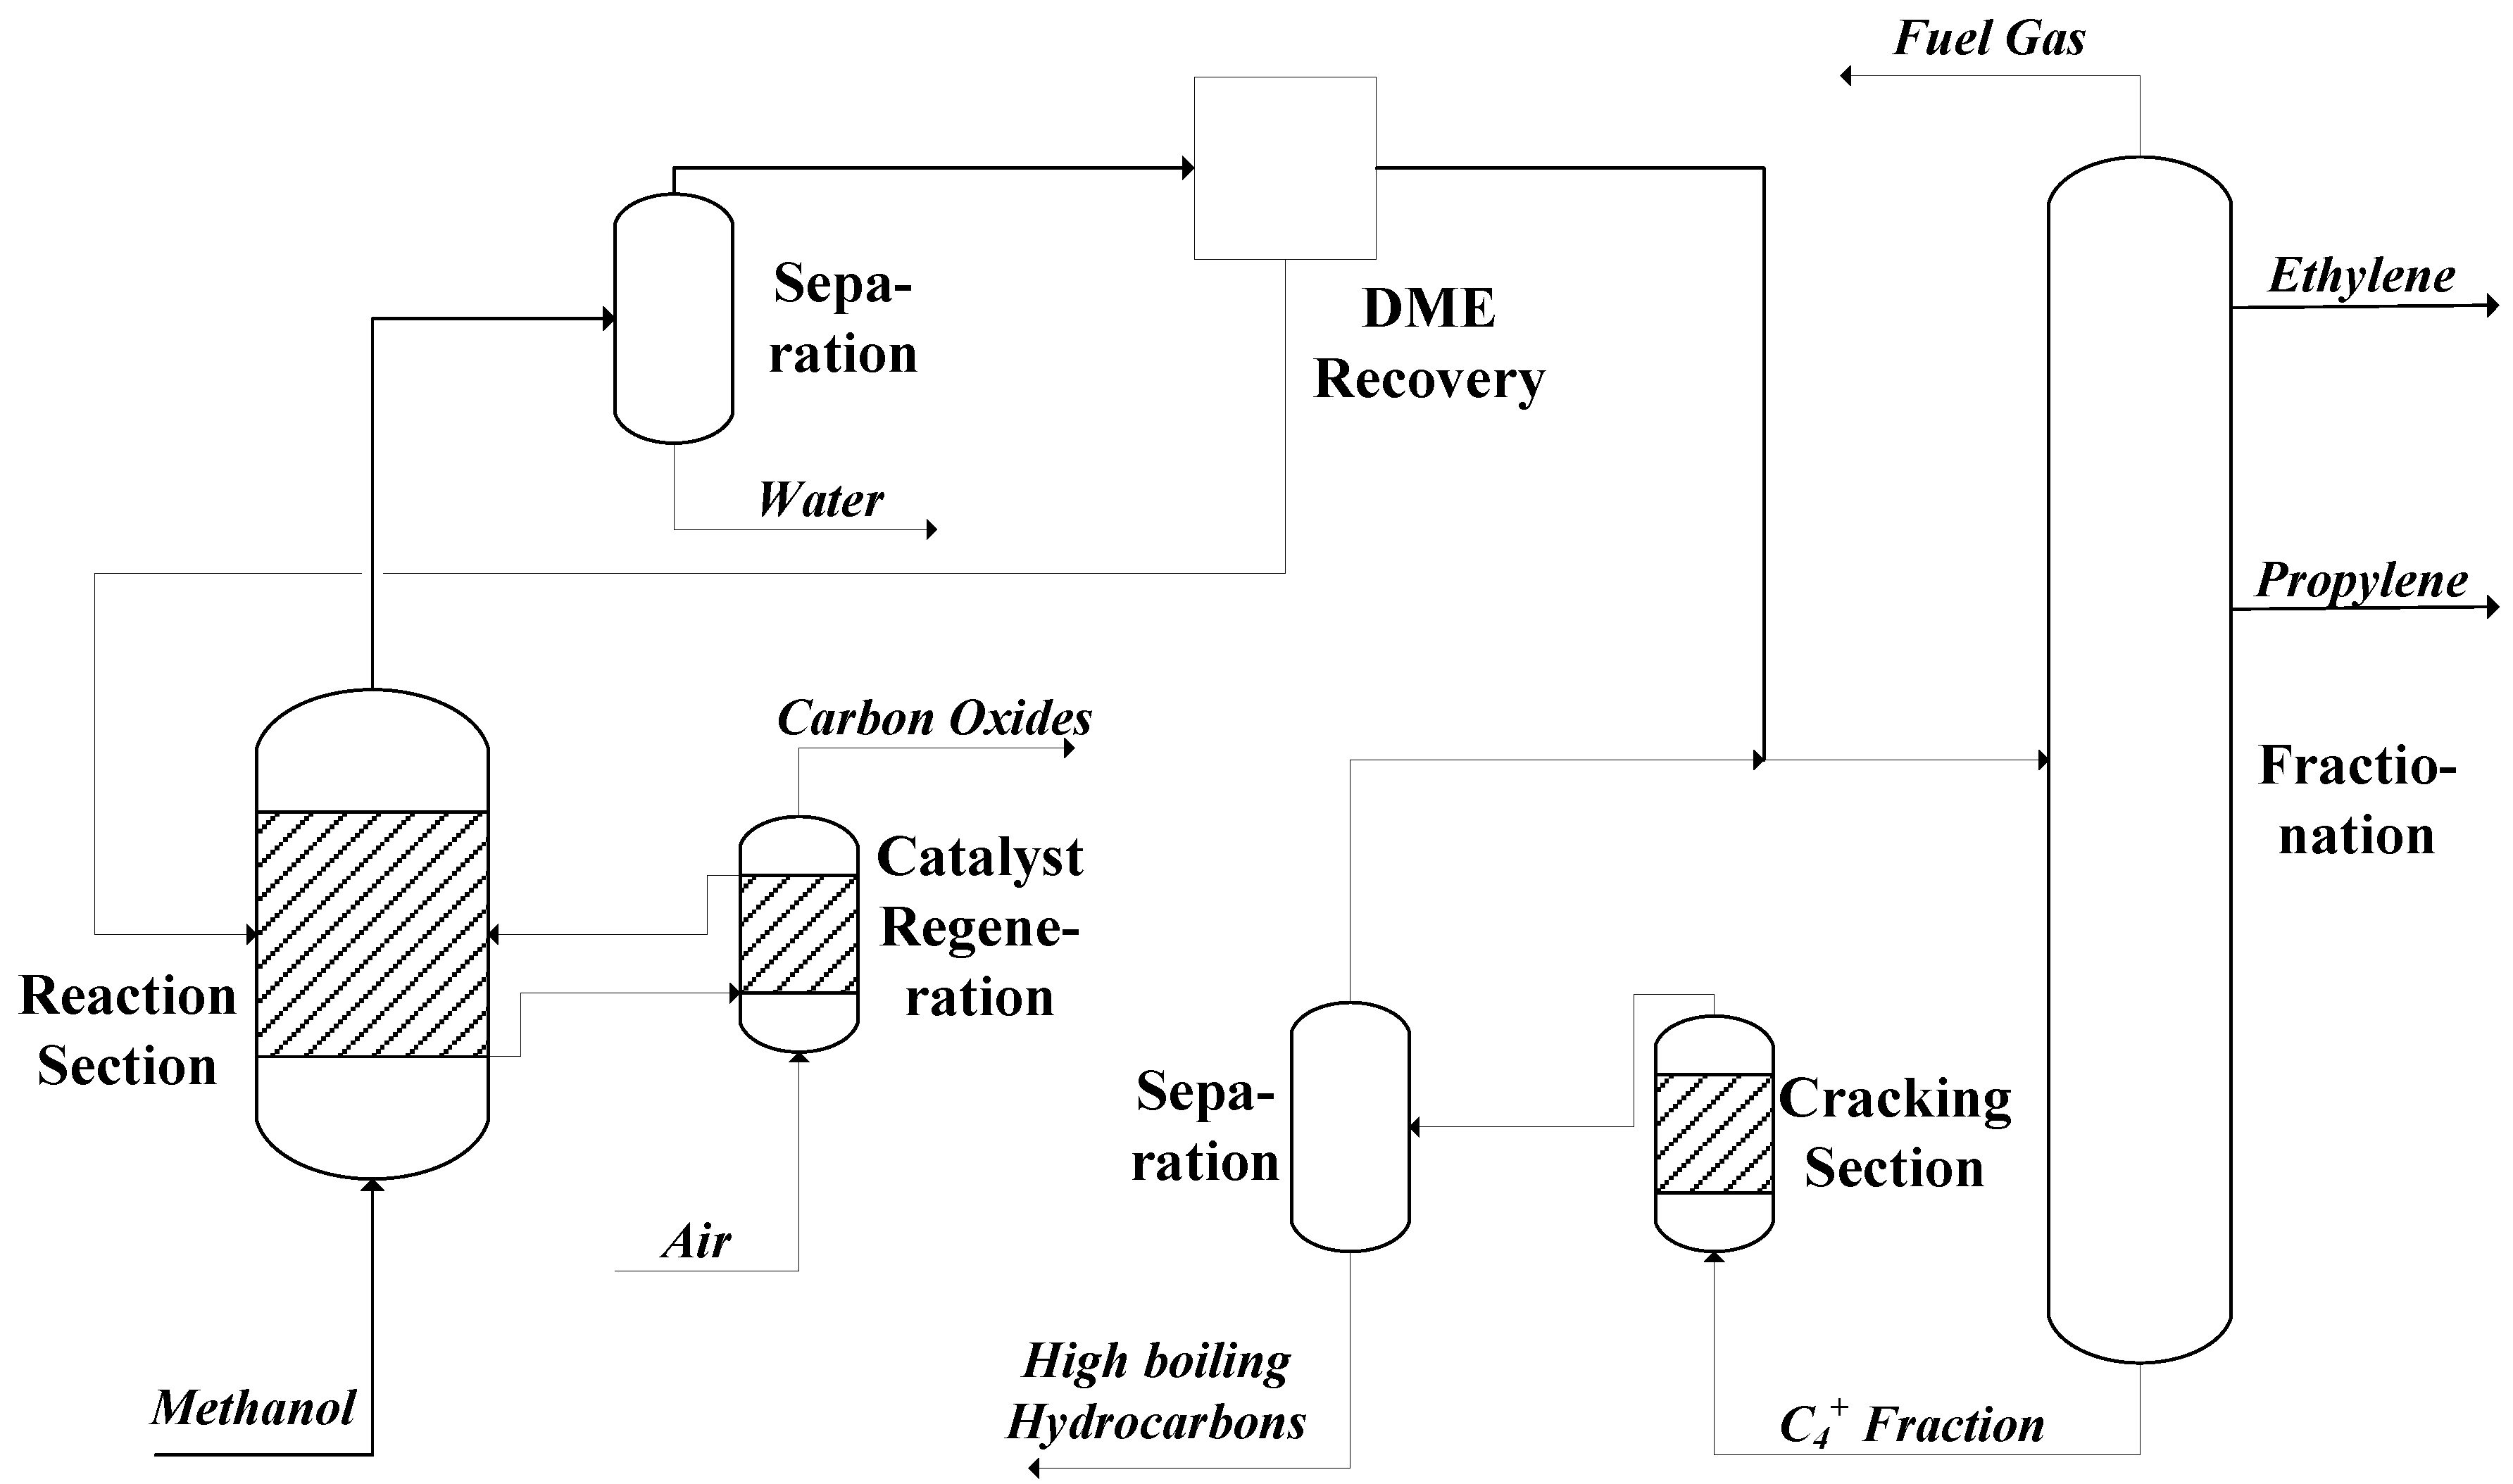
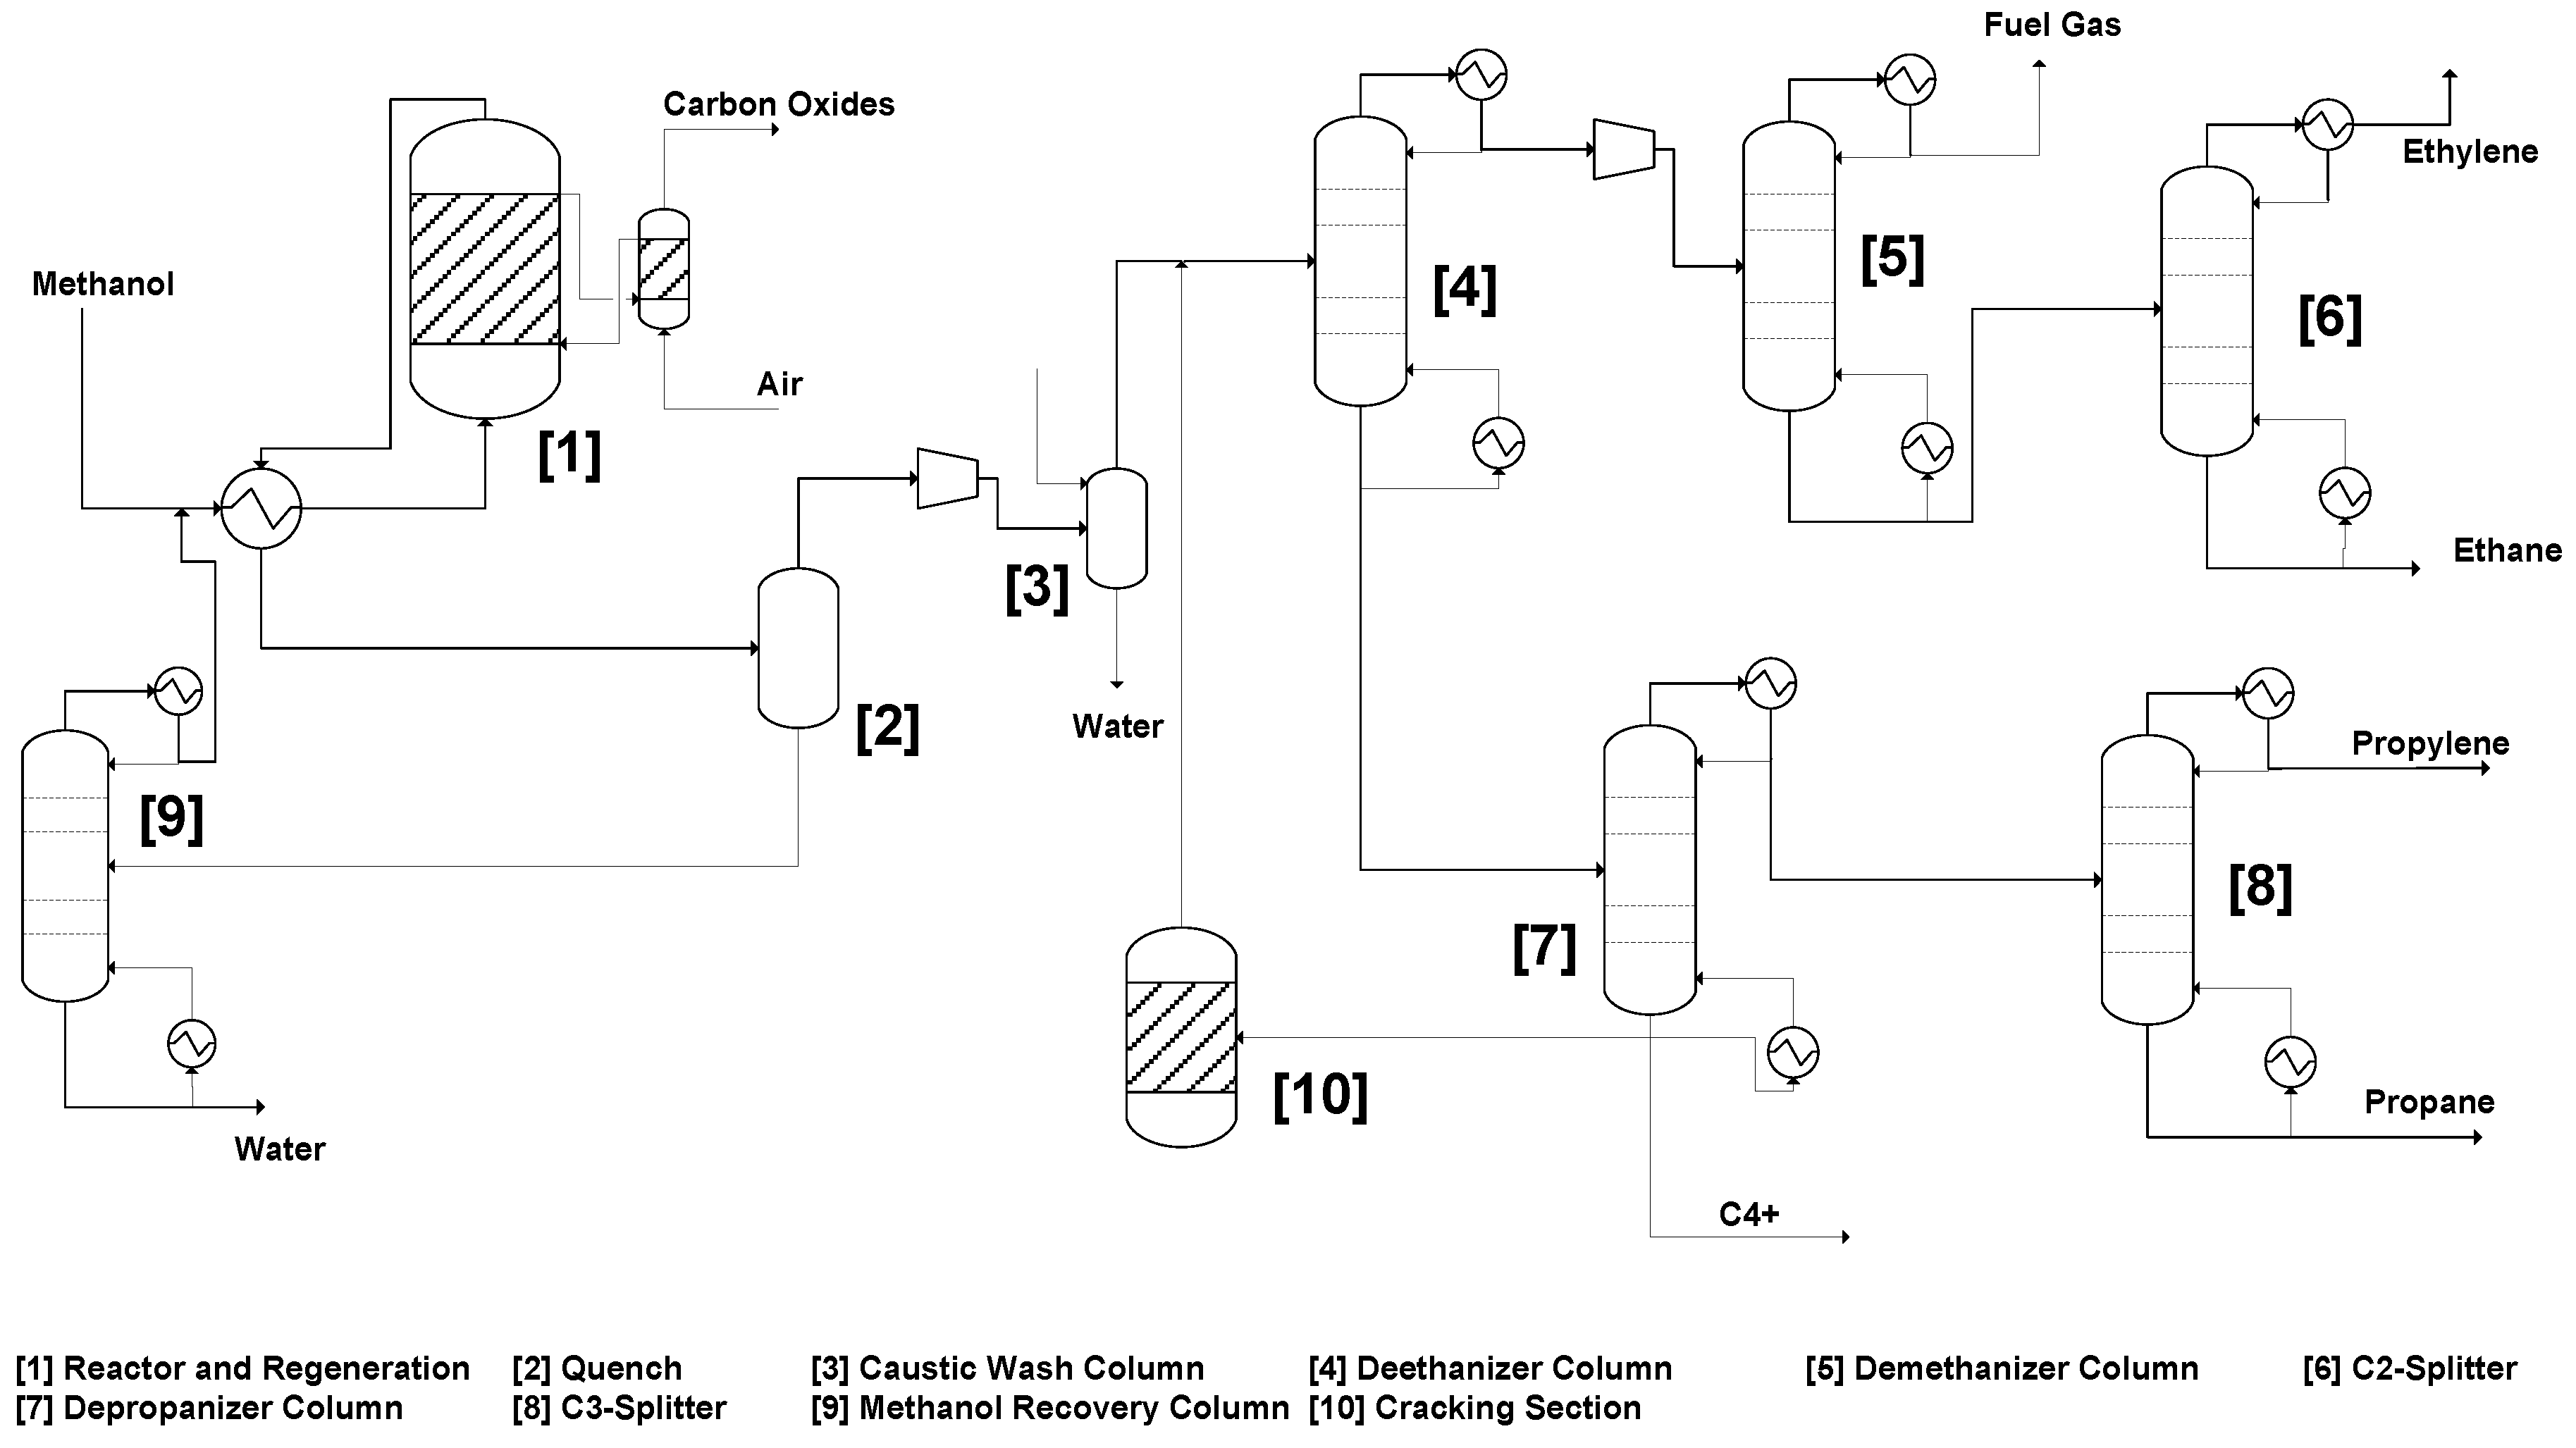
The UOP/Hydro MTO process can achieve almost complete conversion of methanol and can provide 80% yield from methanol to ethylene and propylene [12]. The MTO process converts crude methanol to olefins, which results in savings for a methanol purification section. Figure 2 shows the Advanced MTO process, which is a combination of the UOP/Hydro MTO process and the Olefin Cracking Process (OCP) by Total.

The reaction takes place on a SAPO-34-type zeolite catalyst in a fluidized-bed reactor. The catalyst is deactivated over time by the building of coke, which is why a portion of the spent catalyst is continuously removed from the reactor to a regeneration reactor. Air or oxygen is introduced to that regeneration reactor so that the catalyst can be regenerated by building carbon oxides [15]. The product stream leaving the reactor is fed to a separation section to remove water and to recover non-reacted DME. The olefin rich stream is then passed to a fractionation section that separates the mixture into the desired ethylene and propylene streams as well as a fuel gas stream and a stream that consists of medium boiling hydrocarbons. According to the needs, the ratio between propylene and ethylene produced by the reaction can be adjusted in a range [16] of about 1.3 to 1.8. Since the focus of this paper is to examine the propylene production, a ratio of 1.8 is chosen to ensure a high propylene yield.
The heavier hydrocarbon stream leaving fractionation is fed into a cracking zone to provide another source for ethylene and propylene production. The product stream of the cracking section is separated into high boiling hydrocarbons, which are removed from the process and an olefin rich stream which is re-routed to fractionation.
4. The Lurgi MTP Process
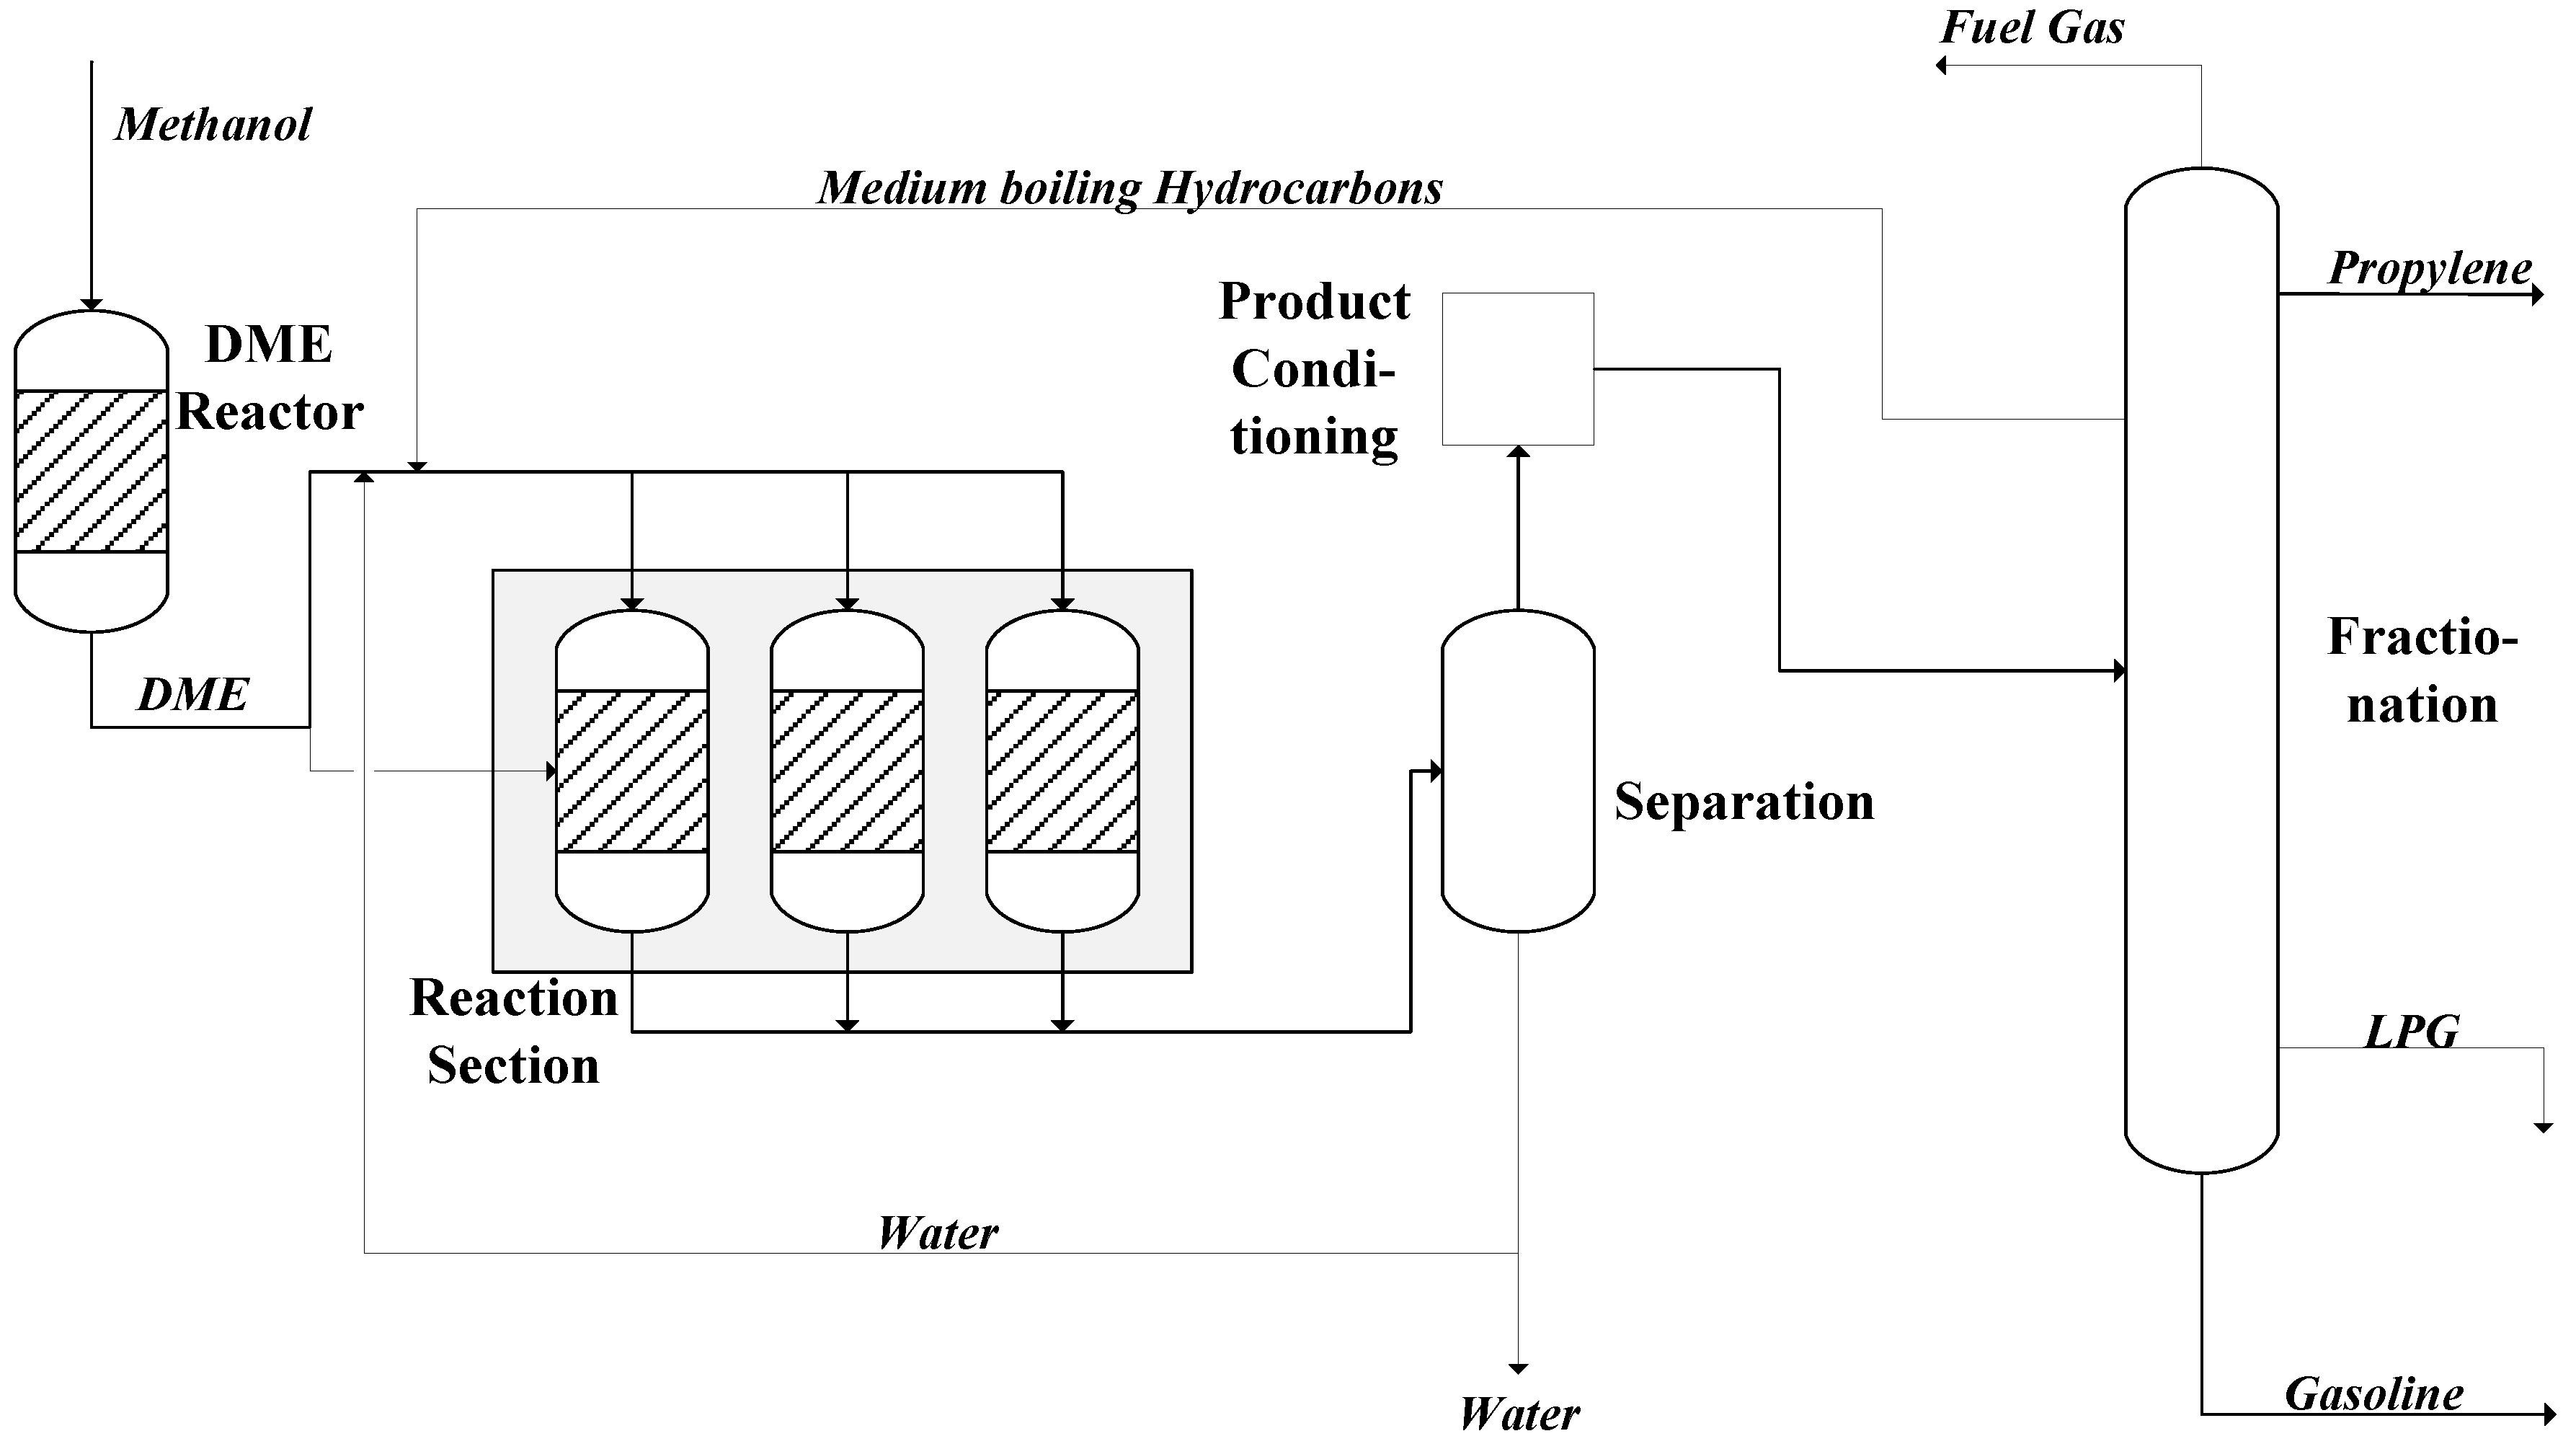
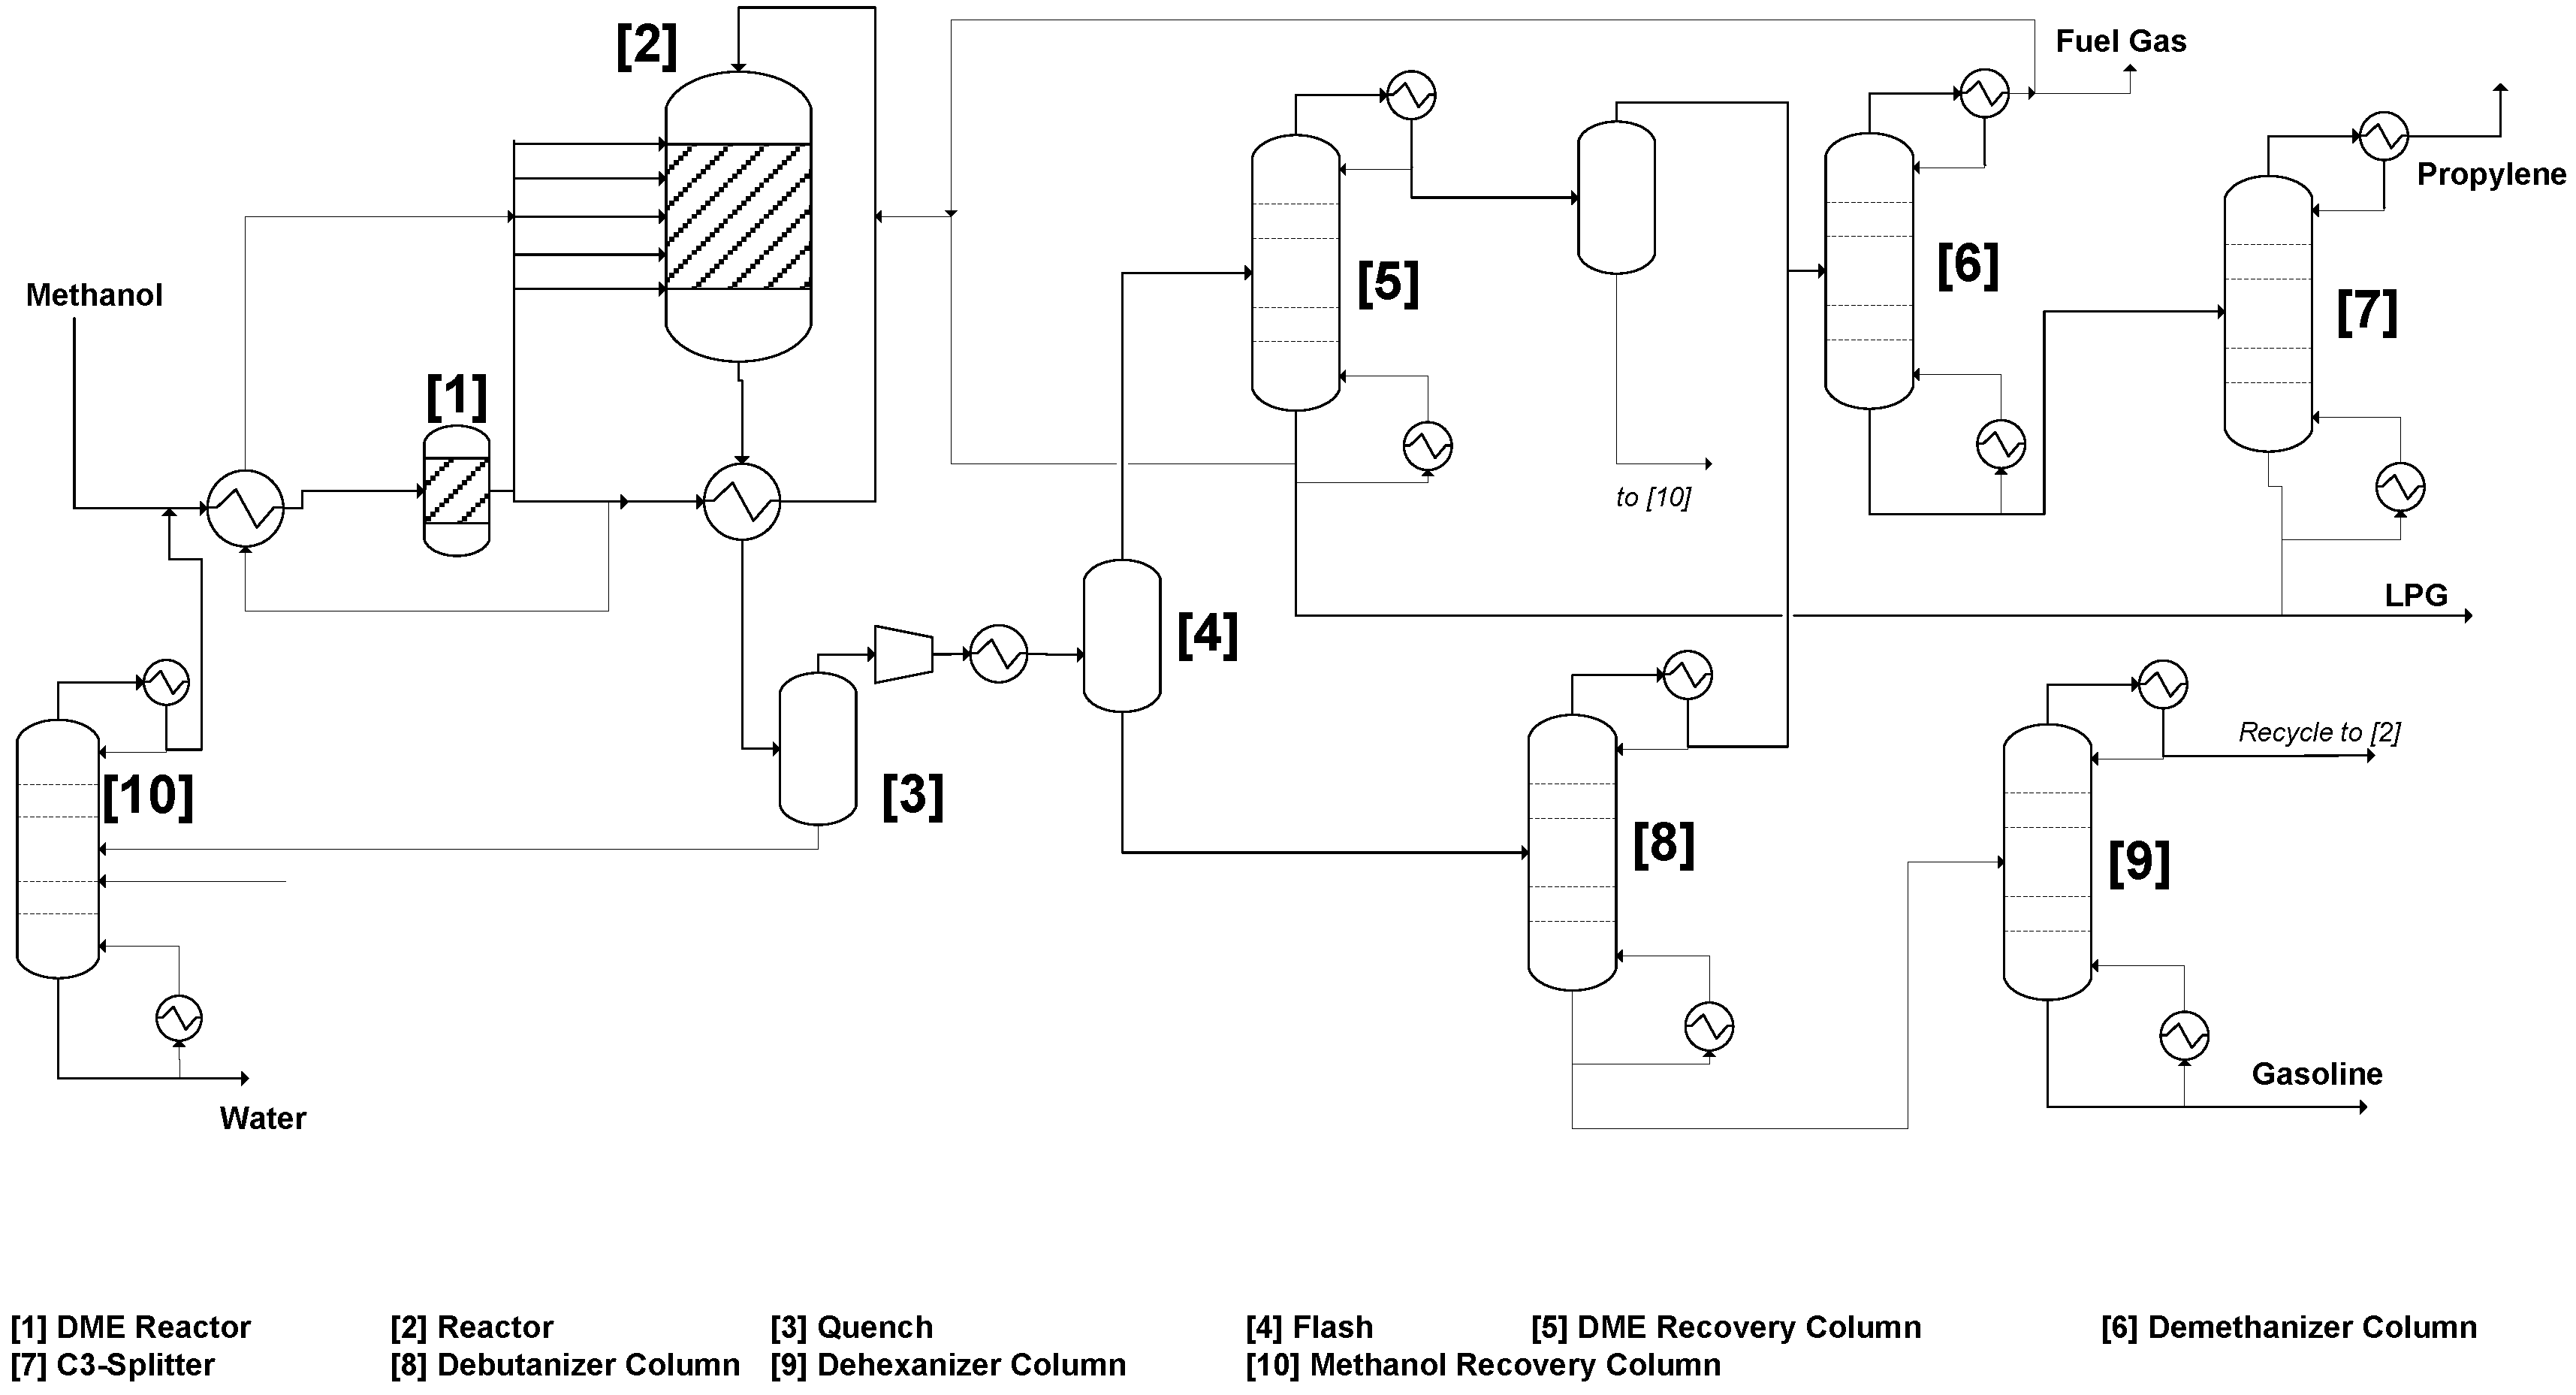
The Lurgi MTP process [17] converts methanol to propylene (Figure 3). Crude methanol has to be purified prior to the reaction. Thus, in contrast to the MTO process an additional distillation column has to be added to the process. The purified methanol is then routed to a first reactor, the DME reactor, where methanol is converted to DME and water. This stream is then further routed to the reaction section.
Figure 3.
Process flow diagram methanol-to-propylene process [17].
Figure 3.
Process flow diagram methanol-to-propylene process [17].

The olefin reaction takes place on a zeolite-based catalyst (ZSM-5) in a fixed bed reactor. To maintain the process conditions over the reactor, five or six catalyst beds are used [18]. For catalyst regeneration, the reaction zone consists of three reactors, which are operated in parallel. One of them is in stand-by mode to remove the formed coke by introducing air. The product stream is directed to the separation section where water is removed and rerouted to the reaction section. After product conditioning, the product stream is routed to fractionation. There, the product stream is split up into the desired products propylene and gasoline as well as LPG and fuel gas. A stream of medium boiling hydrocarbons is rerouted from fractionation to the reaction section to improve the yield of propylene.
5. Significant Differences between MTO and MTP
The first difference between the two processes is the desired product. Whereas MTO claims ethylene as well as propylene as desired product, MTP is designed to produce mainly propylene and a smaller amount of gasoline.
According to the process itself, the second main difference between the processes is the type of reactor. The MTO uses a fluidized-bed reactor, which is favorable with respect to the exothermic reaction so that the released heat can be removed faster. Moreover, the spent catalyst can be regenerated easily by continuously removing a part of the catalyst from the reactor and reroute it back after regeneration. However, the fluidized-bed implies the presence of a stable catalyst, which had to be developed for these special conditions. On the other hand, MTP uses a fixed-bed reactor. The difficulty with respect to the heat of reaction is overcome by using multiple catalyst beds and introduction of fresh reactants after each bed. A fixed-bed reactor is easier to scale-up, has lower investment costs and provides higher product selectivity due to the uniform resistant time of the reactants. An important difference between the two processes is the feedstock. Whereas MTO can use crude methanol, the methanol for MTP has to be purified prior to the reaction. This results in additional investment costs for MTP compared to MTO.
6. Process Simulation and Analysis
In order to develop the details necessary for the techno-economic analysis, the MTO and MTP processes were modeled using ASPEN Plus computer-aided simulation. The flowsheets created for simulating both processes are shown by Figure 4 and Figure 5. It is worth noting that the objective was not to replicate the UOP/Hydro or Lurgi processes. Instead, these flowsheets were developed to capture the essence of MTO and MTG processes and to provide results for sample processing routes with typical values of key design and operating parameters used in these process. The results from the process simulation were exported to ASPEN’s Process Economic Analyzer and supplemented with literature data [4,19,20]. For each process, two scenarios were considered for the feedstock: buying methanol and manufacturing methanol from natural gas. The techno-economic data for natural gas conversion to methanol were taken from literature [4]. The main feedstock and product flows for the base cases are shown by Table 1. The base-case plant capacities were taken in the ranges of proposed commercial operations [5,20]. For the base case, the following prices were used: $450, 1300, 1300, and 885/ton of methanol, propylene, ethylene, and gasoline, respectively. A sensitivity analysis for these prices will be carried out later. The time basis for the calculations is January 2015. A summary of the key economic results is given by Table 2. The detailed results are shown by Figure A1 and Figure A2 and Table A1 and Table A2.
Figure 4.
Flowsheet for the MTO Process.


| Chemical | Methanol | Propylene | Ethylene | Gasoline |
|---|---|---|---|---|
| MTO (kt/a) | 1560 | 386 | 214 | - |
| MTP (kt/a) | 1825 | 568 | - | 157 |
Figure 5.
Flowsheet for the MTP process.

| Process | MTO | MTP | ||
|---|---|---|---|---|
| Feedstock | Methanol | Natural Gas | Methanol | Natural Gas |
| Fixed Capital Investment (MM$) | 320 | 1570 | 345 | 1720 |
| Sales (MM$/a) | 780 | 877 | ||
| Raw Material Cost (MM$/a) | 700 | 130 | 820 | 155 |
| Cost of Energy Consumption (MM$/a) | 37.5 | 75 | 33 | 71 |
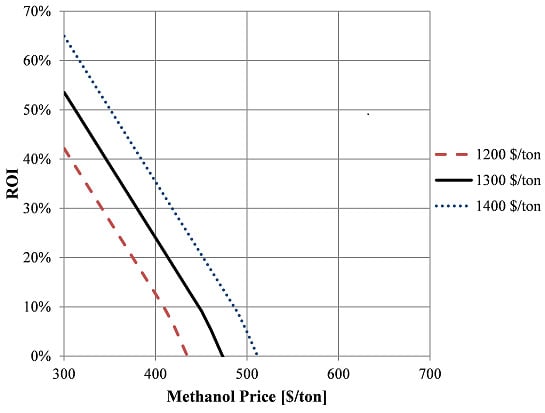
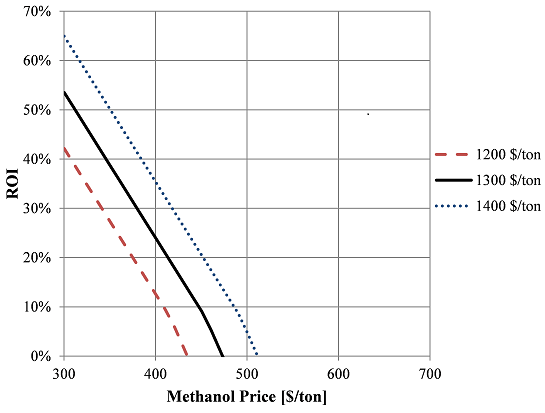
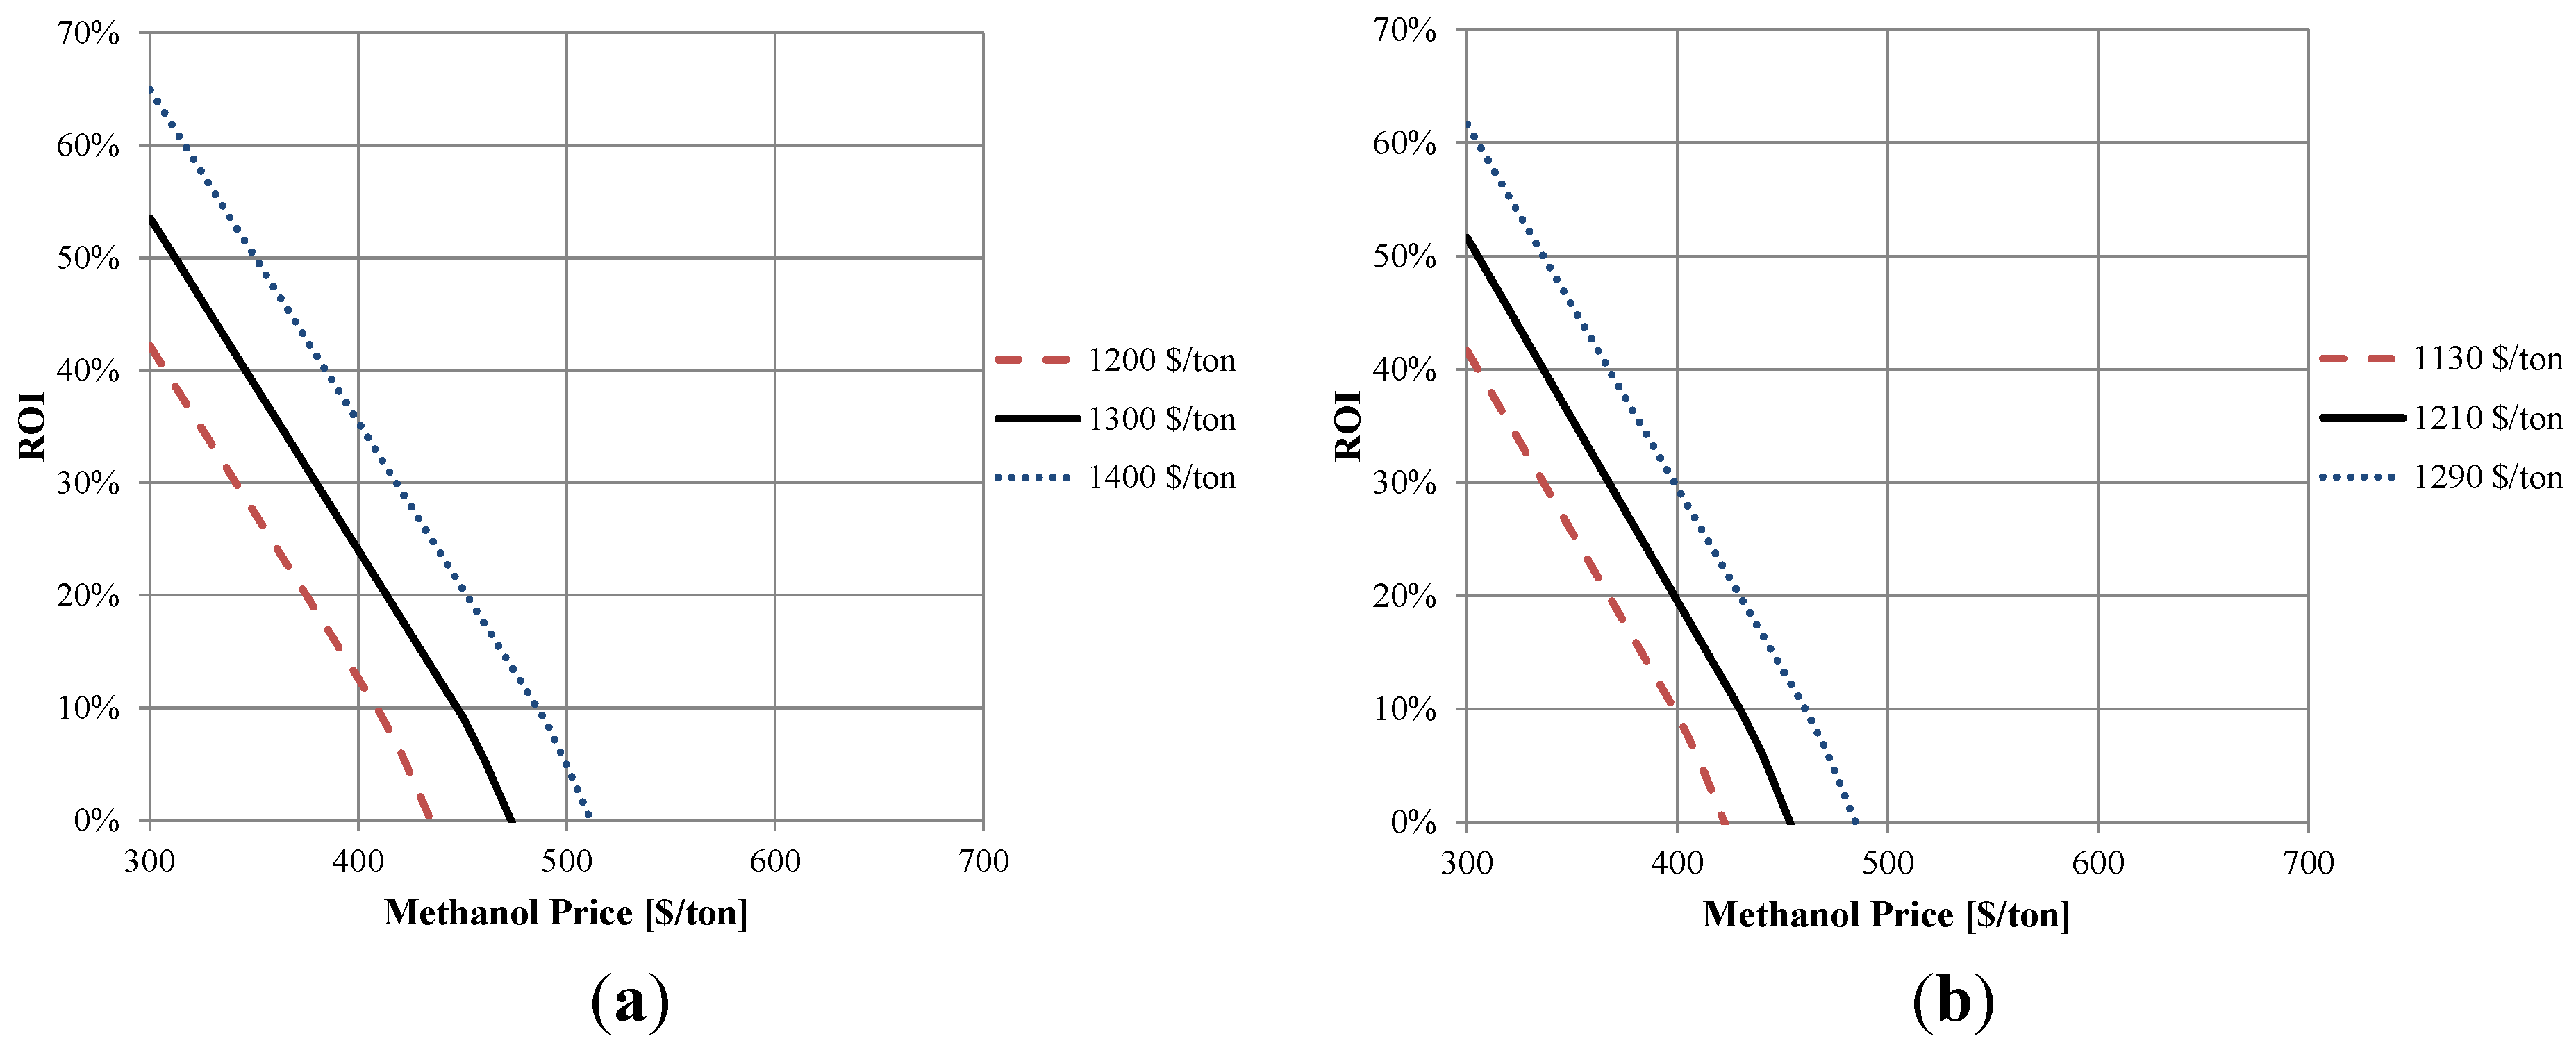
Next, the return on investment (ROI) for the four scenarios shown in Table 1 was calculated. The calculations assumed a ten-year linear deprecation scheme, a 30% tax rate, and the working capital investment (WCI) to be 15% of the fixed capital investment (FCI). Two different types of sensitivity analyses were carried out to assess the impact of feedstock prices and the product selling prices on the ROI. For the MTO process ethylene and propylene were considered as products, whereas for the MTP process, propylene and gasoline were considered as products. Both products were weighted with the corresponding production amount of the base case process to determine the combined product selling price. Figure 6a,b show the ROI trends for both MTO and MTP, respectively, over a range of methanol prices and for different product selling prices. When methanol prices are very low (~$300/ton), the ROI is quite attractive (40%–65%) for both processes. A more realistic price range for methanol is between $400–500 per ton. For this range, the ROI for both processes becomes strongly influenced by the selling price of the products. When the product selling prices are relatively low (e.g., $1200/ton for MTO and $1130/ton for MTP the ROI for a methanol price of $400/ton is about 10% which is barely acceptable. This is a particularly important issue for the MTO process if the ethylene prices drop. For instance, if the propylene price remains at $1300/ton but the ethylene price drops to $800/ton, the weighted average selling price of the two product drops to $1120/ton which makes the ROI slightly below the minimum acceptable level of 10% at a methanol price of $400/ton. At a methanol price of $600/ton, both processes are economically infeasible. It is also worth noting that heat integration may be applied to both processes. A recent study [4] presented a detailed analysis of the heat integration options for the methanol-making option of the process. The same approach was extended for the methanol-buying options of the process. An enhancement of less than 1% in ROI was observed for all tested scenarios.
Figure 6.
Sensitivity analysis for the ROI of MTO (a) and MTP (b) for product selling prices over a range of methanol purchased costs.
Figure 6.
Sensitivity analysis for the ROI of MTO (a) and MTP (b) for product selling prices over a range of methanol purchased costs.

If an ROI of 15% is considered to be economically viable, the MTO process can operate economically with a methanol purchase price between $390–470 per ton depending on the product selling price. Rather similarly, the MTP process can operate economically (with 15% ROI) within a range of a methanol purchase price of $380–460 per ton depending on the product selling price.
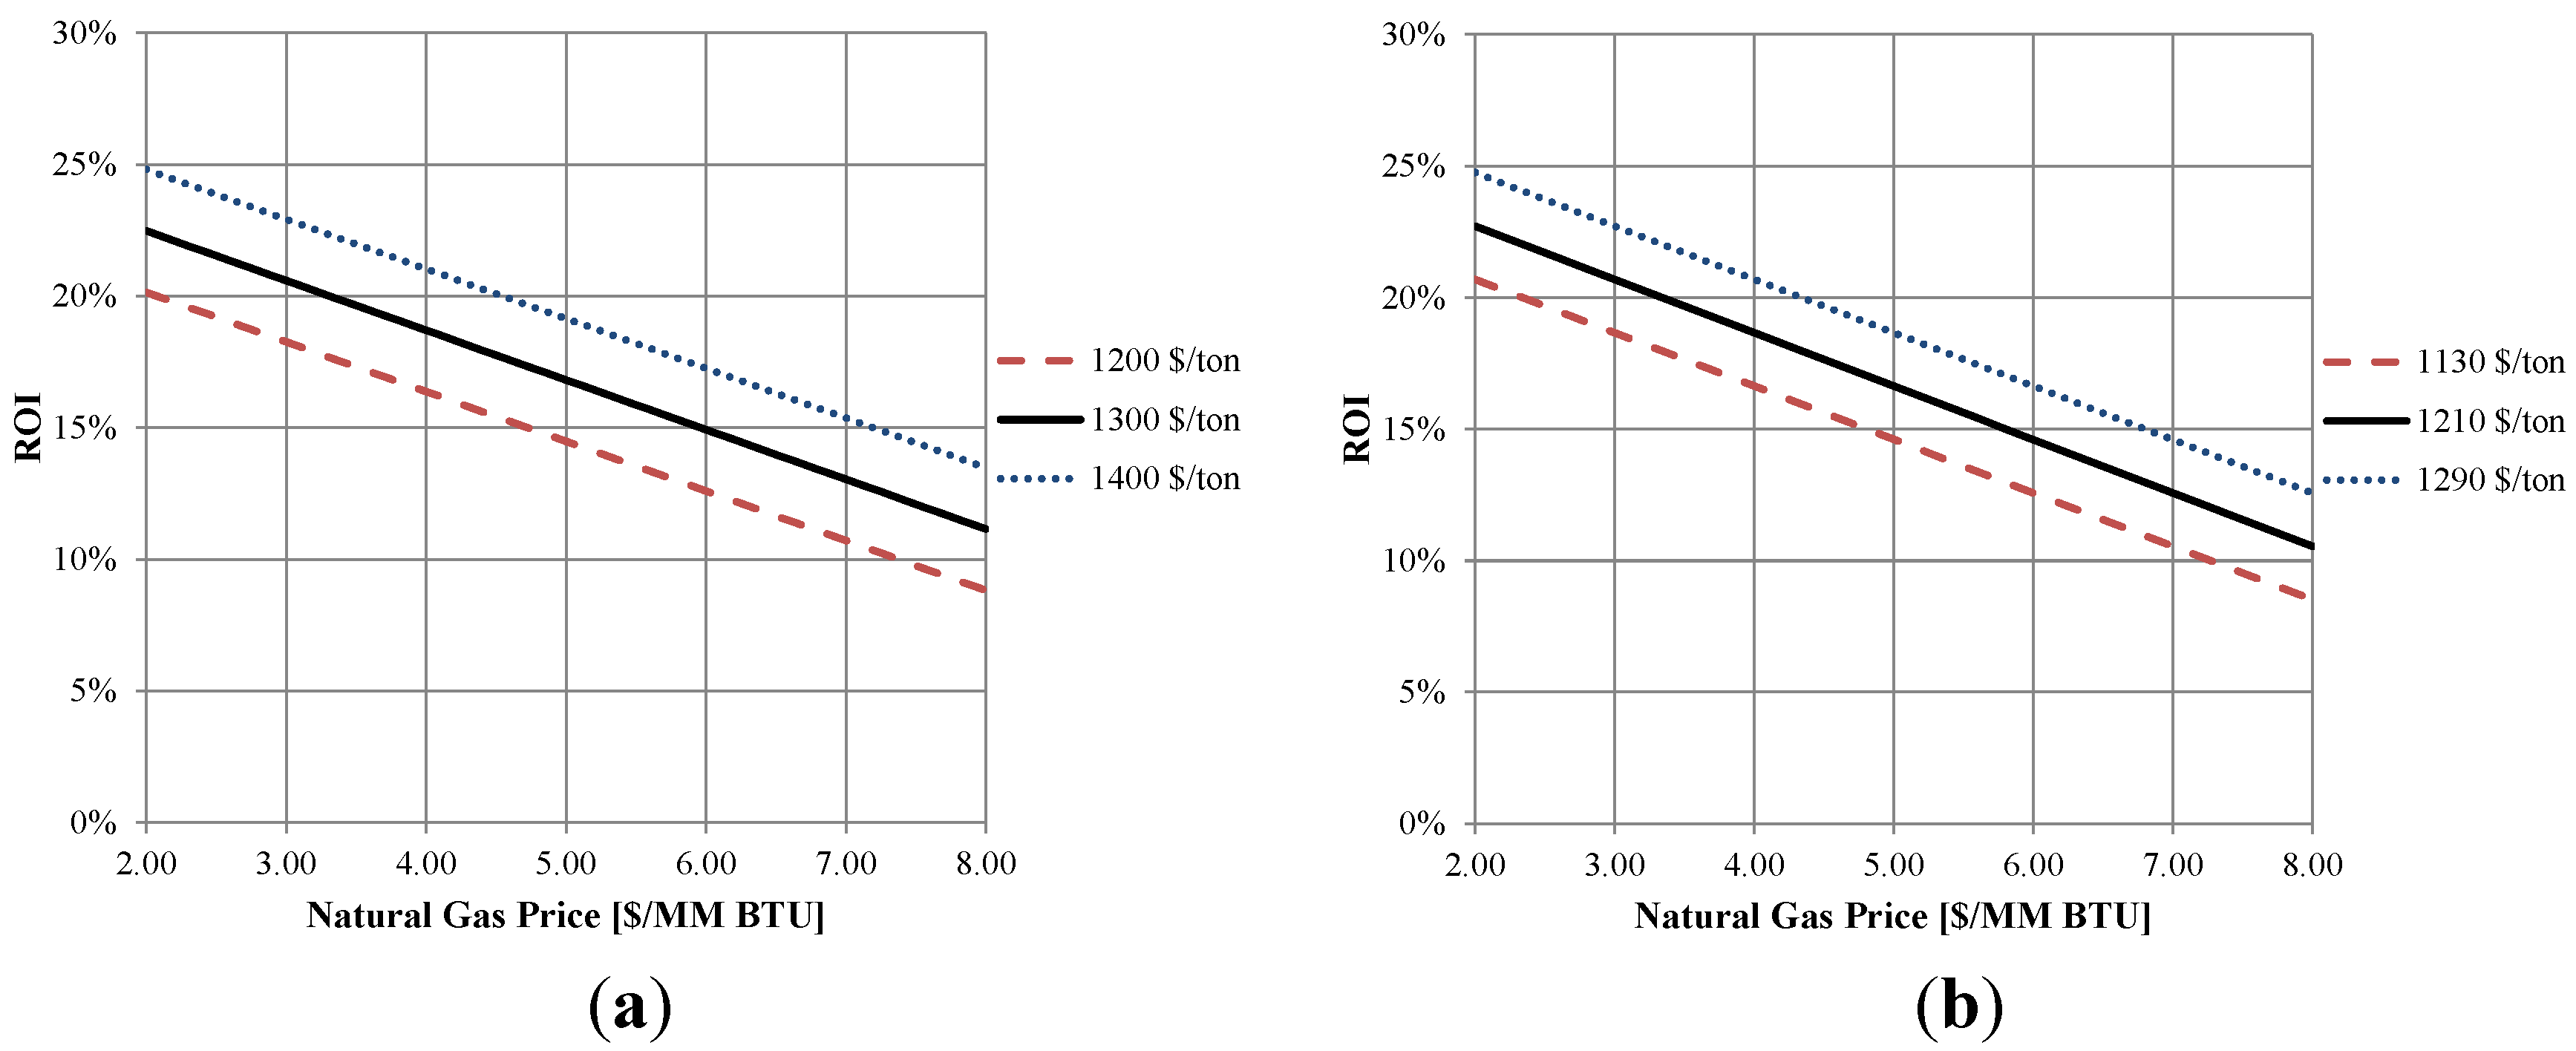
A recent study [4] used a methanol selling price of $600/ton for a base-case analysis to convert natural gas (priced at $3.50/MM Btu) to methanol. As mentioned earlier, the results of Figure 6 show that the $600/ton of purchased methanol leads to economic infeasibility of MTO and MTP. Therefore, we next consider the case of integrating a natural gas-to-methanol plant with MTO or MTP. The sensitivity analysis is carried out for a natural gas price range of $2.00–8.00/MM BTU. The ROI trends are shown in Figure 7a,b. The results show that both the MTO and the MTP are economically viable over natural gas prices ranging from $2.00 to 8.00/MM BTU ($1.89 to 7.58/109 J).
Figure 7.
Sensitivity analysis for the ROI of MTO (a) and MTP (b) when natural gas is the feedstock for product selling prices over a range of natural gas purchased costs.
Figure 7.
Sensitivity analysis for the ROI of MTO (a) and MTP (b) when natural gas is the feedstock for product selling prices over a range of natural gas purchased costs.

If an ROI of 15% is desired, both the MTO and the MTP process can operate economically if the natural gas purchased price is between $4.80–7.00 per MMBTU for the different combined product prices. This is a reasonable range for the price of natural gas as reflected by the spot prices reported over the period of May 2013–May 2015 [21].
7. Environmental Impact
The emission of CO2 is utilized to examine the environmental impact of each process. Based on the simulation results and literature data [20] (e.g., the carbon emissions are calculated based on actual CO2 emissions and energy-related emissions with the system boundary being the process itself (inside and outside the battery limit to include utilities). The resulting CO2-emissions are given in Table 3 as annual CO2-emissions as well as two normalized values for CO2-emissions (per ton of product and per ton of propylene). The allocation method based on the relative flowrates of the products was used.
| CO2-Emission | MTO | MTP |
|---|---|---|
| per year (MMt) | 8.0 | 9.2 |
| per ton product (ton/ton) | 13.4 | 12.7 |
| per ton propylene (ton/ton) | 20.9 | 16.1 |
The analysis shows that there is a difference in the environmental impact for both processes.
Concerning the total annual emission, the MTP process emits about 12% more than the MTO process, but the product types and flows are different. Therefore, another perspective is to consider the normalized emissions per ton of product or ton of propylene. Here, the MTP process produces less emissions both per ton of total product (−3%) and per ton of propylene (−30%). The latter result is skewed in favor of the MTP process because the primary product is propylene. These differences along with the possibility for carbon capture and sequestration should be further pursued if there is interest or regulation pertaining to the carbon footprint of the process.
8. Conclusions
A top-level simulation and techno-economic analysis were carried out to examine the feasibility of two processes to produce propylene: the MTO and the MTP. A base-case simulation was conducted for each process. Two scenarios were considered for the feedstock: buy versus make methanol (from natural gas). When the purchased prices of methanol are relatively low, both processes are viable. Nonetheless, as the price of methanol increases to $600/ton, both processes become economically infeasible. The economic aspects are more stable when natural gas is used as the feedstock. Over a broad range of natural gas prices ($2.00–8.00/MMBTU), both processes are economically feasible with an ROI in the range of 8%–25% depending on the product selling prices. If an ROI of 15% is desired, both the MTO and the MTP process can operate economically if the natural gas purchased price is between $4.80–7.00 per MMBTU for the different combined product prices. A top-level environmental analysis based on the CO2-emissions was carried out. On a normalized basis (per ton of combined products or ton of propylene), the MTP process shows less emissions. Further improvement of the economic and environmental aspects may be achieved by applying process integration techniques.
Acknowledgments
The authors would like to acknowledge Mohamed Noureldin (Dow Chemical Company) for his input on the scope of the paper and Debalina Sengupta (Texas A&M University) for her suggestions regarding the environmental assessment section.
Author Contributions
This paper is a joint collaboration between the two authors. The problem statement, scope, and approach were developed through discussions between the two authors. Jasper carried out the simulation runs and the economic analysis under the supervision of El-Halwagi. Both authors contributed to writing and editing of the manuscript.
Conflicts of Interest
The authors declare no conflict of interest.
Appendix
Simulation Results
This appendix provides detailed information on the stream data resulting from ASPEN Plus simulation. The reactors were modeled using the RSTIOC modules and the distillation columns were simulated using RADFRAC modules. The compressors were modeled as isentropic units with efficiencies calculated by ASPEN Plus (ASPEN Technology, Cambridge, MA, USA). The thermodynamic property set: Redlich-Kwong Soave was used. Figure A1 and Figure A2 present the ASPEN Plus simulation flowsheets and Table A1 and Table A2 give a summary of the stream results in molar flows, temperature, and pressure.
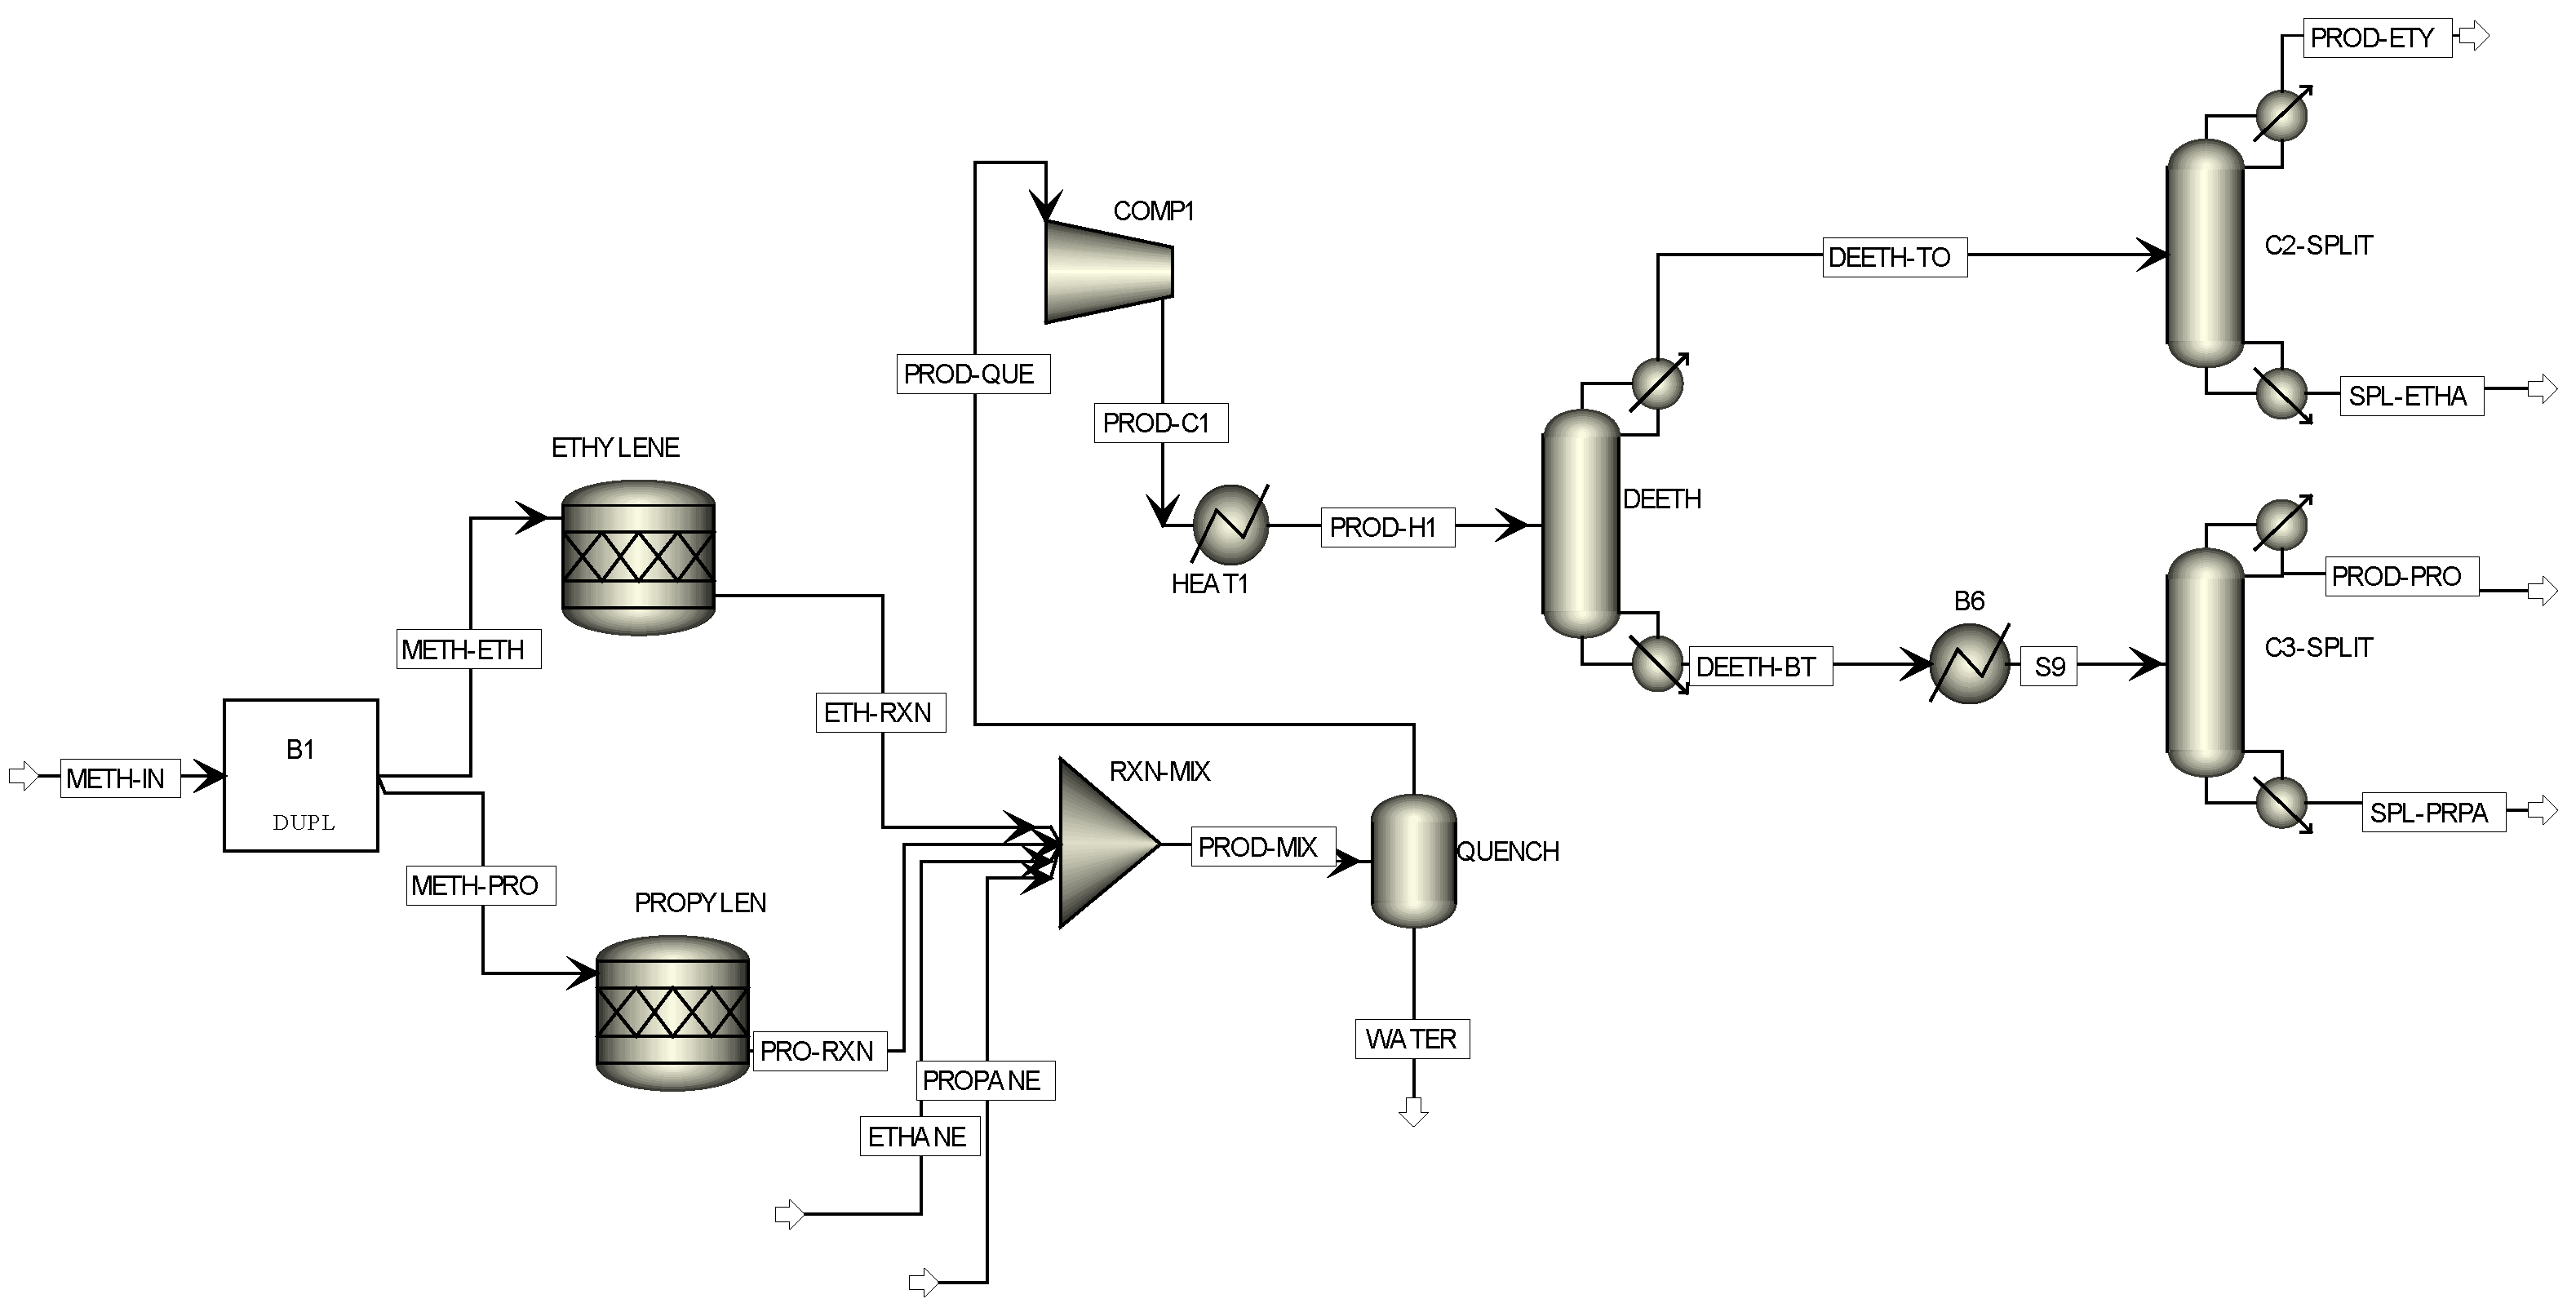
Figure A1.
The ASPEN Plus Simulation Flowsheet for the MTO Process.

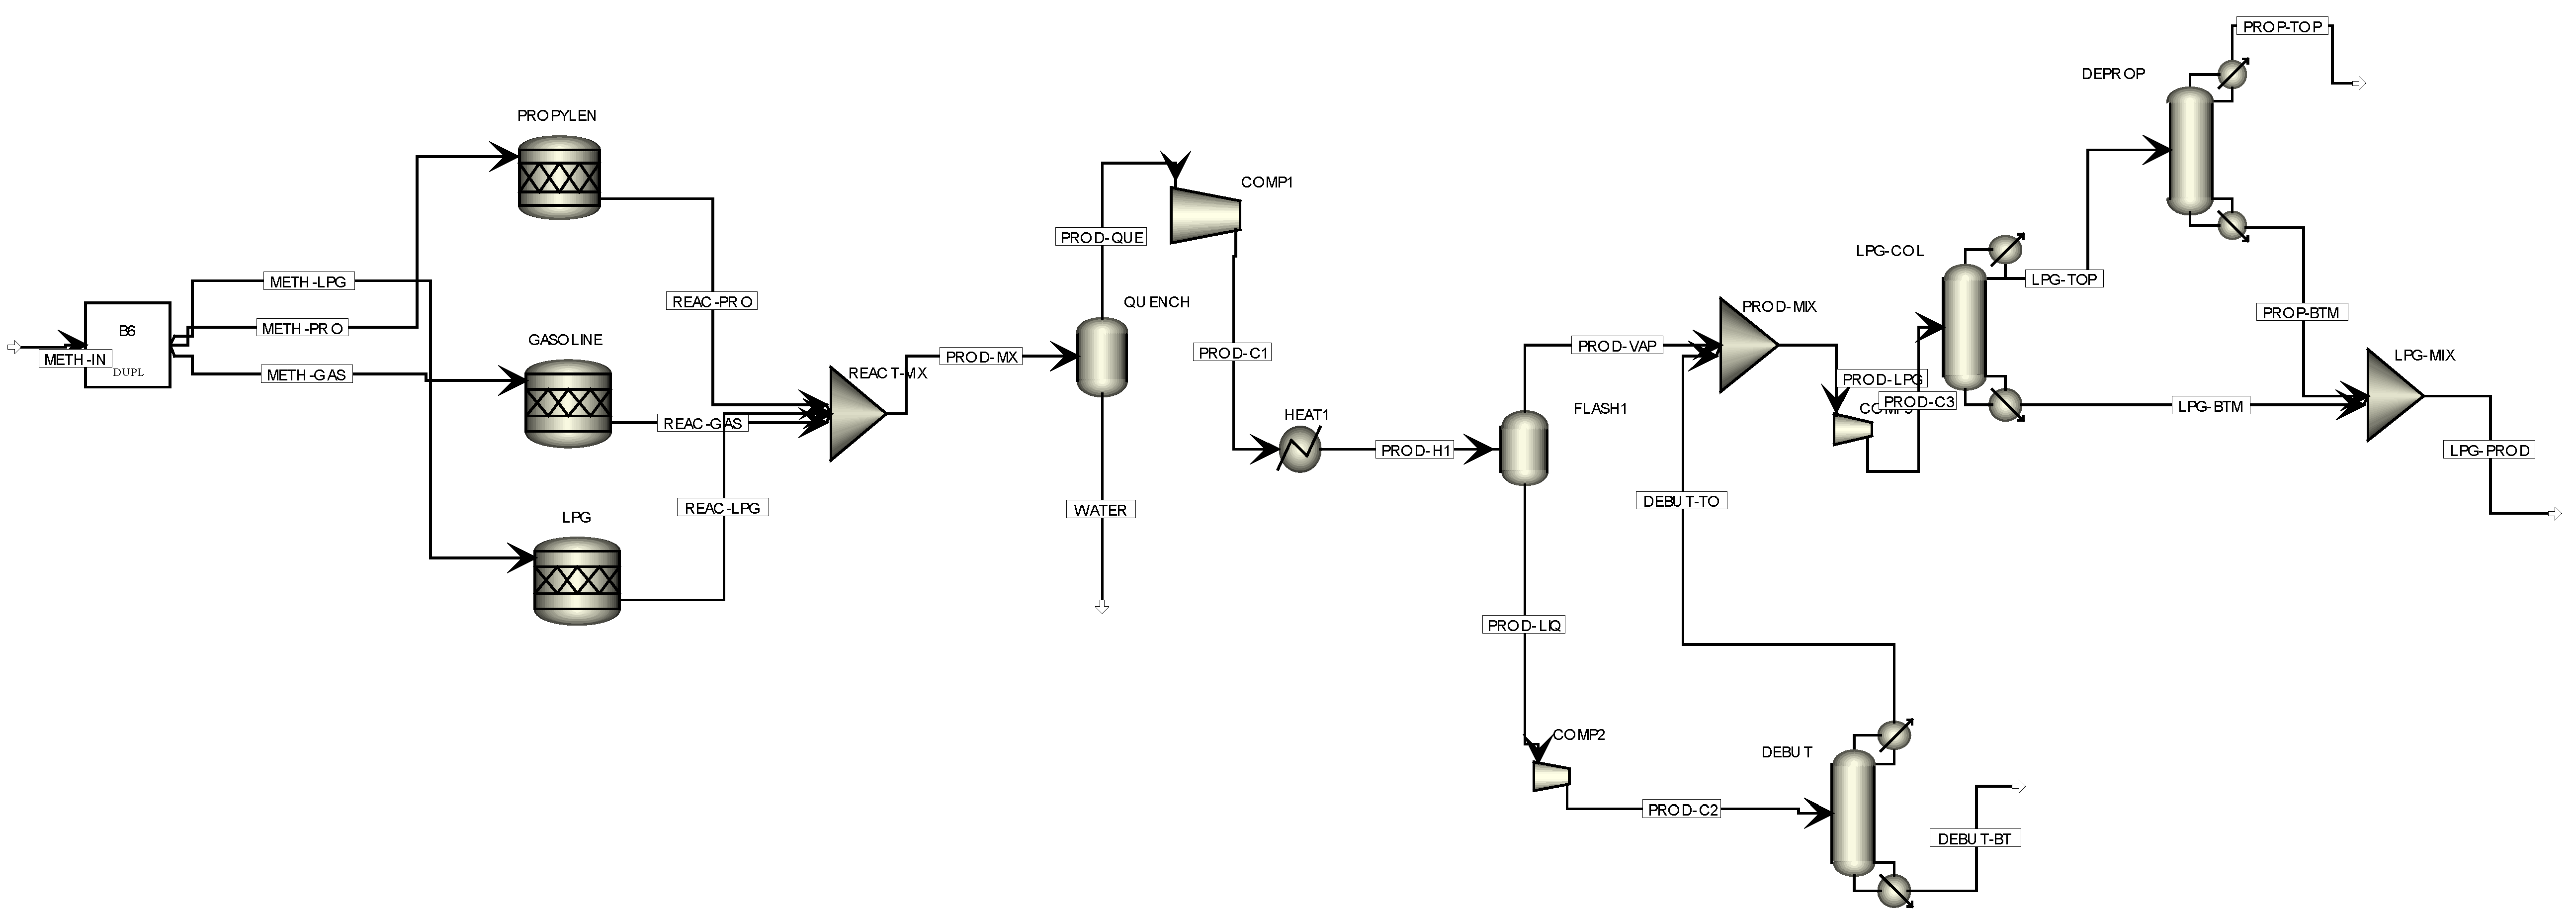
Figure A2.
The ASPEN Plus Simulation Flowsheet for the MTP Process.

| Stream | METH-IN | METH-ETH | METH-PRO | ETH-RXN | PRO-RXN | ETHANE | PROPANE | PROD-MIX | WATER | PROD-QUE |
| Molar Flow of Components (kmol/h) | ||||||||||
| Methanol | 5558.121 | 5558.121 | 5558.121 | 3779.522 | 2334.411 | 0 | 0 | 6113.933 | 1716.889 | 4397.044 |
| Water | 0 | 0 | 0 | 1778.599 | 3223.71 | 0 | 0 | 5002.309 | 3350.634 | 1651.675 |
| Ethylene | 0 | 0 | 0 | 889.2994 | 0 | 0 | 0 | 889.2994 | 0.0980242 | 889.2013 |
| Propylene | 0 | 0 | 0 | 0 | 1074.57 | 0 | 0 | 1074.57 | 0.1935819 | 1074.376 |
| Propane | 0 | 0 | 0 | 0 | 0 | 0 | 41.85 | 41.85 | 0.00458169 | 41.84542 |
| Ethane | 0 | 0 | 0 | 0 | 0 | 34.88 | 0 | 34.88 | 0.00372998 | 34.87627 |
| Total Flow, kmol/h | 5558.121 | 5558.121 | 5558.121 | 6447.42 | 6632.691 | 34.88 | 41.85 | 13,156.84 | 5067.823 | 8089.018 |
| Temperature, K | 723.2 | 723.2 | 723.2 | 723.2 | 723.2 | 723.2 | 723.2 | 723.2 | 343.2 | 343.2 |
| Pressure, atm | 1.97 | 1.97 | 1.97 | 1.97 | 1.97 | 1.97 | 1.97 | 1.97 | 0.99 | 0.99 |
| Stream | PROD-C1 | PROD-H1 | DEETH-TO | DEETH-BT | S9 | PROD-ETY | SPL-ETHA | PROD-PRO | SPL-PRPA | |
| Molar Flow of Components (kmol/h) | ||||||||||
| Methanol | 4397.044 | 4397.044 | 2.6061E-15 | 4397.044 | 4397.044 | 0 | 0 | 0.0246668 | 4397.019 | |
| Water | 1651.675 | 1651.675 | 2.792E-11 | 1651.675 | 1651.675 | 5.2367E-39 | 2.792E-11 | 0.1782296 | 1651.497 | |
| Ethylene | 889.2013 | 889.2013 | 889.2013 | 4.44229E-09 | 4.44229E-09 | 883.9327 | 5.268618 | 4.44229E-09 | 1.4085E-29 | |
| Propylene | 1074.376 | 1074.376 | 0.9134768 | 1073.463 | 1073.463 | 6.8143E-13 | 0.9134768 | 1043.909 | 29.55438 | |
| Propane | 41.84542 | 41.84542 | 0.00891728 | 41.8365 | 41.8365 | 1.0975E-16 | 0.00891728 | 35.88848 | 5.948022 | |
| Ethane | 34.87627 | 34.87627 | 34.87627 | 6.3888E-08 | 6.3888E-08 | 6.067282 | 28.80899 | 6.3888E-08 | 2.0243E-24 | |
| Total Flow, kmol/h | 8089.018 | 8089.018 | 925 | 7164.018 | 7164.018 | 890 | 35 | 1080 | 6084.018 | |
| Temperature, K | 561.3 | 283.2 | 227.8 | 275.3 | 223.2 | 226.9 | 243.5 | 299.5 | 416.1 | |
| Pressure, atm | 11.84 | 11.84 | 11.84 | 11.84 | 11.84 | 11.84 | 11.84 | 0.99 | 11.84 | |
| Stream | METH-IN | METH-LPG | METH-PRO | METH-GAS | PROD-MX | PROD-QUE | WATER | PROD-C1 | PROD-H1 | PROD-VAP |
| Molar Flow (kmol/h) | ||||||||||
| Methanol | 6503.589 | 6503.589 | 6503.589 | 6503.589 | 12,844.59 | 557.4202 | 12,287.17 | 557.4202 | 557.4202 | 198.006 |
| Water | 0 | 0 | 0 | 0 | 6666.179 | 72.04598 | 6594.133 | 72.04598 | 72.04598 | 31.2401 |
| Propylene | 0 | 0 | 0 | 0 | 1560.861 | 1531.636 | 29.22492 | 1531.636 | 1531.636 | 1495.892 |
| Butene | 0 | 0 | 0 | 0 | 121.9423 | 118.5947 | 3.347584 | 118.5947 | 118.5947 | 109.2266 |
| Methane | 0 | 0 | 0 | 0 | 0 | 0 | 0 | 0 | 0 | 0 |
| Octene | 0 | 0 | 0 | 0 | 186.9782 | 179.2943 | 7.683865 | 179.2943 | 179.2943 | 18.06346 |
| Total Flow, kmol/h | 6503.589 | 6503.589 | 6503.589 | 6503.589 | 21,380.55 | 2458.992 | 18,921.56 | 2458.992 | 2458.992 | 1852.428 |
| Temperature, K | 753.15 | 753.15 | 753.15 | 753.15 | 753.1564 | 313.15 | 313.15 | 397.3987 | 323.15 | 293.15 |
| Pressure, atm | 1.973847 | 1.973847 | 1.973847 | 1.973847 | 1.973839 | 0.9869233 | 0.9869233 | 4.934616 | 4.934616 | 0.9869233 |
| Stream | PROD-LIQ | DEBUT-TO | PROD-LPG | PROD-C2 | PROD-C3 | DEBUT-BT | LPG-BTM | LPG-TOP | PROP-TOP | LPG-PROD |
| Molar Flow (kmol/h) | ||||||||||
| Methanol | 359.4142 | 276.9019 | 474.9079 | 359.4142 | 474.9079 | 82.51225 | 474.9079 | 0 | 0 | 474.9079 |
| Water | 40.80588 | 23.4196 | 54.6597 | 40.80588 | 54.6597 | 17.38628 | 54.6597 | 3.24525E-07 | 8.5871E-16 | 54.6597 |
| Propylene | 35.74484 | 35.73529 | 1531.627 | 35.74484 | 1531.627 | 0.00955358 | 0.021517 | 1531.605 | 1531.523 | 0.1039808 |
| Butene | 9.368113 | 9.315179 | 118.5418 | 9.368113 | 118.5418 | 0.0529336 | 41.15552 | 77.38625 | 0.4770941 | 118.0647 |
| Methane | 0 | 0 | 0 | 0 | 0 | 0 | 0 | 0 | 0 | 0 |
| Octene | 161.2309 | 11.19188 | 29.25534 | 161.2309 | 29.25534 | 150.039 | 29.25534 | 0 | 0 | 29.25534 |
| Total Flow, kmol/h | 606.5639 | 356.5639 | 2208.992 | 606.5639 | 2208.992 | 250 | 600 | 1608.992 | 1532 | 676.9916 |
| Temperature, K | 293.15 | 409.5379 | 310.7821 | 525.9965 | 374.7031 | 439.2761 | 323.9297 | 242.8914 | 225.4466 | 292.281 |
| Pressure, atm | 0.9869233 | 10.85616 | 0.9869233 | 11.84308 | 2.96077 | 10.85616 | 1.973847 | 1.973847 | 0.9869233 | 0.9869233 |
References
- Swift, T.K. Shale Gas Spurs Chemical Investment and Job Creation. Chem. Eng. Prog. 2013, 109, 45–47. [Google Scholar]
- Siirola, J.J. The Impact of Shale Gas in the Chemical Industry. AIChE J. 2014, 60, 810–819. [Google Scholar] [CrossRef]
- Noureldin, M.M.B.; El-Halwagi, M.M. Synthesis of C–H–O Symbiosis Networks. AIChE J. 2015, 64, 1242–1262. [Google Scholar] [CrossRef]
- Ehlinger, V.M.; Gabriel, K.J.; Noureldin, M.M.B.; El-Halwagi, M.M. Process Design and Integration of Shale Gas to Methanol. ACS Sustain. Chem. Eng. 2014, 2, 30–37. [Google Scholar] [CrossRef]
- Kelley, L. Market outlook: “Mega-mega” methanol plants planned in US to feed China MTO. ICIS Chemical Business. Available online: http://www.icis.com/resources/news/2014/09/26/9824067/market-outlook-mega-mega-methanol-plants-planned-in-us-to-feed-china-mto/ (accessed on 26 September 2014).
- Spath, P.L.; Dayton, D.C. Preliminary Screening—Technical and Economic Assessment of Synthesis Gas to Fuels and Chemicals with Emphasis on the Potential for Biomass-Derived Syngas; National Renewable Energy Laboratory: Golden, CO, USA, 2003. [Google Scholar]
- He, C.; You, F. Shale Gas Processing Integrated with Ethylene Production: Novel Process Designs, Exergy Analysis, and Techno-Economic Analysis. Ind. Eng. Chem. Res. 2014, 53, 11442–11459. [Google Scholar] [CrossRef]
- Marano, J.; Spivey, J.J.; Morreale, B. Natural Gas Chemical Synthesis. Chem. Eng. Prog. 2015, 111, 58–62. [Google Scholar]
- Thinnes, B. On-Purpose Propylene Production. Hydrocarb. Process. 2010, 89, 19–21. [Google Scholar]
- Jenkins, S. Propylene Production via Metathesis. Technology Profile. Chem. Eng. 2013, 120, 37. [Google Scholar]
- Ding, J.; Hua, W. Game Changers of the C3 Value Chain: Gas, Coal, and Biotechnolgies. Chem. Eng. Technol. 2013, 36, 83–90. [Google Scholar] [CrossRef]
- Chen, J.Q.; Bozzano, A.; Globver, B.; Fuglerud, T.; Kvisle, S. Recent Advancements in Ethyleme and Propylene Production Using UOP/Hydro MTO Process. Catal. Today 2005, 106, 103–107. [Google Scholar] [CrossRef]
- Eng, C.N.; Arnold, E.C.; Vora, B.V. Integration of the UOP/HYDRO MTO process into ethylene plants. In Presented at the 1998 AIChE Spring National Meeting, Session 16, Fundamental Topics in Ethlyene Production, New Orleans, LA, USA, 8–12 March 1998. Paper 16g.
- Barger, P. Methanol to olefins (MTO) and beyond. Catal. Sci. Ser. 2002, 3, 239–260. [Google Scholar]
- Vora, B.; Pujado, P. Process for Enhanced Olefin Production. U.S. Patent 7,317,133 B2, 21 November 2002. [Google Scholar]
- Kempf, R. Advanced MTO: Breakthrough Technology for the Profitable Production of Light Olefins. Available online: http://www.wraconferences.com/sites/default/files/day%202%201130%20petchemRick%20Kempf.pdf (accessed on 8 September 2015).
- Koempel, H.; Liebner, W. Lurgi’s Methanol to propylene (MTP) Report on a Successful Commercialisation. In Proceedings of the 8th Natural Gas Conversion Symposium, Natal, Brazil, 27–31 May 2007; pp. 261–281.
- Koempel, H.; Liebner, W.; Wagner, M. Lurgi’s Gas to Chemicals (GTC): Advanced technologies for natural gas monetization. In Proceedings of the Gastech 2005, Bilbao, Spain, 14–17 March 2005.
- El-Halwagi, M.M. Sustainable Design through Process Integration: Fundamentals and Applications to Industrial Pollution Prevention, Resource Conservation, and Profitability Enhancement; Butterworth-Heinemann: Oxford, UK, 2009. [Google Scholar]
- Hydrocarbon Processing: “Petrochemical Processes Handbook 2014”; Gulf Publishing Company: Houston, TX, USA, 2014.
- EIA (Energy Information Administration). Natural Gas Weekly Update. Available online: http://www.eia.gov/naturalgas/weekly/ (accessed on 1 June 2015).
© 2015 by the authors; licensee MDPI, Basel, Switzerland. This article is an open access article distributed under the terms and conditions of the Creative Commons Attribution license (http://creativecommons.org/licenses/by/4.0/).
Share and Cite
MDPI and ACS Style
Jasper, S.; El-Halwagi, M.M. A Techno-Economic Comparison between Two Methanol-to-Propylene Processes. Processes 2015, 3, 684-698. https://doi.org/10.3390/pr3030684
AMA Style
Jasper S, El-Halwagi MM. A Techno-Economic Comparison between Two Methanol-to-Propylene Processes. Processes. 2015; 3(3):684-698. https://doi.org/10.3390/pr3030684
Chicago/Turabian StyleJasper, Sarah, and Mahmoud M. El-Halwagi. 2015. "A Techno-Economic Comparison between Two Methanol-to-Propylene Processes" Processes 3, no. 3: 684-698. https://doi.org/10.3390/pr3030684