
Development of Communication Protocols between BIM Elements and 3D Concrete Printing
by
 , and
, and
Eric Forcael
1,* ,
,
Javier Pérez
1,
Álvaro Vásquez
1,
Rodrigo García-Alvarado
2,
Francisco Orozco
3 and
Javier Sepúlveda
1 1
Department of Civil and Environmental Engineering, College of Engineering, Universidad del Bío-Bío, Collao Avenue, Concepción 1202, Chile
2
Department of Architecture, College of Architecture, Construction and Design, Universidad del Bío-Bío, Collao Avenue, Concepción 1202, Chile
3
College of Engineering, Universidad Panamericana, Calzada Circunvalación Poniente #49, Ciudad Granja, Zapopan 45010, Jalisco, Mexico
*
Author to whom correspondence should be addressed.
Appl. Sci. 2021, 11(16), 7226; https://doi.org/10.3390/app11167226
Submission received: 28 June 2021
/
Revised: 26 July 2021
/
Accepted: 29 July 2021
/
Published: 5 August 2021
(This article belongs to the Special Issue BIM and Its Integration with Emerging Technologies)
Abstract
:Featured Application
This research has specific applications for architectural and structural design firms to help them to develop communication protocols to connect BIM projects with robots able to print 3D concrete elements.
Abstract
Historically, the construction industry has exhibited slow technological development when compared to other industries. However, during the last several years, investigations related to automation in construction have been conducted, such as additive manufacturing in concrete. This study aims to delve into this topic, providing effective communication between BIM-designed elements and its additive concrete manufacturing, with the help of an articulated robotic arm. Therefore, the paper addresses the preparation of computer code that allows such BIM–robot communication, checking the parameters utilized, and analyzing the results of tests with the equipment involved.
1. Introduction
1.1. Context
Building information modeling (BIM) is one of the most promising recent developments in the architecture, engineering, and construction (AEC) industry. BIM technology consists of digitally constructing an accurate virtual model of a building [1]. BIM allows virtually modeling a structure before physically constructing it, empowering project participants to design, analyze, sequence, and explore a project in a digital environment that is exponentially cheaper than making changes during construction [2].
One of the most important developments in the industry is the incorporation of new technologies, showing a great potential for future advancement [3]. Such is the case of 3D concrete printing that, together with the use of robotic arms and integrative software, allows the creation of specific geometric structures [4]. This is an innovative construction method that promises to be highly advantageous in the construction field, in terms of optimization of construction time, costs, design flexibility, and reduction of errors.
3D concrete printing consists of the manufacture of a predesigned construction element in a digital model, where the concrete, which is poured through a printing nozzle, does not need any formwork or subsequent vibration. This method aims to improve the construction of concrete structures on one or more levels. It minimizes the duration of the construction process by eliminating time-consuming procedures in the traditional method, and it reduces costs incurred in the project by minimizing waste and overproduction by reducing the use of labor. It provides flexibility in the construction of structural forms that are not always possible to construct conventionally [5].
Both BIM and 3D concrete printing are facilitating the necessary assistance to practitioners to enhance the quality of industrialized construction [6]; therefore, the development of communication protocols between BIM elements and 3D concrete printing processes will play an important role in the current and future construction industry.
1.2. Description of the Problem
Historically, the construction industry has perpetuated unchanged principles for a long time; the design and construction processes are embedded in paradigms deeply rooted in the culture of this industry. In contrast to traditional ways to develop construction projects, new trends aimed at improving the conception of production processes are emerging [7]. Technologies applied to this industry have a lower performance due to technical, organizational, and economic obstacles. Labor efficiency is low compared to other industrial sectors; the accident rate in construction sites is significant, there is a relatively low quality of work, and the control of the construction site is difficult, so manual labor is decreasing little by little [8]. Automation in construction processes seems to be the answer.
Currently, the 3D printing of concrete using robotic systems has been carried out with own-designed codes or with software accompanied by plugins associated with the equipment involved (robots). BIM models consist of digital data that allow the realization of a structure where, by using this data, it is possible to elaborate trajectories for an automated system, such as a robot [9]. However, there is limited evidence on the existence of computer routines that allow fluid and simple communication between BIM models and a robotic arm to print 3D elements of concrete, which, in practice, correspond to machine-to-machine communication protocols (BIM–robot), the main objective of this research.
1.3. Scope of the Study and Research Objectives
In this research, we aim to contribute to a change in traditional construction methods through the use of tools that allow automating and connecting design and manufacture of personalized structures through 3D concrete printing. To do it, the following software were used: Autodesk RevitTM, DynamoTM for Revit, and a KUKATM robotic arm, along with a robust computer.
In addition, the equipment used in this research corresponds to a robotic arm, specifically the KUKA|Quantec KR120 R2500, which has six axes of movement, which gives it the possibility of printing detailed and complex construction elements. The robotic arm is connected to a concrete pump by means of a nozzle through which the concrete used for the printed element circulates.
The use of these tools allows not only automating a process that for years has been carried out in a traditional and little mechanized way but also optimizing the use of resources by reducing construction time, maximizing the use of the material, and avoiding the use of formworks. Most of the unused material—95% to 98%—can be recycled [10].
Thus, the main research objective consists of designing communication protocols between BIM-designed elements and their 3D concrete printing. The specific objectives are: (a) to develop a code that allows constructive elements to be linked to a KUKATM robot; (b) to design printing paths allowing the correct 3D printing process of BIM-designed elements; (c) to check that a KUKATM robot correctly executes the parameters entered in the code; (d) to run the code into the KUKATM robotic arm to test different printing paths.
2. Literature Review
2.1. Parametric Design and BIM
A parametric model allows generating changes in structures and dimensions quickly and accurately. In a parametric design, designers must model not only the element to be designed but also a conceptual structure that guides the different variations it can have. Parameterization can improve the search for designs, in different contexts, that better adapt to the requirements of each particular project. It can facilitate the discovery of new forms and reduce the time and effort required for changes or reuse. It can also improve understanding of the conceptual structure of the element to be designed. However, parameterization can also have certain disadvantages, such as requiring additional effort to implement it and increasing the complexity of design decisions [11].
The parametric approach establishes relationships between the parts and builds a design based on them. Then, it can modify the designs based on the evaluation and selection of the results obtained, opening the possibility of examining variants without the need of redoing, in each attempt, the representation work. When talking about a parametric model, each entity has associated parameters that control its geometric properties, its location in the model, and how they relate to each other. The parameters can be modified by the operator to create the expected geometry [12].
For its part, BIM, an acronym for building information modeling, is one of the most promising developments for the architecture, engineering, and construction (AEC) industry. Today, BIM is considered a common language in construction projects and a driver of resounding change on a global scale. Recent government requests for fully collaborative BIM, as a requirement in different countries, have generated great interest in the adoption of BIM and its uses, creating a great demand for a competent BIM workforce.
This technology allows creating a virtual model with more data and with more precise, and necessary geometries to support the construction, providing functions needed to model the life cycle of the project. With this methodology, it is possible to obtain better quality projects at lower cost and in less time [13], supported by software and tools that help designers to better perform in their specialized fields [14]. Some software packages have modules that can build a 3D model of structures and facilities. BIM is a new world for professionals accustomed to single drawing or calculation software [15].
The workflow is through categories, families, and elements that are interconnected. The category is the procedure in which the type of object is defined according to its function and its general properties. Within these categories, the elements are grouped into families, and in turn, the families put together elements with common characteristics. In particular, RevitTM, a design software developed by Autodesk, predefines a collection of parameters for each family; these parameters are called “type parameters”. Within families, parametric objects are organized by types, in which at least one type must be defined [16].
2.2. Additive Manufacturing and 3D Concrete Printing
Additive manufacturing or 3D printing is a process that uses technology that, in an automation process, allows users to design and create personalized three-dimensional objects, directly from a digital model, without using formworks in their manufacture [17]. Only the material required for the creation of the element designed is used without generating waste. This lowers cost and allows greater efficiency and more sustainable production [18]. Specifically, in the architecture industry, additive manufacturing is replacing manual construction techniques used in traditional structural works [19].
There are six types of standardized categories to classify additive manufacturing technology [20], as follows: (1) extrusion-based additive manufacturing of concrete; (2) vat photopolymerization; (3) powder bed fusion; (4) injection by a binder or “binder jetting”; (5) material injection or “material jetting”; and (6) laminated object manufacturing (LOM).
All this has advanced the construction industry in the development of new additive manufacturing technologies, such as 3D concrete printing [21], where concrete is considered the most used material in the construction industry [20], given that the components for its manufacture are easily accessible and inexpensive in the most places in the world. As is known, concrete has the advantages of being durable and resistant, and because of its fluidity before setting, it is possible to create almost any concrete element [22].
Concrete elements require formworks for their manufacture [10], where the cost of formworks can vary between 35% to 60% of the total cost of the concrete structure [23]. Therefore, the possibility that structures can be built without the need of using formworks creates great advantages for the construction industry, reducing costs and manufacturing times [24].
Concrete printing uses additive manufacturing techniques based on placing layers of concrete successively; this allows creating structures with more complex geometries compared to the traditional process [25]. This construction technique can become an efficient process, but to achieve it, it is necessary to overcome its limitations [26]. These limitations are related to the hardening and the placement of concrete layers over time, because the time between layers must be long enough to ensure the strength of the concrete, without experiencing deformations when the subsequent layers are deposited, and short enough to ensure the union between them in an optimal way [24].
3. BIM and 3D Concrete Printing Process
For years, robotics has been commonly used in manufacturing industries; however, the situation in the construction industry has not been as favorable, in particular with a lack of research bridging the gaps in integrating BIM with a manufacturing system and BIM with task-oriented robotics [27]. Existing knowledge of BIM serves as the basis for developing new approaches, which point to more frequent use of automated manufacturing processes. Digital building models (specifically the design, planning, and construction) are relevant to 3D printing [28].
BIM covers not only geometry information, but also material performance, spatial relationships, and manufacturing information. More recently, BIM has proved to be an effective method to implementation of 3D printing, both on the small and large scales [29]. In this sense, BIM methodology will be the core of future 3D printed buildings because, thanks to 3D printing, it is easier and faster to create buildings with complex shapes [30].
3.1. Parametric Programming Languages and 3D Printing of Concrete
DynamoTM is a platform that allows visual programming through a plugin that can easily work with RevitTM. It uses workflows that enable it to work algorithmically (a set of steps that follow a basic logic of input, processing, and output). DynamoTM is intended to be used by architecture and construction professionals who require its capabilities but without the need for advanced knowledge about programming [31]. Additionally, DynamoTM has proved effective in creating and estimating the 3D printing elements and components [32].
GrasshopperTM is a complement to the CAD RhinocerosTM software. Like DyamoTM, it works through data workflows, allowing users to create acyclic graphics. GrasshopperTM focuses on sequences and constant visualization in real time, facilitating quick reaction to changes or errors, without having to restart the code [33]. GrasshopperTM is currently the most used program in 3D concrete printing, with the help of content add-on KUKA|prc.
On its part, KUKA|prc allows the user to program industrial robots directly from the parametric modeling environment, including complete kinematic simulation of the robot. The generated files can be executed in the robot KUKATM robot, without the need for any additional software [34].
Finally, designing the printing path by directly extracting information from the BIM platform in 3D printing processes can reduce data loss from a 3D BIM model to printing path generation [35].
3.2. Combination of RevitTM and DynamoTM Software
RevitTM is a parametric modeler capable of creating relationships between design and building elements that help streamline the construction process by improving visibility and graphics of the objects based on a rational list of well-understood categories. This is different from CAD, where each line belongs to a layer, and the handling of each layer is up to the user. In the world of BIM, layers do not exist, as in the real world where constructions are not made of abstract layers. Additionally, one of the features of RevitTM is the ability to work around a single file in which the design and construction documentation are carried out in a holistic model [36].
3.3. The Role of Robotics in 3D Concrete Printing
Despite being considered a traditional industry in terms of technology, the construction sector is developing robotic technology to help in complex or dangerous tasks [39]. In this sense, the use of robotic technology in construction has the advantages of improving the quality of the final product and reducing costs thanks to the optimization of time and resources [40].
Robots used for 3D concrete printing are commonly equipped with a nozzle, capable of extruding layers of cementitious materials with specific dimensions. As a complement, both the material preparation and a delivery system are required to continuously feed concrete to the nozzle. In turn, software controls both the robot and the material preparation unit [41].
The purpose of these robots is to reproduce the movements and joints made by the human arm and hand, which allow up to 7 degrees of freedom. This is possible because of the combination of the 5-axis head together with a 6-axis robotic arm. Their greatest advantages are the improvement in efficiency in construction, a reduction in the margins of error, and an increment in terms of work safety [20].
3.4. Functioning of the Robotic Arm
The present study used a German KUKATM robot. The company that manufactures this equipment is currently one of the main providers of intelligent automation solutions for the world industry, even manufacturing sensitive robots capable of working in collaboration with their operators [42].
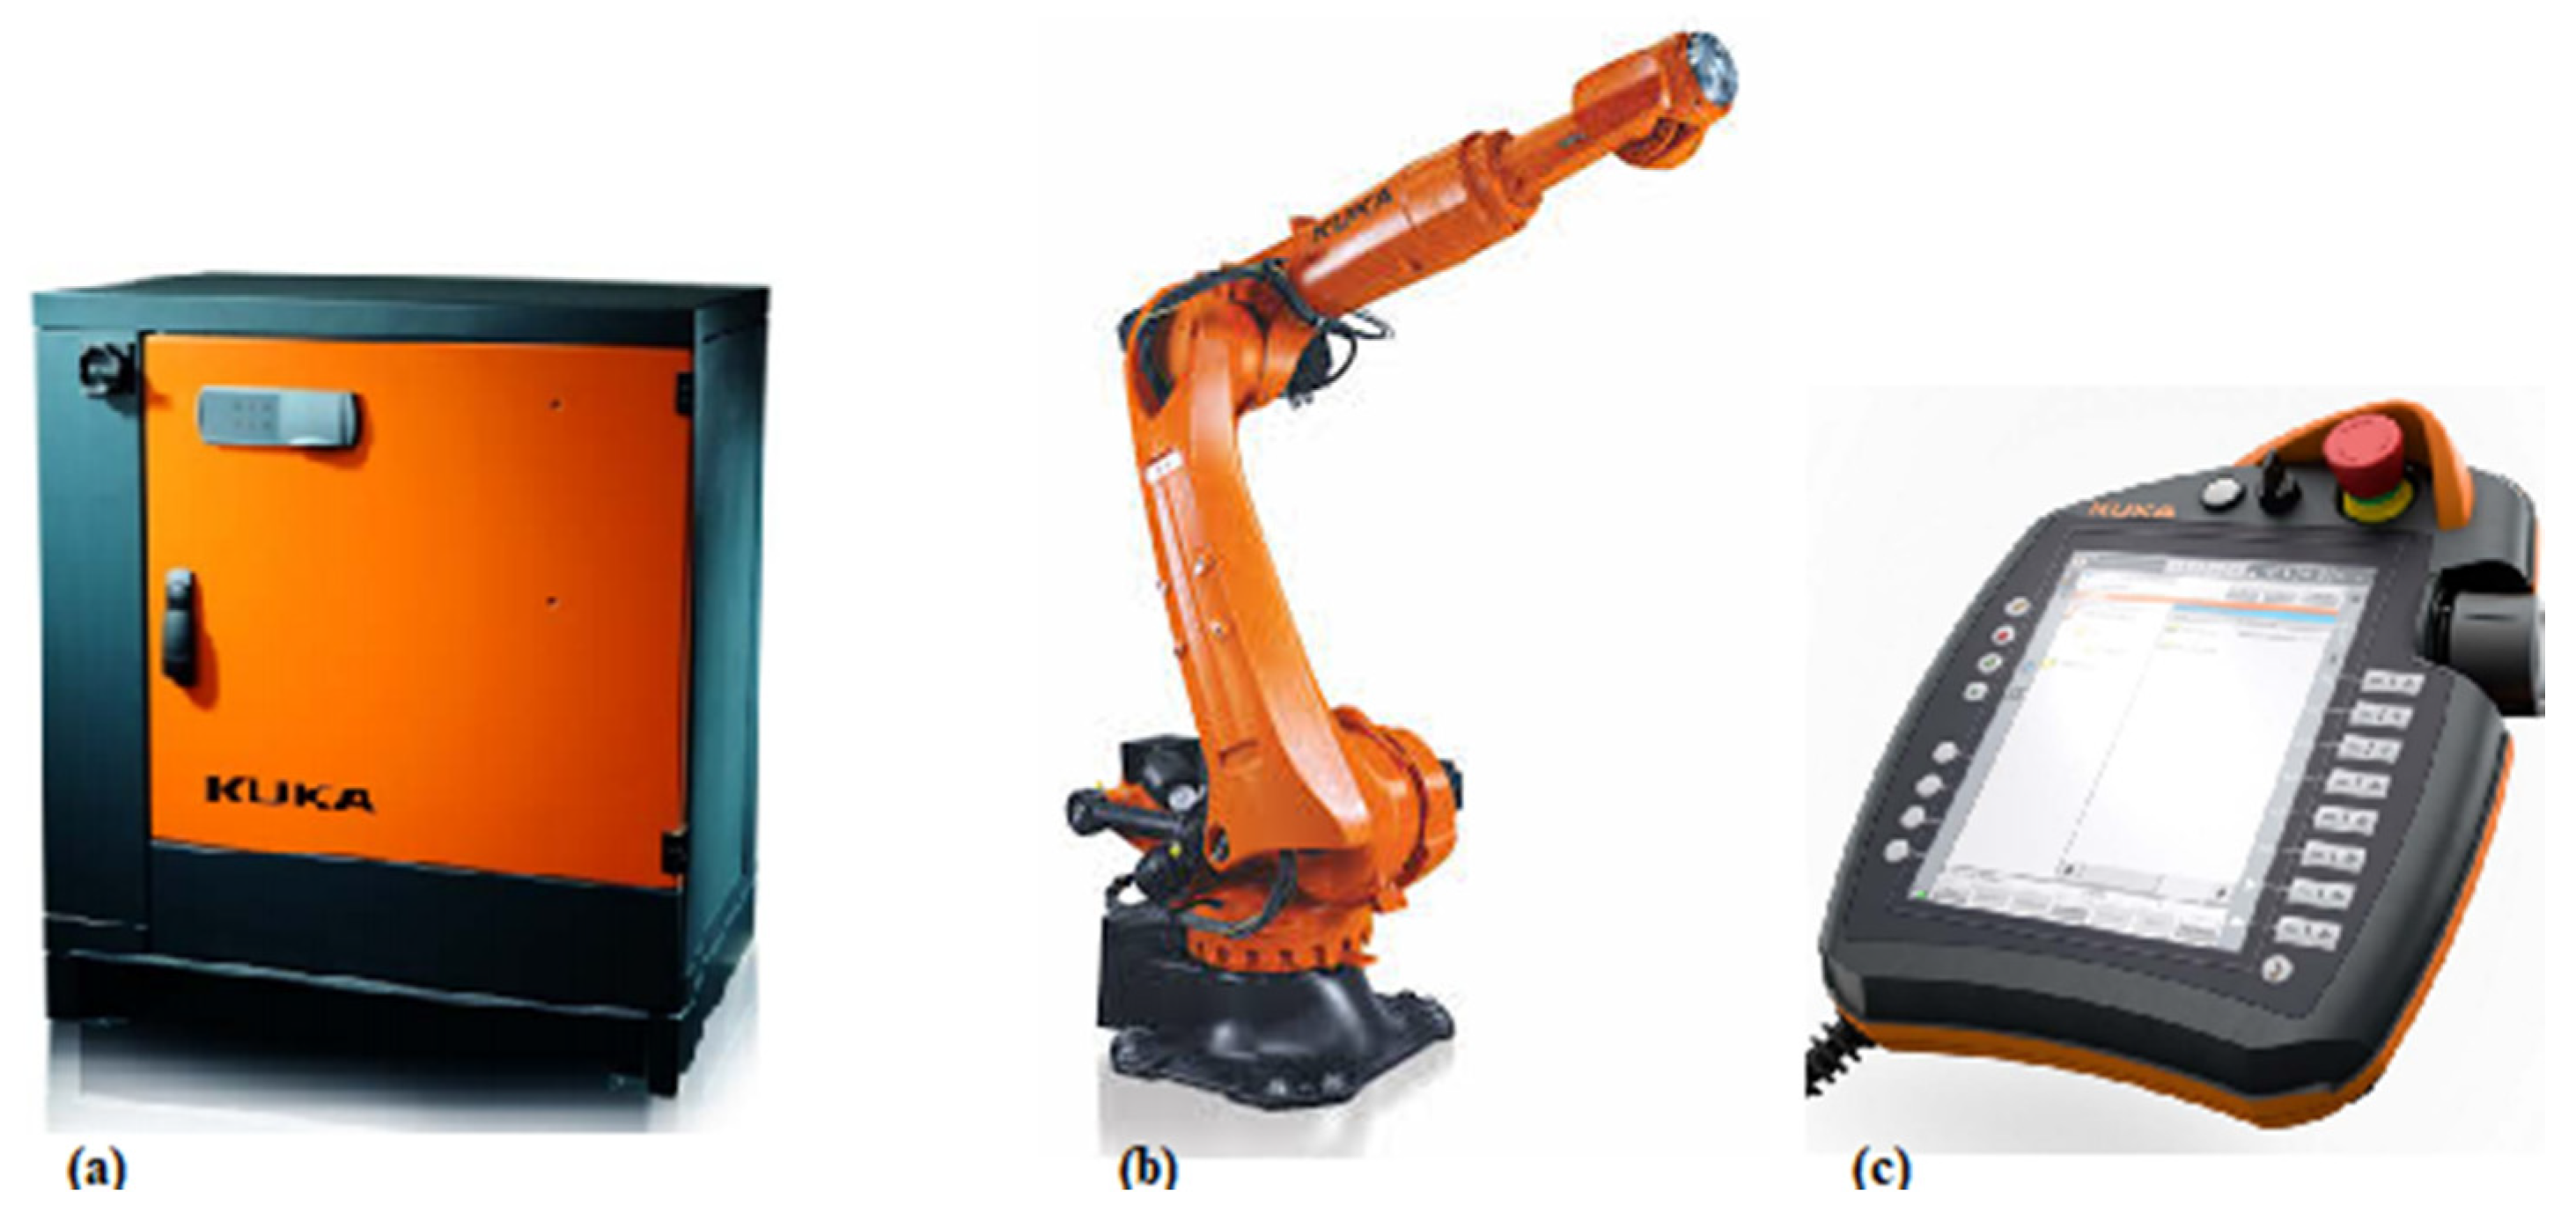
The KUKATM robot works through a SmartPAD connected to the control unit, which, in turn, connects to the robot by connecting cables. A pen drive containing the printing file is inserted into the SmartPAD, sending the movement instructions for the robot to follow. Before executing these instructions, the controller moves the robot to a starting point to initiate the trajectory. From the SmartPAD, the movement speed can be controlled. In addition, the speed is limited by the number of points the traced element has on the tracking path. Figure 1 shows all of the tools previously described.
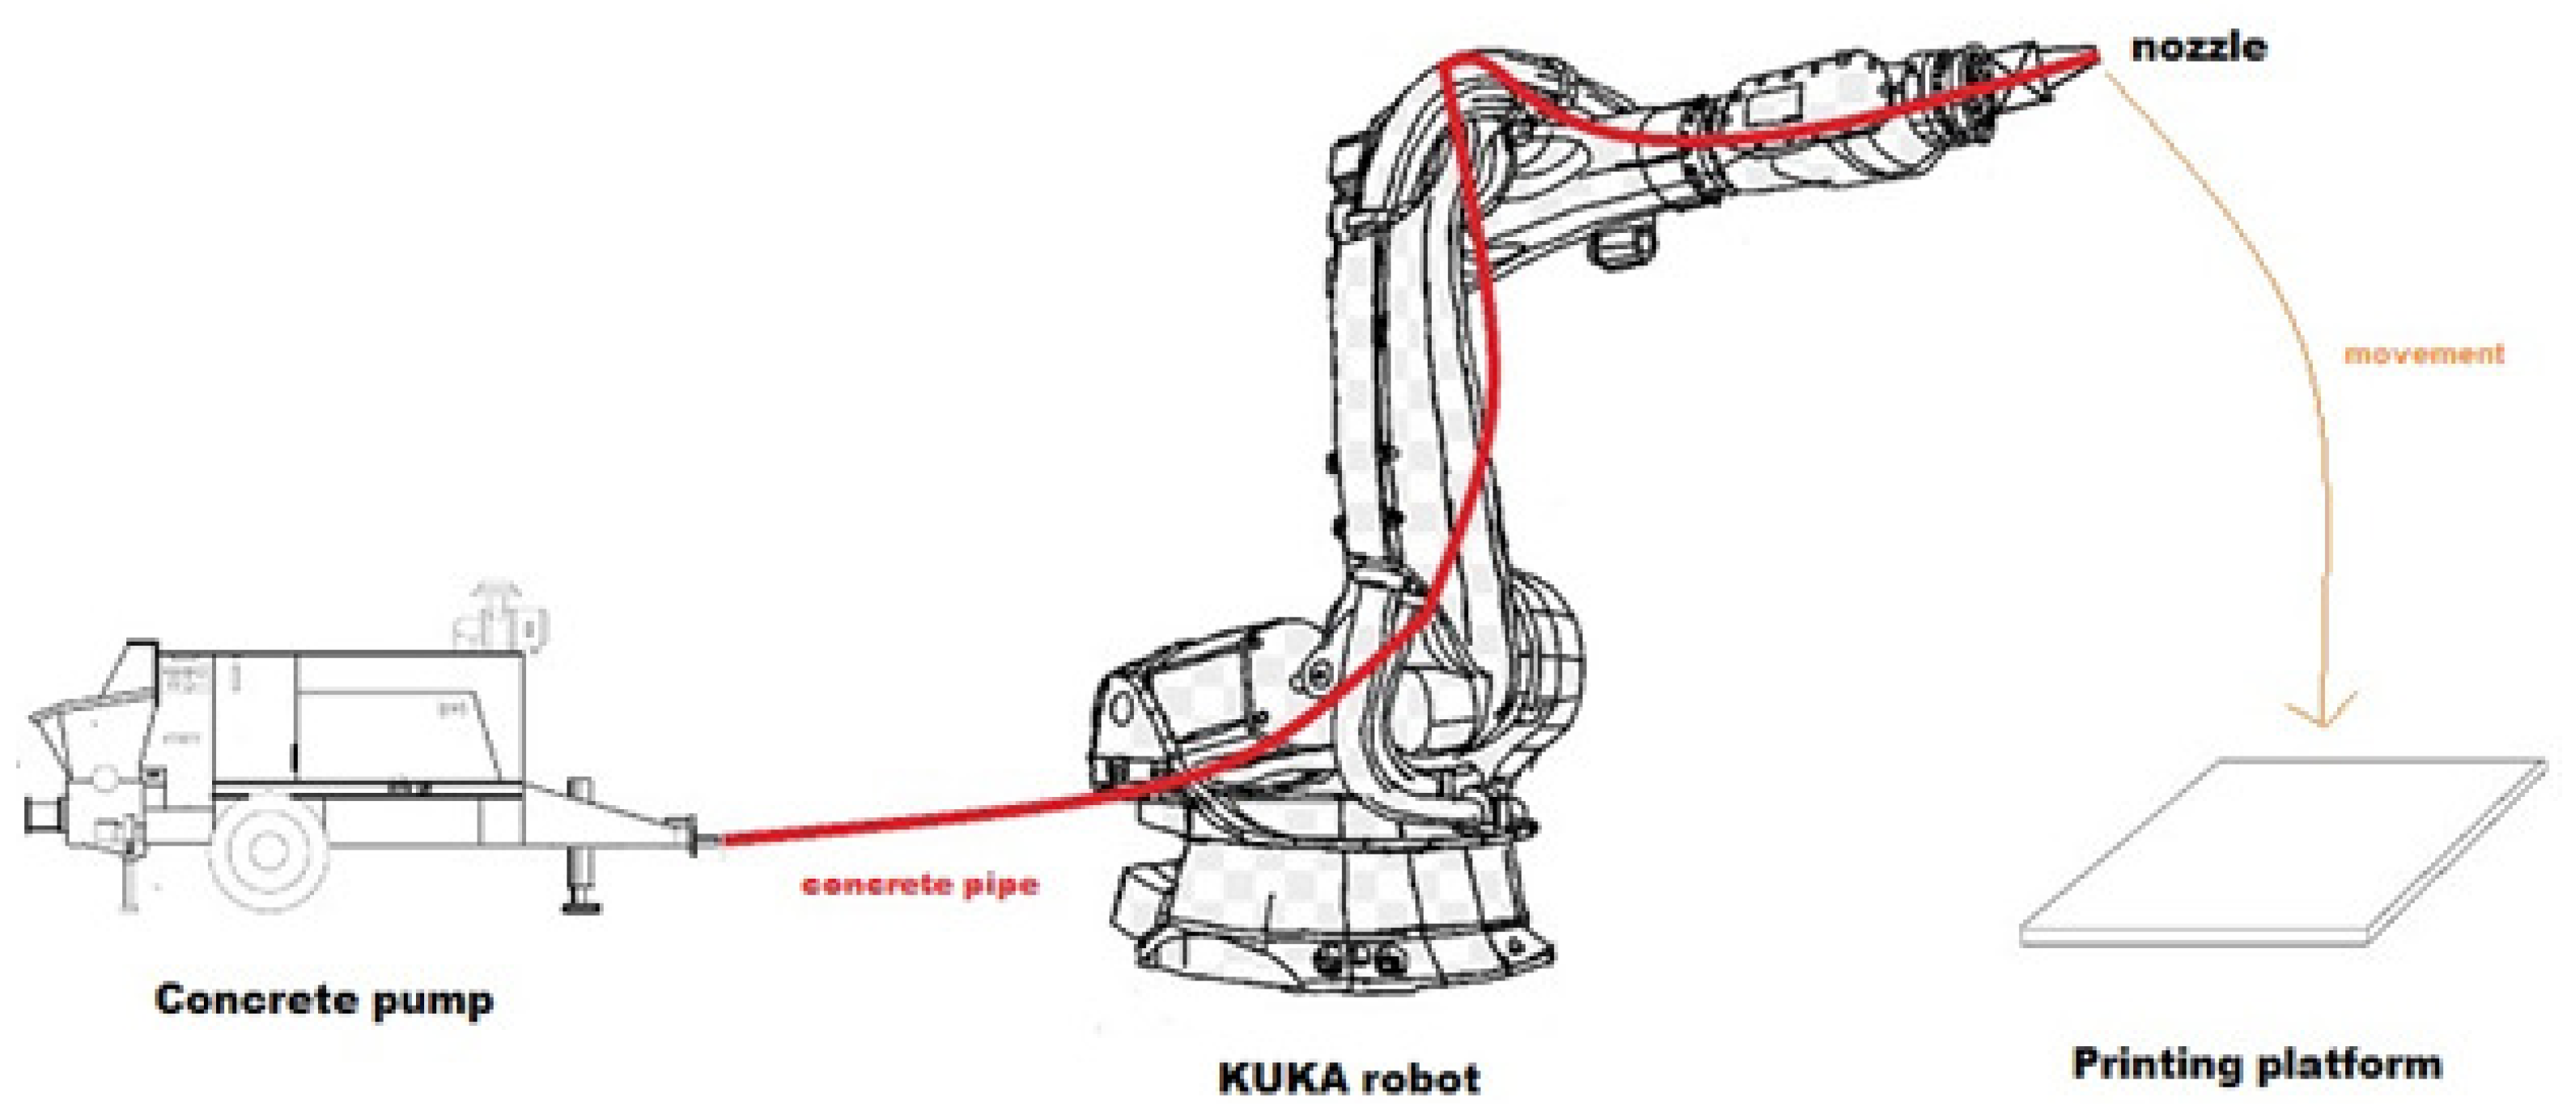
Our research uses a KUKATM robot model Quantec KR120 R2500. The Quantec series offers a versatile design intended for work in any market segment [43]. This robotic arm will have a pipe connected to a screw pump that will be fed with a continuous flow of concrete, and at the effector end of the robotic arm, a metal nozzle will be installed perpendicular to the platform on which the printing is intended, as shown in Figure 2.
3.5. From the Scanner to BIM
Next, it is needed to link tools that incorporate the BIM methodology (as is the case of RevitTM), with a central database management system capable of communicating data bidirectionally with computerized maintenance management systems (CMMS). The scan to BIM process consists of three main steps: scanning, registration, and modeling.
Scanning involves the installation of a total station, a 3D laser scanner, and a set of target artifacts.
Registration is the process of transforming two or more scans of the same scene, from different positions, into a single and unique points cloud for a common frame of reference. The 3D laser scanner establishes a new coordinate frame for each scan and assigns coordinates to the scanned points; this step is essential to avoid losing the orientation of points.
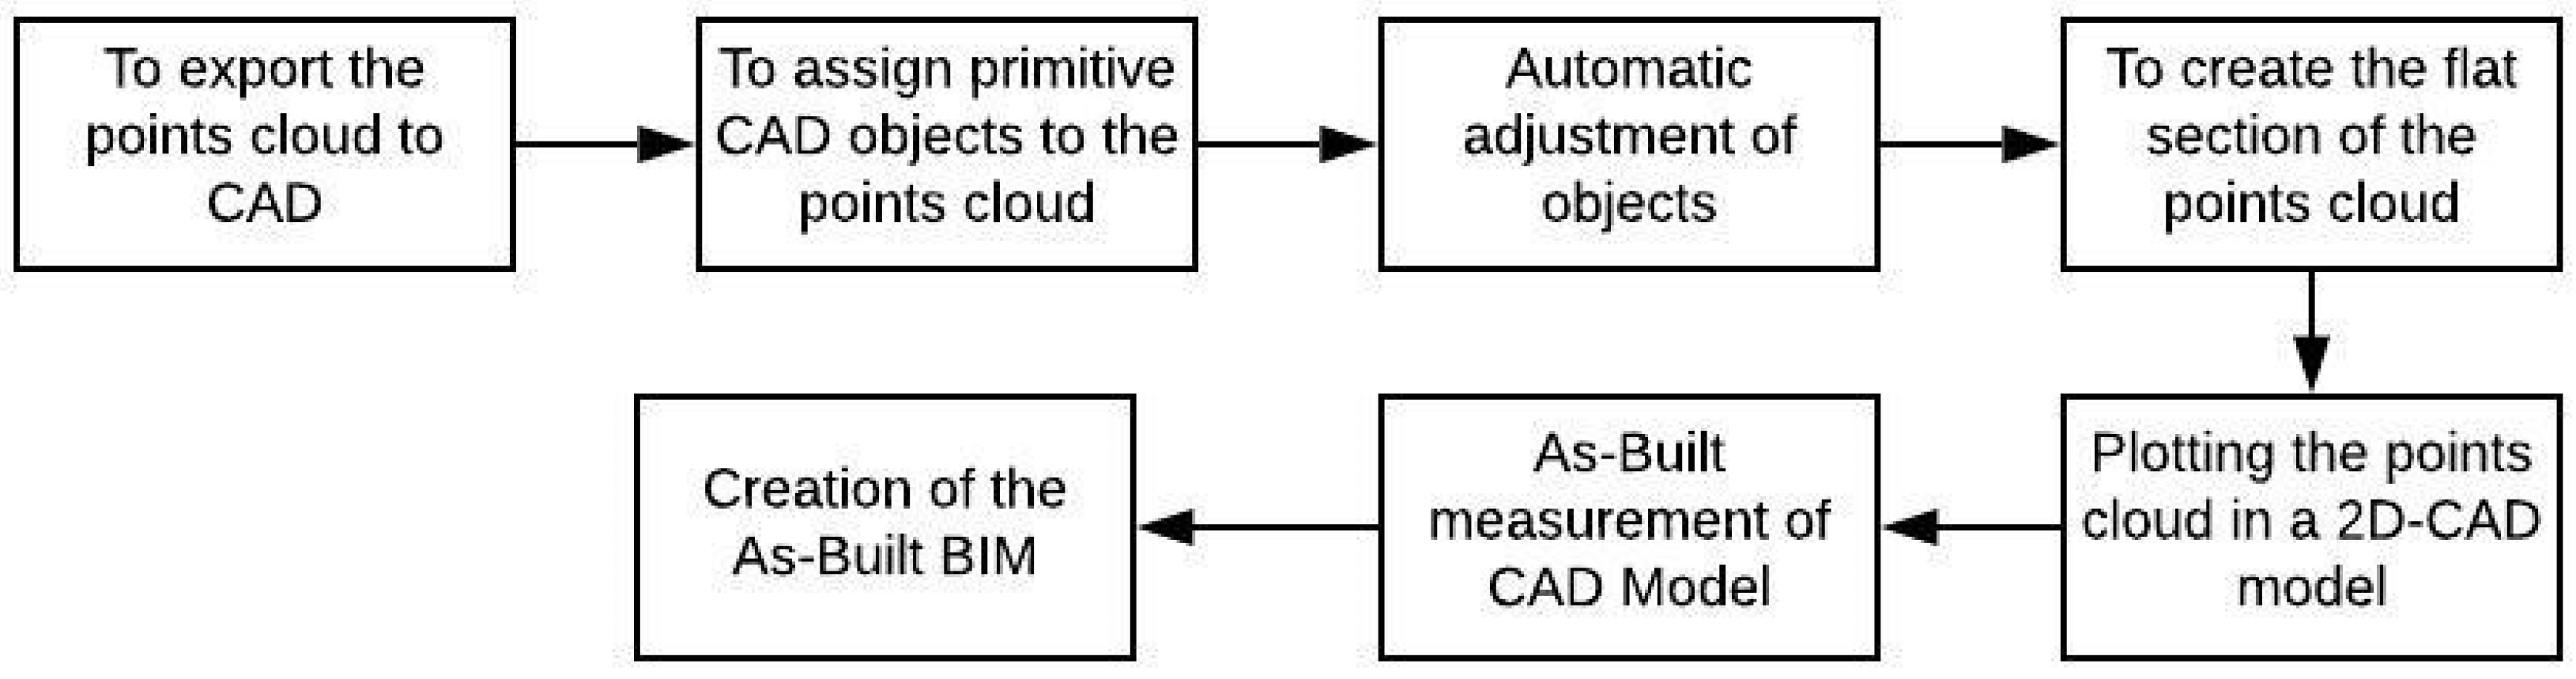
Modeling is the process of exporting the points cloud to a CAD environment to model it in BIM. After the points cloud is registered, the modeler exports it to a CAD environment and assign primitive CAD objects to it using adjustment algorithms or manual adjustments. Due to the complexity of tracking points in 3D space, modelers may need to prepare flat sections of the cloud, parallel to the elevation planes. BIM is then created based on measurements made on the CAD model. Figure 3 summarizes the process performed for modeling [44]:
4. Computer Procedure for Connection between BIM and 3D Concrete Printing
In this section, a computerized connection procedure between BIM and 3D concrete printing will be carried out, detailing the programs used, how they work, how to make the connection, and how to modify the necessary parameters.
In addition, verifications regarding the geometry of the design will be applied, to corroborate that the dimensions of the elements designed in BIM are being respected within the communication program.
It will be explained how, once the element is printed, its dimensions can be checked with the help of a laser scanner and that information can be projected in a BIM design software.
4.1. Brief Explanation of the Steps to Establish Communication between BIM Models and 3D Concrete Printing
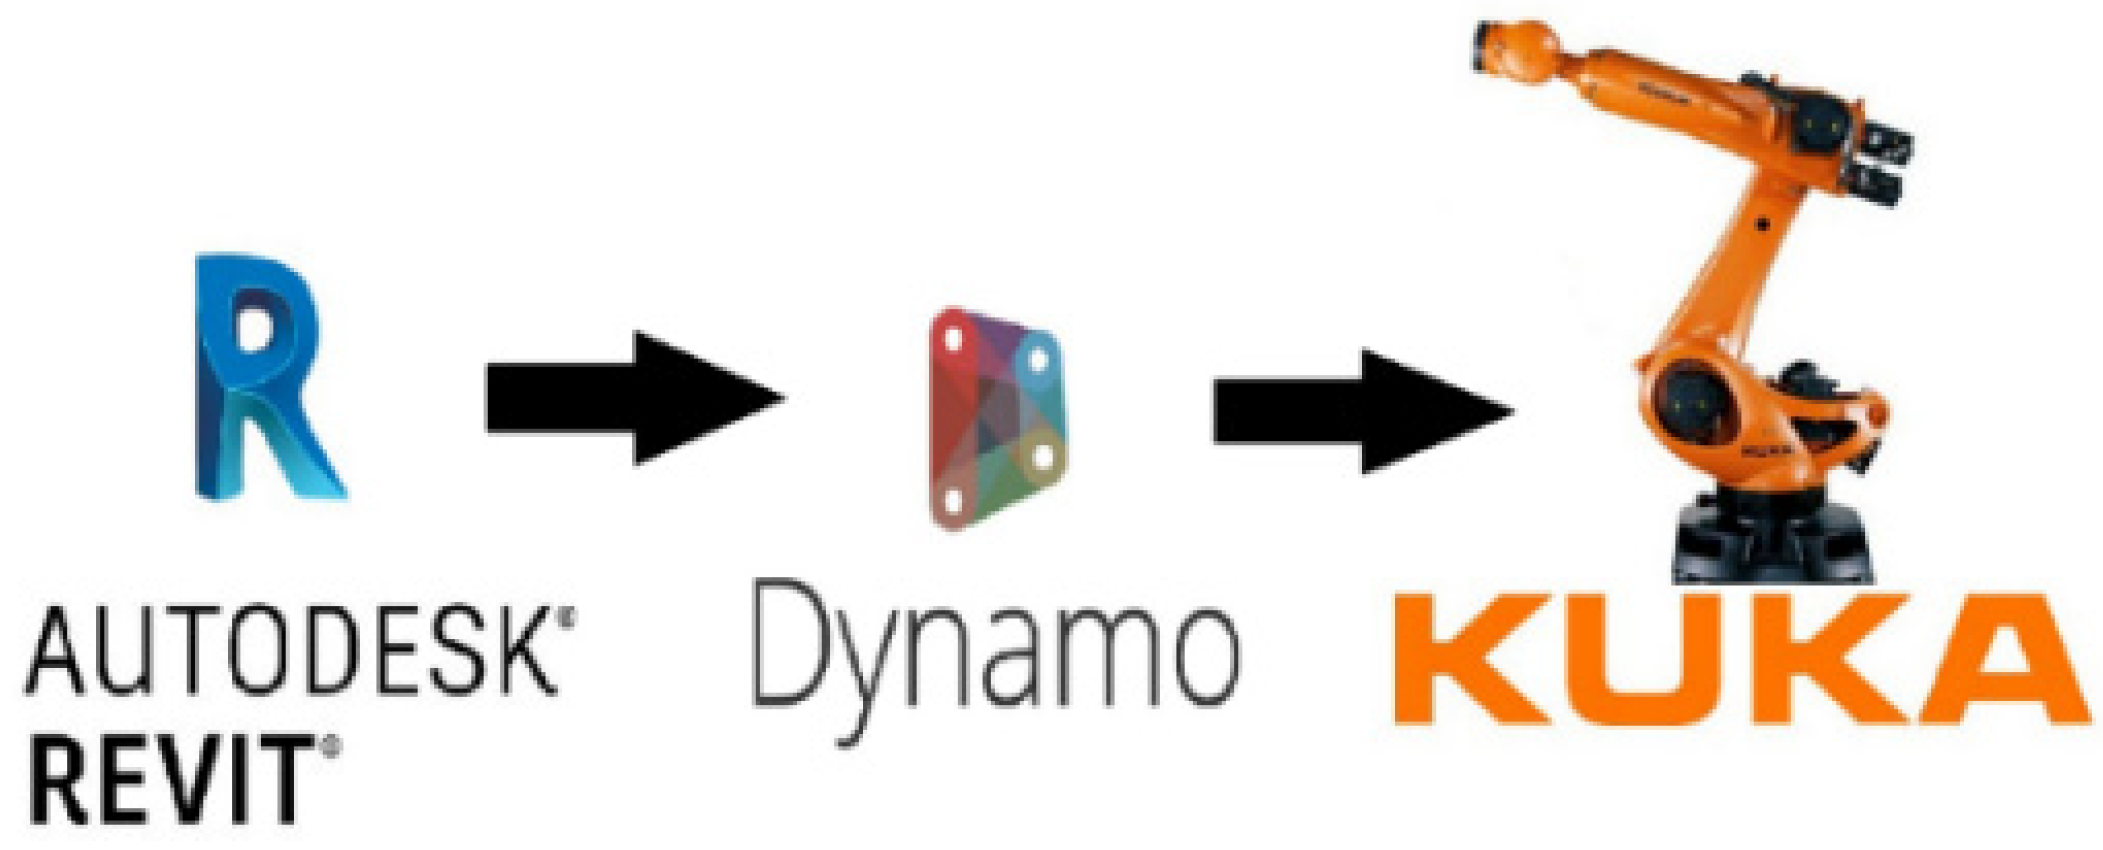
Figure 4 schematically shows the stages needed to carry out the communication between BIM models and 3D concrete printing. These stages are subdivided into the design of the initial constructive element modeled in RevitTM, the process of exporting the constructive element from RevitTM to DynamoTM software (which is integrated into the RevitTM interface), and the creation of the printing process control code in DynamoTM, for the KUKATM robotic arm.
4.1.1. Designing an Initial Construction Element in RevitTM
The objective of this stage is to design a base construction element using RevitTM and, subsequently, to transfer it to the DynamoTM graphical programming interface to be represented by a points cloud that describes its printing path. This element designed in RevitTM corresponds to a solid element, but for the purpose of this investigation, the printing corresponds only to the perimeter. NOTE: It is recommended that the user considers the width of the concrete cordon during the design stage before moving to DynamoTM.
4.1.2. Exporting a Construction Element from RevitTM to DynamoTM
Once the element has been designed in RevitTM, DynamoTM must be opened through the “Manage” interface and export the selected element. Once DynamoTM is open, access the RevitTM library and use the node that selects the designed element in RevitTM.
4.1.3. Preparation of a Control Code for the Printing Process with the Robotic Arm
This stage is performed in DynamoTM. The steps to carry out this procedure are described below:
- To obtain the surfaces to create the points cloud of the element to be printed. To get the points cloud that describes the construction element, it is necessary to delimit the previously selected element in RevitTM. To do it, a bounding box for the element must be created and transformed into a collection of surfaces and a solid body. Here, the thickness of each layer is specified to create a sequence of heights consistent with the total height of the element.
- To create a points cloud that describes the contour of the figure. The sequence of heights is later converted into a sequence of surfaces, which contain the information of the contour points and the lengths of each trace. From this information, it is possible to create a points cloud that extends uniformly on each surface that describes the perimeter of the figure.
- To create the printing path from the points cloud. Once the contour path that describes the dimensions of the construction element in two dimensions (X and Y) has been created, it is essential to generate an additional elevation path (Z-axis) to avoid accumulations of unwanted material. This is achieved by gradual elevation, such that the last point on one surface on the Z-axis coincides with the first point on the next surface. Thus, continuity in the print path is achieved.
- To transfer the points cloud, within the coordinate plane, to a position within reach of the robotic arm. The objective of this step is to synchronize the position of the figure in the action plane of the robotic arm. To do this, it is necessary to understand that the points cloud is within an already defined coordinate plane, so its transfer simply requires a modification of the coordinates of each point of the cloud along this plane.
- To develop the KUKATM robot arm control code. At this stage, the main objectives are to correctly select the KUKATM robot model to be used and to define the control parameters of the robot arm. A node that controls the linear movement of the robot and the value of the printing speed must be established.
4.1.4. Calculations and Printing Costs
Once the perimeter of the surfaces of the construction element to be printed has been obtained, the length of the printing cordon is obtained; together with the extruder area, it yields the volume of concrete required to print the element. With the volume of the material requested and the detailed information of how much material is used for 1 m3 of printing, it is possible to calculate how much material will be used and the cost of printing this item. All of this information is exported to an Excel file to be viewed.
4.1.5. Management Phase of the Resulting Element
Once the element under study has been printed, it is necessary to know its real dimensions to compare the virtual design with what is obtained in practice. This procedure requires the use of a Leica BLK360 model laser scanner. This laser was chosen because of its interaction with RevitTM, which projects a 3D model of the scanned item. In this way, measurements are made to determine its real dimensions, which makes it possible to carry out a comparative analysis between design and execution, facilitating the study of the different heights of the printing cordon in each layer of the printed element.
Figure 5 is a flowchart that schematically shows the procedure for printing a construction element:
4.2. Step-by-Step Development of the Computer Procedure That Communicates a Model Designed in BIM and 3D Printing Concrete Elements
This section aims to show a summary of the development of the computer procedure required to communicate a model designed in a BIM software, and 3D concrete printing elements, by means of using DynamoTM, a plugin of Revit. It is important to emphasize that one of the most important contributions of the procedure presented in this research is the possibility of easily replicating it in other plugins or software such as GrasshopperTM and others. The entire step-by-step procedure is shown in Appendix A.
- Designing the initial construction element in RevitTM.
- Exporting process of a construction element from RevitTM to DynamoTM.
- Preparation of the control code for the printing process with the KUKATM robot.
- To obtain the surfaces to create the points cloud of the element to be printed.
- Creation of the point cloud that describes the contour of the figure.
- Creation of the printing trajectory from the points cloud.
- Transfer of the points cloud, within the coordinate plane, to a position within reach of the robotic arm.
- Control code of the KUKATM robotic arm.
- Calculations and printing costs.
5. Analysis of Results
The KUKATM robotic arm has certain default parameters that, for safety reasons, are immovable or are not within the reach of the robot’s capabilities. It is essential, then, to verify to what extent it is possible to control the parameters of the robot and to verify the accuracy of the printing movements. Therefore, in this section, verifications related to the control of low-magnitude speeds will be applied to corroborate that the designer of the control program can control the printing speeds, as long as reasonable speeds are applied.
In addition, the error associated with the measurement of the controlled speeds will be calculated, which will allow corroborating whether or not there is a variation between the theoretical speed (entered in the code) and the measurement in the field. To this end, the relative error, absolute error, confidence level, uncertainty interval, and concordance of each case will be calculated. Thus, a measurement procedure will be carried out to calculate the maximum printing speed, for different spacing between the points that describe the contour of the element to be printed. The objective of this procedure is to know the speed limit of printing for different spacing between points.
Finally, for each of the tests, the results will be described and explained in detail. Observational and experimental conclusions will be obtained, according to the field measurements and the physical results obtained from these.
5.1. First Test: Verification of Dimension Recognition for the Printing Code
This test is purely digital, and its purpose is to verify whether the dimensions of any construction element designed in BIM (in this case in RevitTM) are indeed being respected in the control code. To do this, a series of digital designs were built in RevitTM with different geometries that allow checking the effectiveness of the code. The designs were then transferred to DynamoTM.
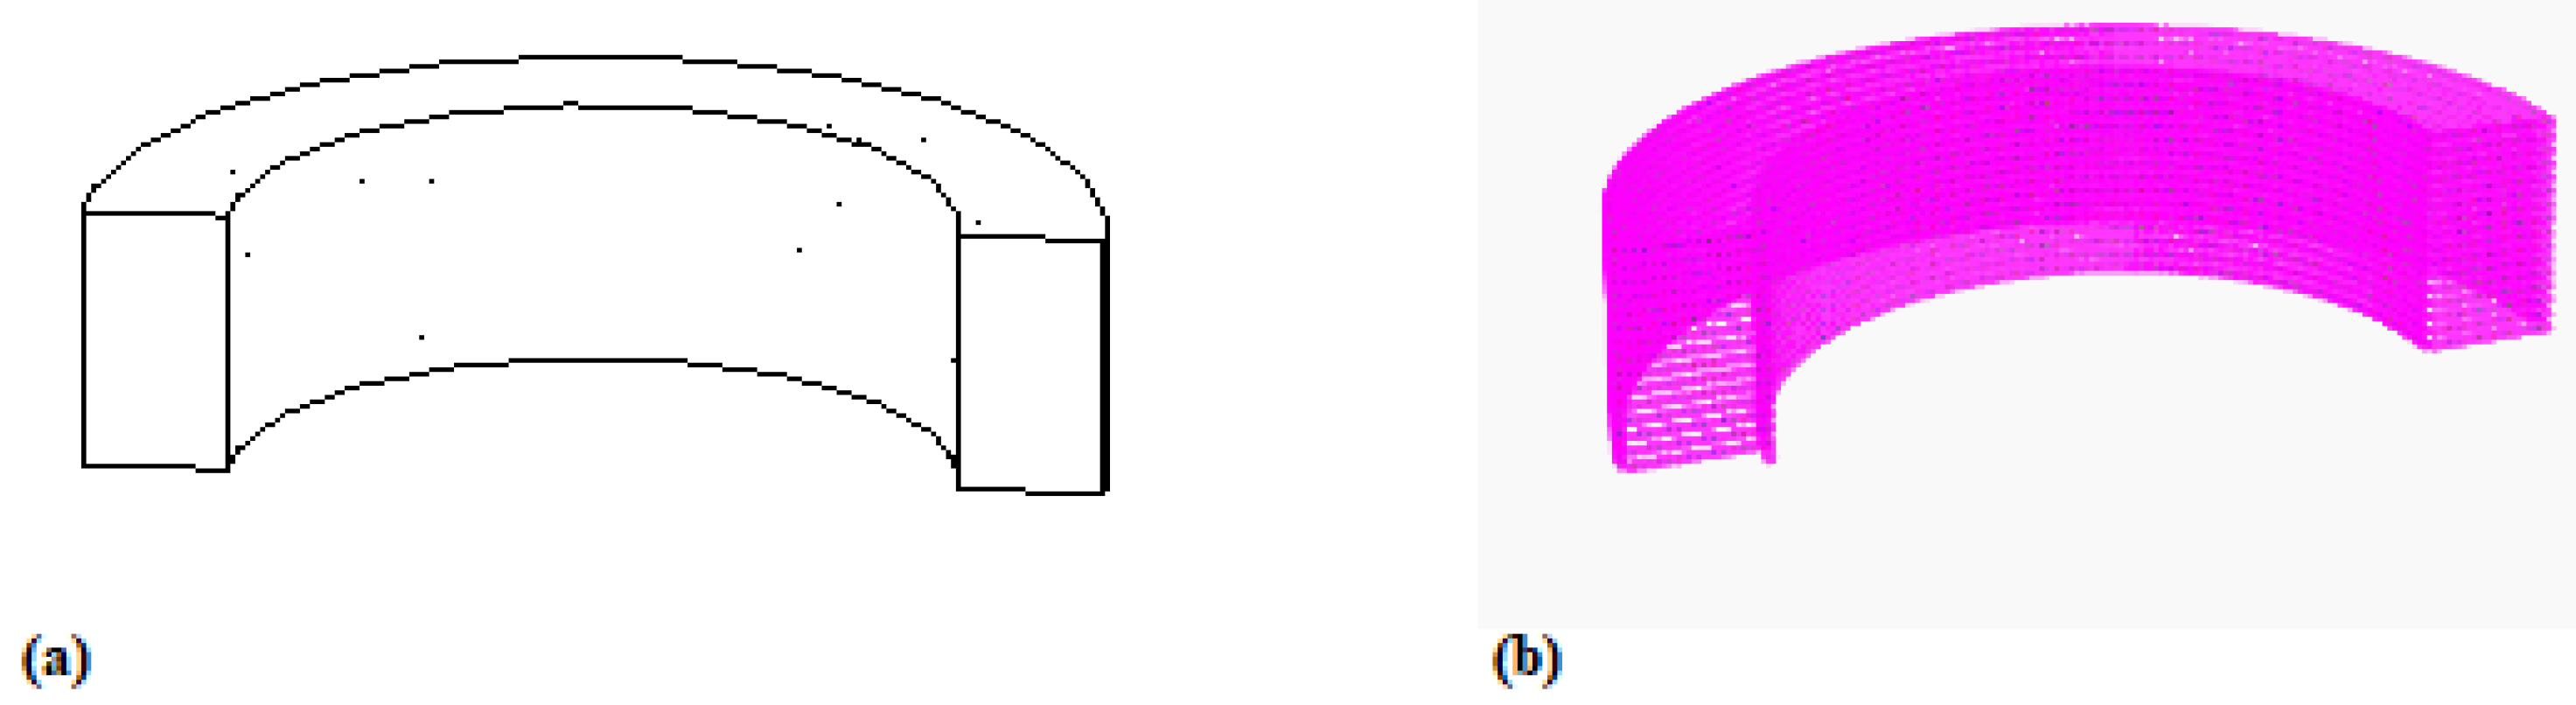
In Figure 6 and Figure 7, it is possible to appreciate that the printing code develops not only develops the exact replica of the dimensions of the designed element but also automatically traces the spiral-shaped printing path, so it can be deduced that, digitally, the tests are successful. The above is not trivial. The fact that this test has been verified is important for future research because it will facilitate the exploration of 3D concrete printing processes with different shapes without the need of creating a printing code for each of them.
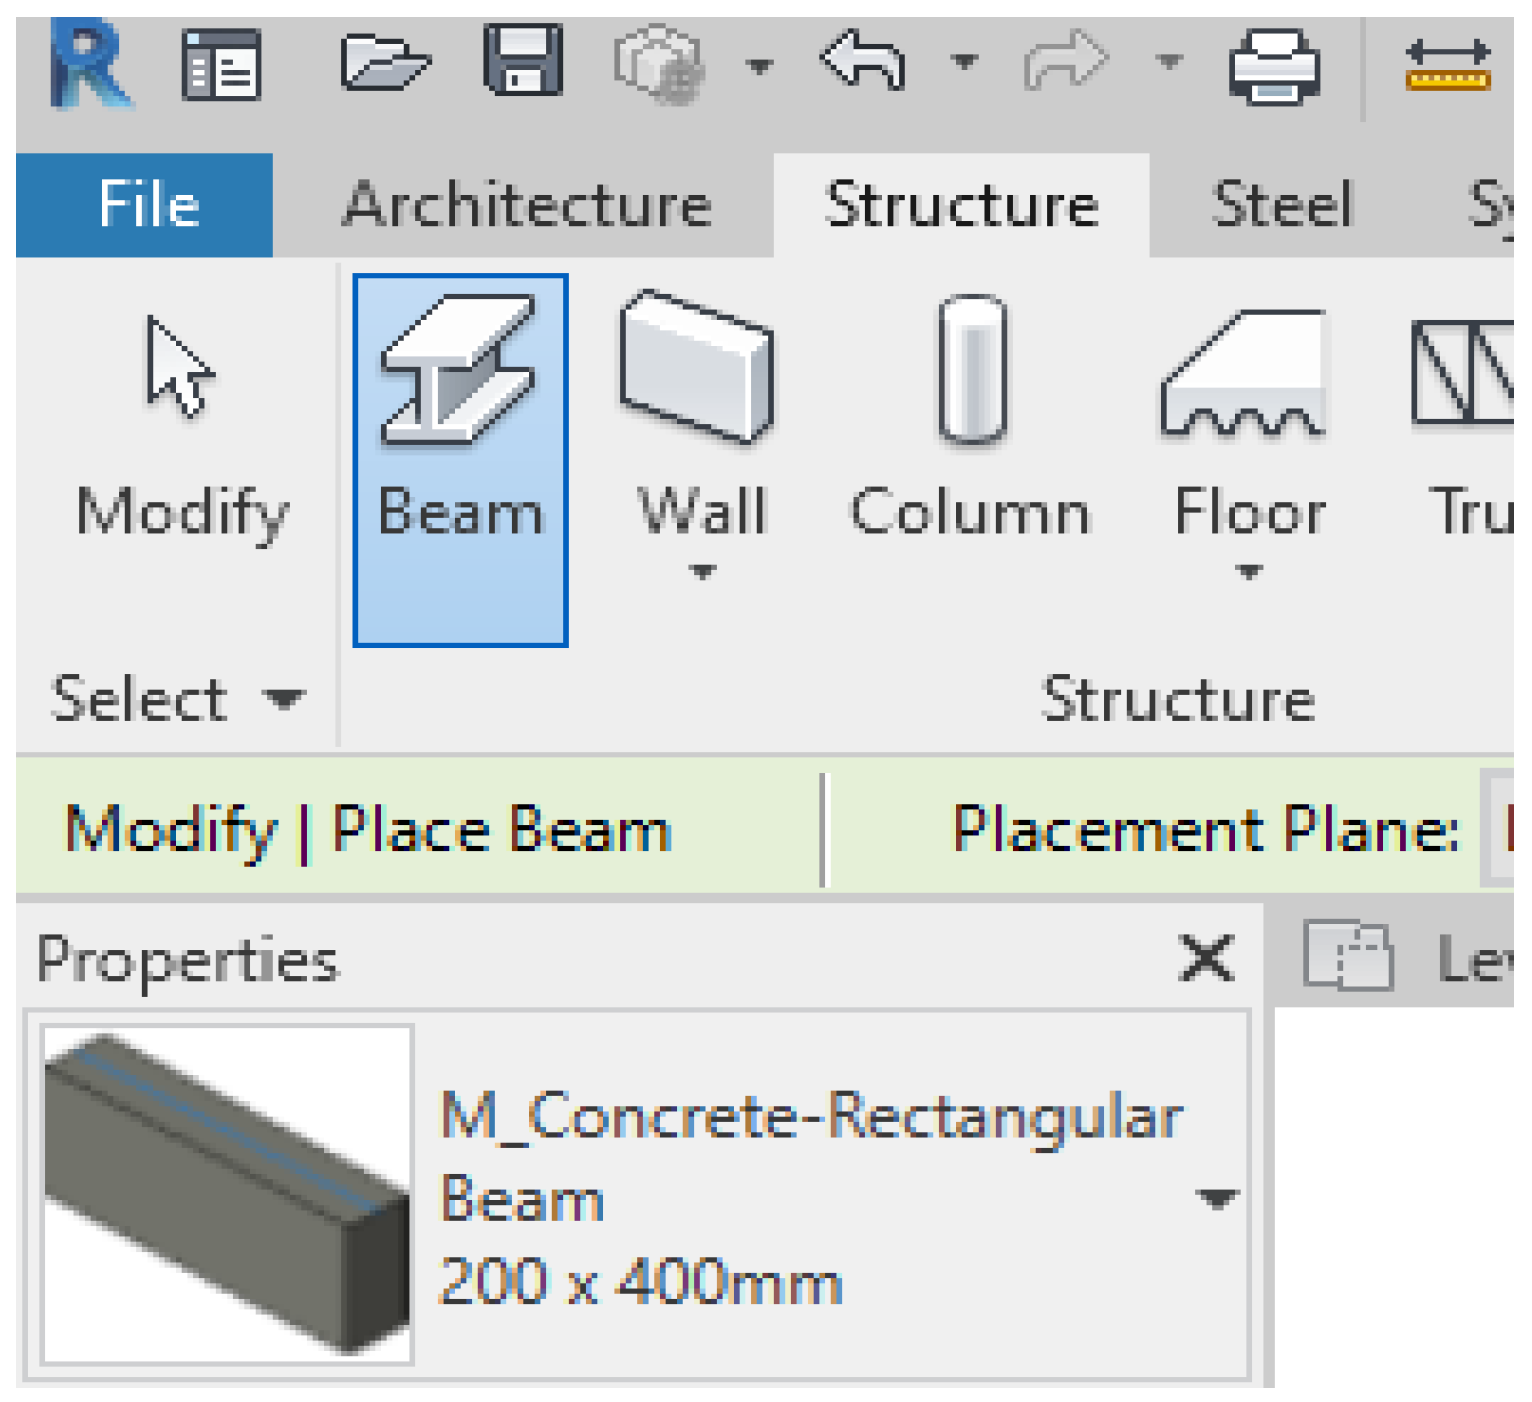
Figure 6a shows a 200 mm × 400 mm curved beam designed in RevitTM. Figure 6b represents the same beam but with its printing path using the code designed in DynamoTM. The dimensions of this element were modified from RevitTM so that, at the time of printing, it matches the desired measurements.
Figure 7a presents a circular column with a diameter of 300 mm and a height of 1000 mm designed in RevitTM. Figure 7b represents the same column but with its printing path built with the code designed in DynamoTM. As done with the previous element (Figure 6), the dimensions of this element were modified from RevitTM so that, at the time of printing, it coincided with the desired measurements.
5.2. Second Test: Controlled In Situ Speed Associated with Defined Point Spacing
The code developed in Section 4 enables the user to enter a linear printing speed in meters per second (m/s). The purpose of this test is to verify the precision of the KUKATM robotic arm to carry out this speed in the field. The test consists, briefly, of entering speeds in the program and measuring in situ if these speeds are achieved.
Previous studies have shown that robotic arms limit their maximum operating speed when they execute codes that require a series of points, as is the case with the code of this investigation. Thus, this test works with speeds that allow the robot to properly perform the printing process.
Three different speeds were tested: 0.04 m/s, 0.06 m/s, and 0.08 m/s, with spacing between printing points of 12.5 mm, 25 mm, and 50 mm, respectively.
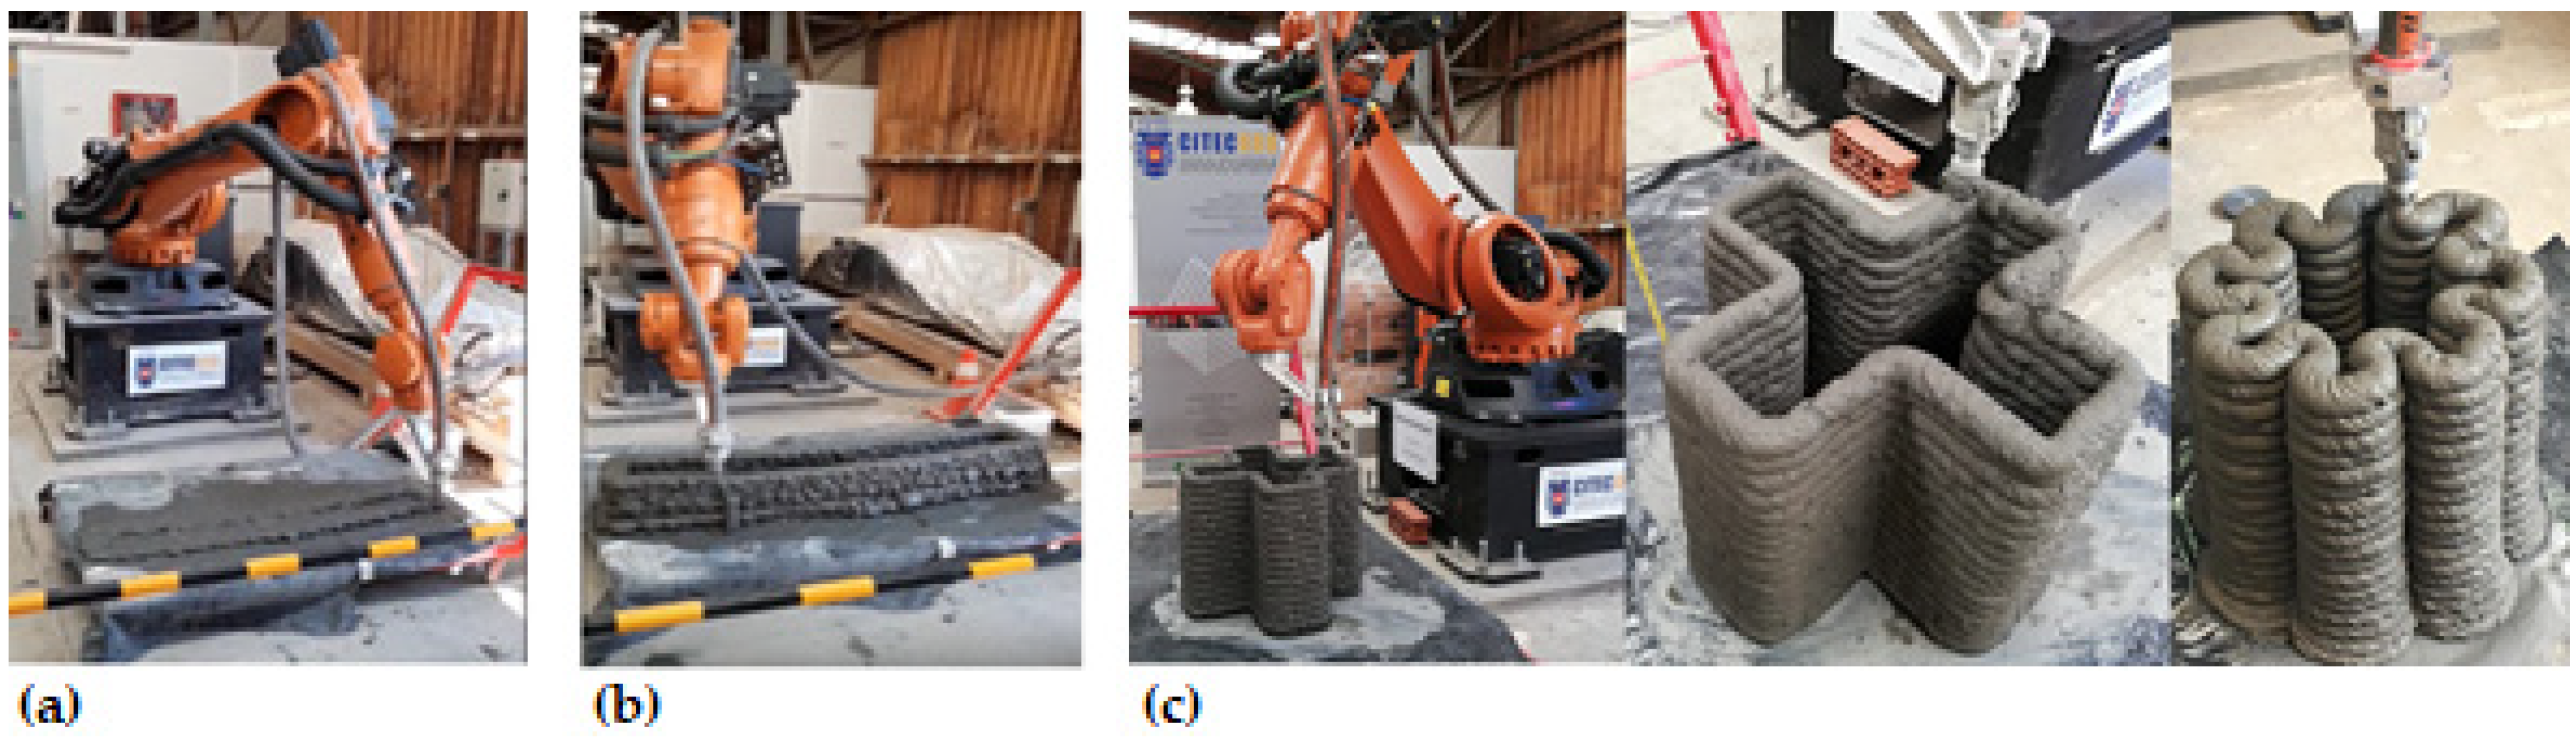
To perform the measurements in the field, samples of 3D concrete printing were made, and the execution times were measured. Thus, based on the distance run by the robot, it was possible to calculate the speed in each attempt. As an example, a couple of images of the process are shown in Figure 8a,b, whereas Figure 8c shows other 3D concrete printed elements that were tested.
5.3. Calculation of Error and Concordance in the In-Situ Controlled Speed Test in Terms of the Defined Spacing between Points
Once the data have been obtained, it is important to demonstrate the significance of the experimental speed variations, for the theoretical or typed speed. Accordingly, there are two ways to quantify the measurement error: (a) by means of the absolute error (E), which corresponds to the difference between the average of the measured value Xm and the real measured value Xr, so ; and (b) by means of the relative error (e), which corresponds to the quotient between the absolute error E and the average of the measured value Xm, expressed as a percentage, or . With the calculation of the relative error (e), it will be possible to verify the level of confidence in each measurement, i.e., .
Furthermore, a match is found between the theoretical predictions of a hypothesis (model or theory) and the results of a measurement, when both values coincide within a range defined by the measurement error. The error E defines, around the value under study, an interval of uncertainty equal to twice the error (2E), that is, it indicates a zone within which the true value of the magnitude must be found. Thus, the lower limit (Llim) and the upper limit (Ulim) of the uncertainty interval is given by and . If both the theoretical or typed speed and the experimental speed measured in the field are within this range, the previously mentioned match between the theoretical predictions and the measurement results is achieved.
5.3.1. Results of Speed and Absolute Error Measurements
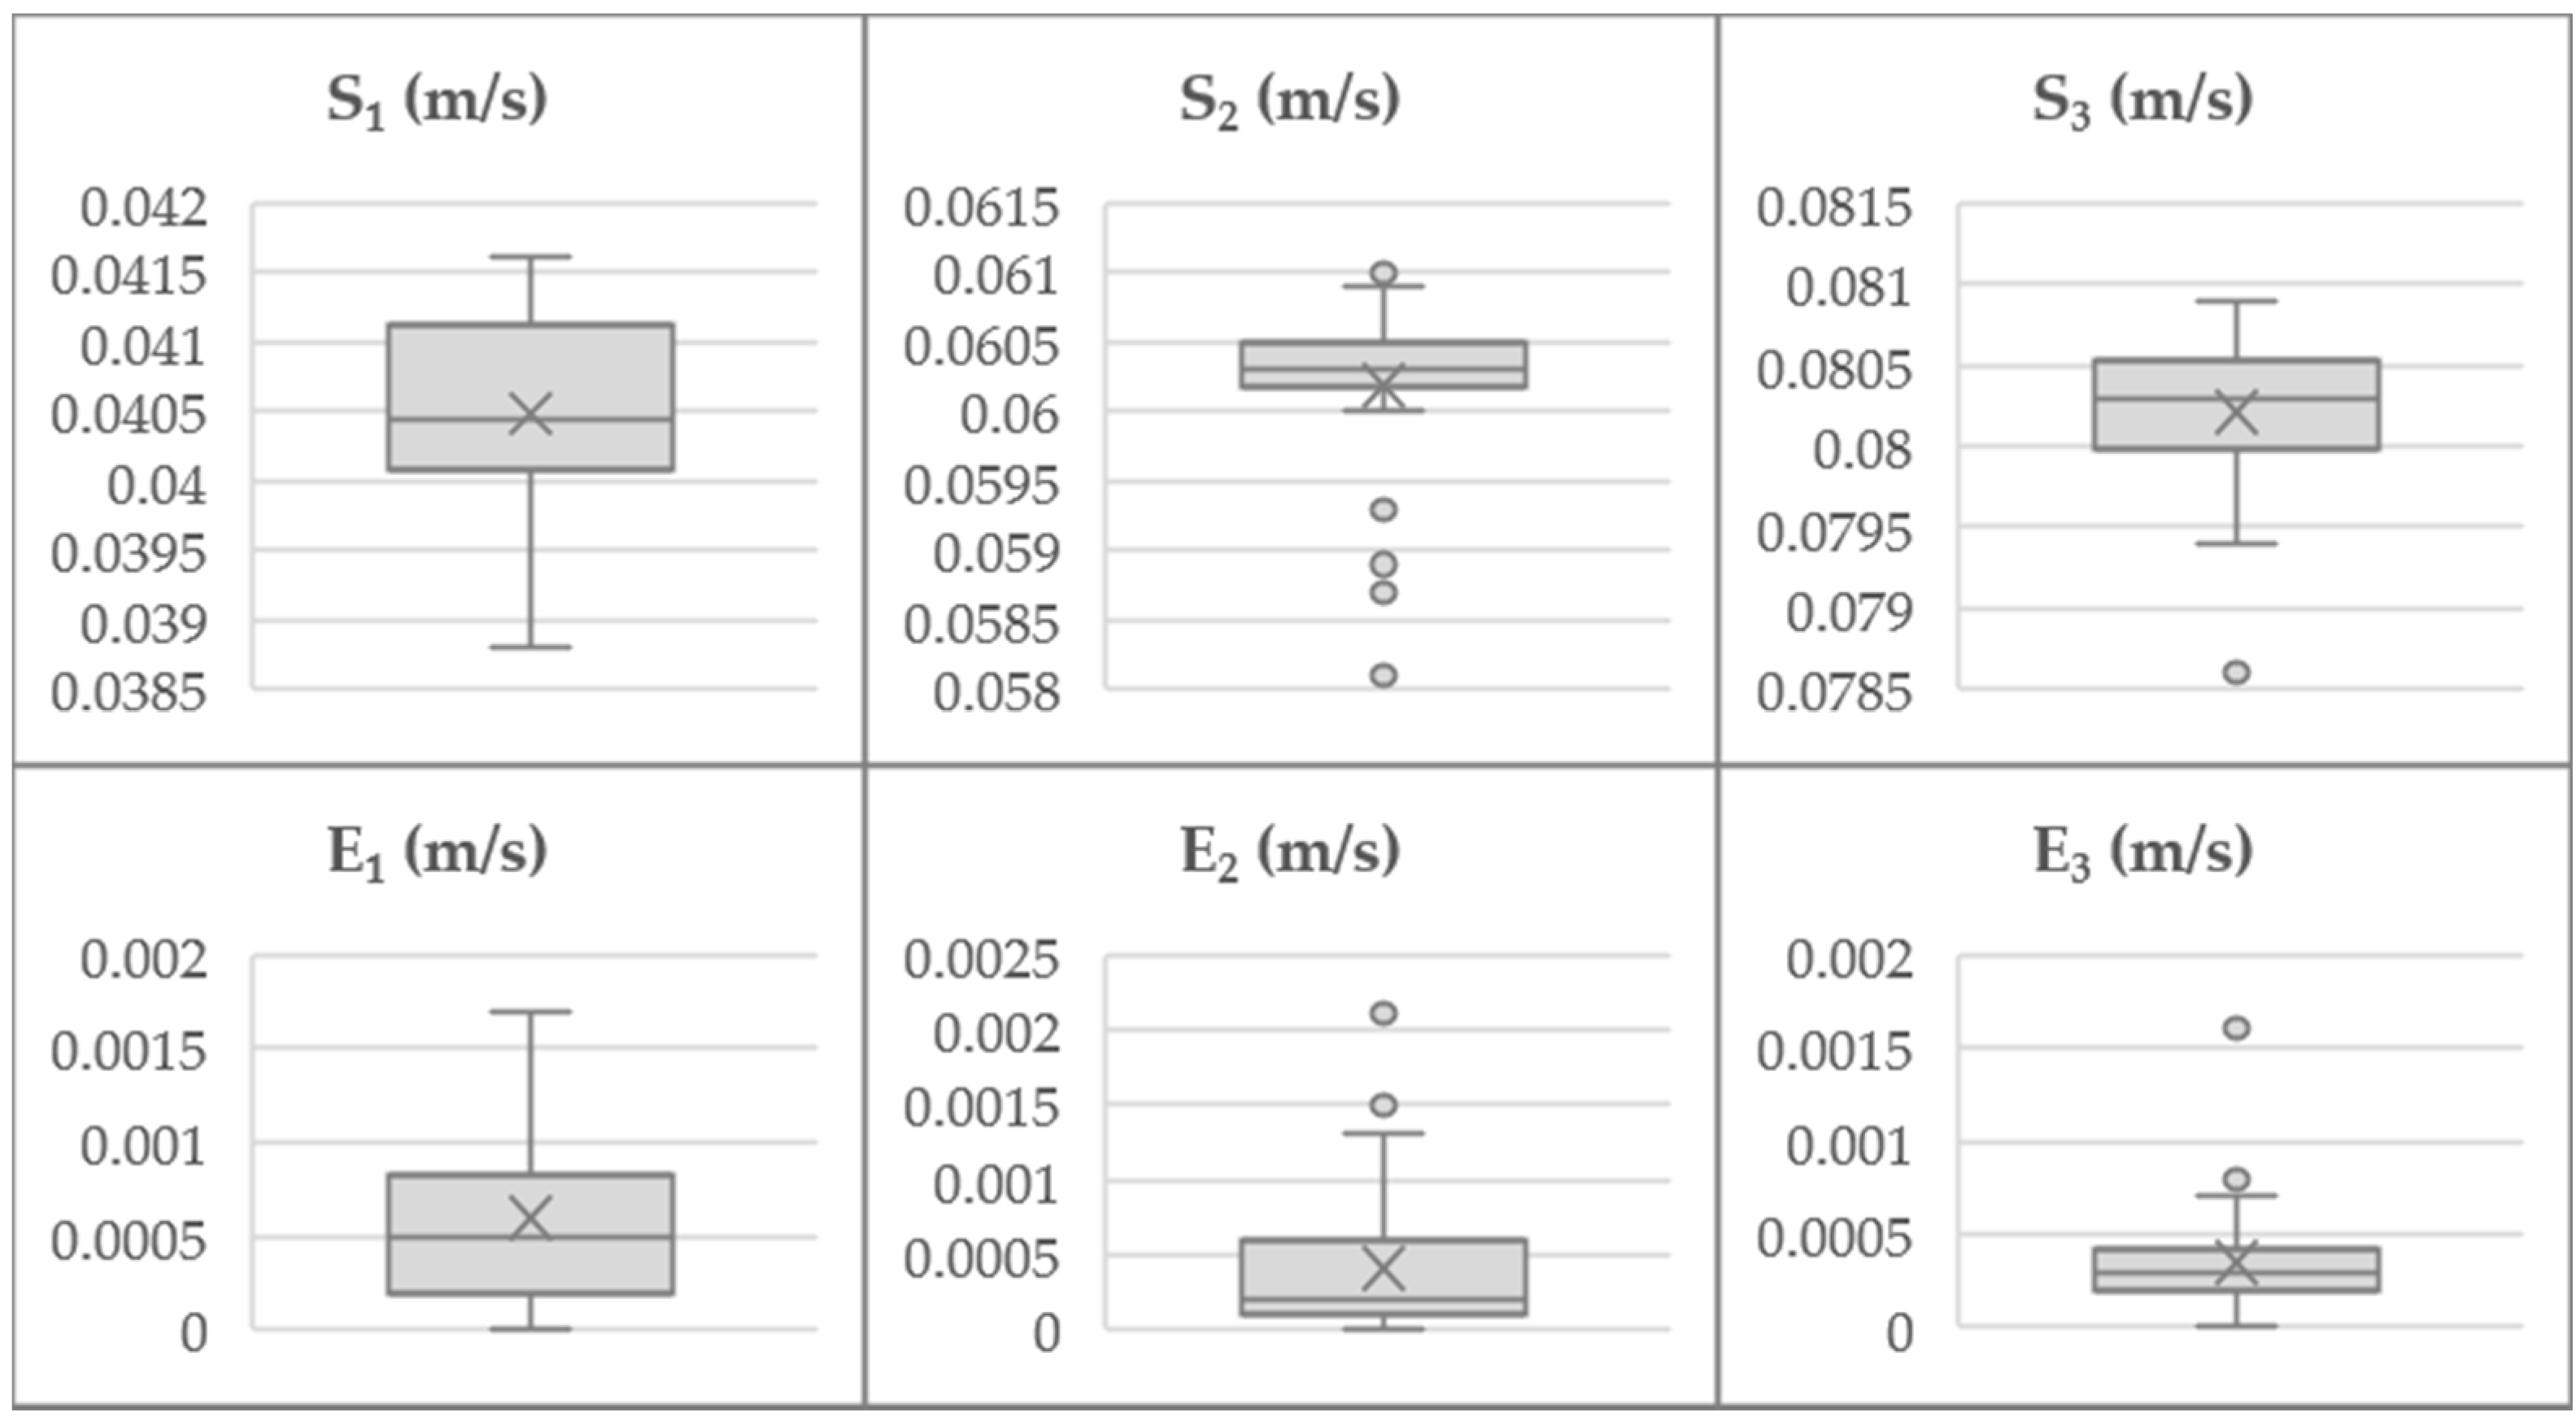
Figure 9 shows the experimental speeds measured in the field for each speed entered by the user in DynamoTM. In addition, a comparison is made between all the speeds by calculating the absolute error in each measurement, where Si corresponds to the speed and Ei to the error as shown in the boxplots.
5.3.2. Results of the Relative Error, Level of Confidence, Interval of Uncertainty, and Concordance
The concordance (significance) between the theoretical and experimental data is analyzed. The conditions of the experiment are Llim < Typed speed < Ulim and Llim < Average experimental speed < Ulim, where: (a) if the conditions are fulfilled, then the data reflect concordance between the theoretical typed speed and the experimentally measured speed; or (b) if conditions are not fulfilled, then there are physically significant differences between the typed theoretical speed and the measured experimental speed. Table 1 summarizes the obtained results.
In terms of average speeds, the conditions Llim < Typed speed < Ulim and Llim < Average experimental speed < Ulim were fulfilled in all cases. Therefore, the data reflect concordance between the theoretical typed speeds and the experimental speeds measured in the field. Furthermore, Table 1 shows that levels of confidence in the experiment are around 98% and 99%. Related to the error found between designed models and printed models, Table 1 shows that the relative error is less than 1.5%, which decreases as printing speeds increase.
5.4. In Situ Maximum Printing Speed Test in Terms of Defined Points Spacings
The objective of this test is to determine the movement speed limit of the KUKATM robotic arm for different spacings between points.
5.4.1. Background
First, it is assumed that the robotic arm restricts its speed of movement, depending on the spacing between the points that describe the trajectory of the element to be printed. Therefore, the purpose of these tests is to quantify such limitation, with the objective of knowing what the maximum movement speed for different spacings between points will be achieved by the robot.
Based on the previous statement, because it is needed to determine a maximum speed for the robot, a speed value that it is difficult for the robotic arm to achieve when it is printing was established; in this case, it was proposed to enter a theoretical speed of 1 m per second.
Then, the spacings between points were being modified accordingly. For this case, they will be 12.5 mm, 25 mm, and 50 mm.
5.4.2. Results of the Maximum Speed Test
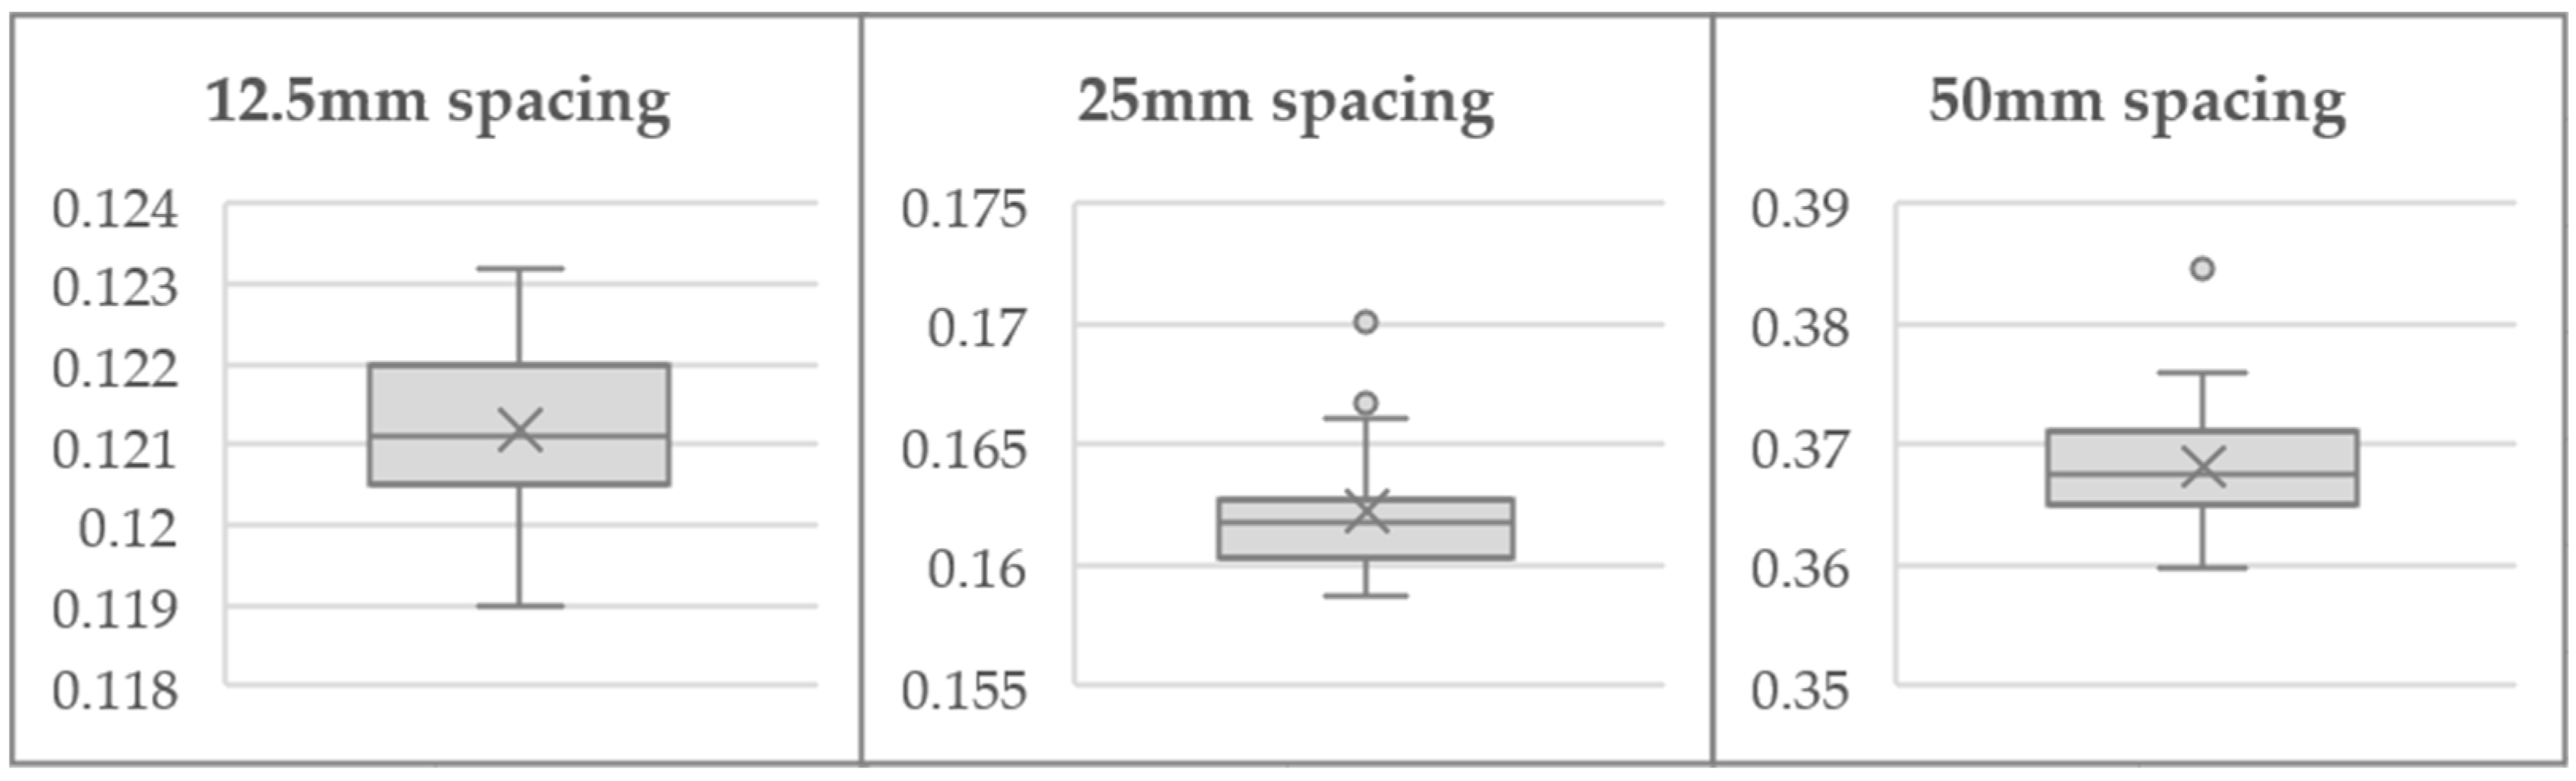
Figure 10 shows the maximum experimental speeds obtained from the measurements made with the robotic arm with a constant theoretical speed of 1 m/s and with different spacings between points. The boxplot shows each of the maximum speeds for different spacings between points, along with Table 2 which complements the boxplot (quartiles, median, lower and upper limits, and atypical values).
In summary, Figure 10 and Table 2 show the speed distribution for the different measurements made. The points spacing of 12.5 mm and 50 mm present a positive asymmetry since the highest concentrations of their data are in the area below the median. It can be seen that for the 12.5 mm spacing, all the data are contained in the diagram, without presenting outliers. For the 50 mm spacing, data are presented above the upper limit, with one single outlier only. For speeds with a spacing of 25 mm, a negative asymmetry occurs, where most of the data are concentrated in the area above the median, and two outliers above the upper limit.
5.4.3. Analysis of Maximum Speed with Different Point Spacing
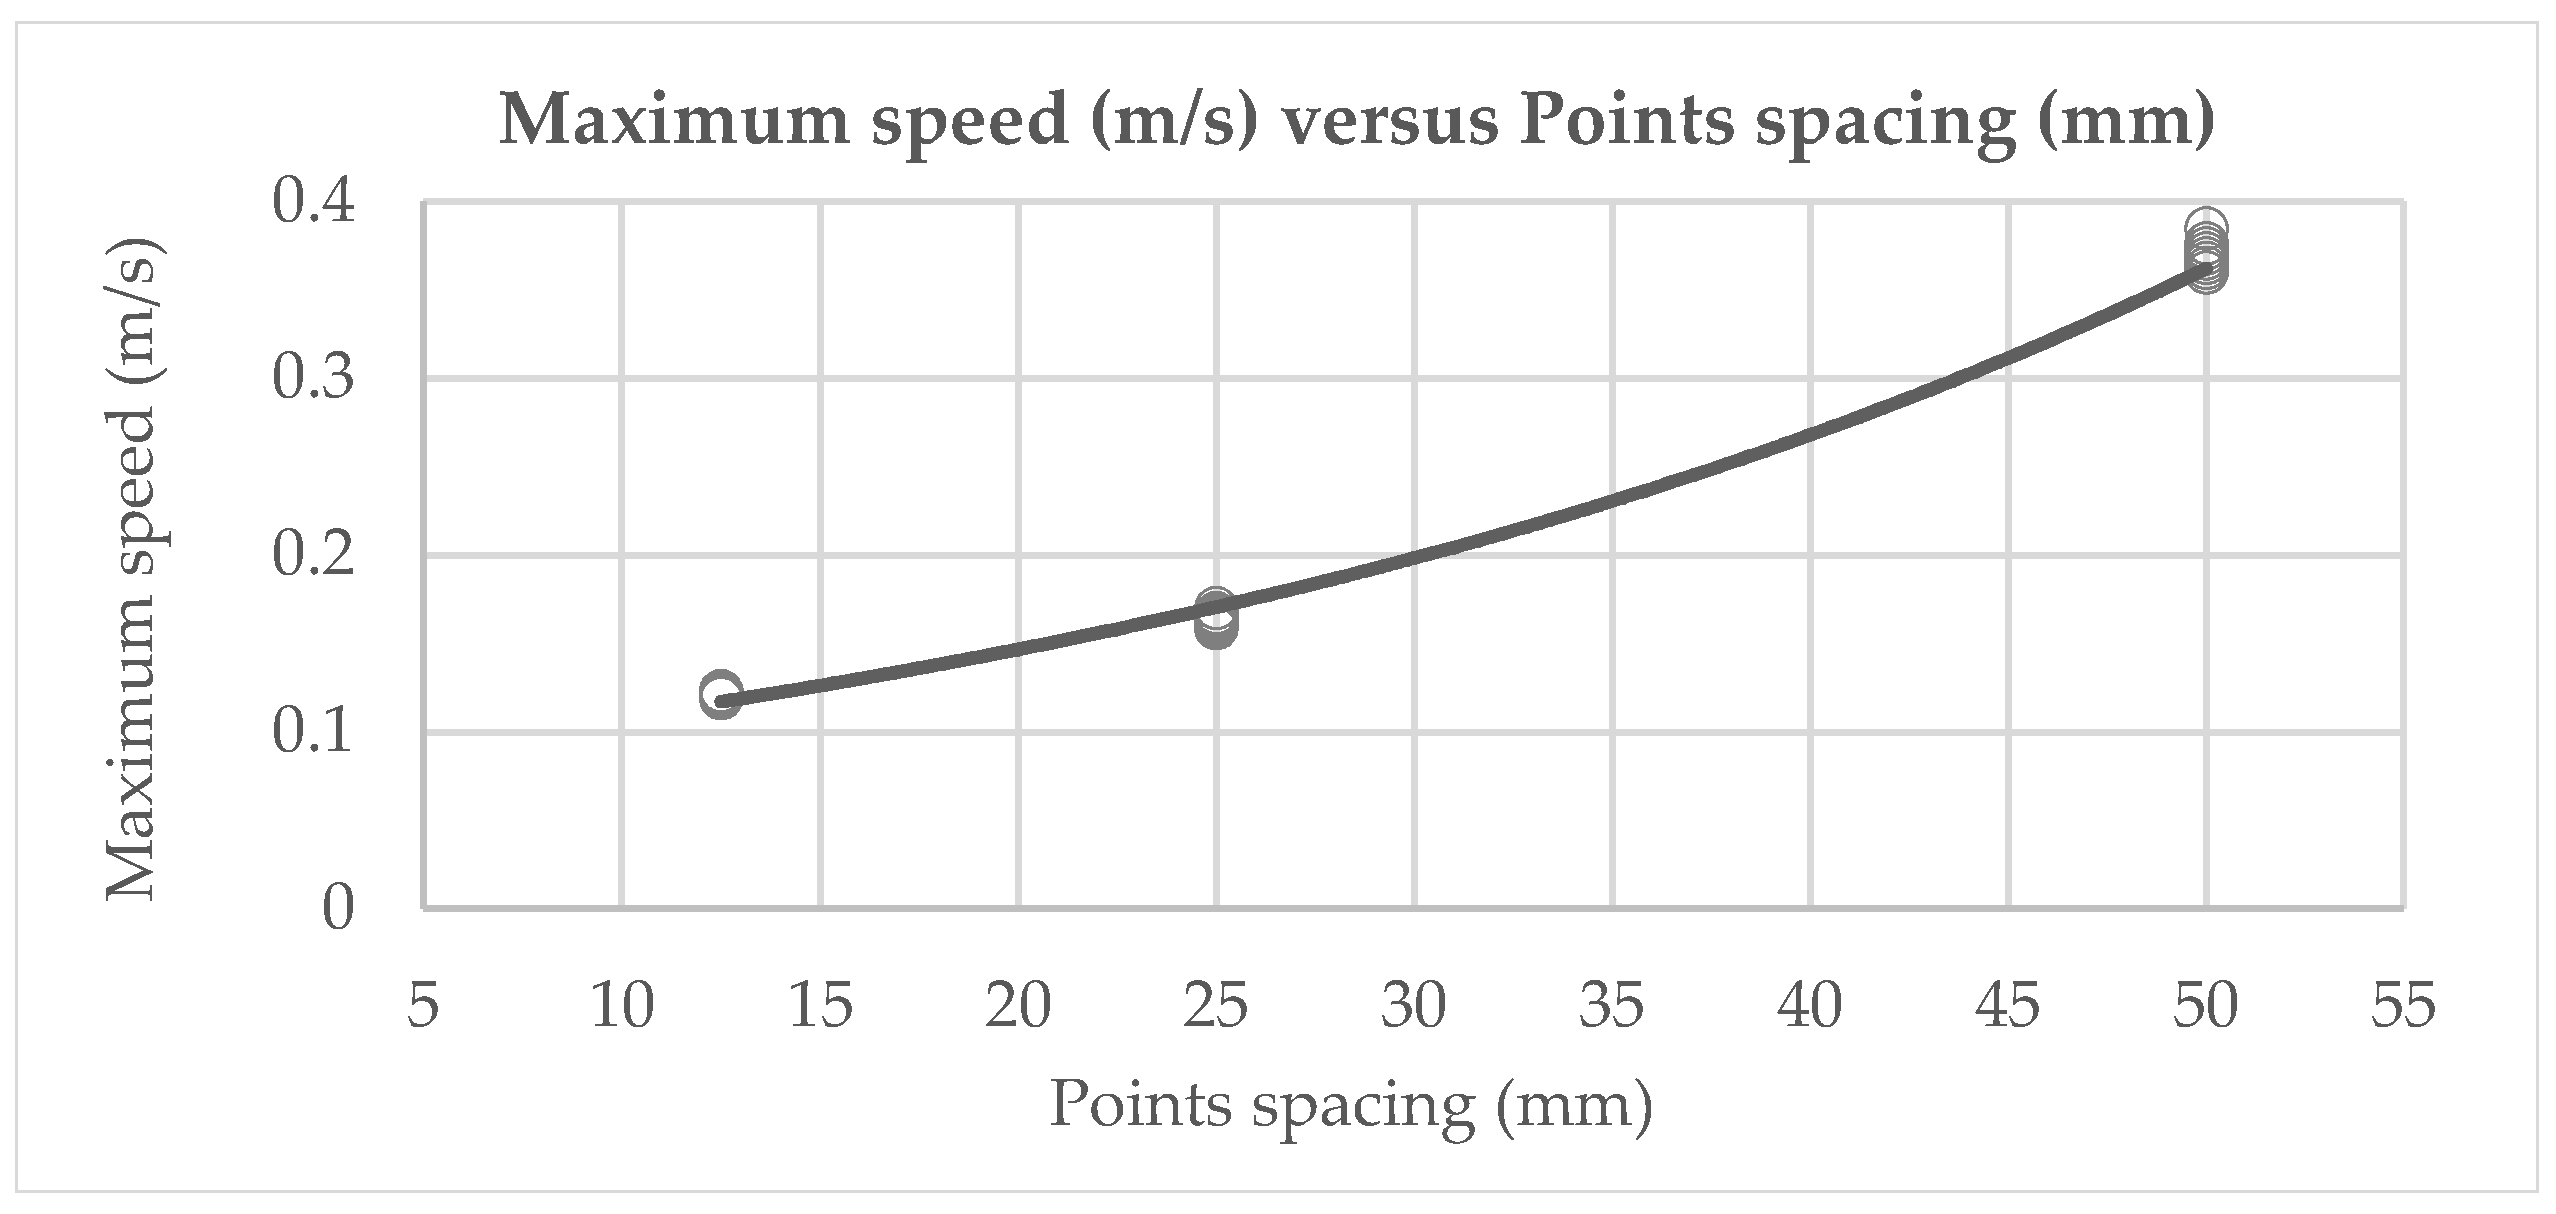
A nonlinear regression analysis was conducted to identify the behavior of the speed in the tested intervals. As a consequence, the exponential curve shown in Figure 11 and Equation (1) were found. From this analysis, Figure 11 shows that the greater points spacing the greater the maximum printing speed.
where:
Max speed = Maximum printing speed (m/s).
sp = Point spacing (mm).
Figure 11.
Graph of maximum speed for different point spacings.

It is interesting to see how Figure 11 shows that the greater the point spacing, the greater the maximum speed. Equation (1) is especially useful when the user wants to know the approximate maximum printing speed for different point spacings that can be entered manually from the printing code. In addition, in case of needing to control the printing speed more precisely, the user will have sufficiently reliable data to define an acceptable range of speed controls lower than this maximum value, and thus to execute the code with a value of controlled and precise speed. However, it is important to emphasize that, because of the exploratory nature of this study, it is not possible to assure that other printing machines will have the exact same behavior. Despite this fact, the procedure presented here to determine the curve could be replicated to obtain own results for further studies.
5.4.4. Summary of the Results Obtained in This Experiment
Table 2 showed that the maximum experimental speed reached by the robotic arm is much lower than 1 m/s.
In addition, from the graph shown in Figure 11, it can be deduced that the greater the point spacing, the greater the maximum printing speed for the robotic arm.
Since the maximum printing speed is relatively easy to calculate by using the formula shown in Equation (1), it is recommendable to work in a range of speeds lower than the maximum speeds, which would allow the robotic arm to be better coupled to the designer’s requirements.
6. Conclusions and Recommendations
From the research presented above, the following conclusions are drawn:
- The developed code allows the connection between a design software and the KUKATM robotic arm for multiple perimeter elements without the need to generate a new printing code for each figure. Tests and comparisons conducted show that the code responds to a variety of different geometries, allowing precise movements at speeds easily controllable by the user.
- By developing a continuous print path, the concrete is intended to spread evenly along the print cordon. This is why checking the precision with which the robotic arm responds to the parameters entered in the control code is essential. In this sense, this research has found confidence levels that show the precision of the robotic arm is approximately between 98% and 99%.
- It was possible to test trajectories of a series of elements with different geometries and sizes by using the developed code, which was capable of modifying the elevation, the printing speed, and the separation of points that define smoothness in the curves easily, facilitating the 3D concrete printing processes.
- A theoretical way of calculating the maximum speed of printing was determined using an empirical equation, which helps users to choose speeds lower than the maximum speeds, allowing the robotic arm to be better coupled to the designer’s requirements.
- For future research, it is necessary to develop elements of greater complexity, in addition to generating a filling pattern to give them greater resistance, and to include reinforcement for the construction of structural elements used in seismic places. In addition, future research should include a comprehensive comparison between the findings of the present study and traditional methods.
Author Contributions
Conceptualization, E.F., R.G.-A. and F.O.; methodology, J.P. and Á.V.; software, J.P., Á.V. and J.S.; validation, E.F., R.G.-A., F.O. and J.S.; formal analysis, J.P. and Á.V.; investigation, J.P. and Á.V.; resources, J.S.; data curation, J.P. and Á.V.; writing—original draft preparation, J.P., Á.V. and E.F.; writing—review and editing, E.F., R.G.-A. and F.O.; visualization, J.S.; supervision, J.S. and E.F.; project administration, E.F.; funding acquisition, E.F. All authors have read and agreed to the published version of the manuscript.
Funding
This study was funded by the Universidad del Bío-Bío (research project No. GI194703).
Institutional Review Board Statement
Not applicable.
Informed Consent Statement
Not applicable.
Data Availability Statement
Not applicable.
Conflicts of Interest
The authors declare no conflict of interest.
Appendix A
This appendix shows the entire step-by-step development of the computer procedure that communicates a model designed in BIM and 3D printing concrete elements.
Appendix A.1. Designing the Initial Construction Element in RevitTM
To perform this procedure the user must open the RevitTM software and start a new project. Then, as shown in Figure A1, the element must be created and drawn, or taken from a previously created element wanted to be printed. The location of this element is not restricted to a work plane in RevitTM, as later the points cloud generated for the 3D printing process will be moved to a work plane of the KUKATM robot.
Figure A1.
Creation of a basic construction element in RevitTM.

Appendix A.2. Exporting Process of a Construction Element from RevitTM to DynamoTM
Before starting, it is necessary to move the KUKA|prc folder from DynamoStudioTM to DynamoTM for RevitTM. The user must return to Windows to C:\Users\(user)\AppData\Roaming\Dynamo\Dynamo Core\1.3\packages, copy the KUKA|prc folder, and paste it in C:\Users\(user)\AppData\Roaming\Dynamo\Dynamo Revit\1.3\packages.
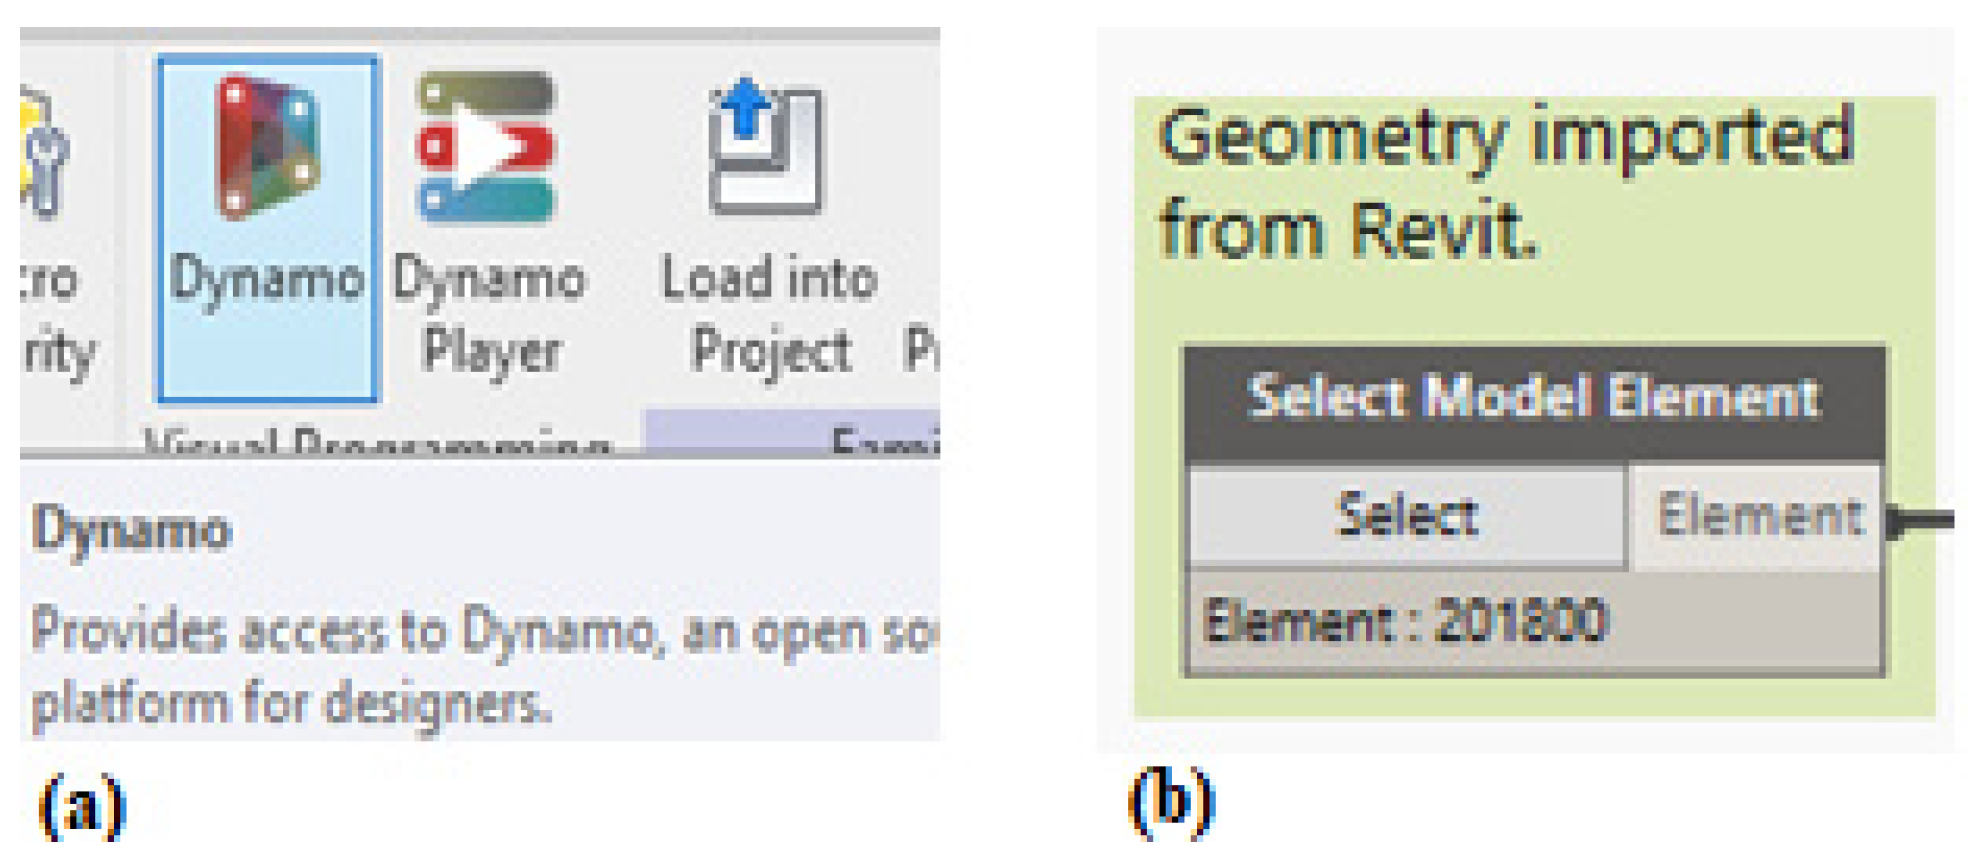
In RevitTM, the user must select the “Manage” tab and then click on the “DynamoTM” icon to link both platforms, as shown in Figure A2a. Then in DynamoTM, the “Select Model Element” node from the “Revit” library is selected. Within this node, the “Select” interface is found, which allows importing an element from RevitTM. Figure A2b shows the node that imports the building element from RevitTM.
Figure A2.
(a) Plugin Dynamo in RevitTM. (b) Importation node for the construction element.

Appendix A.3. Preparation of the Control Code for the Printing Process with the KUKATM Robot
It must be noticed that this section exclusively uses the DynamoTM software as follows:
- (a)
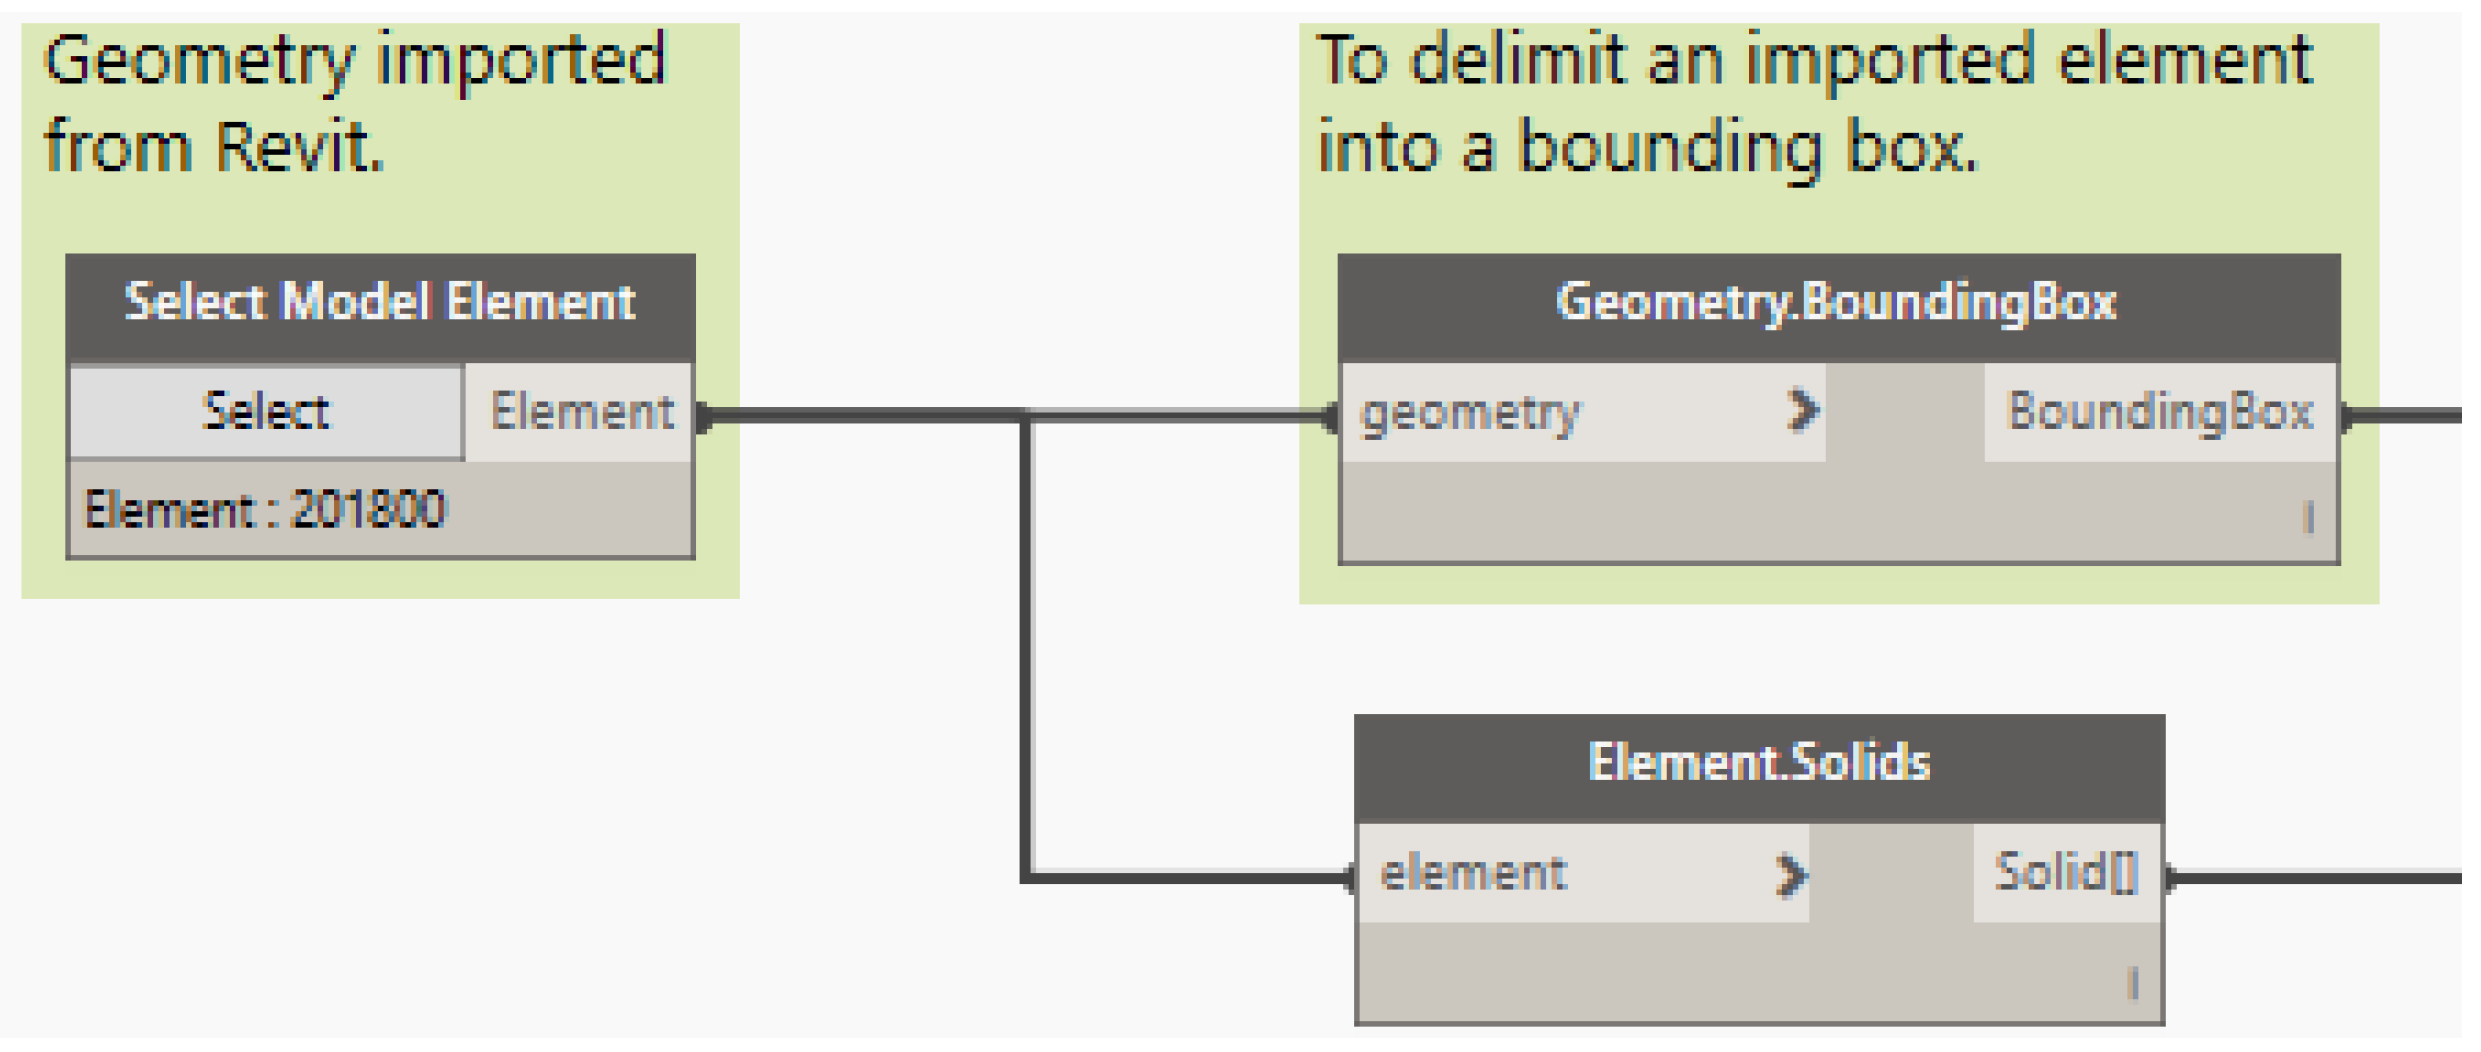
- To obtain the surfaces to create the points cloud of the element to be printed. The user must select the nodes “Element.Solids” and “Geometry.BoundingBox”, and then connect them as explained in Figure A3. The “Geometry.BoundingBox” node is divided into two parallel processes as shown in Figure A4 and Figure A5.
Figure A3.
Creation of the Bounding Box on the construction element.

Then, to select the nodes “BoundingBox.ToPolySurface”, “Geometry.Explode”, “Flatten”, “List.GetItemAtIndex”, and a “CodeBlock”. To write “1” within the CodeBlock and connect as shown in Figure A4.
Figure A4.
Obtaining surfaces of the construction element.

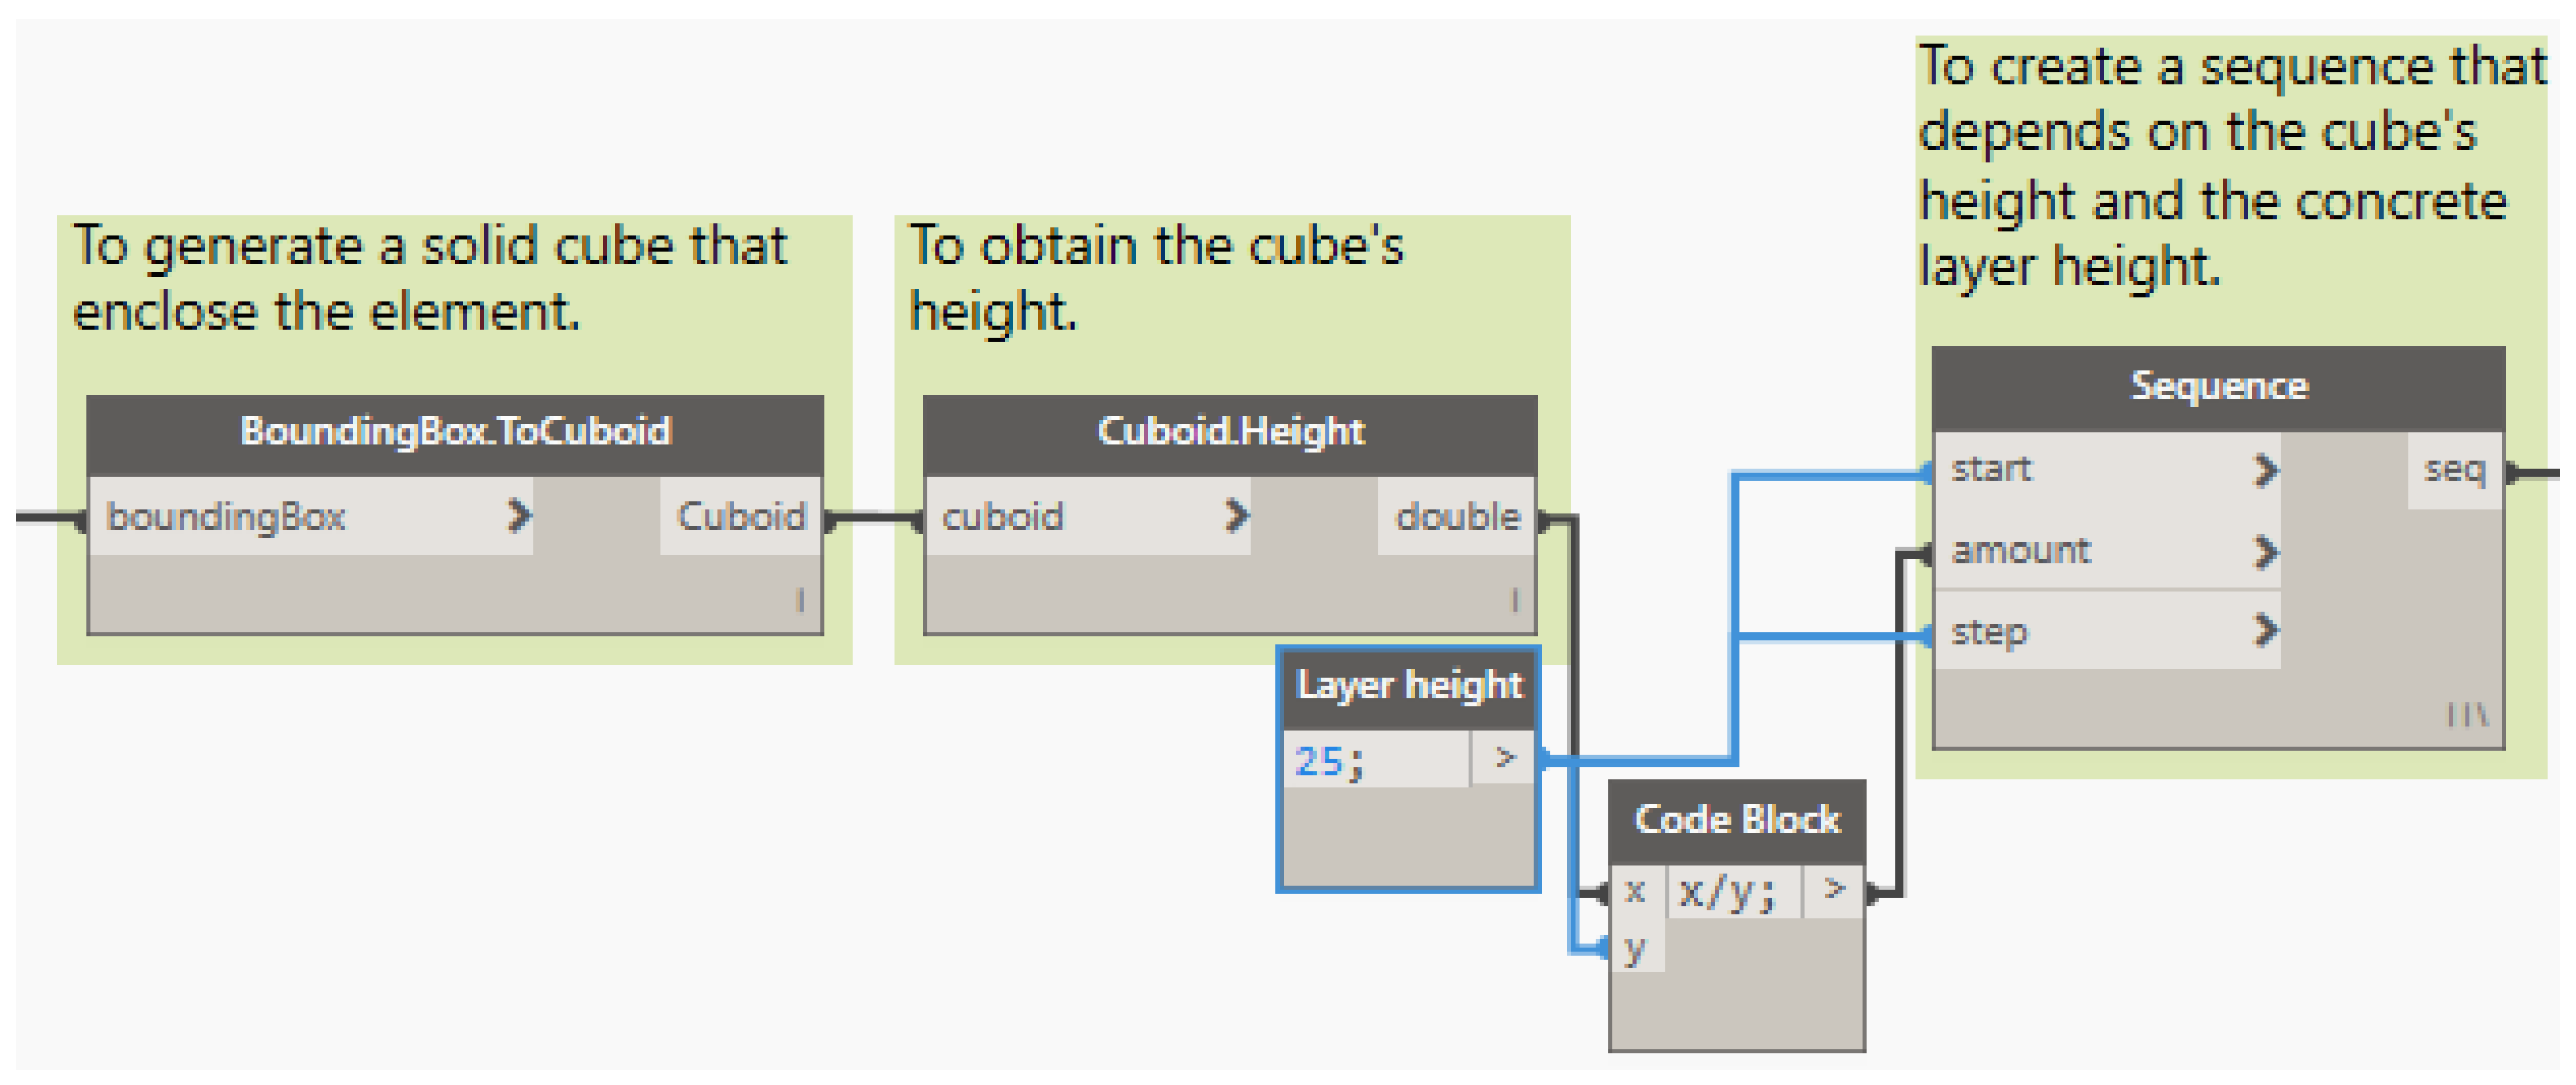
Parallel to what is described in Figure A3, to select the nodes “BoundingBox.ToCuboid”, “Cuboid.Height”, “Sequence”, and two “CodeBlock” nodes. In one of the CodeBlock to write the thickness of each layer in millimeters, and in the other to write “x/y”, where “x” is the height of the element obtained from the “Cuboid.Height” node, whereas “y” represents the thickness of the concrete layers; therefore, at this point, the number of concrete layers to be printed is defined. The nodes must be connected as shown in Figure A5.
Figure A5.
Obtaining the height sequence of the construction element.

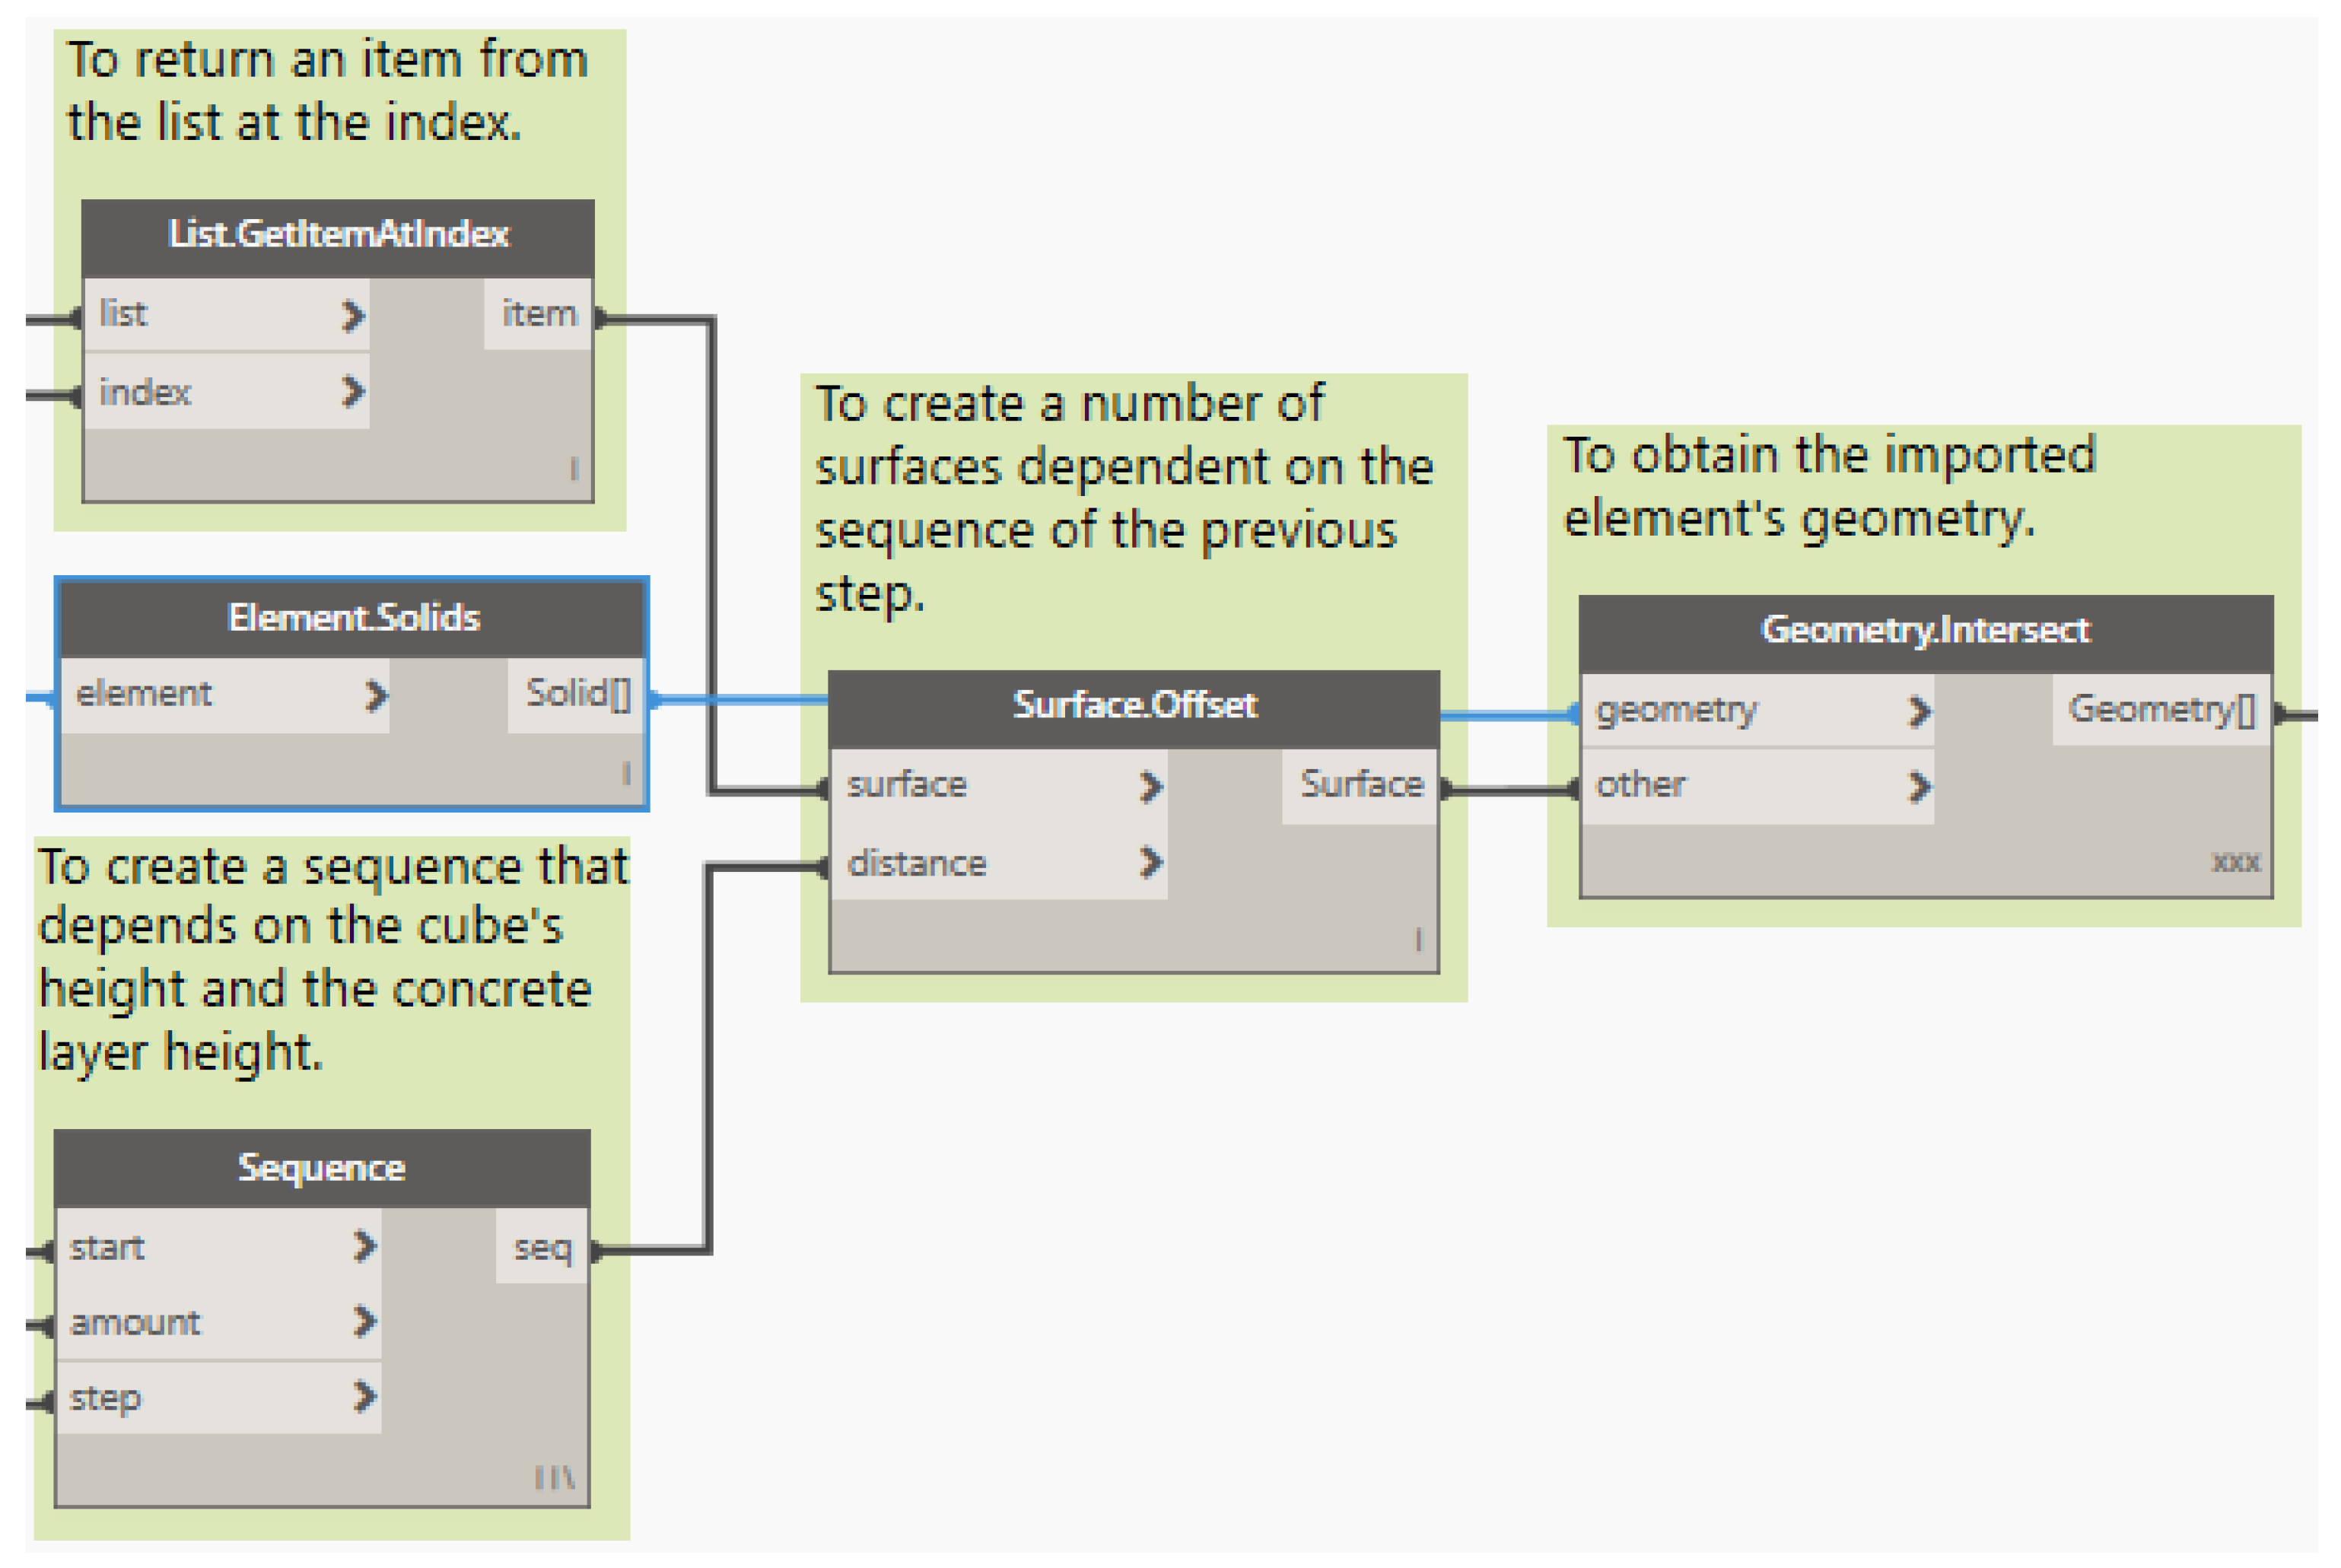
Next, and as shown in Figure A6, the nodes “Surface.Offset” and “Geometry.Intersect” are selected to finish creating the surfaces. Parallel to this, the output of the “Element.Solid” node is connected to the “geometry” input of the “Geometry.Intersect” node. To connect the nodes as follows:
Figure A6.
Obtaining the sequence of the construction element surfaces.

- (b)
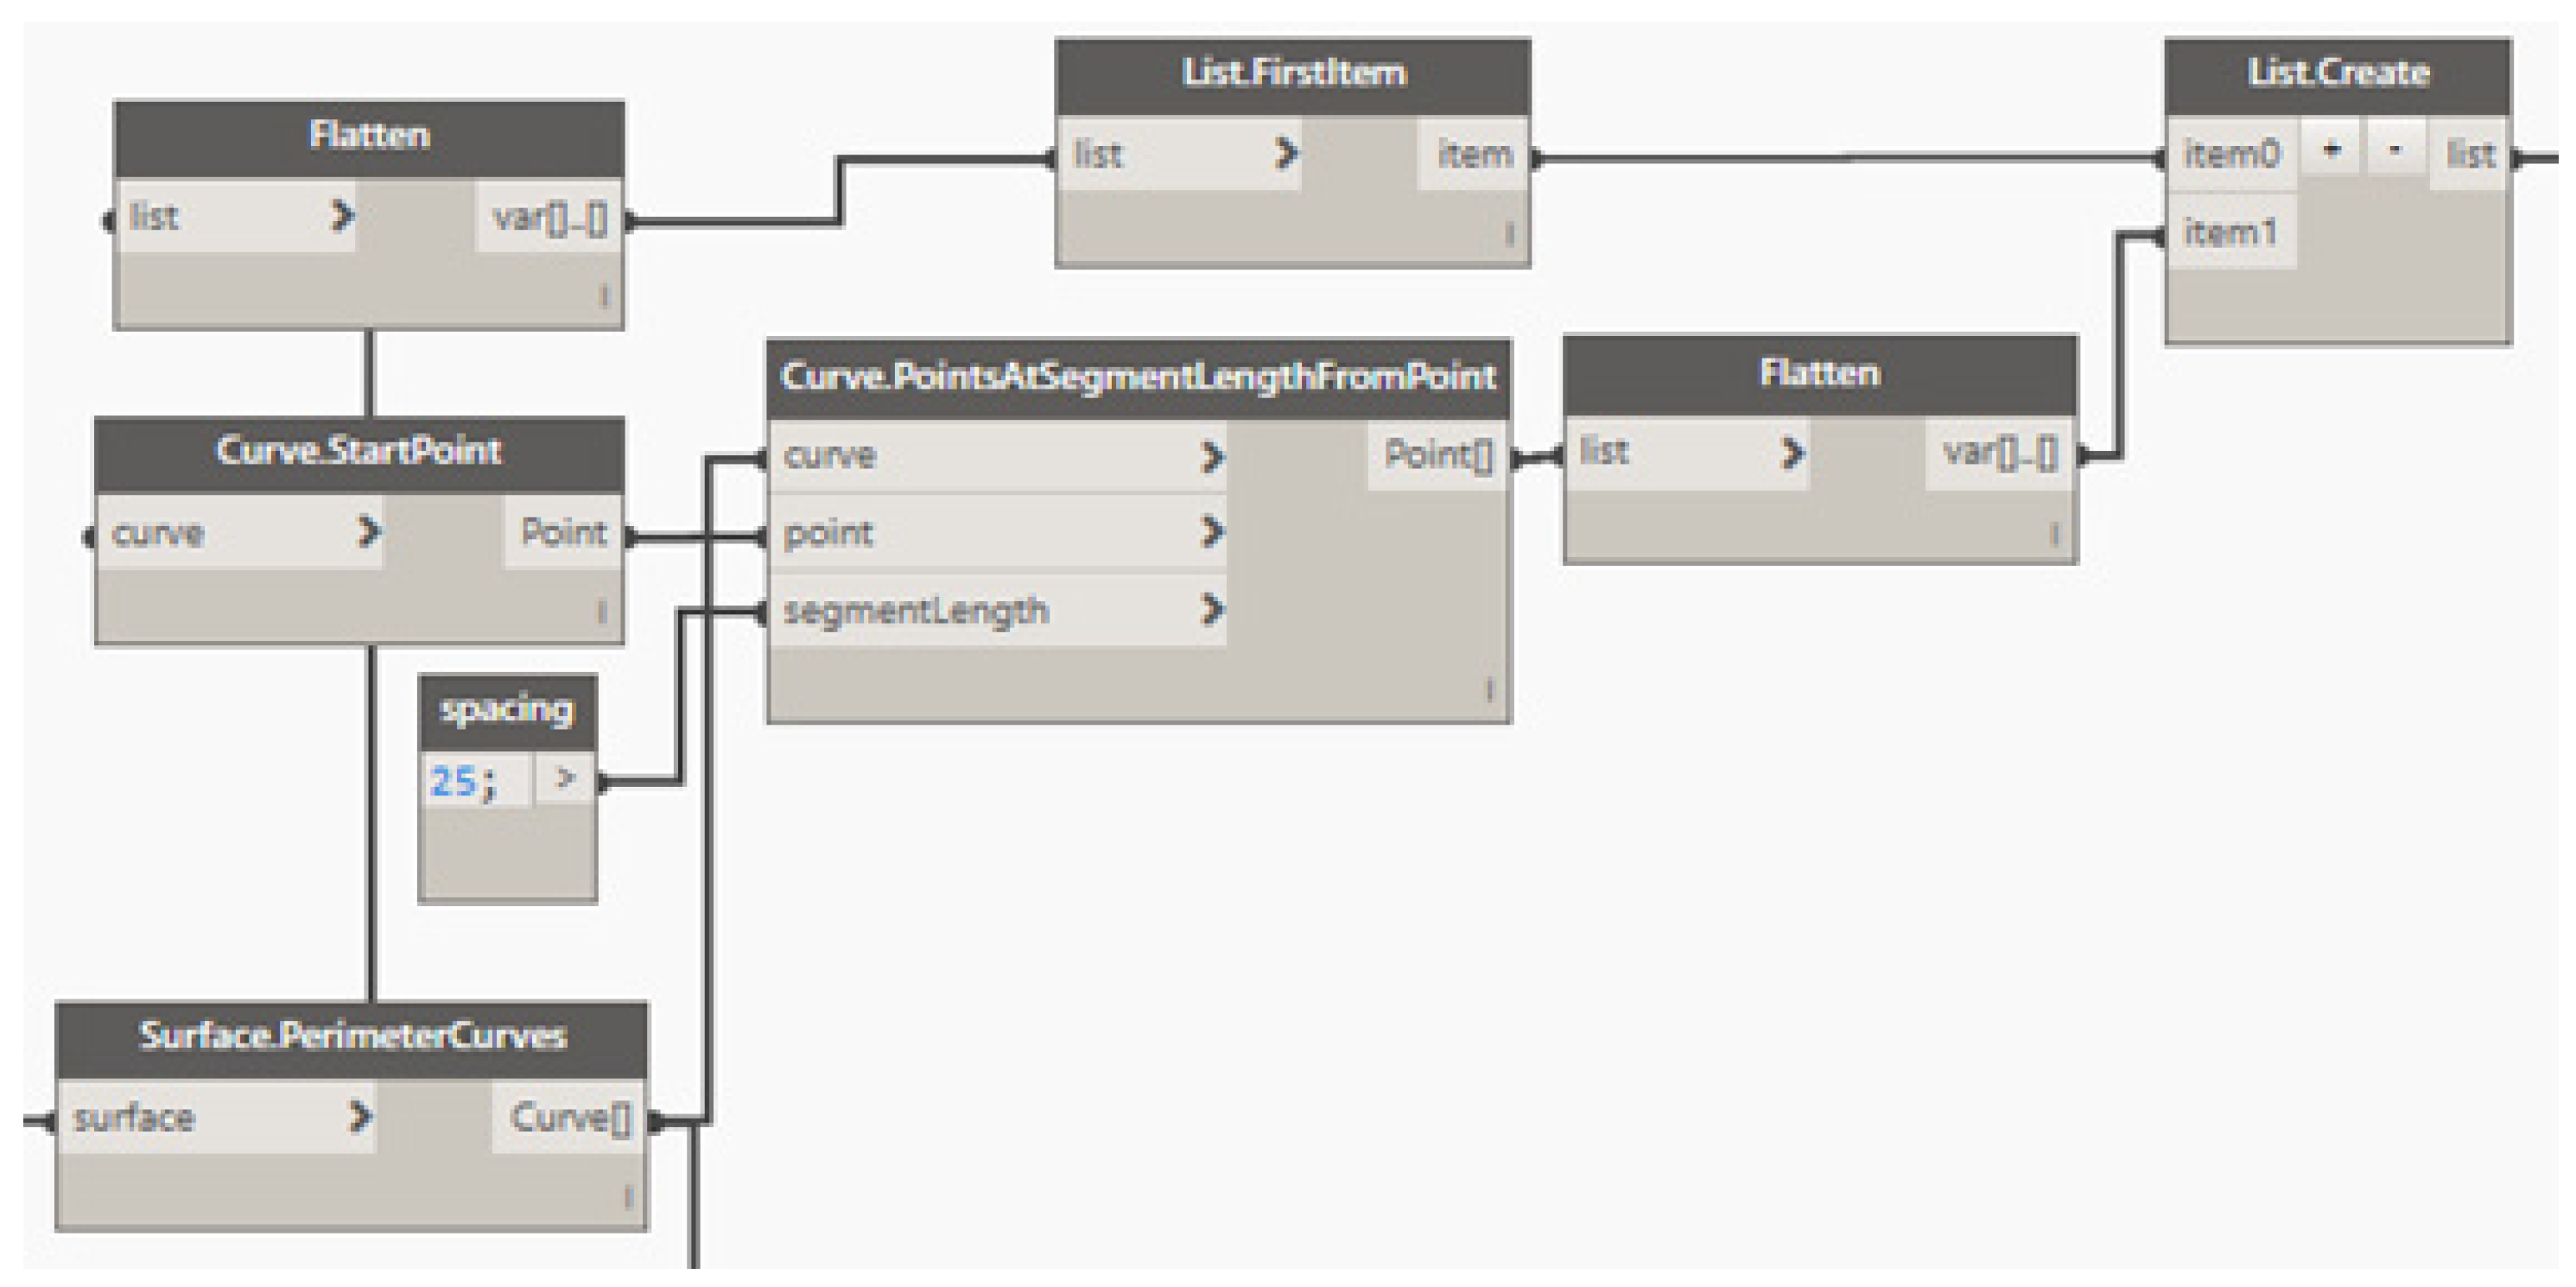
- To create the points cloud that describes the contour of the figure. Here, the following nodes must be selected: “Surface.PerimeterCurves”, “Curve.StarPoint”, “Curve.PointsAtSegmentLenghtFromPoint”, “Flatten”, and a “CodeBlock” node which describes the spacing between printing points. Then, the nodes must be connected as shown in Figure A7.
Figure A7.
Creation of the points cloud that defines the printing trajectory.

- (c)
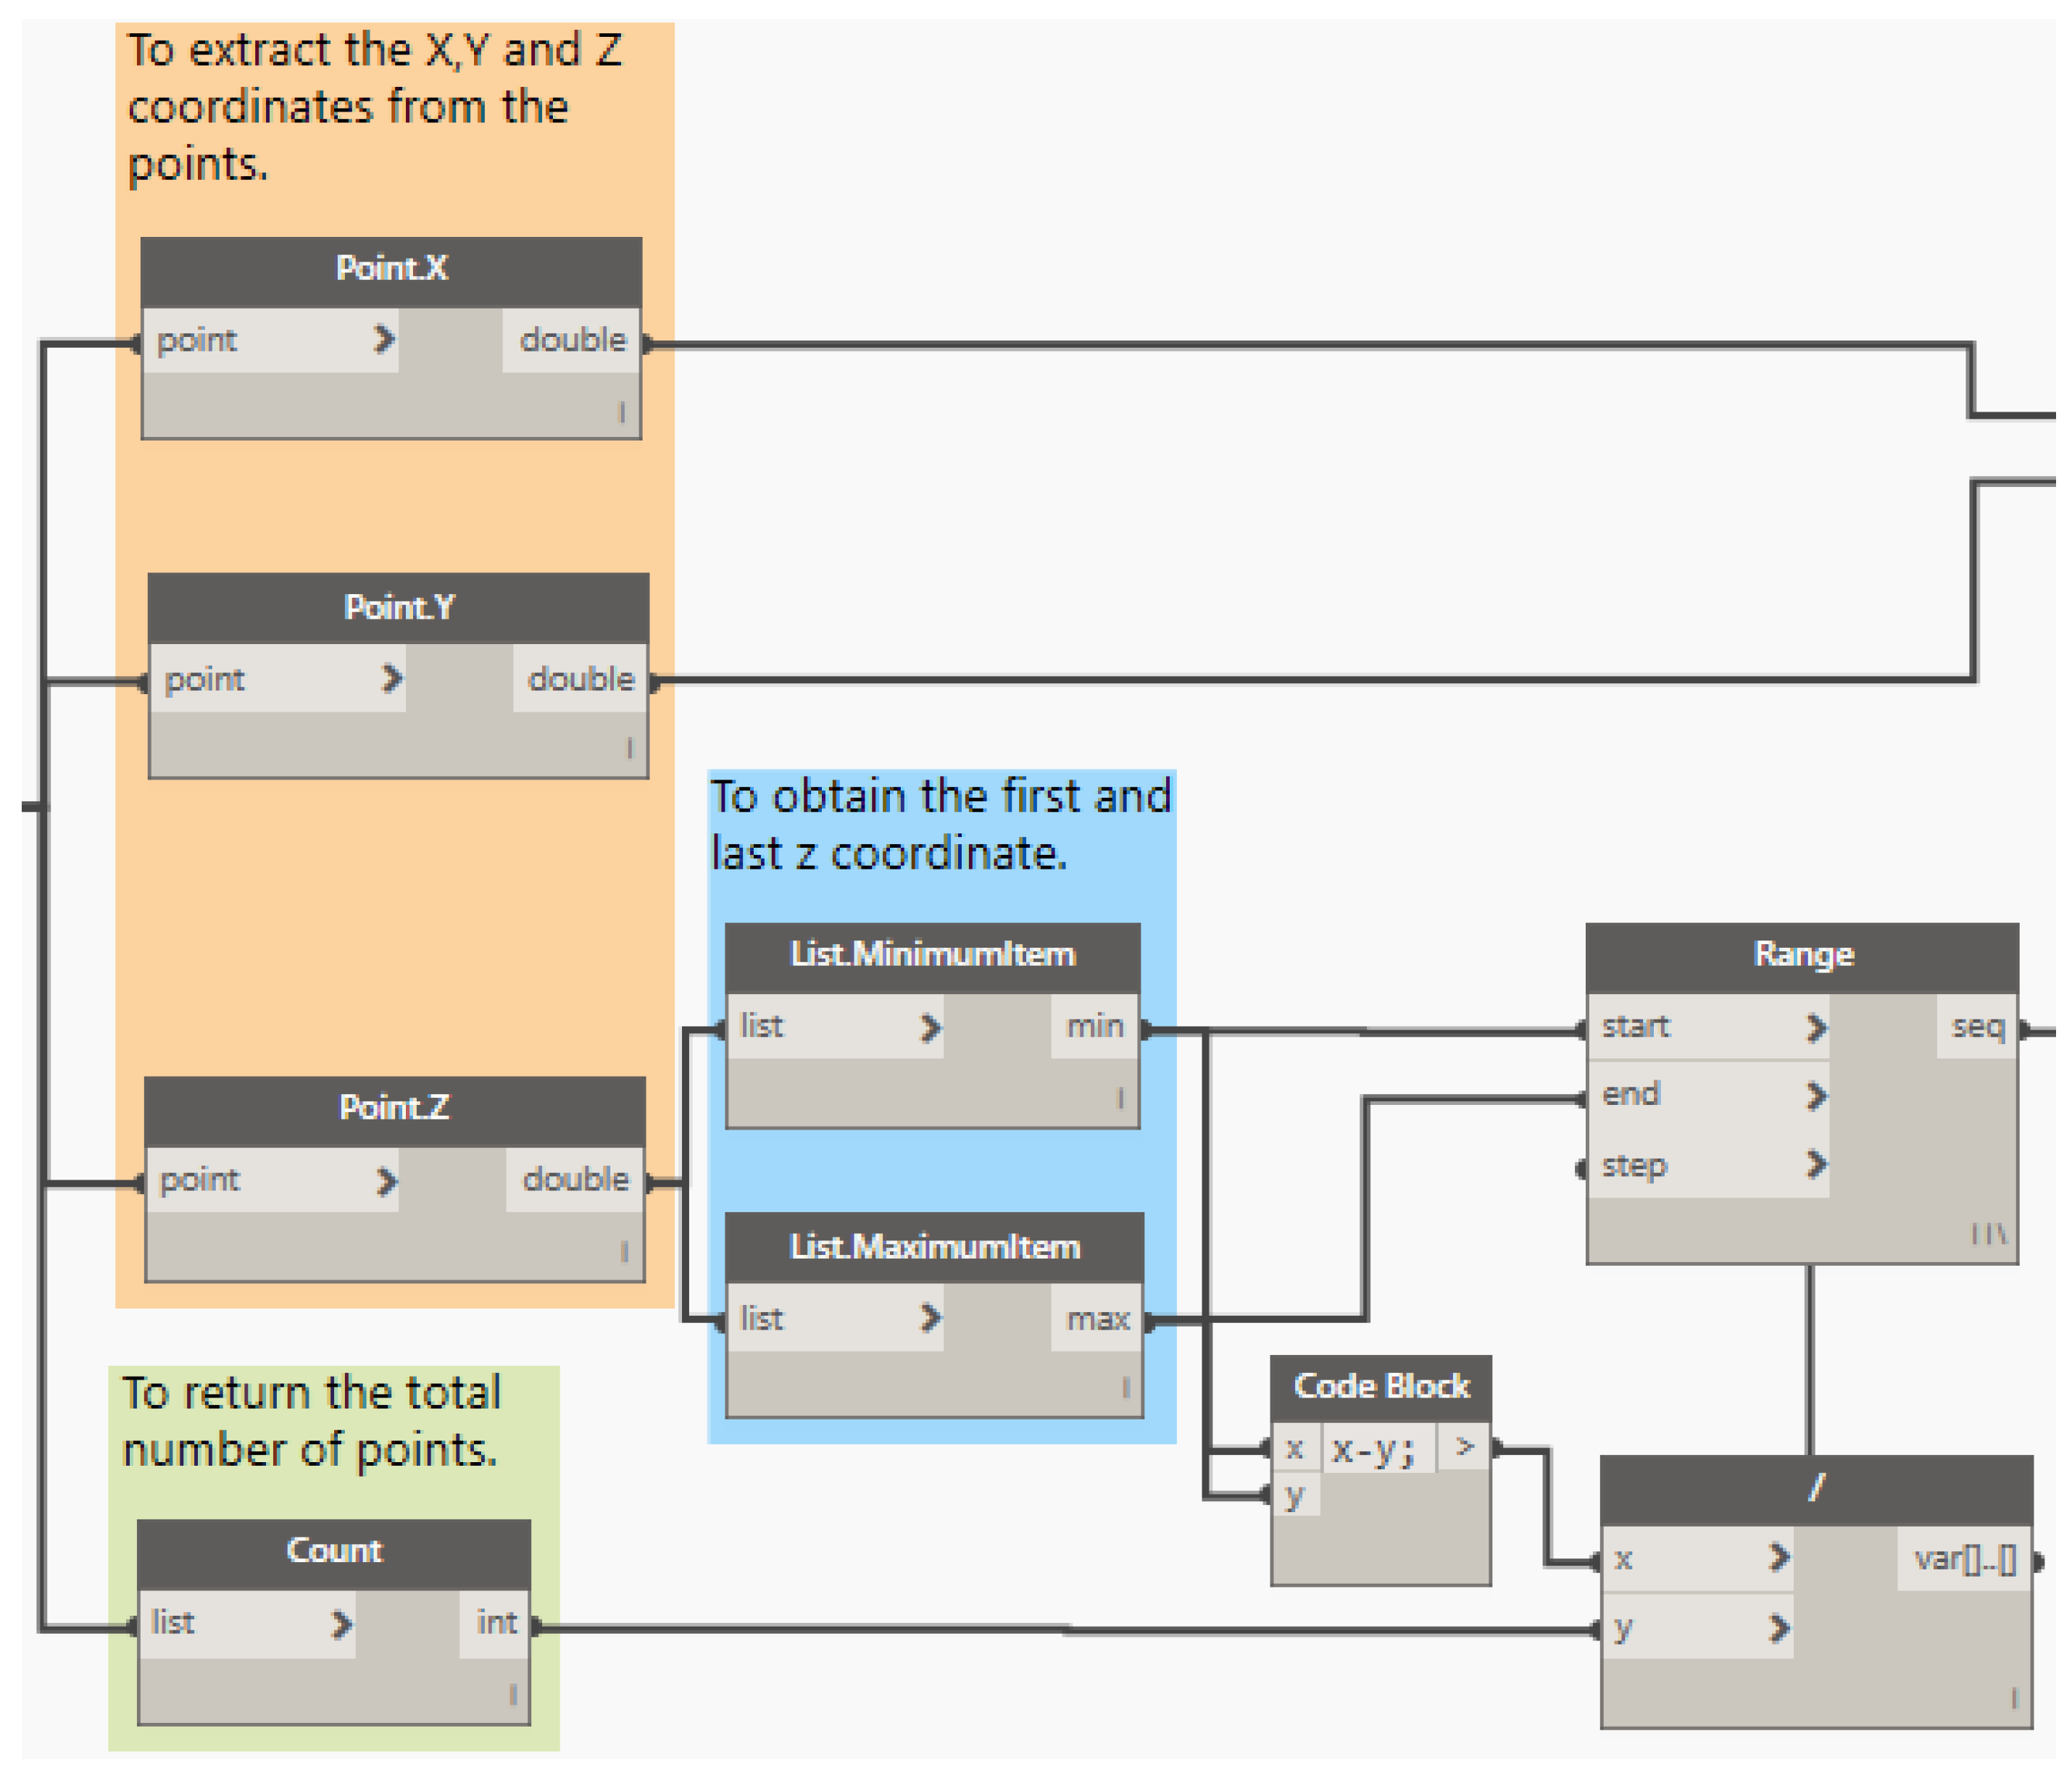
- To create the printing trajectory from the points cloud. The following nodes have to be selected: “Point.X”, “Point.Y”, “Point.Z”, “List.MinimumItem”, ”List.MaximumItem”, “Range”, ”Count”, and additionally a node “CodeBlock”, in which the command “x-y” will be written, and from which the height of the element to be printed is obtained. Finally, the node “/” which will give the gradual elevation that the Z-axis will have at each point. Then, to connect as indicated in Figure A8.
Figure A8.
Creation of the printing trajectory.

- (d)
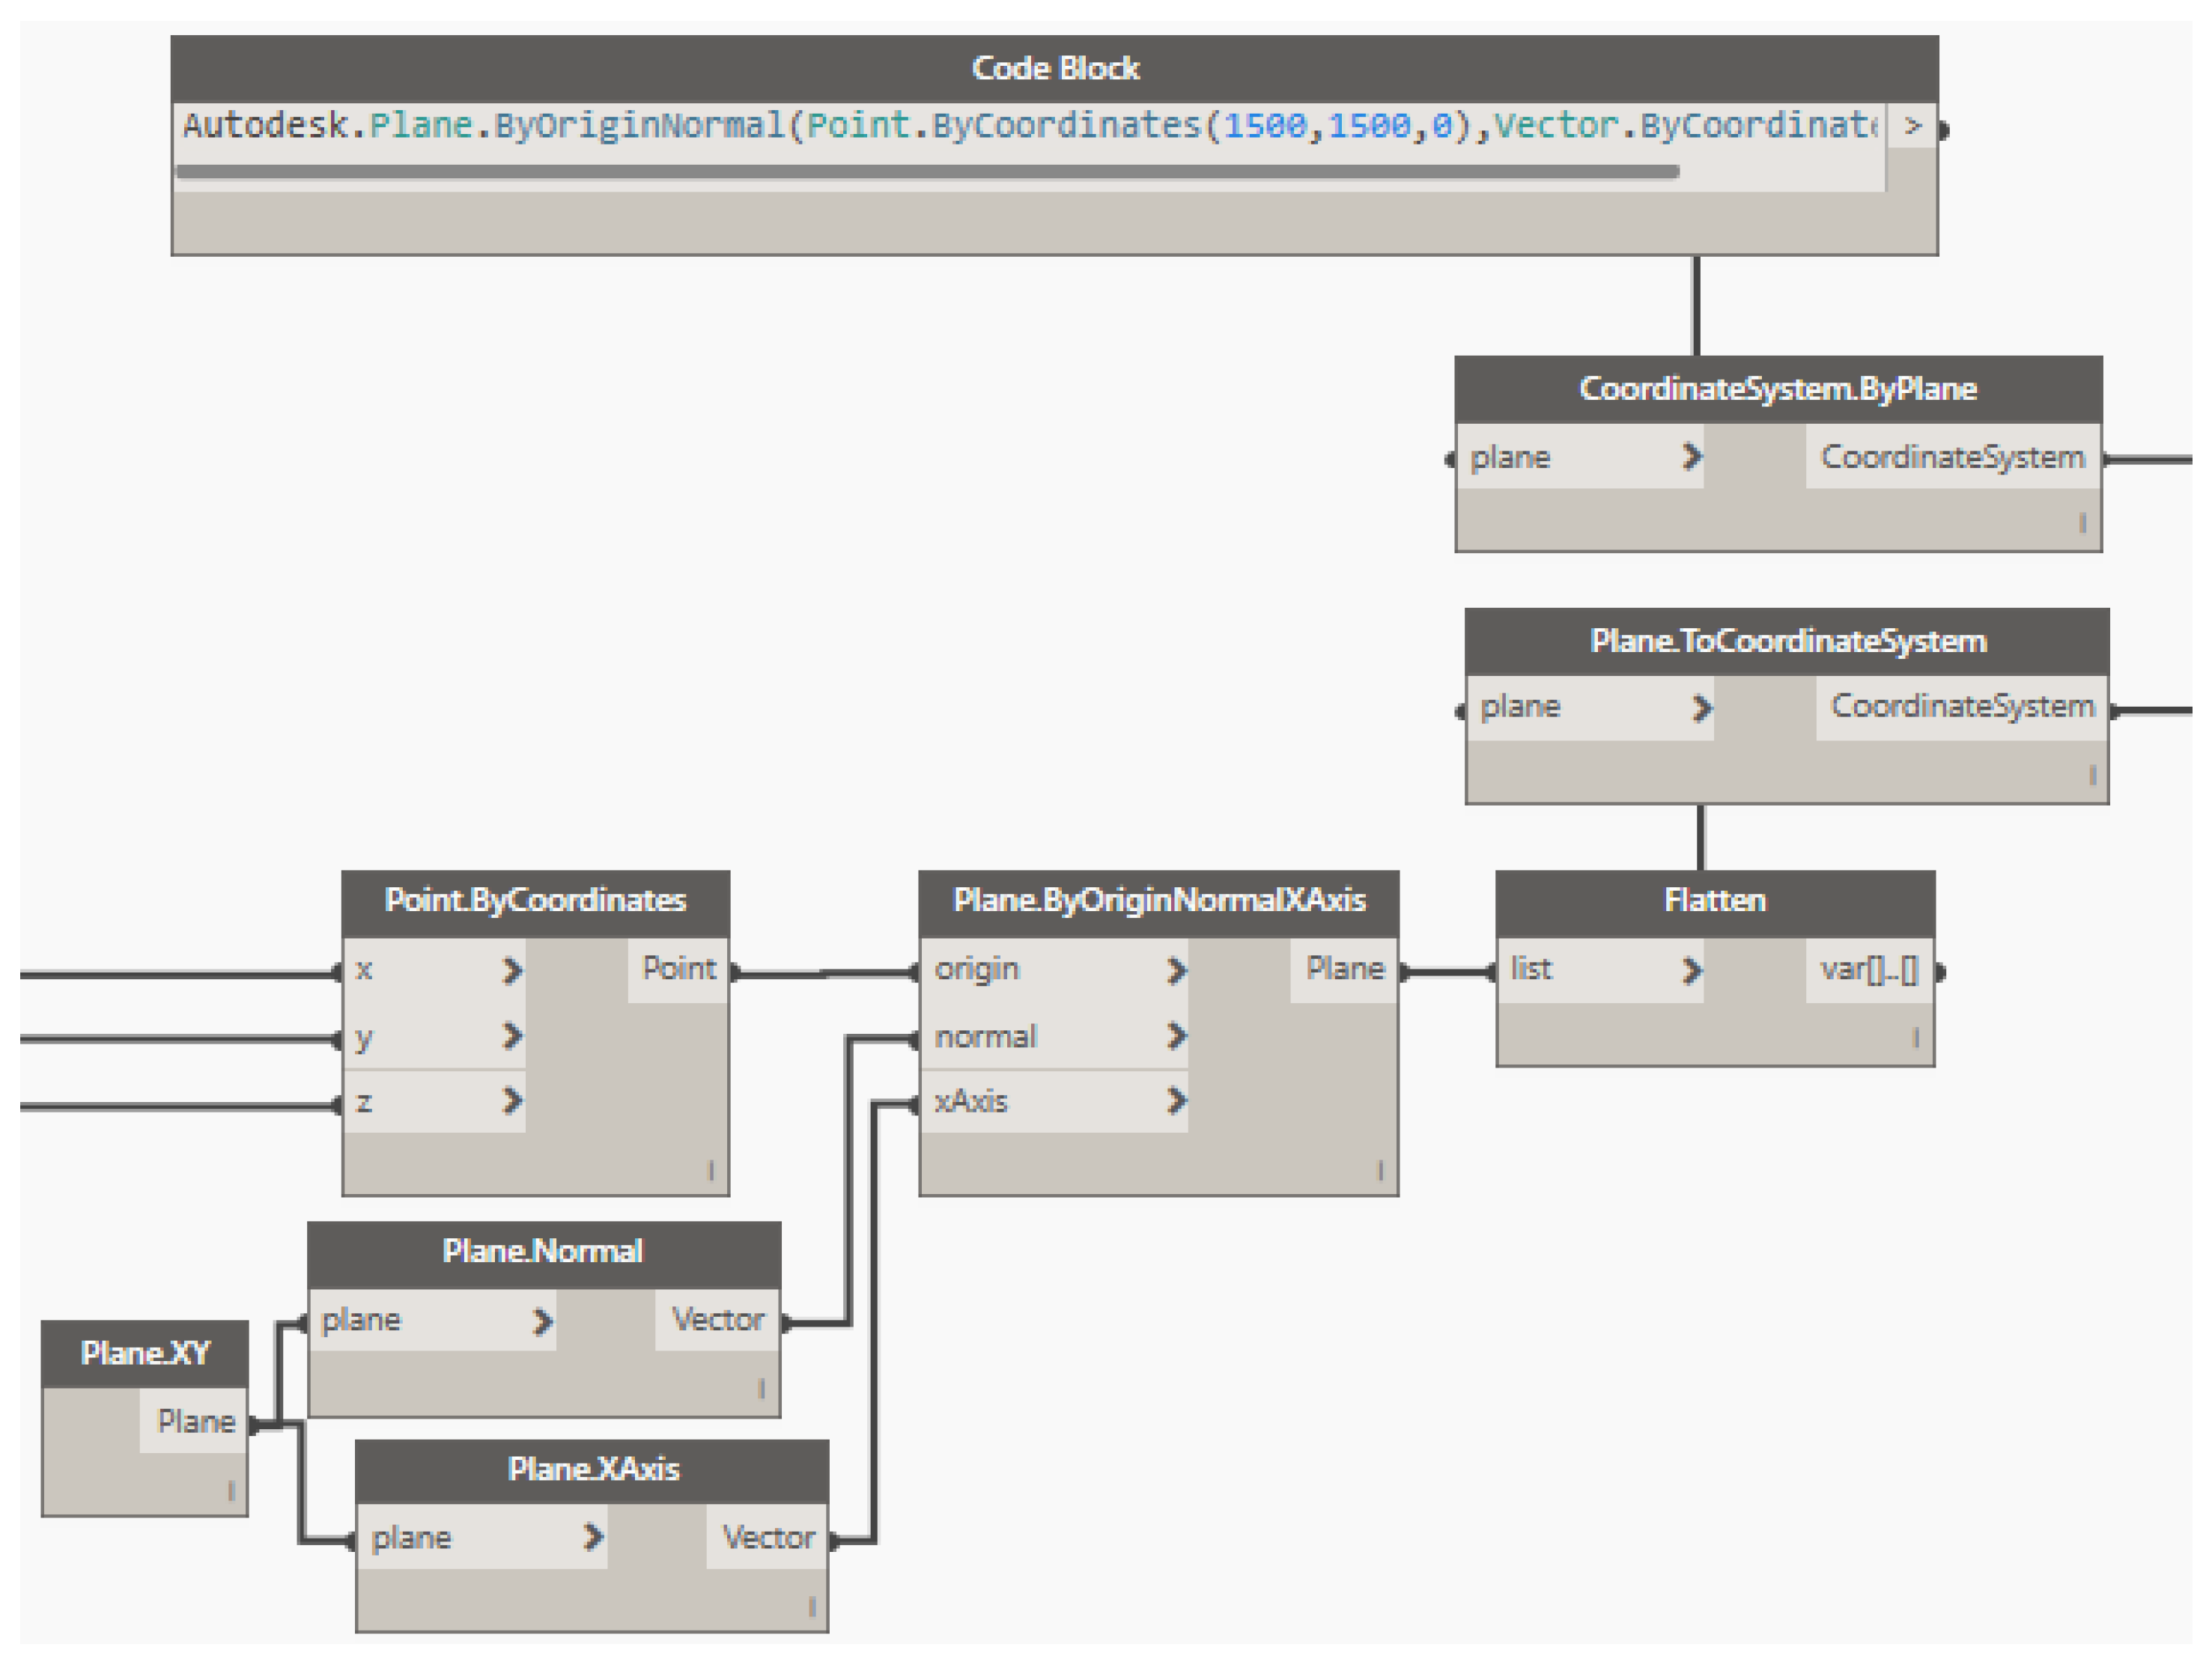
- To transfer the points cloud, within the coordinate plane, to a position within reach of the robotic arm. First, the following nodes must be selected: “Plane.XY”, “Plane.Normal”, “Plane.XAxis”, “Plane.ByOriginNormalXAxis”, “Flatten”, “Plane.ToCoordinateSystem”, and “CoordinateSystem.Byplane”. Then, a “CodeBlock” node must be created that allows the points cloud to be moved to the KUKATM robot work plane. Finally, to connect the nodes as shown in Figure A9.
Figure A9.
Transfer of points cloud to the printing robot work plane.

- (e)
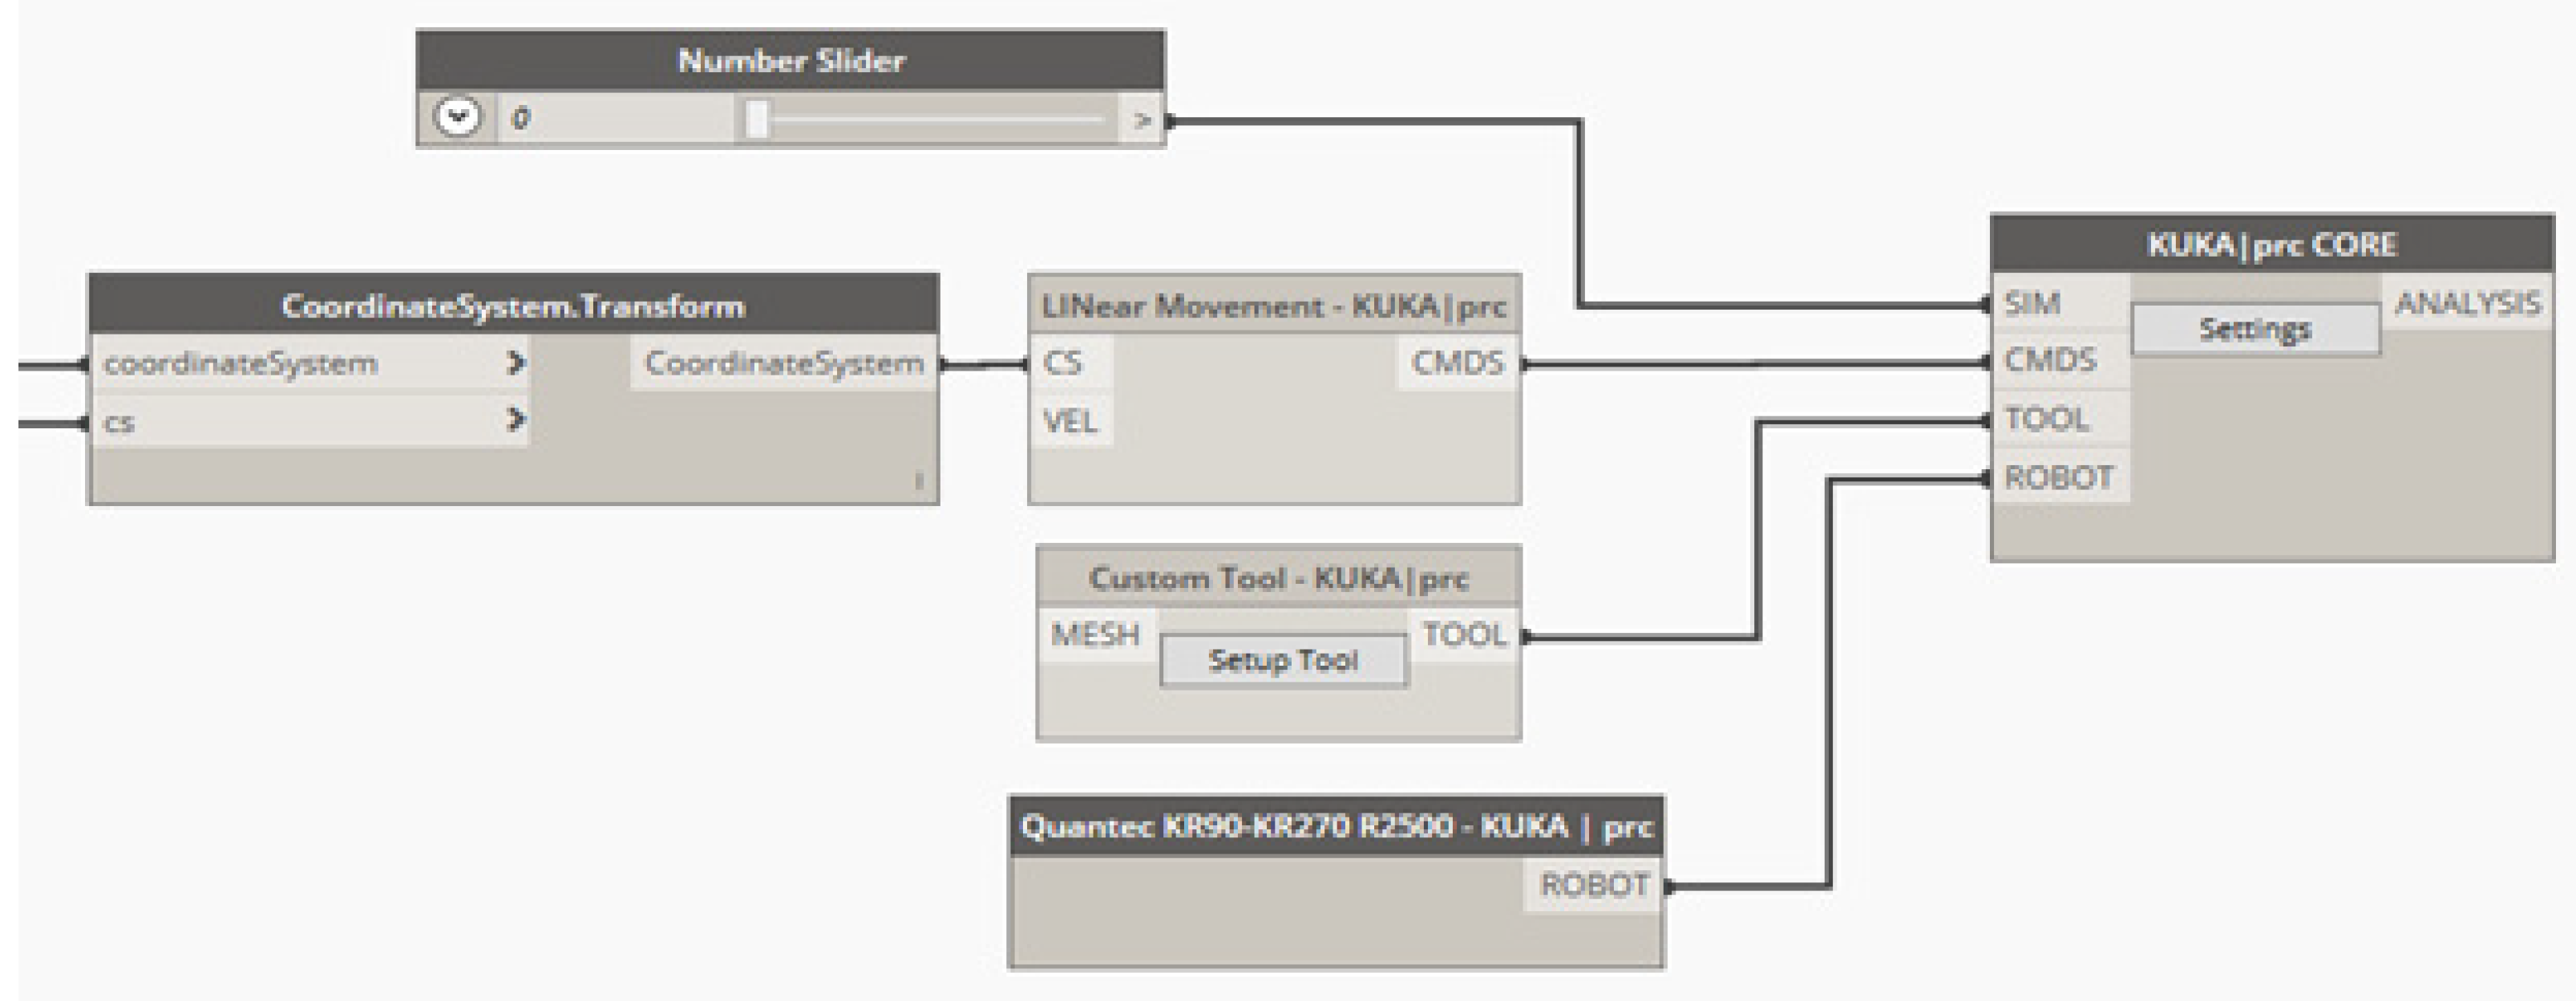
- To create the Control code of the KUKATM robotic arm. At this stage, it is required to create the nodes: “CoordinateSystem.Transform”, “Number.Slider”, “LINear Movement—KUKA|prc”, “Custom Tool—KUKA|prc”, “Quantec KR90-KR270-R2500—KUKA|prc”, “KUKA|prc CORE”. Then, to connect as indicated in Figure A10.
Figure A10.
Control nodes for the KUKATM robotic arm.

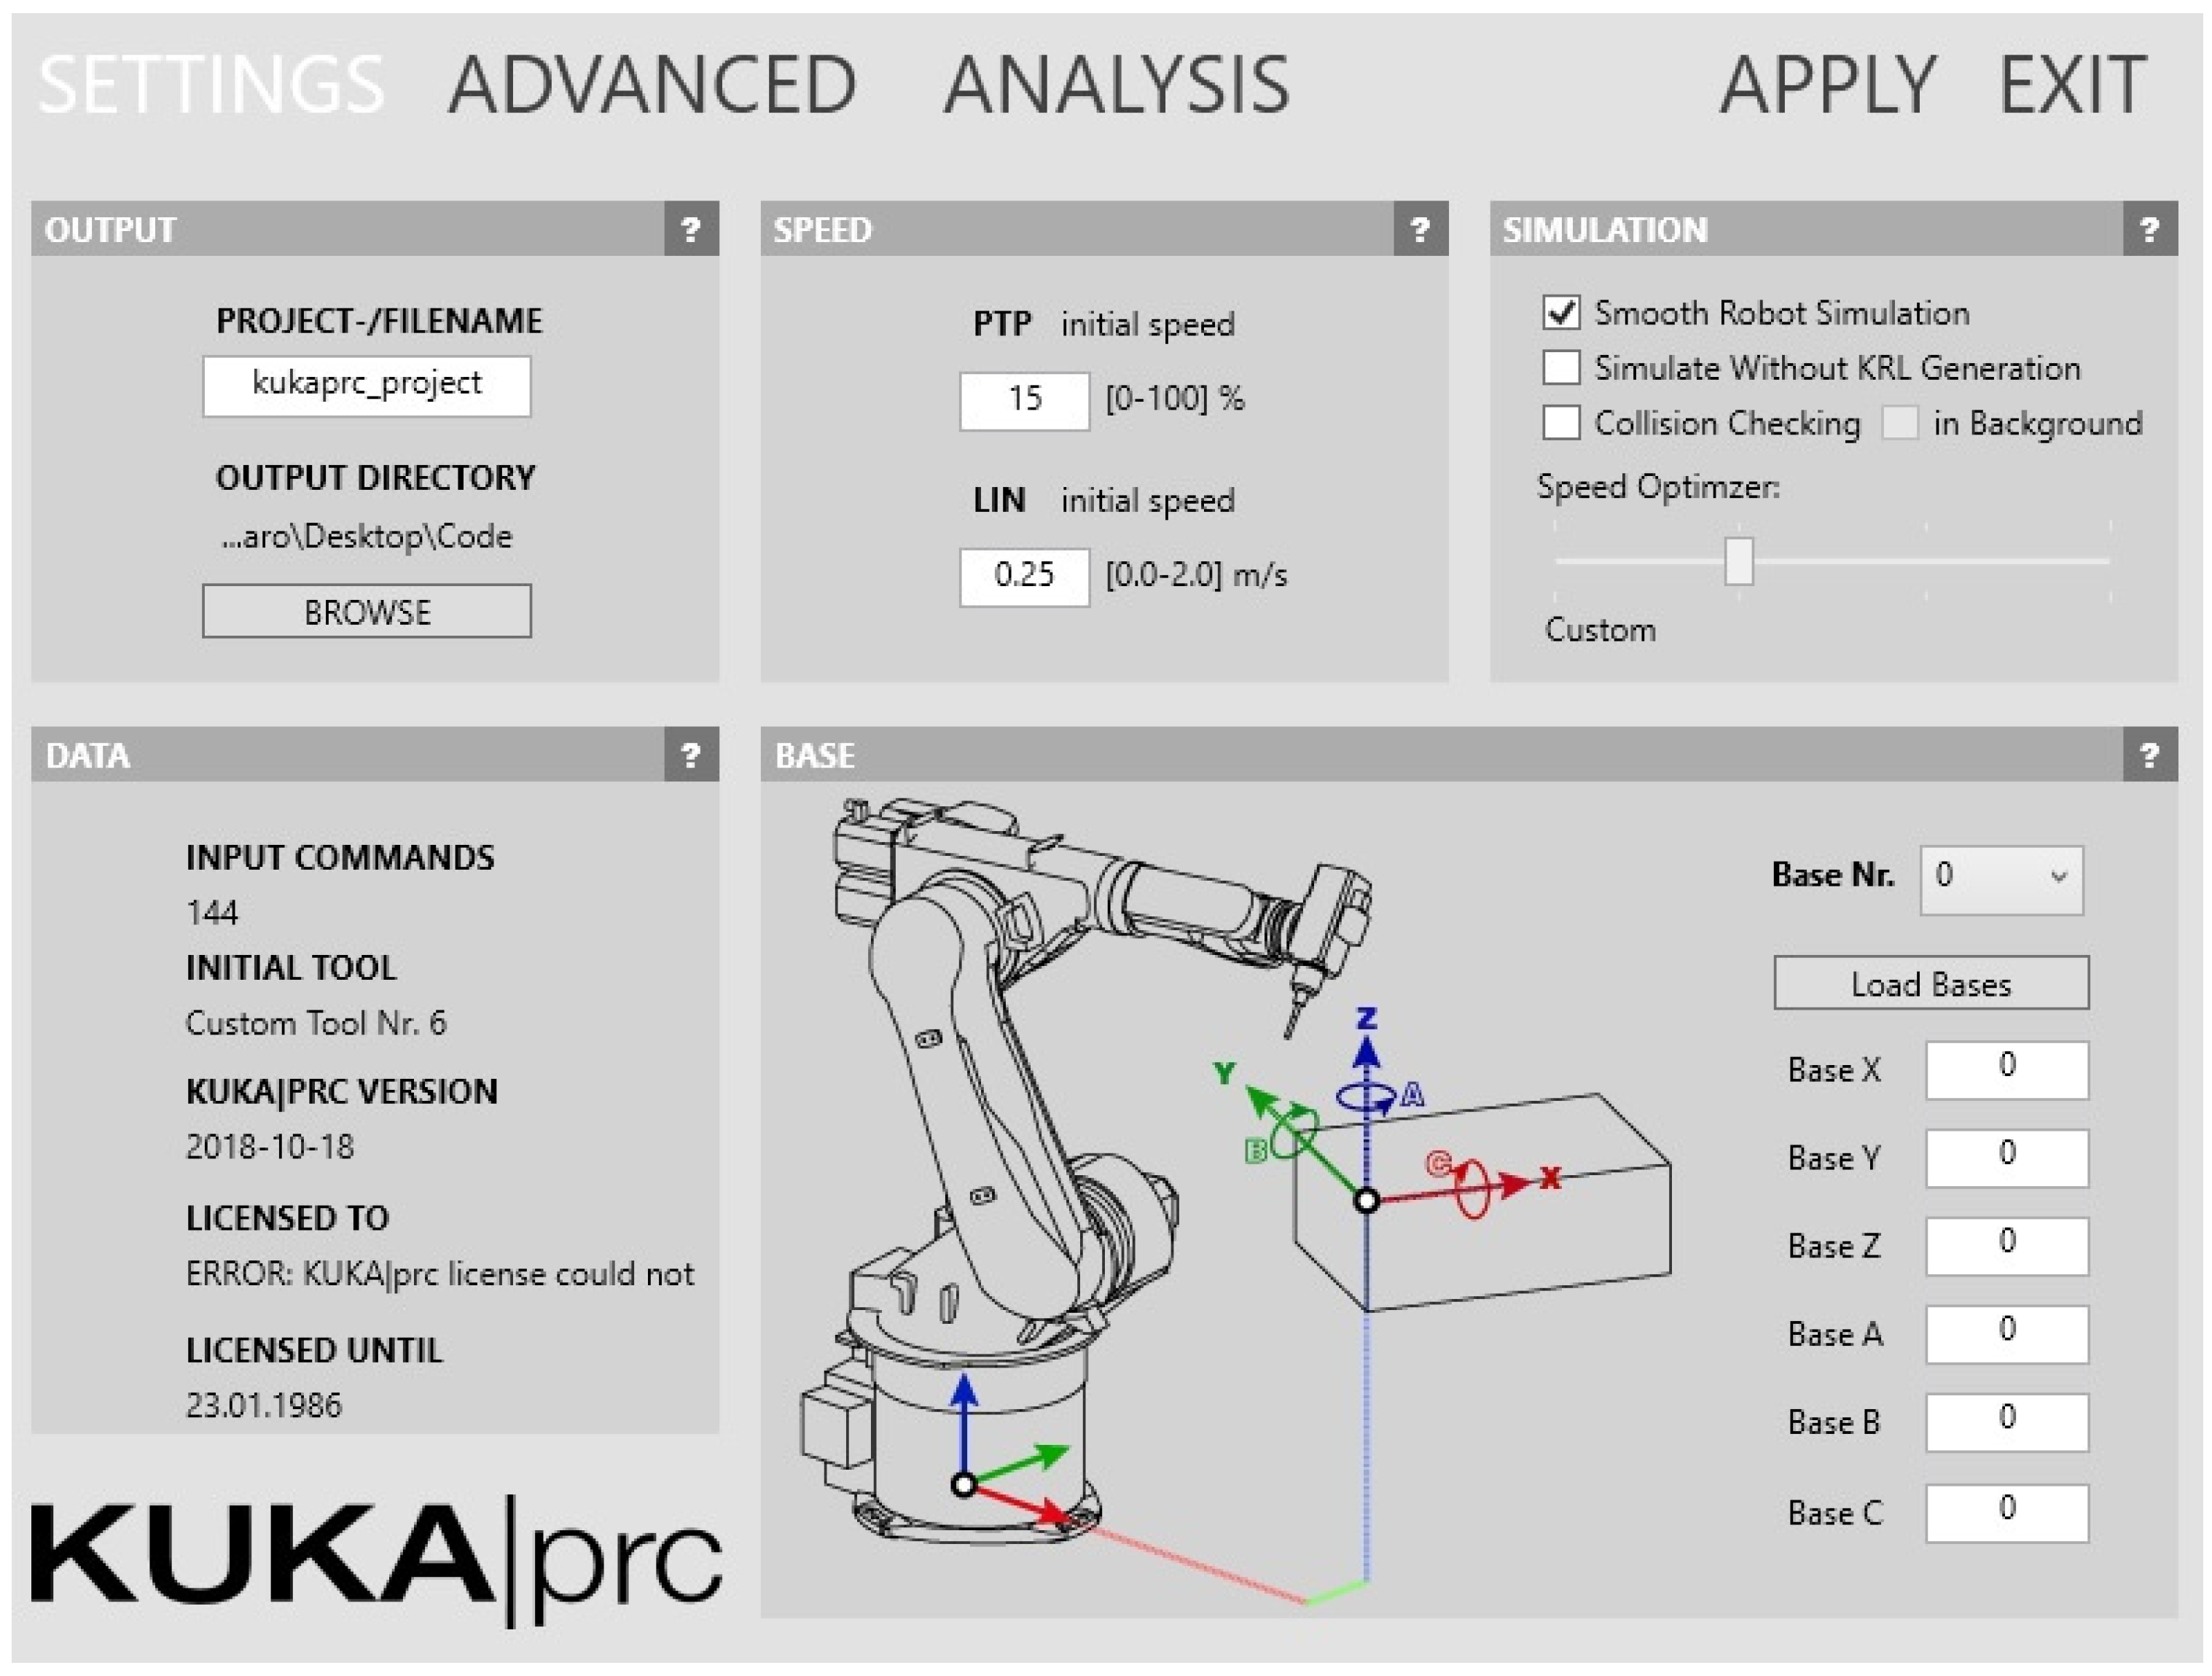
Figure A11 shows the KUKA|prc CORE interface, where it is possible to configure the parameters of the KUKATM robot, in addition to extracting the code that allows the printing of the designed element in the previously described process.
Figure A11.
Interface KUKA PRC CORE.

Appendix A.4. Calculations and Printing Costs
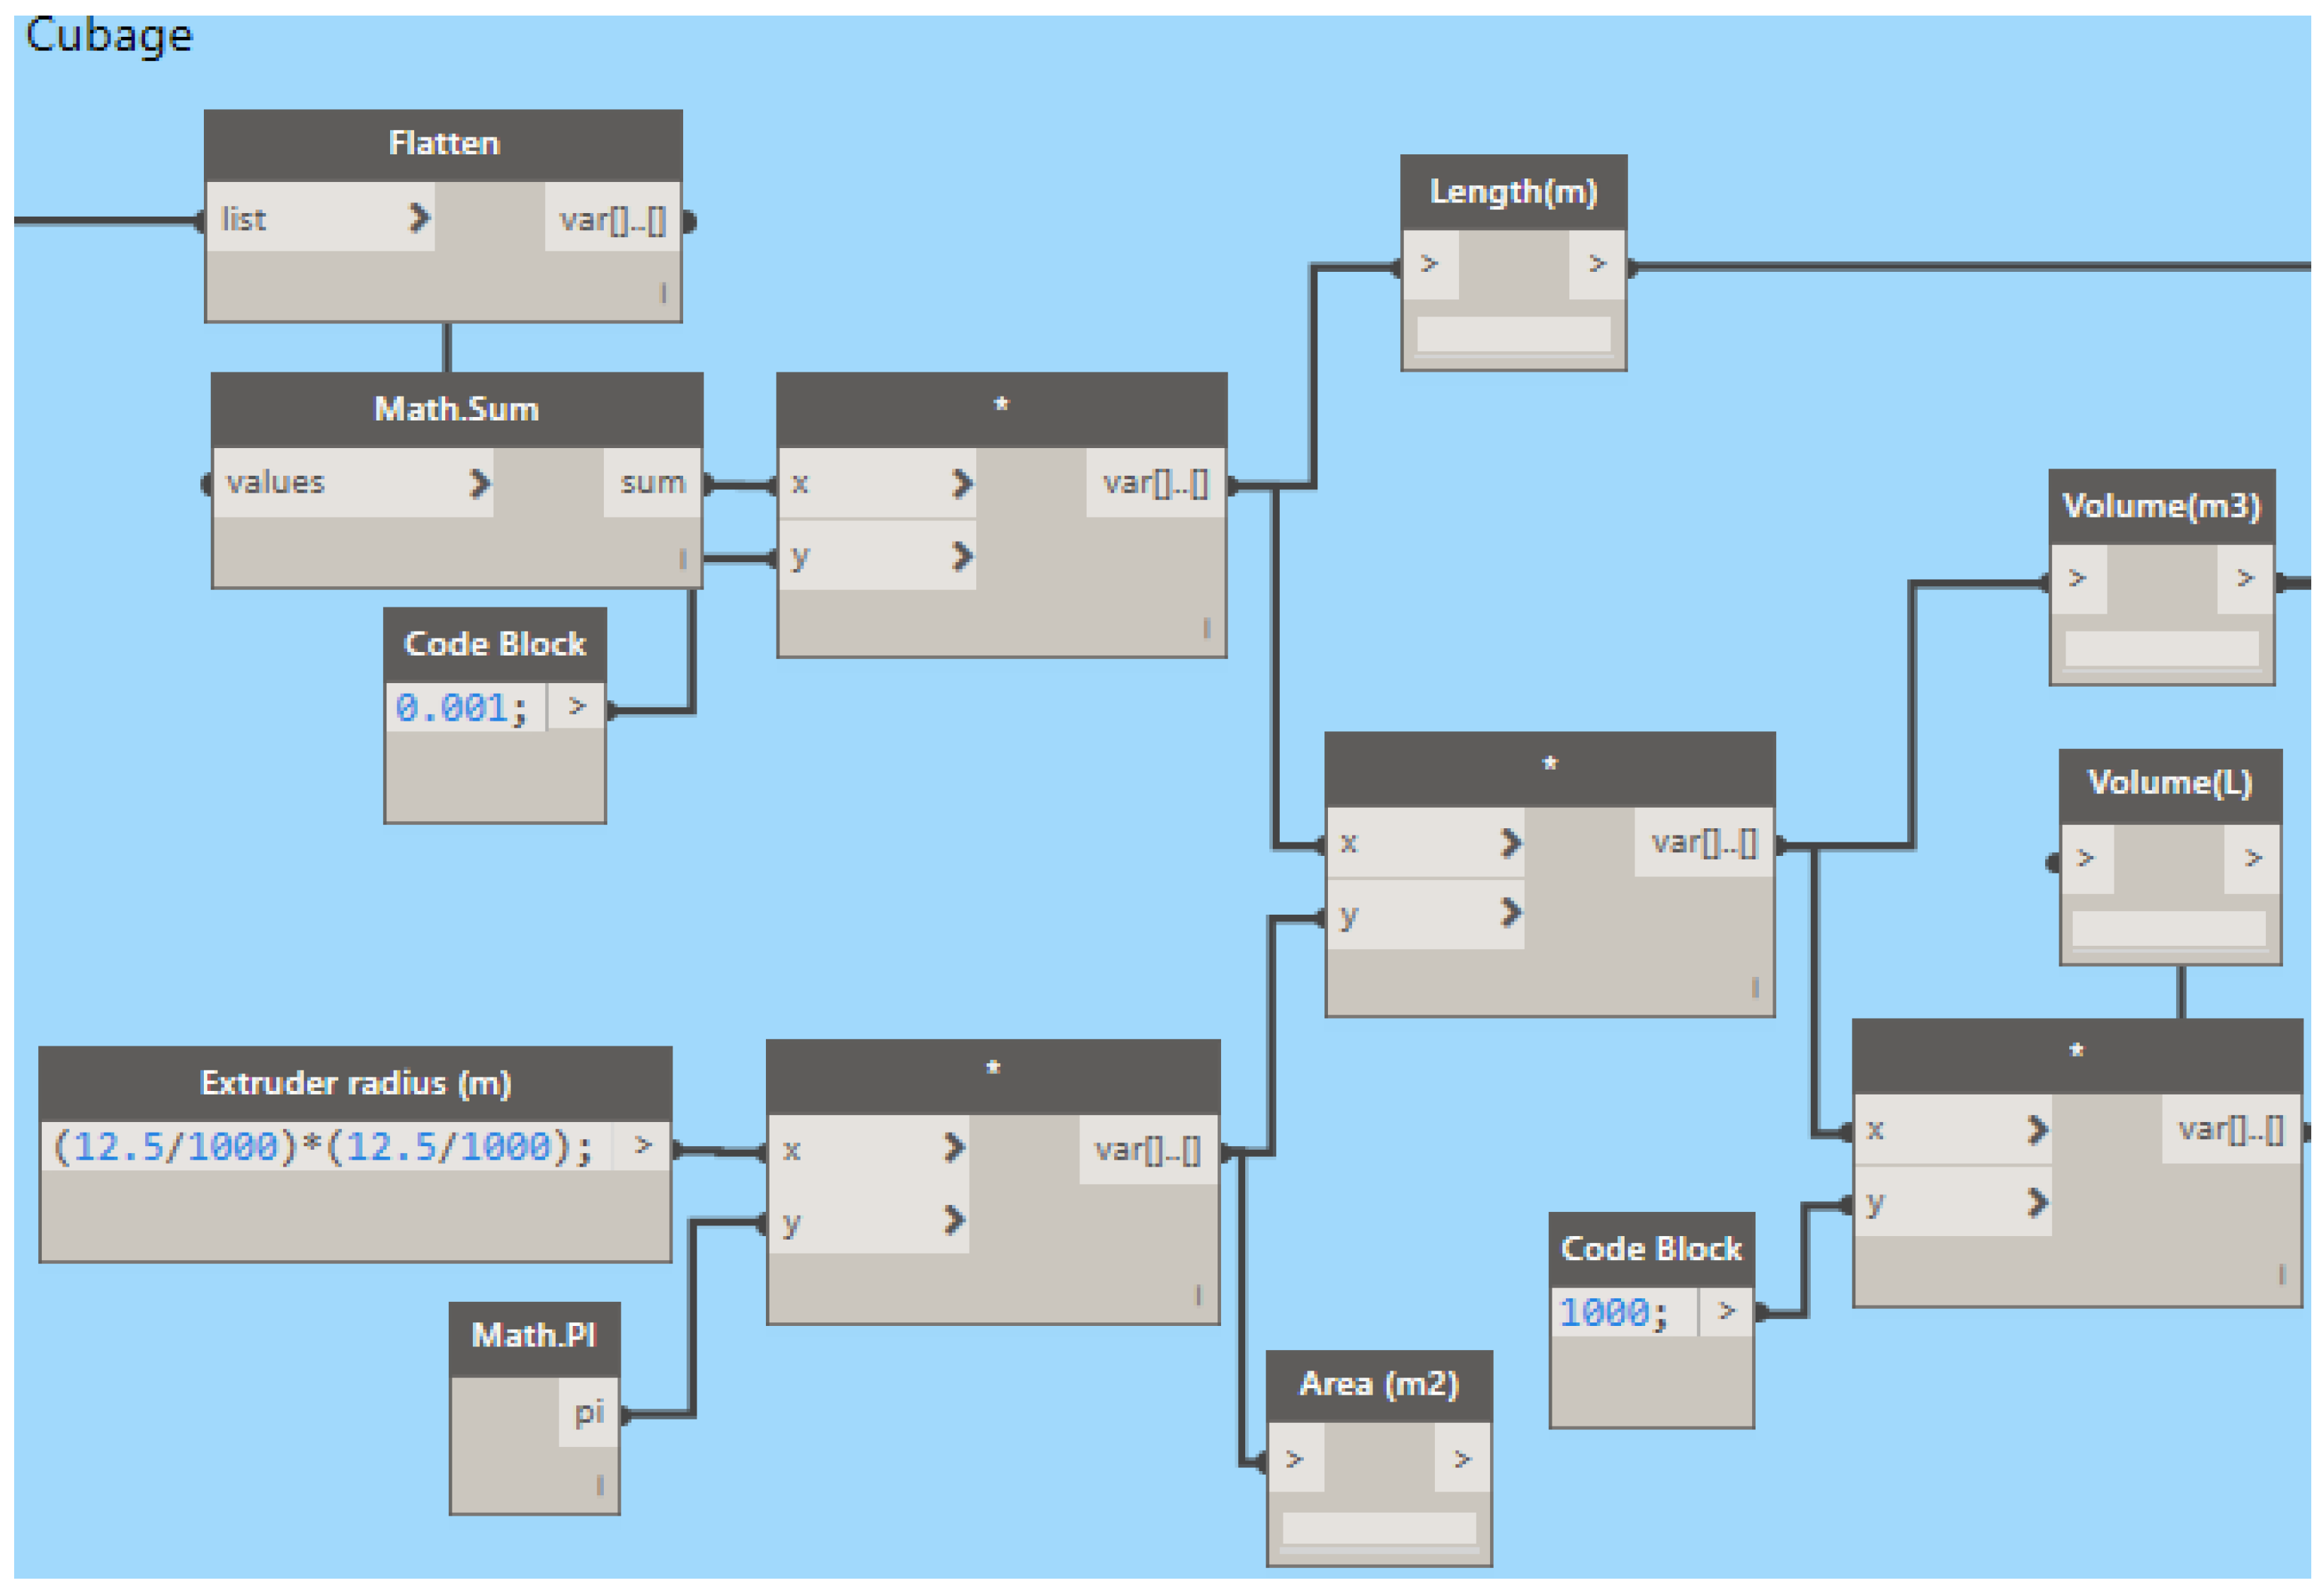
Once the surfaces of the construction element have been obtained with the “Surface.Perimeter” node (Figure A7), a sum of all these surfaces is applied, which gives the length of the perimeter cordon. With this value and the area of the extruder, it is possible to get the volume of material to be used for printing. Figure A12 shows this calculation process.
Figure A12.
Calculations of the printing material.

After obtaining the volume of the construction element to be printed, it is necessary to calculate the amount of material and the cost of the printed element. All of this information is exported to an Excel file where it can be better visualized. To create this file, the following procedure must be conducted:
First, an Excel file must be created and saved in the place that the user deems convenient.
Once the file has been created and saved, it is necessary to return to the code, specifically to the “File Path” node, and to select “Browse…” as shown in Figure A13.
Figure A13.
Exporting the calculation data to an Excel file.

After selecting “Browse”, a tab will open in which the previously created Excel file has to be searched and selected. When this is done, the file will be automatically opened with all the data of measurements, total cost, and the cost of each material required for the printing. In addition, DynamoTM allows importing the previously created Excel file into RevitTM, where all the data for printing the requested element can be visualized.
References
- Azhar, S. Building Information Modeling (BIM): Trends, Benefits, Risks, and Challenges for the AEC Industry. Leadersh. Manag. Eng. 2011, 11, 241–252. [Google Scholar] [CrossRef]
- Hardin, B.; McCool, D. BIM and Construction Management—Proven Tools, Methods, and Workflows; Wiley: Hoboken, NJ, USA, 2015; ISBN 9780874216561. [Google Scholar]
- Forcael, E.; Ferrari, I.; Opazo-Vega, A.; Pulido-Arcas, J.A. Construction 4.0: A Literature Review. Sustainability 2020, 12, 9755. [Google Scholar] [CrossRef]
- Nadal, A.; Mestras, J.P.; Carrasco, O.L. Perspectivas para la impresión 3D en la construcción. Rev. Eur. Investig. Arquit. REIA 2017, 7, 231–244. [Google Scholar]
- Malaeb, Z.; AlSakka, F.; Hamzeh, F. 3D Concrete Printing. In 3D Concrete Printing Technology; Sanjayan, J., Nazari, A., Nematollahi, B., Eds.; Elsevier: Amsterdam, The Netherlands, 2019; pp. 115–136. ISBN 978-0-12-815481-6. [Google Scholar]
- He, R.; Li, M.; Gan, V.J.L.; Ma, J. BIM-enabled computerized design and digital fabrication of industrialized buildings: A case study. J. Clean. Prod. 2021, 278, 123505. [Google Scholar] [CrossRef]
- Botero, L.; Alvarez, M. Guía de mejoramiento continuo para la productividad en la construcción de proyectos de vivienda (Lean Construction como estrategia de mejoramiento). Rev. Univ. EAFIT 2004, 40, 50–64. [Google Scholar]
- Bock, T. The future of construction automation: Technological disruption and the upcoming ubiquity of robotics. Autom. Constr. 2015, 59, 113–121. [Google Scholar] [CrossRef]
- Bruckmann, T.; Reichert, C.; Meik, M.; Lemmen, P.; Spengler, A.; Mattern, H.; König, M. Concept Studies of Automated Construction Using Cable-Driven Parallel Robots. In Cable-Driven Parallel Robots, Proceedings of the Cable-Driven Parallel Robots, Quebec, QC, Canada, 4 August 2017; Gosselin, C., Cardou, P., Bruckmann, T., Pott, A., Eds.; Springer International Publishing: Cham, Switzerland, 2018; pp. 364–375. [Google Scholar]
- Mesa Fernández, J.M.; Piquero Clambor, J.C.; Díaz Piloñeta, M.; Morán Palacios, H. Productive processes based on 3D printing versus conventional methodologies: A comparative analysis in the construction sector. DYNA 2020, 95, 299–304. [Google Scholar] [CrossRef]
- Aish, R.; Woodbury, R. Multi-level Interaction in Parametric Design. In Lecture Notes in Computer Science; Springer: Berlin/Heidelberg, Germany, 2005; pp. 151–162. [Google Scholar]
- Navarrete, S. Diseño paramétrico: El gran desafío del siglo XXI. Cuad. Cent. Estud. Diseño Comun. Ensayos 2014, 49, 63–72. [Google Scholar] [CrossRef]
- Eastman, C.; Teicholz, P.; Sacks, R.; Liston, K. BIM Handbook: A Guide to Building Information Modeling for Owners, Managers, Designers, Engineers, and Contractors, 2nd ed.; John Wiley & Sons, Inc.: Hoboken, NJ, USA, 2008; ISBN 9780470261309. [Google Scholar]
- Forcael, E.; Martínez-Rocamora, A.; Sepúlveda-Morales, J.; García-Alvarado, R.; Nope-Bernal, A.; Leighton, F. Behavior and Performance of BIM Users in a Collaborative Work Environment. Appl. Sci. 2020, 10, 2199. [Google Scholar] [CrossRef] [Green Version]
- Lancharro, L. BIM, la metodología de trabajo que nos acecha. Técnica Ind. 2015, 312, 68–71. [Google Scholar]
- Gómez, J. Análisis Comparativo Entre Metodologías de Presupuestación Tradicional Racional y Con Herramientas Tecnológicas Revit (BIM). Bachelor’s Thesis, Universidad Católica de Colombia, Bogotá, Columbia, 2016. [Google Scholar]
- Weller, C.; Kleer, R.; Piller, F.T. Economic implications of 3D printing: Market structure models in light of additive manufacturing revisited. Int. J. Prod. Econ. 2015, 164, 43–56. [Google Scholar] [CrossRef]
- López, J. Fabricación aditiva y transformación logística: La impresión 3D. OIKONOMICS Rev. Estud. Econ. Empres. 2018, 9, 58–69. [Google Scholar]
- Christoph, R.; Muñoz, R.; Hernández, Á. Manufactura Aditiva. Real. Reflexión 2017, 16, 97–109. [Google Scholar] [CrossRef] [Green Version]
- Campillo Mejías, M. Prefabricación en la arquitectura: Impresión 3D en hormigón. Bachelor’s Thesis, Universidad Politécnica de Madrid, Madrid, Spain, 2017. [Google Scholar]
- Torres Remón, R. Diseño de Hormigón para Impresión en 3D. Master’s Thesis, Universidad Politécnica de Valencia, Valencia, Spain, 2016. [Google Scholar]
- Bos, F.; Wolfs, R.; Ahmed, Z.; Salet, T. Additive manufacturing of concrete in construction: Potentials and challenges of 3D concrete printing. Virtual Phys. Prototyp. 2016, 11, 209–225. [Google Scholar] [CrossRef] [Green Version]
- Johnston, D.W. Design and Construction of Concrete Formwork. In Concrete Construction Engineering Handbook; Nawy, E.G., Ed.; CRC Press: Boca Raton, FL, USA, 2008; p. 50. ISBN 9781420007657. [Google Scholar]
- Perrot, A.; Rangeard, D.; Pierre, A. Structural built-up of cement-based materials used for 3D-printing extrusion techniques. Mater. Struct. Constr. 2016, 49, 1213–1220. [Google Scholar] [CrossRef]
- Le, T.T.; Austin, S.A.; Lim, S.; Buswell, R.A.; Gibb, A.G.F.; Thorpe, T. Mix design and fresh properties for high-performance printing concrete. Mater. Struct. 2012, 45, 1221–1232. [Google Scholar] [CrossRef] [Green Version]
- Lloret, E.; Shahab, A.R.; Linus, M.; Flatt, R.J.; Gramazio, F.; Kohler, M.; Langenberg, S. Complex concrete structures: Merging existing casting techniques with digital fabrication. Comput. Des. 2015, 60, 40–49. [Google Scholar] [CrossRef]
- Yin, X.; Liu, H.; Chen, Y.; Al-Hussein, M. Building information modelling for off-site construction: Review and future directions. Autom. Constr. 2019, 101, 72–91. [Google Scholar] [CrossRef]
- Teizer, J.; Blickle, A.; King, T.; Leitzbach, O.; Guenther, D.; Mattern, H.; König, M. BIM for 3D Printing in Construction. In Building Information Modeling; Springer International Publishing: Cham, Switzerland, 2018; pp. 421–446. ISBN 9783319928623. [Google Scholar]
- Wu, P.; Wang, J.; Wang, X. A critical review of the use of 3-D printing in the construction industry. Autom. Constr. 2016, 68, 21–31. [Google Scholar] [CrossRef] [Green Version]
- Sakin, M.; Kiroglu, Y.C. 3D Printing of Buildings: Construction of the Sustainable Houses of the Future by BIM. Energy Procedia 2017, 134, 702–711. [Google Scholar] [CrossRef]
- Monjaras, D. Uso de Dynamo para Revit en la Mejora de la Gestión de la Información y Modelado de un Hotel. Bachelor’s Thesis, Universidad Nacional de Ingeniería, Rímac, Peru, 2018. [Google Scholar]
- Shi, A.; Shirowzhan, S.M.E.; Sepasgozar, S.; Kaboli, A. 5D BIM Applications in Quantity Surveying: Dynamo and 3D Printing Technologies. In Smart Cities and Construction Technologies; Shirowzhan, S., Zhang, K., Eds.; IntechOpen: London, UK, 2020; pp. 139–156. ISBN 978-1-83880-199-1. [Google Scholar]
- Brell-Cokcan, S.; Braumann, J. A new parametric design tool for robot milling. In Proceedings of the 30th Annual Conference of the Association for Computer Aided Design in Architecture, ACADIA 2010, New York, NY, USA, 21–24 October 2012; Sprecher, A., Yeshayahu, S., Lorenzo-Eiroa, P., Eds.; ACADIA: New York, NY, USA, 2012; pp. 357–363. [Google Scholar]
- Braumann, J. KUKA Prc—Addon for Grasshopper 2019. Available online: https://www.food4rhino.com/en/app/kukaprc-parametric-robot-control-grasshopper (accessed on 28 June 2021).
- Weng, Y.; Mohamed, N.A.N.; Lee, B.J.S.; Gan, N.J.H.; Li, M.; Jen Tan, M.; Li, H.; Qian, S. Extracting BIM Information for Lattice Toolpath Planning in Digital Concrete Printing with Developed Dynamo Script: A Case Study. J. Comput. Civ. Eng. 2021, 35, 05021001. [Google Scholar] [CrossRef]
- Dzambazova, T.; Krygiel, E.; Demchark, G. Introducing REVIT Architecture 2010: BIM for Beginners; Wiley: Indianapolis, IN, USA, 2009; ISBN 978-0-470-47355-9. [Google Scholar]
- Ignatova, E.; Zotkin, S.; Zotkina, I. The extraction and processing of BIM data. IOP Conf. Ser. Mater. Sci. Eng. 2018, 365, 062033. [Google Scholar] [CrossRef] [Green Version]
- Huang, L. Revit Plugins for Electrical Engineering Improvements in Buildings: Lighting Power Density and Electrical Equipment Placement. Master’s Thesis, University of Southern California, Los Angeles, CA, USA, 2018. [Google Scholar]
- Reyes, J. Aplicación de la Robótica en la Construcción de Edificios: Estado del Arte. Bachelor’s Thesis, Universidad Industrial de Santander, Santander, Colombia, 2016. [Google Scholar]
- Ferreiro, N. Automatización y Robótica en Edificación. Master’s Thesis, Universidad de la Coruña, La Coruna, Spain, 2014. [Google Scholar]
- Davtalab, O.; Kazemian, A.; Khoshnevis, B. Perspectives on a BIM-integrated software platform for robotic construction through Contour Crafting. Autom. Constr. 2018, 89, 13–23. [Google Scholar] [CrossRef]
- KUKA Roboter GmbH. The History of KUKA|KUKA AG. Available online: https://www.kuka.com/en-de/about-kuka/history (accessed on 8 September 2020).
- KUKA Roboter GmbH. KR QUANTEC|KUKA AG. Available online: https://www.kuka.com/en-de/products/robot-systems/industrial-robots/kr-quantec (accessed on 8 September 2020).
- Hajian, H.; Becerik-Gerber, B. Scan to BIM: Factors Affecting Operational and Computational Errors and Productivity Loss. In Proceedings of the 27th International Symposium on Automation and Robotics in Construction, ISARC 2010, Bratislava, Slovakia, 26 June 2010; pp. 265–272. [Google Scholar]
Figure 1.
(a) Control unit; (b) KUKATM robot; (c) SmartPAD.

Figure 2.
Connection between the concrete pump and the printing robot.

Figure 3.
Exporting of the points cloud to CAD for BIM modeling.

Figure 4.
Communication RevitTM, DynamoTM, and KUKATM.

Figure 5.
Flowchart for the printing of a construction element. Design of a construction element in RevitTM, described in Section 4.1.1. Exporting a construction element from RevitTM to DynamoTM, described in Section 4.1.2. Control code of the printing process with the robotic arm, described in Section 4.1.3. Calculations and printing costs, described in Section 4.1.4.

Figure 6.
(a) Element created in RevitTM; (b) element printing trajectory.

Figure 7.
(a) Element created in RevitTM; (b) element printing trajectory.

Figure 8.
(a) Start of the printed sample, (b) succession of layers of the printed sample, and (c) other 3D concrete printed elements that were tested.
Figure 8.
(a) Start of the printed sample, (b) succession of layers of the printed sample, and (c) other 3D concrete printed elements that were tested.

Figure 9.
Controlled speed measurements and absolute error calculation.

Figure 10.
Boxplots with maximum speeds.


Table 1.
Results of the error associated with the measurement of speeds.
| Llim (m/s) | Typed Speed (m/s) | Average Experimental Speed (m/s) | Ulim (m/s) | e (%) | n (%) | Result |
|---|---|---|---|---|---|---|
| 0.0399 | 0.0400 | 0.0405 | 0.0411 | 1.4774 | 98.5226 | Condition fulfilled |
| 0.0598 | 0.0600 | 0.0602 | 0.0606 | 0.6757 | 99.3230 | Condition fulfilled |
| 0.0798 | 0.0800 | 0.0802 | 0.0806 | 0.4505 | 99.5495 | Condition fulfilled |
Table 2.
Results of the boxplot applied to different point spacing.
| Spacing 12.5 mm | Spacing 25 mm | Spacing 50 mm | |
|---|---|---|---|
| Q1 (m/s) | 0.1205 | 0.1603 | 0.3650 |
| Me (m/s) | 0.1211 | 0.1618 | 0.3676 |
| Q3 (m/s) | 0.1220 | 0.1627 | 0.3711 |
| Llim | 0.1183 | 0.1567 | 0.3559 |
| Ulim | 0.1243 | 0.1661 | 0.3759 |
| Atypical values | 0 | 2 | 1 |
Publisher’s Note: MDPI stays neutral with regard to jurisdictional claims in published maps and institutional affiliations. |
© 2021 by the authors. Licensee MDPI, Basel, Switzerland. This article is an open access article distributed under the terms and conditions of the Creative Commons Attribution (CC BY) license (https://creativecommons.org/licenses/by/4.0/).
Share and Cite
MDPI and ACS Style
Forcael, E.; Pérez, J.; Vásquez, Á.; García-Alvarado, R.; Orozco, F.; Sepúlveda, J. Development of Communication Protocols between BIM Elements and 3D Concrete Printing. Appl. Sci. 2021, 11, 7226. https://doi.org/10.3390/app11167226
AMA Style
Forcael E, Pérez J, Vásquez Á, García-Alvarado R, Orozco F, Sepúlveda J. Development of Communication Protocols between BIM Elements and 3D Concrete Printing. Applied Sciences. 2021; 11(16):7226. https://doi.org/10.3390/app11167226
Chicago/Turabian StyleForcael, Eric, Javier Pérez, Álvaro Vásquez, Rodrigo García-Alvarado, Francisco Orozco, and Javier Sepúlveda. 2021. "Development of Communication Protocols between BIM Elements and 3D Concrete Printing" Applied Sciences 11, no. 16: 7226. https://doi.org/10.3390/app11167226
Note that from the first issue of 2016, this journal uses article numbers instead of page numbers. See further details here.