


Between 1980 and 2013, worldwide prevalence of overweight and obesity rose by 47·1 % in children (<18 years)( Reference Ng, Fleming and Robinson 1 ). In Brazil, data from the 2008–2009 Household Budget Survey reported that one in three children aged 5–9 years was above the weight-for-age recommended by the WHO( 2 ). Creating initiatives to understand and mitigate obesity has been considered one of the major challenges of the 21st century and childhood obesity prevention has become a global priority( 3 ).
Several studies have demonstrated that both dietary behaviours and the development of obesity and chronic diseases are related to a range of complex social and environmental influences that extend beyond the notion of individual choices( Reference Penney, Almiron-Roig and Shearer 4 – Reference de Carvalho Cremm, Marrocos Leite and de Abreu 11 ). The food environment can refer to macro- or community-level environments, such as the type, density, location and proximity to food outlets (e.g. food stores and restaurants) as well as other sources of food (e.g. home, schools, worksites), and micro- or consumer-level environments, which include in-store availability of healthy and unhealthy options, price, quality and promotions( Reference Glanz, Sallis and Saelens 12 ). Food behaviours can also be mediated by psychosocial, demographic and perceived environment variables( Reference Glanz, Sallis and Saelens 12 , Reference Glanz, Sallis and Saelens 13 ). Thus, socioecological and systems-oriented frameworks have been increasingly used to explore the interactions between individual and food environment variables and to identify promising intervention strategies( Reference Story, Kaphingst and Robinson-O’Brien 14 – Reference Huang, Drewnosksi and Kumanyika 16 ).
In the case of Brazil and some high-income countries, community food environments commonly frequented by children and their caregivers, such as supermarkets, restaurants, schools, or recreation and sports settings, are replete with highly processed energy-dense and nutrient-poor food items that oppose recommendations presented by nutritional guidelines( Reference Penney, Almiron-Roig and Shearer 4 , Reference Naylor, Bridgewater and Purcell 17 – Reference Poti, Slining and Popkin 19 ). A study that evaluated the surrounding areas of three public schools in a Brazilian urban area found a high concentration of ultra-processed food products (UPP) in the food stores that were located closer to these institutions, demonstrating that children experienced greater exposure to UPP before and after school( Reference Leite, Oliveira and Cremm 20 ).
UPP dominate the food supplies of higher-income countries and UPP consumption is expanding rapidly in developing countries( Reference Monteiro, Moubarac and Cannon 21 , Reference Stuckler, McKee and Ebrahim 22 ). National food expenditure surveys conducted in the UK and Canada showed that 63·4 and 61·7 % of dietary energy, respectively, came from ready-to-consume products (RCP)( Reference Moubarac, Claro and Baraldi 23 , Reference Moubarac, Martins and Claro 24 ). In Brazil, a developing country, the contribution of RCP to dietary energy has also risen steadily, from 20·3 to 32·1 % in households located in metropolitan areas in the last three decades( Reference Martins, Levy and Claro 25 ).
Processed and ultra-processed food products are problematic not only because they are high in energy, fat, sugar and sodium, but also because they are designed to be palatable, convenient and inexpensive to encourage purchase and subsequent overconsumption( Reference Monteiro, Levy and Claro 26 , Reference Ifland, Preuss and Marcus 27 ). Several studies have demonstrated positive associations between the consumption of UPP and weight gain and chronic diseases in a range of age groups( Reference Rauber, Campagnolo and Hoffman 28 – Reference Moreira, Baraldi and Moubarac 31 ). Another harmful effect especially for children is the displacement of the consumption of unprocessed/minimally processed foods (UF-MPF) and meals by these products and snacks, leading to a shift away from traditional dietary patterns and foodways based on meals prepared and shared with family and others( Reference Monteiro, Moubarac and Cannon 21 , 32 ).
In high-income countries, both the existence of different types of food store and the higher availability of unhealthy foods close to children’s homes and schools are associated with poor eating habits and obesity( Reference Jennings, Welch and Jones 33 – Reference Oreskovic, Kuhlthau and Romm 37 ). In Brazil, less is known about the association between the food environment, including availability of RCP, and the food consumption of children. Therefore, the present study investigated the associations between the neighbourhood availability of RCP and UF-MPF in food stores and the consumption of these food items by children residing in the city of Santos. The main hypothesis tested was whether higher availability of RCP and UF-MPF in food stores would result in significantly greater consumption of these items by children living within 500 m from respective food stores. The secondary research question sought to determine if higher availability of RCP was associated with a decreased consumption of UF-MPF. To our knowledge, no prior study has examined associations between the availability of RCP and children’s consumption of these foods in Brazil.
Methods
Study design and setting
The Nutritional Environment Assessment in the City of Santos, Brazil (AMBNUT) was a cross-sectional study conducted from January 2010 to June 2011 to evaluate environmental influences on dietary intake and nutritional status of children under 10 years old and their mothers. The city of Santos has a total area of 280·7 km2, with 419 400 inhabitants concentrated in 39·4 km2 of urban area and a poverty incidence of 4·54 %( 38 ). It is located near the metropolitan region of Sao Paulo, the largest Brazilian city, and it has the biggest seaport in Latin America. The study was approved by the Ethics and Research Committee of the Federal University of Sao Paulo (protocol number CEP 0275/09 and 0276/09).
Sampling
The AMBNUT research team collected data on 539 children under 10 years of age. Food consumption data were incomplete for eleven children and fifteen children were exclusively breast-fed. Therefore, twenty-six children were dropped from the study, leaving a final sample of 513 children (292 aged <6 years, 221 aged ≥6 years). This total exceeds the number obtained in the sample size calculation determined a priori (n 206) for a different study hypothesis that was part of the AMBNUT research, regarding prevalence of nutrient inadequacy in the target population (children under 10 years), estimated at 44 %( Reference Fidelis and Osório 39 , Reference Bernardi, Cezaro and Fisberg 40 ), with a margin of error of 5 %, a confidence interval of 95 % and a subject loss of 10 %.
Households were recruited by stratified random sampling of thirty-five census tracts (out of 564 census tracts) designed to be proportional to the administrative areas of the urban territory (10 % downtown, 20 % northwest and 60 % seafront). After the selection of census tracts, sectors were enrolled for the identification of eligible households. Children were eligible for the study if they: (i) were under 10 years old; (ii) were a resident of the household; and (iii) did not have any medical conditions that would affect food intake and nutritional status. According to the sampling design initially planned, twenty eligible households were to be randomly chosen from each census tract. However, since the inclusion and exclusion criteria greatly limited this number, all children identified in a given tract, and whose mothers agreed to participate in the study, were assessed from January 2010 to June 2011, until twenty interviews were obtained. Three attempts were made at every household to conduct an interview. If there was more than one eligible child in the household, a simple random selection was performed to determine which child would be included. After the identification of eligible households, mothers and their children were asked to participate in the study, and interviews were conducted after signing the consent form. The response rate was 70·3 % when considering the interviews done at the eligible households and an average of sixteen mother–child interviews were conducted per census tract. The loss rate was similarly distributed throughout Santos city and did not cause an impact on the present study’s results.
The environment sample consisted of all food stores located in 97 % of the urban area of the city of Santos (n 672), except those only open during the night. The recruitment of food stores occurred simultaneously to the recruitment of households from January 2010 to June 2011 by different pairs of trained data collectors. Food stores were defined as establishments where people buy food and prepare or consume it elsewhere, such as grocery stores or supermarkets, convenience stores, farmers’ markets, produce markets, bakeries, butcheries, candy stores and street food stands( Reference Glanz, Sallis and Saelens 13 ). The establishments were assessed only after authorization by the respective storeowners, and their recruitment involved explanation of the purpose of the study and distribution of recruitment materials explaining frequently asked questions and answers. A total of twenty-one storeowners (3·1 %) refused to participate in the study. All places opened to the public where people were able to sit and eat, such as sit-down and fast-food restaurants, were excluded from the sample.
Data collection
Individual-level measures
The questionnaire used for the present study has been described previously elsewhere( Reference de Carvalho Cremm, Marrocos Leite and de Abreu 11 ) and was used to collect information on household demographic and socio-economic factors, children’s height/weight and food intake via 24 h recalls. Interviews typically lasted 100 min and were conducted by trained data collectors.
The 24 h recall (via caregiver proxy) was administered twice and spaced 15 to 90 d apart, in order to account for within-person variation( Reference Dodd, Guenther and Freedman 41 ). The method used to account for this variation was described previously by Slater et al.( Reference Slater, Marchioni and Fisberg 42 ). Other methodological procedures applied in order to reduce the variation given by the measurement error of the instrument utilized were: (i) three pairs of data collectors were selected and trained on the correct use of the instrument, and at least one member of the pair was a dietitian; (ii) an adapted version of the multiple-pass method was used in data collection( Reference Conway, Ingwersen and Vinyard 43 , Reference Conway, Ingwersen and Moshfegh 44 ); and (iii) standard utensils, a photograph album containing pictures of commonly consumed foods and drinks( Reference Lopes and Botelho 45 ), and food models were used to help respondents with portion size estimates. For children who were enrolled in either public or private schools and whose caregiver reported the consumption of meals/foods offered by these institutions, menus and recipes were obtained via email and/or telephone calls. To standardize the portion sizes of consumed foods, two references were used: (i) the handbook of recipes and home measures for nutritional surveys calculation, 2002( Reference Fisberg and Slater 46 ); and (ii) the table for the evaluation of food intake in household measures, 5th edition, 2004( Reference Pinheiro 47 ).
The degree of industrial processing of the foods consumed by the study sample was assessed using the food classification system proposed by Monteiro et al.( Reference Monteiro, Levy and Claro 48 ) and incorporated in the new dietary guidelines for the Brazilian population( 49 ). The ‘NOVA Classification System’( Reference Moubarac, Parra and Cannon 50 ) classifies foods into three groups based on the nature, extent and purpose of food processing: Group 1 comprising unprocessed foods and minimally processed foods (UF-MPF); Group 2 comprising processed culinary ingredients to be combined with foods to make meals and dishes (PCI); and Group 3 comprising ready-to-consume products (RCP), which can be either processed or ultra-processed.
In the current study, all foods that were recorded in the two 24 h recalls were classified according to the above criteria (Table 1) and the total amount (grams) consumed from each of the groups was calculated. All foods used in culinary preparations were recorded to obtain the amount of each ingredient (grams) and the proportions of UF-MPF, PCI and RCP were calculated.
Table 1 Food and beverage classification based on the degree of industrial processing. Santos, Brazil, 2010
Neighbourhood-level measures
An adapted and validated instrument based on the Nutritional Environment Measurement Survey instrument for stores (NEMS-S) was used by trained data collectors to evaluate the food environment( Reference Glanz, Sallis and Saelens 13 ). This instrument captures information on food availability, quality and price of food purchases in the context of Brazil, a developing country( Reference Martins, Cremm and Leite 51 ).
Food store assessments included 5 min interviews with managers to collect information about their store’s functioning and the main products sold, and a record of the availability of the thirty-three food groups listed in the instrument, determined by observing the food items on the shelves. Availability was recorded in a checkbox corresponding to each food item.
The establishments were classified into ten different categories, according to the purpose of their retail: (i) butcher/poultry shop/fishery; (ii) fresh pasta store; (iii) small full-service store/delicatessen; (iv) bakery; (v) street food stand; (vi) grocery store or supermarket; (vii) convenience store; (viii) produce store; (ix) farmer’s market/fresh food stall; and (x) candy store. In the current study, the term ‘grocery stores’ was used when referring to ‘mercados’, which are very similar to supermarkets, but smaller (small/medium size). These types of establishment are more common in Brazil than large supermarkets and hypermarkets( Reference Fonseca 52 , Reference Ghisi, Silveira and Kristensen 53 ).
The availability of foods by degree of industrial processing in food stores was evaluated by using the same classification described in Table 1. Food stores were further categorized as Higher % RCP (percentage of RCP higher than percentage of UF-MPF and PCI) or Higher % UF-MPF (percentage of UF-MPF and PCI higher than percentage of RCP). For this classification we grouped PCI with UF-MPF, since only one type of establishment offered PCI in a higher amount than the other groups. This decision was also based on the new dietary guidelines for the Brazilian population which consider that, when combined with natural or minimally processed foods and used in small amounts, PCI enable the creation of varied and nutritious prepared dishes and meals( 49 ).
Spatial data
Geographic coordinates (latitude and longitude) of all the households and food stores were collected using a portable GPS (Global Positioning System; Garmin model eTrex), positioned at a distance of 1 m from the main entrance of each store, and entered into a Geographic Information System (GIS).
The environment variables used in the study were calculated from the GIS by using the overlay procedure. A layer of buffers with a radius of 500 m, which were calculated from each census tract centroid, was created. After the superposition of this layer with another layer containing store-level data, the average values of the measurements that evaluated the availability of foods were calculated to each buffer, providing the information of every census tract neighbourhood. The decision of delineating the neighbourhood as the area within a 500 m radius buffer was made based on previous studies that have evaluated parents’ perception of a safe walking distance for children( Reference Timperio, Ball and Roberts 54 ); and the associations between the food environment and children’s food consumption( Reference Jennings, Welch and Jones 33 , Reference Skidmore, Welch and van Sluijs 55 ). The spatial analyses were performed in both TerraView (version 3.3.1; INPE) and ArcMap (version 9.3.1; ESRI) programs.
Covariates
Individual-level variables such as gender, age and socio-economic status (SES; mean years of mother’s education level), and neighbourhood-level SES, were used as potential covariates in the present study. Neighbourhood-level SES was obtained from the mean years of household head’s education level in all census tracts that fell within a 500 m radius buffer zone from the sampled census tract centroid by using GIS. The selection of the covariates was based on both the association of SES (e.g. education) with consumption of highly processed foods( Reference Lioret, Betoko and Forhan 56 – Reference de Aquino and Phillippi 58 ) and their inclusion in other research that evaluated the food environment and youth( Reference Laxer and Janssen 59 – Reference Wang and Shi 62 ).
Data analyses
Descriptive analyses were used to describe both individual and neighbourhood characteristics of the study sample. Multilevel random-effect models were carried out to evaluate the relationship between the availability of RCP in food stores surrounding households and the likelihood of children increasing RCP consumption and decreasing UF-MPF consumption.
Initially, descriptive and univariate analyses were performed in order to investigate the distribution of the outcome and both food environment variables and covariates. The outcome variables used in the models were proportion (%) of RCP consumption and proportion (%) of UF-MPF consumption. Food availability was evaluated using six different variables: proportion of food stores classified as Higher % RCP and proportion of food stores classified as Higher % UF-MPF; average number (n) of items classified as RCP and UF-MPF in the food stores (in the buffers); and percentage (%) of items classified as RCP and UF-MPF in the food stores (in the buffers). Then, the modelling procedure was carried out through a series of stages. A null model was first used to determine the intra-class correlation coefficient, which provides an estimation of the proportion of variation in the study outcomes due to differences between buffers. Second, bivariate models between the outcomes and each covariate were examined. Finally, the multivariate model-building process began with the introduction of the covariates and the environment variables. Three different multivariate models for each outcome variable were tested by using the main environment variables identified in the bivariate models. A likelihood ratio test comparing the deviances of the models and a significance level of P≤0·05 were used. All analyses were performed using the statistical software package SPSS version 16.0 and MlWin 2.22 (Centre for Multilevel Modelling, University of Bristol, UK).
Results
Description of the study sample
Individual and neighbourhood-level characteristics of the study sample are presented in Table 2. Most of the participants were <6 years of age, male and normal weight, although a high percentage of excess weight (BMI-for-age Z-score >1) was observed (37·3 %). The average proportion of UF-MPF and PCI consumed was higher than the proportion of RCP, although a relevant contribution of RCP to children’s consumption was observed. Most mothers had studied beyond primary school (82·7 %) and the average length of education for all census tracts in the city was 8·8 years.
Table 2 Individual- and neighbourhood-level characteristics of urban children in Santos, Brazil, 2010 (n 513)
BMIZ, BMI-for-age Z-score; SES, socio-economic status; CT, census tract; RCP, ready-to-consume products; PCI, processed culinary ingredients; UF-MPF, unprocessed/minimally processed foods.
* n 509 (four missing-values).
Food store categories and classifications are described in Table 3. Farmers’ markets/fresh food stalls, bakeries and grocery stores/supermarkets were the most common types of food store available in Santos. Only produce stores, farmers’ markets/fresh food stalls and butchers/poultry shops/fisheries had higher UF-MPF availability compared with the other food sources (Fig. 1); therefore, 60·6 % of food sources were classified as Higher % RCP. The food stores that had the highest proportion of RCP were bakeries, grocery stores/supermarkets, candy stores, convenience stores and street food stands (Table 3).
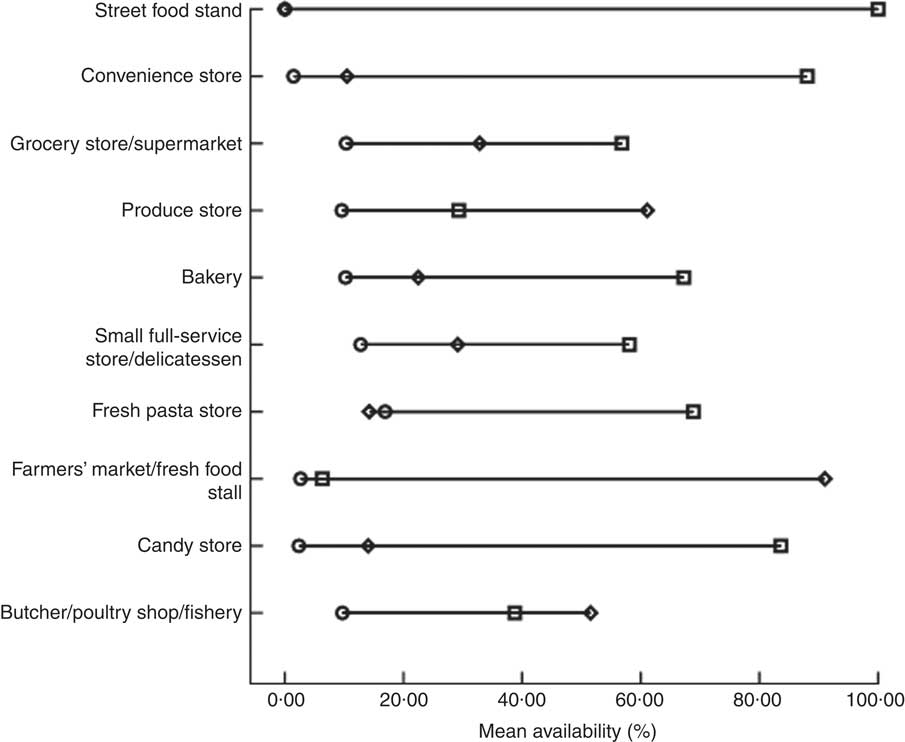
Fig. 1 Availability of foods with different degrees of industrial processing (![]() , unprocessed/minimally processed foods;
, unprocessed/minimally processed foods; ![]() , processed culinary ingredients;
, processed culinary ingredients; ![]() , ready-to-consume products) according to category of food store. Santos, Brazil, 2010.
, ready-to-consume products) according to category of food store. Santos, Brazil, 2010.
Table 3 Food store categories and classification based on the degree of industrial processing of foods available (n 672). Santos, Brazil, 2010
RCP, ready-to-consume products; UF-MPF, unprocessed/minimally processed foods; PCI, processed culinary ingredients.
Associations between the food environment and children’s food consumption
Results of multilevel regression models, which tested associations between food environment variables and outcomes (consumption of RCP and UF-MPF), are presented in Tables 4 and 5. Higher consumption of RCP was positively associated with the proportion of food stores classified as Higher % RCP in the buffer (model 4), and both the number (model 5) and proportion (model 6) of items classified as RCP within the food stores. The intra-class correlation coefficient values of the models ranged between 0·01 and 0·02, indicating that only a small part of the variability in the data can be explained by the grouping analysis; in this case, the census tracts (Table 4).
Table 4 Associations between neighbourhood environment measures and children’s consumption of ready-to-consume products using multilevel linear regression models (n 513). Santos, Brazil, 2010
Ref., reference category; CT, census tract; RCP, ready-to-consume products; ICC, intra-class correlation coefficient.
Model 1, null; model 2, individual-level variables (age, gender and mother’s education level); model 3, socio-economic status at the neighbourhood level (mean years of household head’s education level – all CT); model 4, first food environment variable (proportion of Higher % RCP food stores); model 5, second food environment variable (average number of items classified as RCP in the food stores); model 6, third food environment variable (proportion of items classified as RCP in the food stores).
*P<0·05, **P<0·01, ***P<0·001.
Table 5 Associations between neighbourhood environment measures and children’s consumption of unprocessed/minimally processed foods using multilevel linear regression models (n 513). Santos, Brazil, 2010
Ref., reference category; CT, census tract; RCP, ready-to-consume products; ICC, intra-class correlation coefficient.
Model 1, null; model 2, individual-level variables (age, gender and mother’s education level); model 3, socio-economic status at the neighbourhood level (mean years of household head’s education level – all CT); model 4, first food environment variable (proportion of Higher % RCP food stores); model 5, second food environment variable (average number of items classified as RCP in the food stores); model 6, third food environment variable (proportion of items classified as RCP in the food stores).
*P<0·05, **P<0·01, ***P<0·001.
No association was found between the availability of UF-MPF in food stores and the proportion of consumption of these foods by the children, after adjustment for individual variables (data not shown). However, a 10 % increase in the proportion of food stores classified as Higher % RCP in the neighbourhood (model 4), a 10-unit increase in the average number of items classified as RCP available in the food stores (model 5) and a 10 % increase in the proportion of RCP available in the establishments (model 6) were associated with a reduction of 1·1, 8·4 and 1·7 %, respectively, in the consumption of UF-MPF by children surveyed. In these models, neighbourhood-level SES was positively associated with the proportion of UF-MPF consumed. After inserting all variables in the models, the intra-class correlation coefficient values were 0·01 or lower (Table 5).
Discussion
The current study investigated the association between the food store environment and the consumption of foods with different degrees of industrial processing by children living in an urban setting in Brazil. Although studies have evaluated the relationship between healthy and unhealthy food availability and food consumption in high-income countries, little information regarding this relationship is available for low- and middle-income countries( Reference Jennings, Welch and Jones 33 , Reference Skidmore, Welch and van Sluijs 55 , Reference Van Hulst, Barnett and Gauvin 63 ). The present study fills gaps in the literature not only because it was conducted in a middle-income country, but also because it is the first that examines the relationship between the food environment and food consumption by using a classification of foods based on the nature, extent and purpose of their industrial processing. This criterion was chosen since it is suggested that modern nutrition science focused on the identification and isolation of nutrients is not able to totally explain the relationship between diet and health( Reference Monteiro, Levy and Claro 26 , Reference Monteiro, Levy and Claro 48 , 49 ). Additionally, consideration of the degree of industrial processing of foods may help to identify existing constraints in agriculture and food systems, and to generate evidence to promote nutrition-friendly food environments( 64 , Reference Hawkes, Smith and Jewell 65 ). The proportion of consumption of RCP found in this sample is similar to results presented in previous studies conducted in Brazil( Reference Martins, Levy and Claro 25 , Reference Louzada, Martins and Canella 66 ) and supports research that has demonstrated a rapid increase in the consumption of processed and ultra-processed food products in low- and middle-income countries( Reference Monteiro, Moubarac and Cannon 21 , Reference Stuckler, McKee and Ebrahim 22 , Reference Asfaw 67 ).
Higher availability of RCP in surrounding neighbourhoods was associated with both an increase in consumption of these foods and also a decrease in healthier food consumption (UF-MPF) among children. Additionally, the current study found that the proportion of RCP food sources and the number/proportion of RCP within those sources are significant predictors of RCP consumption. The association between RCP availability in food stores and their consumption by children is consistent with prior studies conducted in the UK( Reference Jennings, Welch and Jones 33 , Reference Skidmore, Welch and van Sluijs 55 ) and Canada( Reference Pabayo, Spence and Cutumisu 35 ) that have demonstrated associations between the availability of unhealthy types of food stores in the neighbourhood where children live and the consumption of highly processed foods, such as soft drinks, non-carbonated ‘fruit’ drinks, sweets, chocolates and crisps. Also, the negative association between proximity of fast-food and convenience stores and fruit and vegetable intake by children was previously observed in Australia( Reference Timperio, Ball and Roberts 60 ) and supports the hypothesis that exposure to a built environment that offers a variety of energy-dense and processed foods can discourage the consumption of healthy foods among this age group. The relationship between food environments and obesity in higher-income countries may serve to predict trends in developing countries, whose processed and ultra-processed food product sales have increased in recent years. Recent research demonstrated that while sales growth of RCP began to decline in North America and Western Europe in 2012, it increased by 114·9 % throughout Asia and the Pacific and by 50 % in Latin America( 32 ) during the same period. Taking into account these trends and our results, interventions should focus on decreasing the availability of unhealthier food sources and on reducing the proportion of RCP within those sources as a means to improving diet among children not only in Santos, but also other Brazilian urban areas.
Parental education level, a proxy of SES, was positively associated with UF-MPF consumption. Previous studies demonstrated that both the availability of healthier foods in the home and the consumption of healthier options, such as fruits and vegetables, were strongly associated with both individual- and household-level income and educational level( Reference Ding, Sallis and Norman 68 – Reference Lucan, Hillier and Schechter 70 ).
UF-MPF neighbourhood availability was not associated with consumption of UF-MPF. Contrary to our results, research conducted with adults in the city of Sao Paulo found that living close to stores and/or markets where fruits and vegetables were available was associated with higher prevalence of regular consumption of these foods, regardless of their price or quality( Reference Duran, de Almeida and Latorre 71 ). However, it is important to emphasize that our study has not evaluated the association between the availability and consumption of fruits and vegetables, but of all food items classified as UF-MPF, such as pulses, nuts and seeds, unprocessed meats, milk, etc.; which could explain part of the differences among these results. Additionally, taste preferences for fast foods could influence the selection of unhealthy foods within an environment where food outlets offering energy-dense food items are located close to children’s homes( Reference Shepherd, Harden and Rees 72 ). Although there are many variables within the family setting that can influence children’s eating behaviour, such as foods made available to children, parents’ eating behaviours and child feeding strategies utilized, some studies demonstrate that children can also affect their parents’ grocery purchases, through asking nicely, negotiating and begging( Reference Huang, Reisch and Gwozdz 73 ). These practices have been associated with advertisements, including packaging, characters and commercials( Reference McDermott, O’Sullivan and Stead 74 , Reference Henry and Borzekowski 75 ); and with the purchase of unhealthy items such as sweets, snack foods and cereals( Reference Ogba and Johnson 76 ).
Our findings indicate that interventions aimed at only increasing healthier options in the neighbourhood food environment will not necessarily guarantee their purchase and consumption, especially among lower-income groups. Other important predictors of food consumption, such as price and convenience of healthier foods, should be addressed( Reference Glanz, Basil and Maibach 77 ). For example, increasing the availability of healthy foods will have limited impact on consumption if the foods within these environments are not affordable. Additionally, prior research conducted with the mothers and caregivers of the children investigated in the current study demonstrated that the acquisition of minimally processed foods was associated with perceived availability and variety of fresh produce in the neighbourhood( Reference Vedovato, Trude and Kharmats 78 ). Interventions must consider possible barriers to healthier food consumption among lower-income subgroups, including affordability, cultural acceptability, convenience (e.g. time to prepare foods, etc.) and perceptions on cost, availability and quality, in order to reduce health disparity and inequity gaps( Reference Budd, Cuccia and Jeffries 79 , Reference Drewnowski and Specter 80 ). Also, interventions in the school food environment (which include when and where children obtain foods and the types of options available during the school day), through making UF-MPF more available and banning the sales of RCP, should also be considered as an important driver to promote healthier consumption patterns among children( Reference Welker, Lott and Story 81 ).
Although the existence of supermarkets in the neighbourhood has been positively associated with fruit and vegetable availability and consumption in high- and middle-income countries( Reference Vedovato, Trude and Kharmats 78 , Reference Moore, Diez Roux and Nettleton 82 – Reference Duran, Diez Roux and Latorre Mdo 85 ), the contribution that these food stores make to the availability of RCP cannot be ignored. The rapid increase and dominance of supermarkets throughout developed areas of Latin America, Africa and Asia in the last few decades has contributed, at least in part, to the increased availability of processed food products at low cost( Reference Monteiro, Moubarac and Cannon 21 , Reference Gehlhar and Regmi 86 – Reference Reardon, Timmer and Berdegue 88 ) and the subsequent shift in consumption from staple and unprocessed foods to energy-dense and ultra-processed foods( Reference Monteiro, Moubarac and Cannon 21 , Reference Monteiro, Levy and Claro 26 , Reference Popkin 89 ). Interventions should focus on increasing the proportion of healthier foods compared with unhealthier foods within supermarkets to facilitate healthier food consumption patterns( Reference Surkan, Tabrizi and Lee 90 , Reference Gittelsohn, Vijayadeva and Davison 91 ).
The present study has several strengths. Both environmental and individual data were collected simultaneously, by using standardized techniques, intensively trained interviewers and previously validated instruments. The types of food stores and the availability of foods were investigated through direct observations, which increased the validity of the neighbourhood environmental measures. Although previous studies evaluated both community and consumer food environment in Brazil( Reference Duran, de Almeida and Latorre 71 , Reference Duran, Diez Roux and Latorre Mdo 85 ), ours is the first to use a classification of the foods available in the food environment and consumed by children based on the extent and purpose of their industrial processing.
The study also has a few limitations. First, a cross-sectional design was used, limiting causal inferences. As mentioned by Hammond and Dubé( Reference Hammond and Dubé 92 ), the drivers of food and nutrition security are complex, multilevel, multisectoral and heterogeneous, and are a particular challenge for scientific study. In order to accelerate progress in this field, effective theories and methods to model the existent complexities, such as integrative longitudinal databases on specific processes and outcomes of agri-food, health and environmental systems, need to be developed, tested and used( Reference Hammond and Dubé 92 , Reference Castellani, Rajaram and Buckwalter 93 ). Second, the neighbourhood food environment measure included only those food stores within the households’ surrounding area, by using buffers as administrative boundaries. This method may limit the true representation of the environments to which individuals are exposed by not taking into account their mobility( Reference Perchoux, Chaix and Cummins 94 ). However, previous investigation with the mothers of our participants revealed an association between the purchase of minimally processed foods and the frequency of walking to food sources from their home( Reference Vedovato, Trude and Kharmats 78 ). Third, we were not able to take into account information regarding the household nutrition environment and other potential covariates related to children’s eating behaviours. Future studies should examine the relationships between environmental factors and other influences on children’s minimally processed foods consumption, such as individual preferences, parental influences and availability within home. Fourth, at the time of the study’s data collection and analysis, the instrument that captures food availability in restaurants had not yet been validated. As a result, only food stores located in the surrounding areas of children’s homes were evaluated, although they represent just one part of the whole food environment. Finally, the multilevel models were not adjusted to school kind, since this information was not assessed. Public schools have a school standardized food programme, which is different from the coffee shops and cafeterias available in the majority of private schools in Brazil. However, the differences among the school meals/food items available in these institutions were taken into account when analysing the food consumption of children.
The results suggest that food policies and interventions aiming to reduce RCP consumption in settings similar to the city of Santos may be more effective if they focus on reducing RCP availability in food stores and increasing low-cost and healthy alternatives. Additionally, interventions to make UF-MPF more affordable and accessible to lower-SES populations within existing environments may be more effective than increasing the quantity of UF-MPF food sources.
Acknowledgements
Acknowledgements: The authors wish to thank all the families that participated in the study and the interviewers for their cooperation in collecting the data. Financial support: This work was supported by Sao Paulo State Foundation for Research Support (FAPESP; grant numbers 2009/01361-1 and 2010/04471-0); and by Coordination for the Improvement of Higher Level Personnel (CAPES; REUNI). FAPESP and CAPES had no role in the design, analysis or writing of this article. Conflict of interest: None. Authorship: F.H.M.L. and P.A.M. designed the study, conducted the data analysis and wrote the paper. E.C.C., D.S.C.A. and M.A.O. helped in the data collection and data analysis. N.B. helped to write the paper. Ethics of human subject participation: This study was approved by the Ethics and Research Committee of the Federal University of Sao Paulo (protocol numbers CEP 0275/09 and 0276/09). All participants provided written informed consent.


