Article

Effects of Inoculum Type and Aeration Flowrate on the Performance of Aerobic Granular SBRs

by
Mariele K. Jungles
1,2,*,
Ángeles Val del Río
2,
Anuska Mosquera-Corral
2,
José Luis Campos
3,
Ramón Méndez
2 and
Rejane H. R. Costa
1
1
Department of Sanitary and Environmental Engineering, Federal University of SantaCatarina-UFSC/CTC/ENS, CEP 88010 970 Florianópolis, SC, Brazil
2
Department of Chemical Engineering, School of Engineering, University of Santiago de Compostela, Lope Gómez de Marzoa s/n, E-15782 Santiago de Compostela, Spain
3
Facultad de Ingeniería y Ciencias, Universidad Adolfo Ibáñez, Avda Padre Hurtado 750, Viña del Mar 2520000, Chile
*
Author to whom correspondence should be addressed.
Processes 2017, 5(3), 41; https://doi.org/10.3390/pr5030041
Submission received: 8 June 2017 / Revised: 13 July 2017 / Accepted: 14 July 2017 / Published: 19 July 2017

Abstract

:
Aerobic granular sequencing batch reactors (SBRs) are usually inoculated with activated sludge which implies sometimes long start-up periods and high solids concentrations in the effluent due to the initial wash-out of the inoculum. In this work, the use of aerobic mature granules as inoculum in order to improve the start-up period was tested, but no clear differences were observed compared to a reactor inoculated with activated sludge. The effect of the aeration rate on both physical properties of granules and reactor performance was also studied in a stable aerobic granular SBR. The increase of the aeration flow rate caused the decrease of the average diameter of the granules. This fact enhanced the COD and ammonia consumption rates due to the increase of the DO level and the aerobic fraction of the biomass. However, it provoked a loss of the nitrogen removal efficiency due to the worsening of the denitrification capacity as a consequence of a higher aerobic fraction.

1. Introduction

Activated sludge process is the most used technology to remove organic matter, nitrogen, and phosphorous from wastewaters. However, because of the poor settling properties of the flocculent biomass, activated sludge systems require a relatively large implementation surface. A possible option to avoid this drawback is the use of aerobic granular biomass since this type of biomass presents structures more compact and stronger than those of the flocculent biomass and, therefore, allows a better retention of the biomass [1,2].
The formation of aerobic granular biomass is promoted by applying a periodic feast-famine regime and short settling times which can be accomplished with a Sequencing Batch Reactor (SBR) [3,4]. There are several factors that influence the granulation process and the structure of the aggregates, such as the feed composition, organic loading rate (ORL), hydrodynamic shear force caused by aeration flowrate, and type of inoculum [5,6,7]. Aerobic granular biomass has been successfully obtained using different types of industrial and municipal wastewaters [8,9,10,11,12]. However, in some cases the formation of granules can take several weeks depending on the composition but also on the kind of inoculum used [13]. In fact, most of the aerobic granular reactors used in other research works were inoculated with biomass from activated sludge systems treating urban or industrial wastewater, which caused the loss of biomass during the start-up period leading to poor effluent quality. Today, more attention is being paid to selecting a suitable inoculum to shorten this period and/or obtain granules with better physical properties [7,14,15].
Pijuan et al. [14] optimized the start-up period using as inoculum a mixture of floccular and crushed aerobic granular biomass (50/50). This strategy maintained the nitrogen removal capacity and avoided biomass losses during the granulation process. Xu et al. [16] proposed the use of pellets obtained from activated sludge flocs as inoculum to develop aerobic granular biomass. These authors found that this type of inoculum had a shorter start-up time compared with that obtained using activated sludge as inoculum. Moreover, the granules obtained had better settling properties which were attributed to the different bacterial populations observed and could be stored without deterioration of their structure for long time [13].
Besides the type of inoculum, another factor that has a strong influence on granule formation is the aeration rate applied. The shear forces caused by aeration promote the production of polysaccharides, which impacts the physical properties of granules [2,17,18]. More compact, stable and denser aerobic granules are obtained by applying high hydrodynamic shear force [19,20]. However, a higher aeration rate implies higher operational costs and, therefore, an optimal aeration rate should be determined [21].
For these reasons, the objective of this work is to determine the influence of the inoculum on the start-up of an aerobic granular system and to optimize the aeration rate applied.

2. Results and Discussion

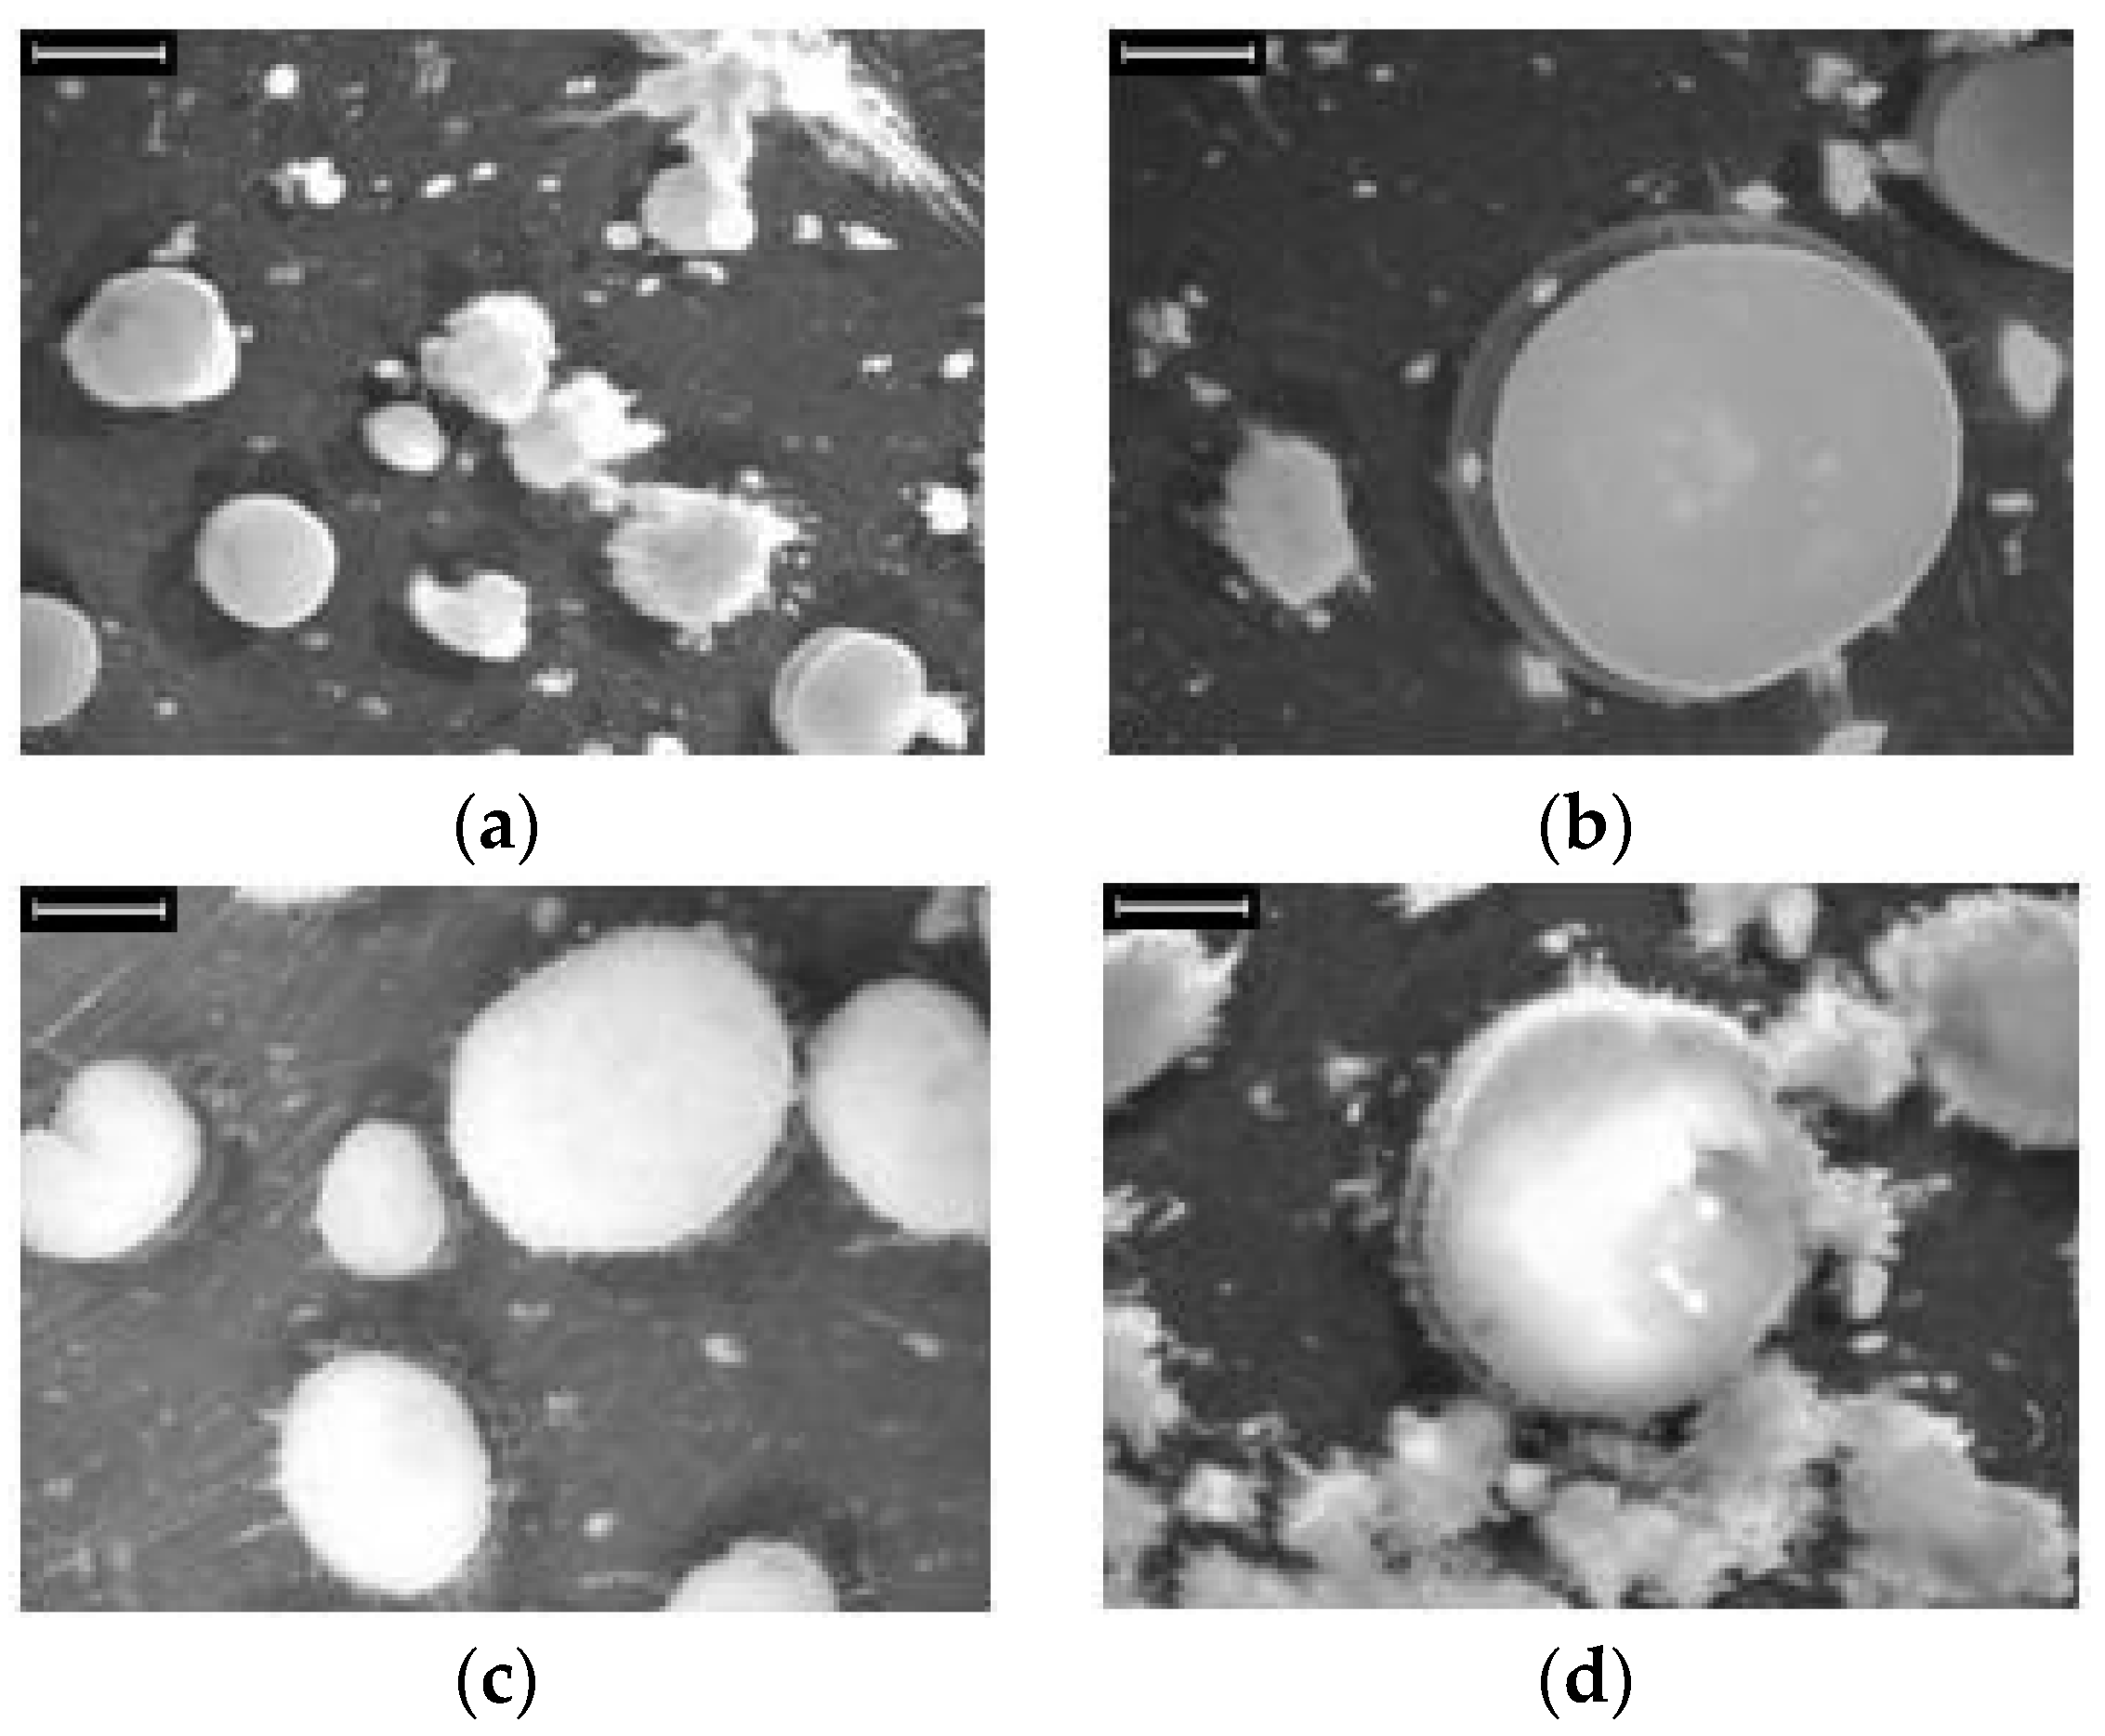
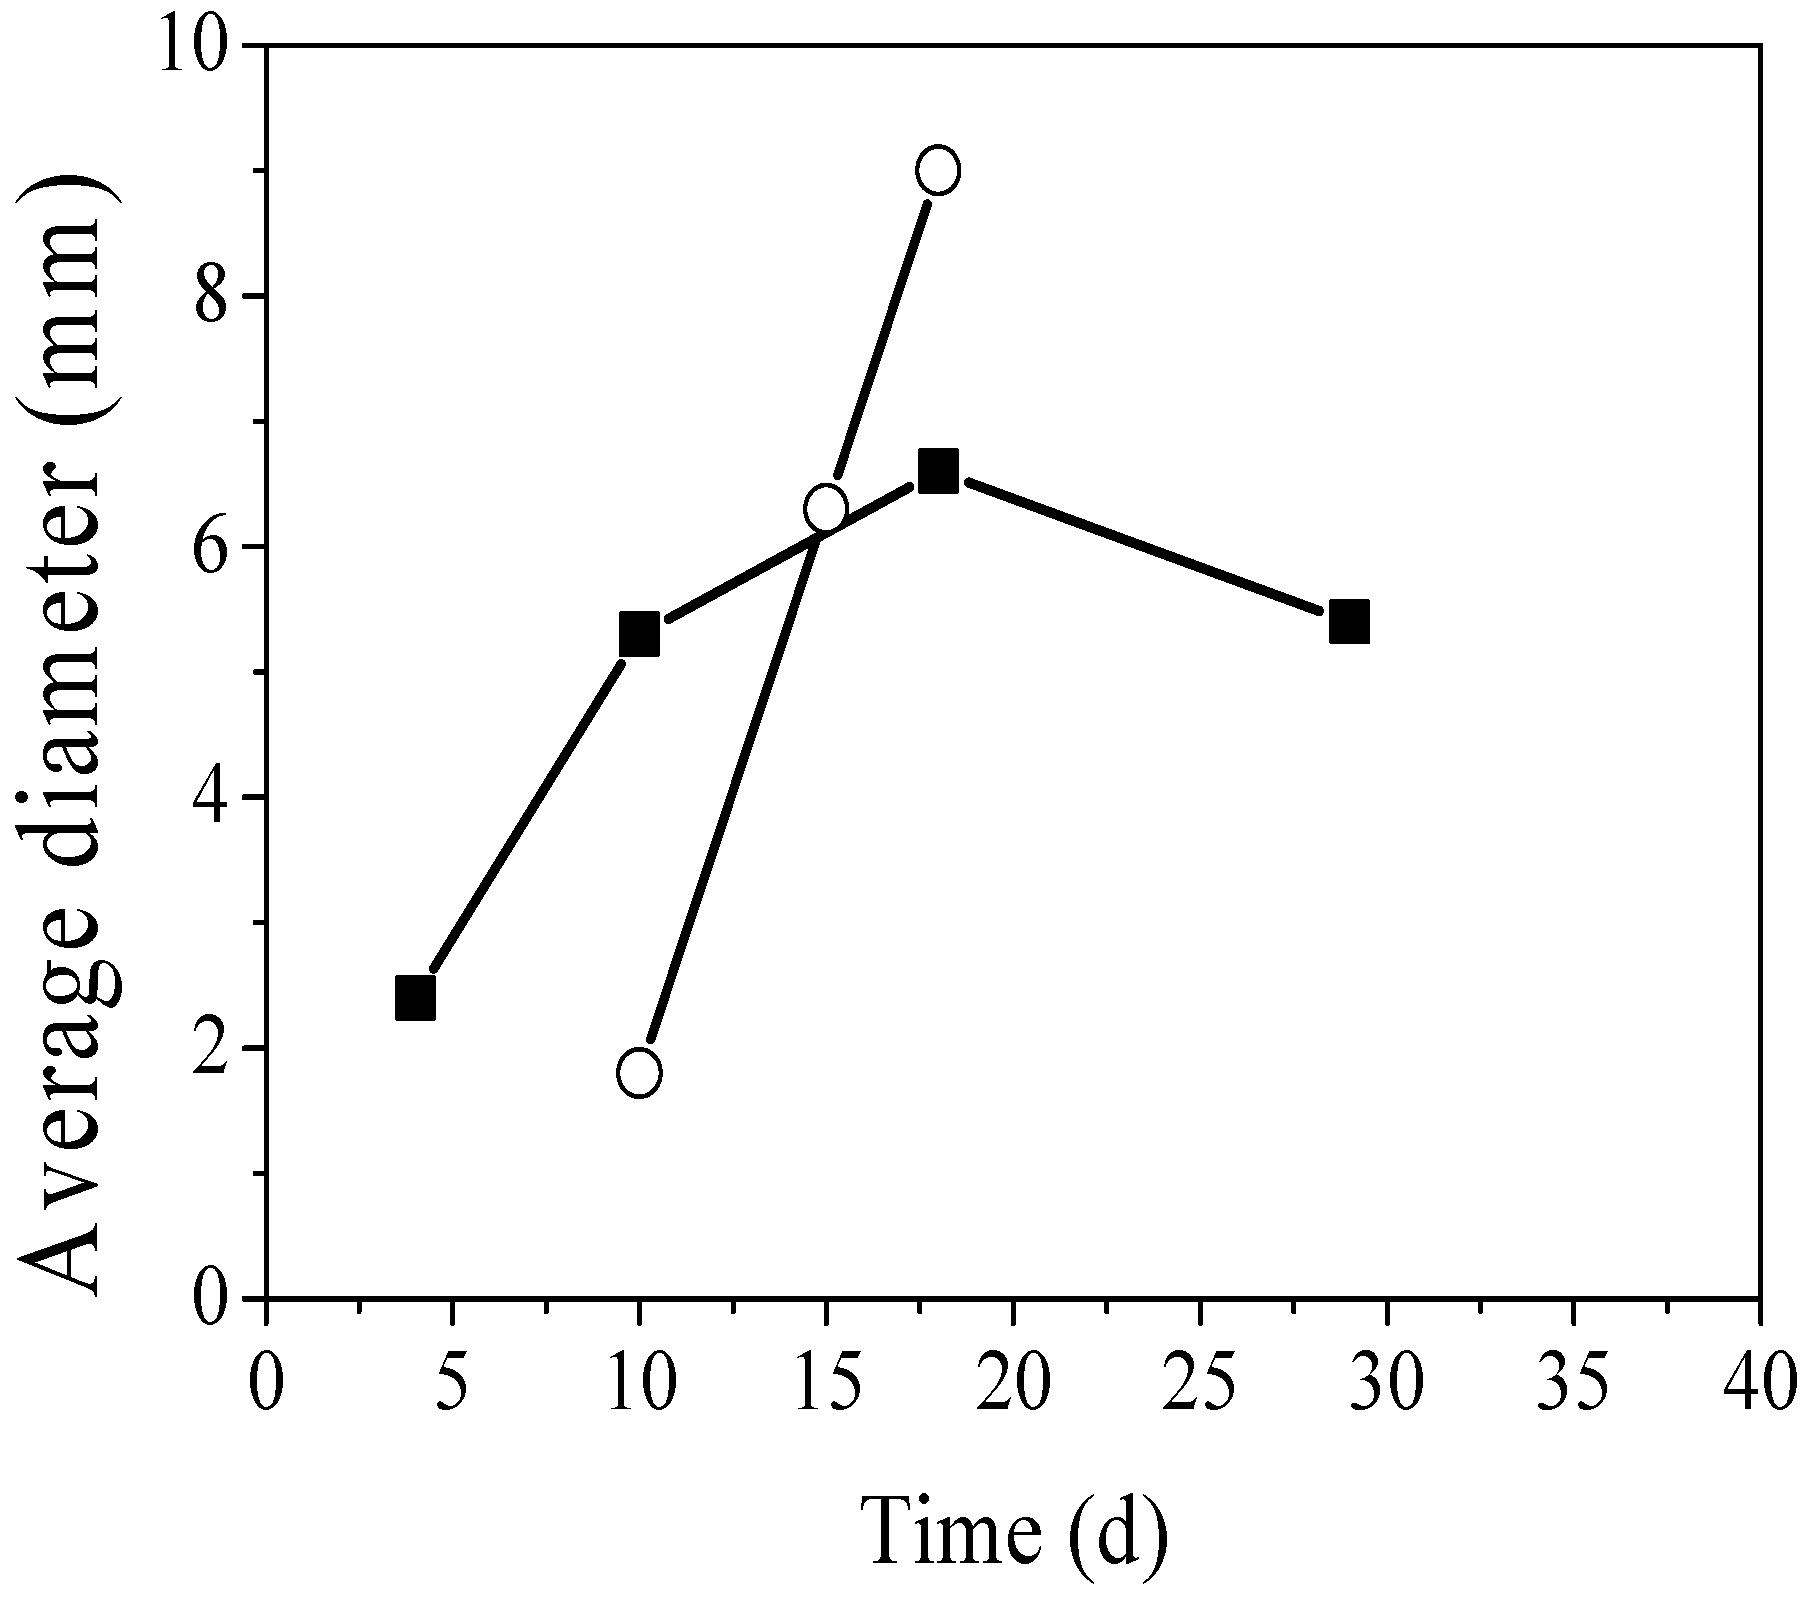
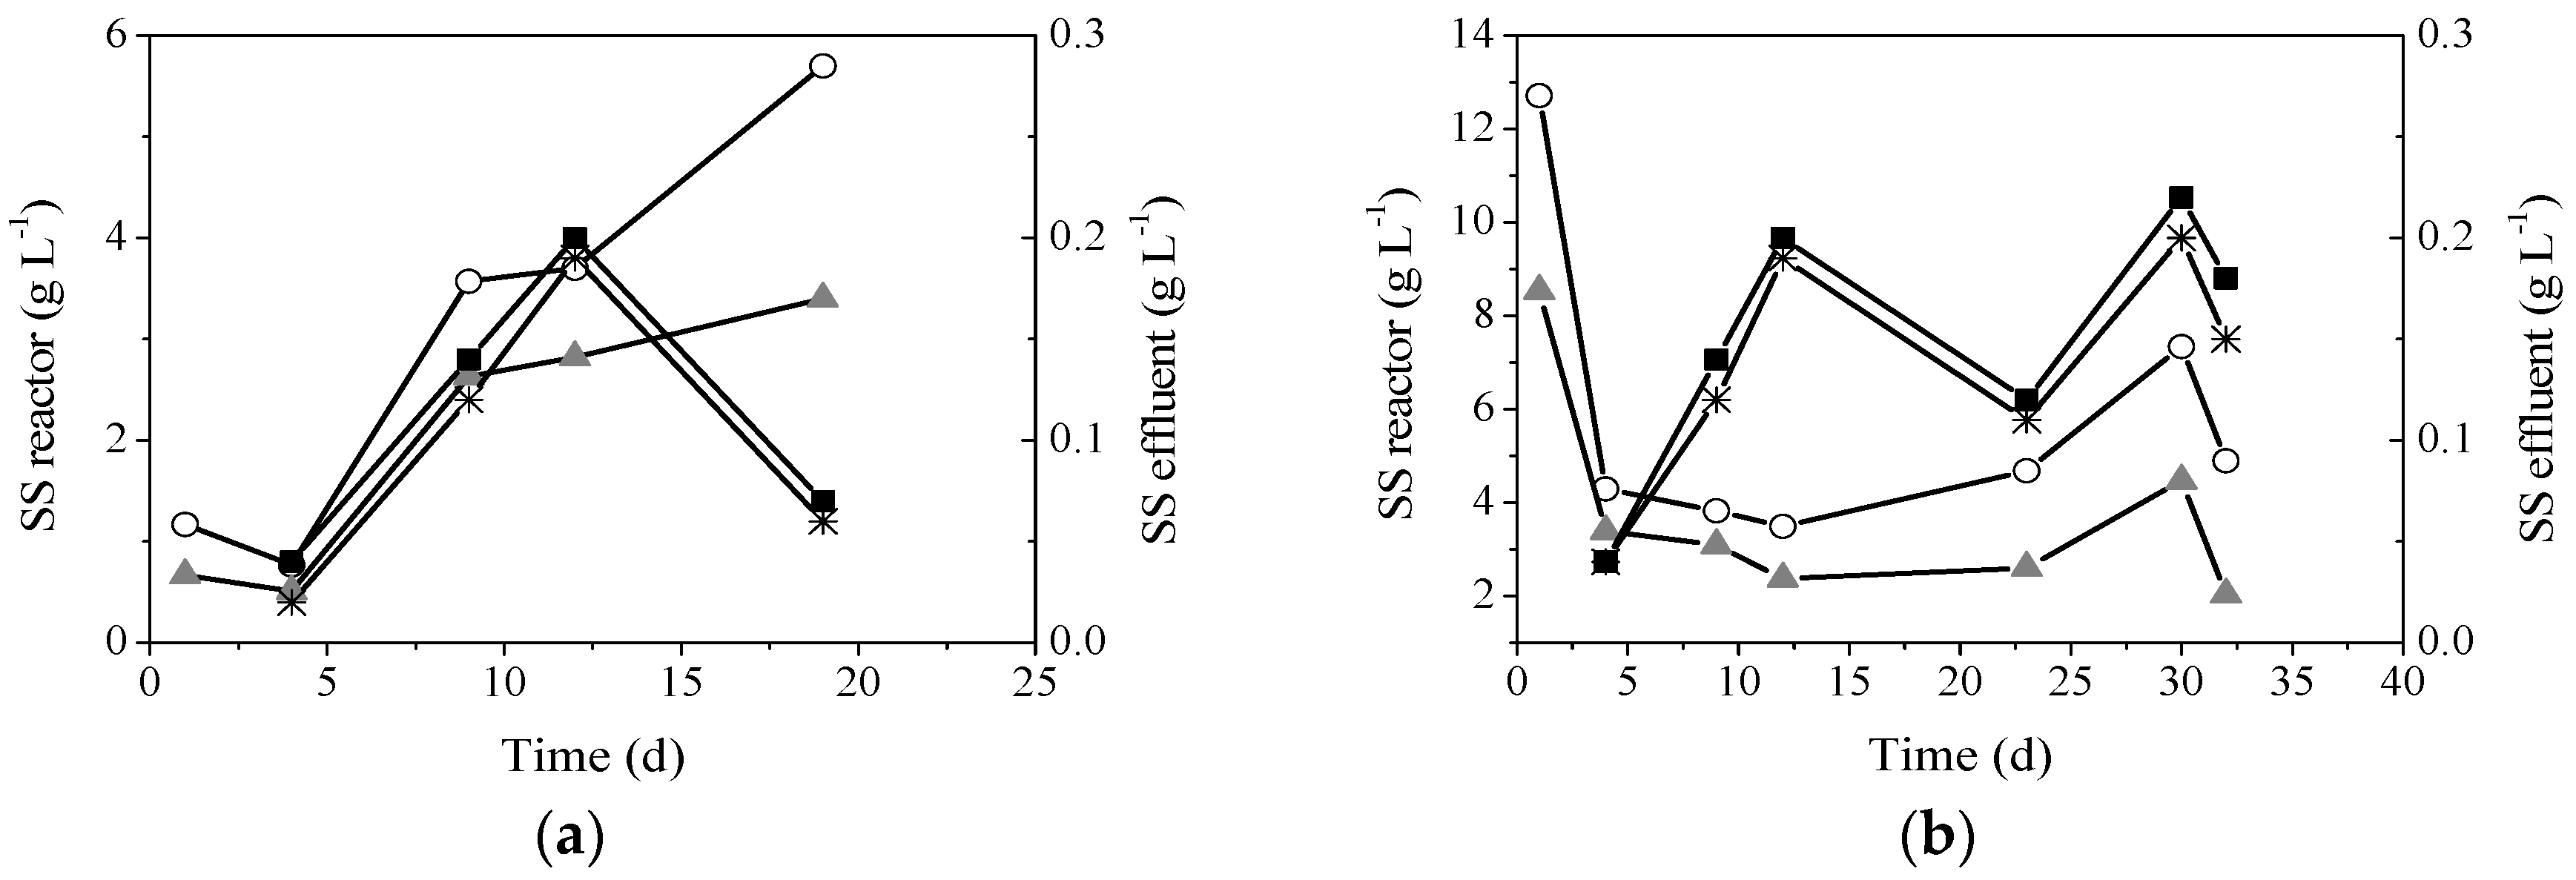
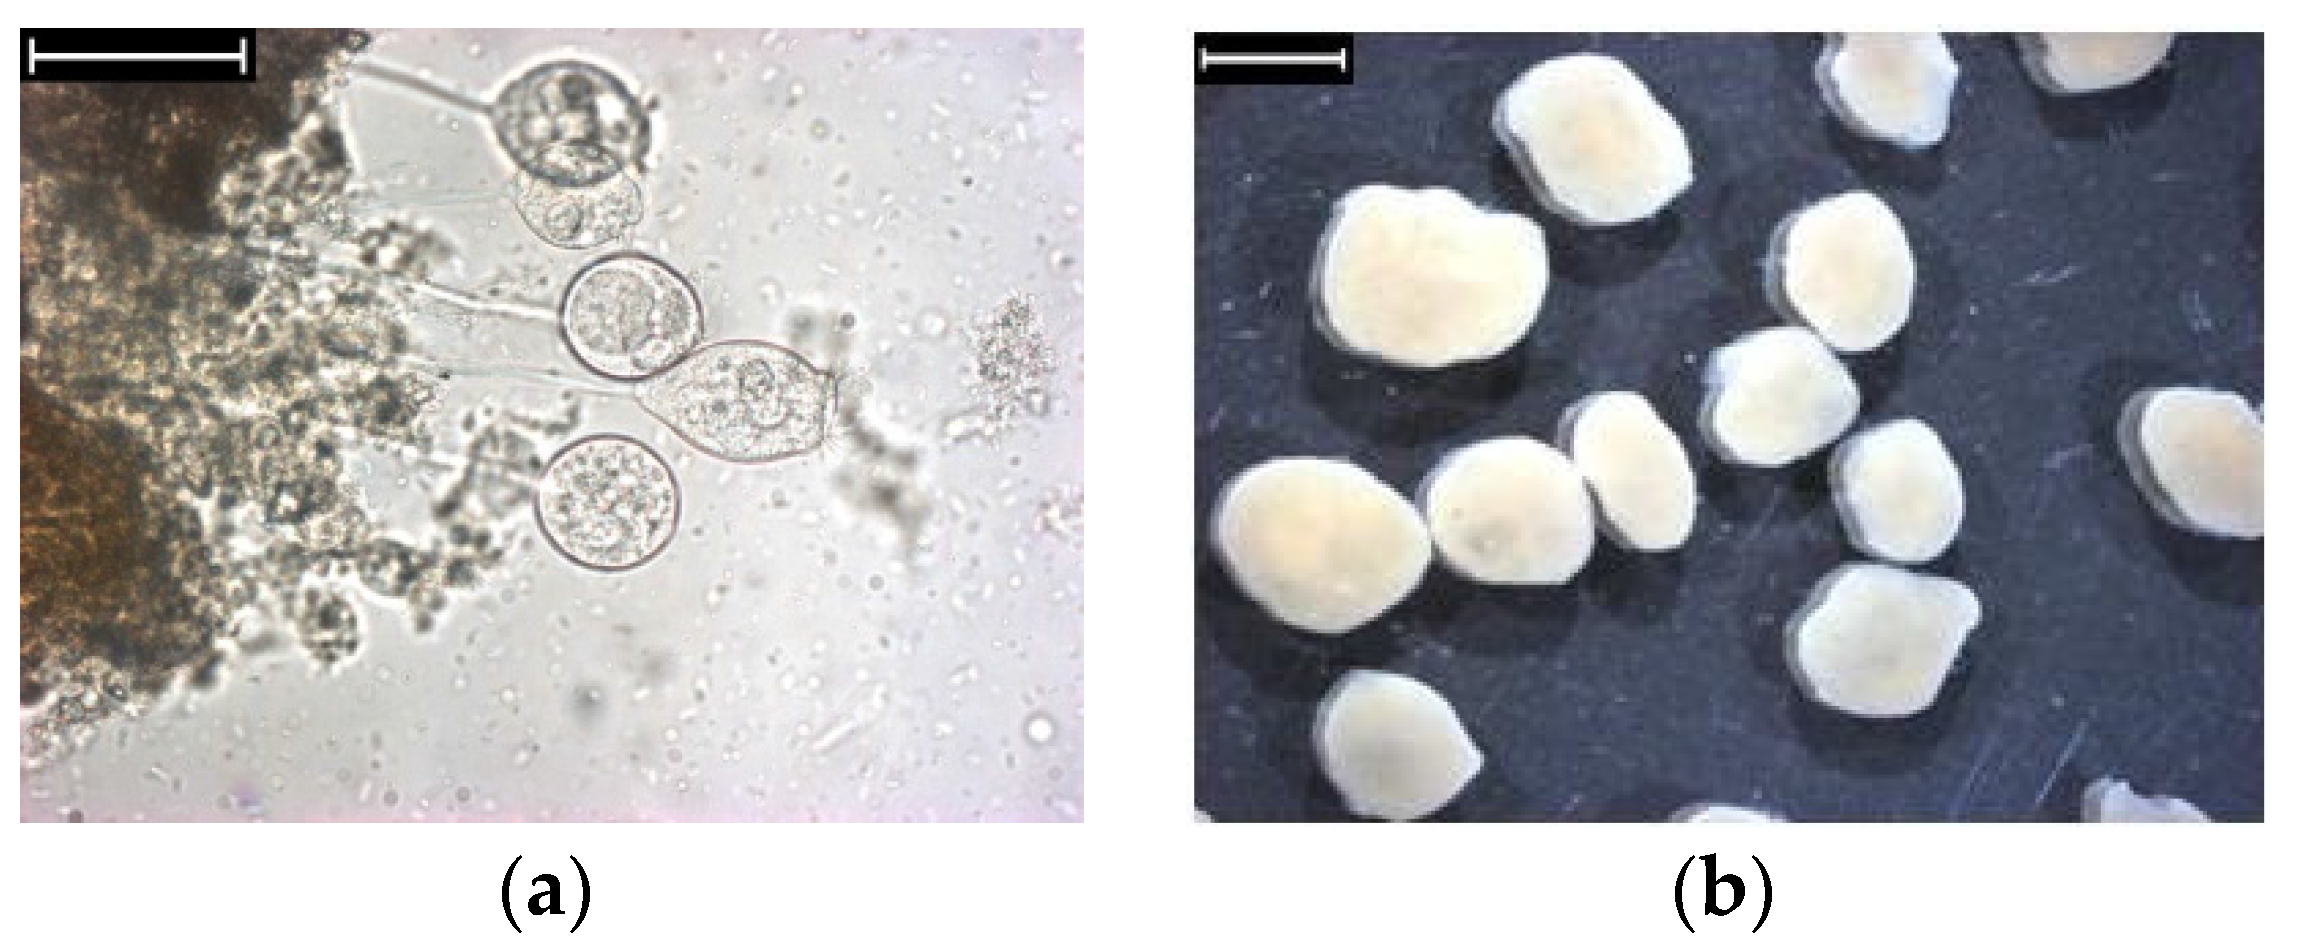
2.1. Granules Formation and Properties with Different Type of Inoculum

Two SBRs were operated with different type of inoculum: activated sludge (SBR I) and mature aerobic granules (SBR II). The development of the average diameter of the aggregates was different in both reactors. In SBR I, the granule diameters ranged from 0.2 to 2.8 mm at day 10, with an average diameter of 1.8 mm (42% of the aggregates observed) (Figure 1a). Granules size increased up to 9 mm (day 18) (Figure 1b) and, then, granule size decreased. The average diameter of granules used to inoculate SBR II was of 2.5 mm and increased up to 6.6 mm on day 18. At this moment, small filamentous were observed on the granules surface and, finally, they broke up. After that, the solids were washed out from the SBR and the average diameter of the granules decreased down to 5.4 mm at day 29 (Figure 2).
The initial volatile suspended solids (VSS) concentration of SBR I was of 0.7 g VSS L−1 and increased up to 3.4 g VSS L−1 on day 19 (Figure 3a). In SBR II, the solids concentration decreased from 8.5 g VSS L−1 to 3.4 g VSS L−1 on day 9 (Figure 3b). The biomass concentration increased slowly up to 4.0 g VSS L−1 and finally, diminished down to 1.8 g VSS L−1 on day 32.
In both cases, granules formed have similar SVI (52–58 mL (g TSS)−1), density (23.9–29.3 g VSS Lgranule−1) and organic fraction (VSS/TSS) (0.60–0.65). These values are in the range of those reported for aerobic granular biomass [22].

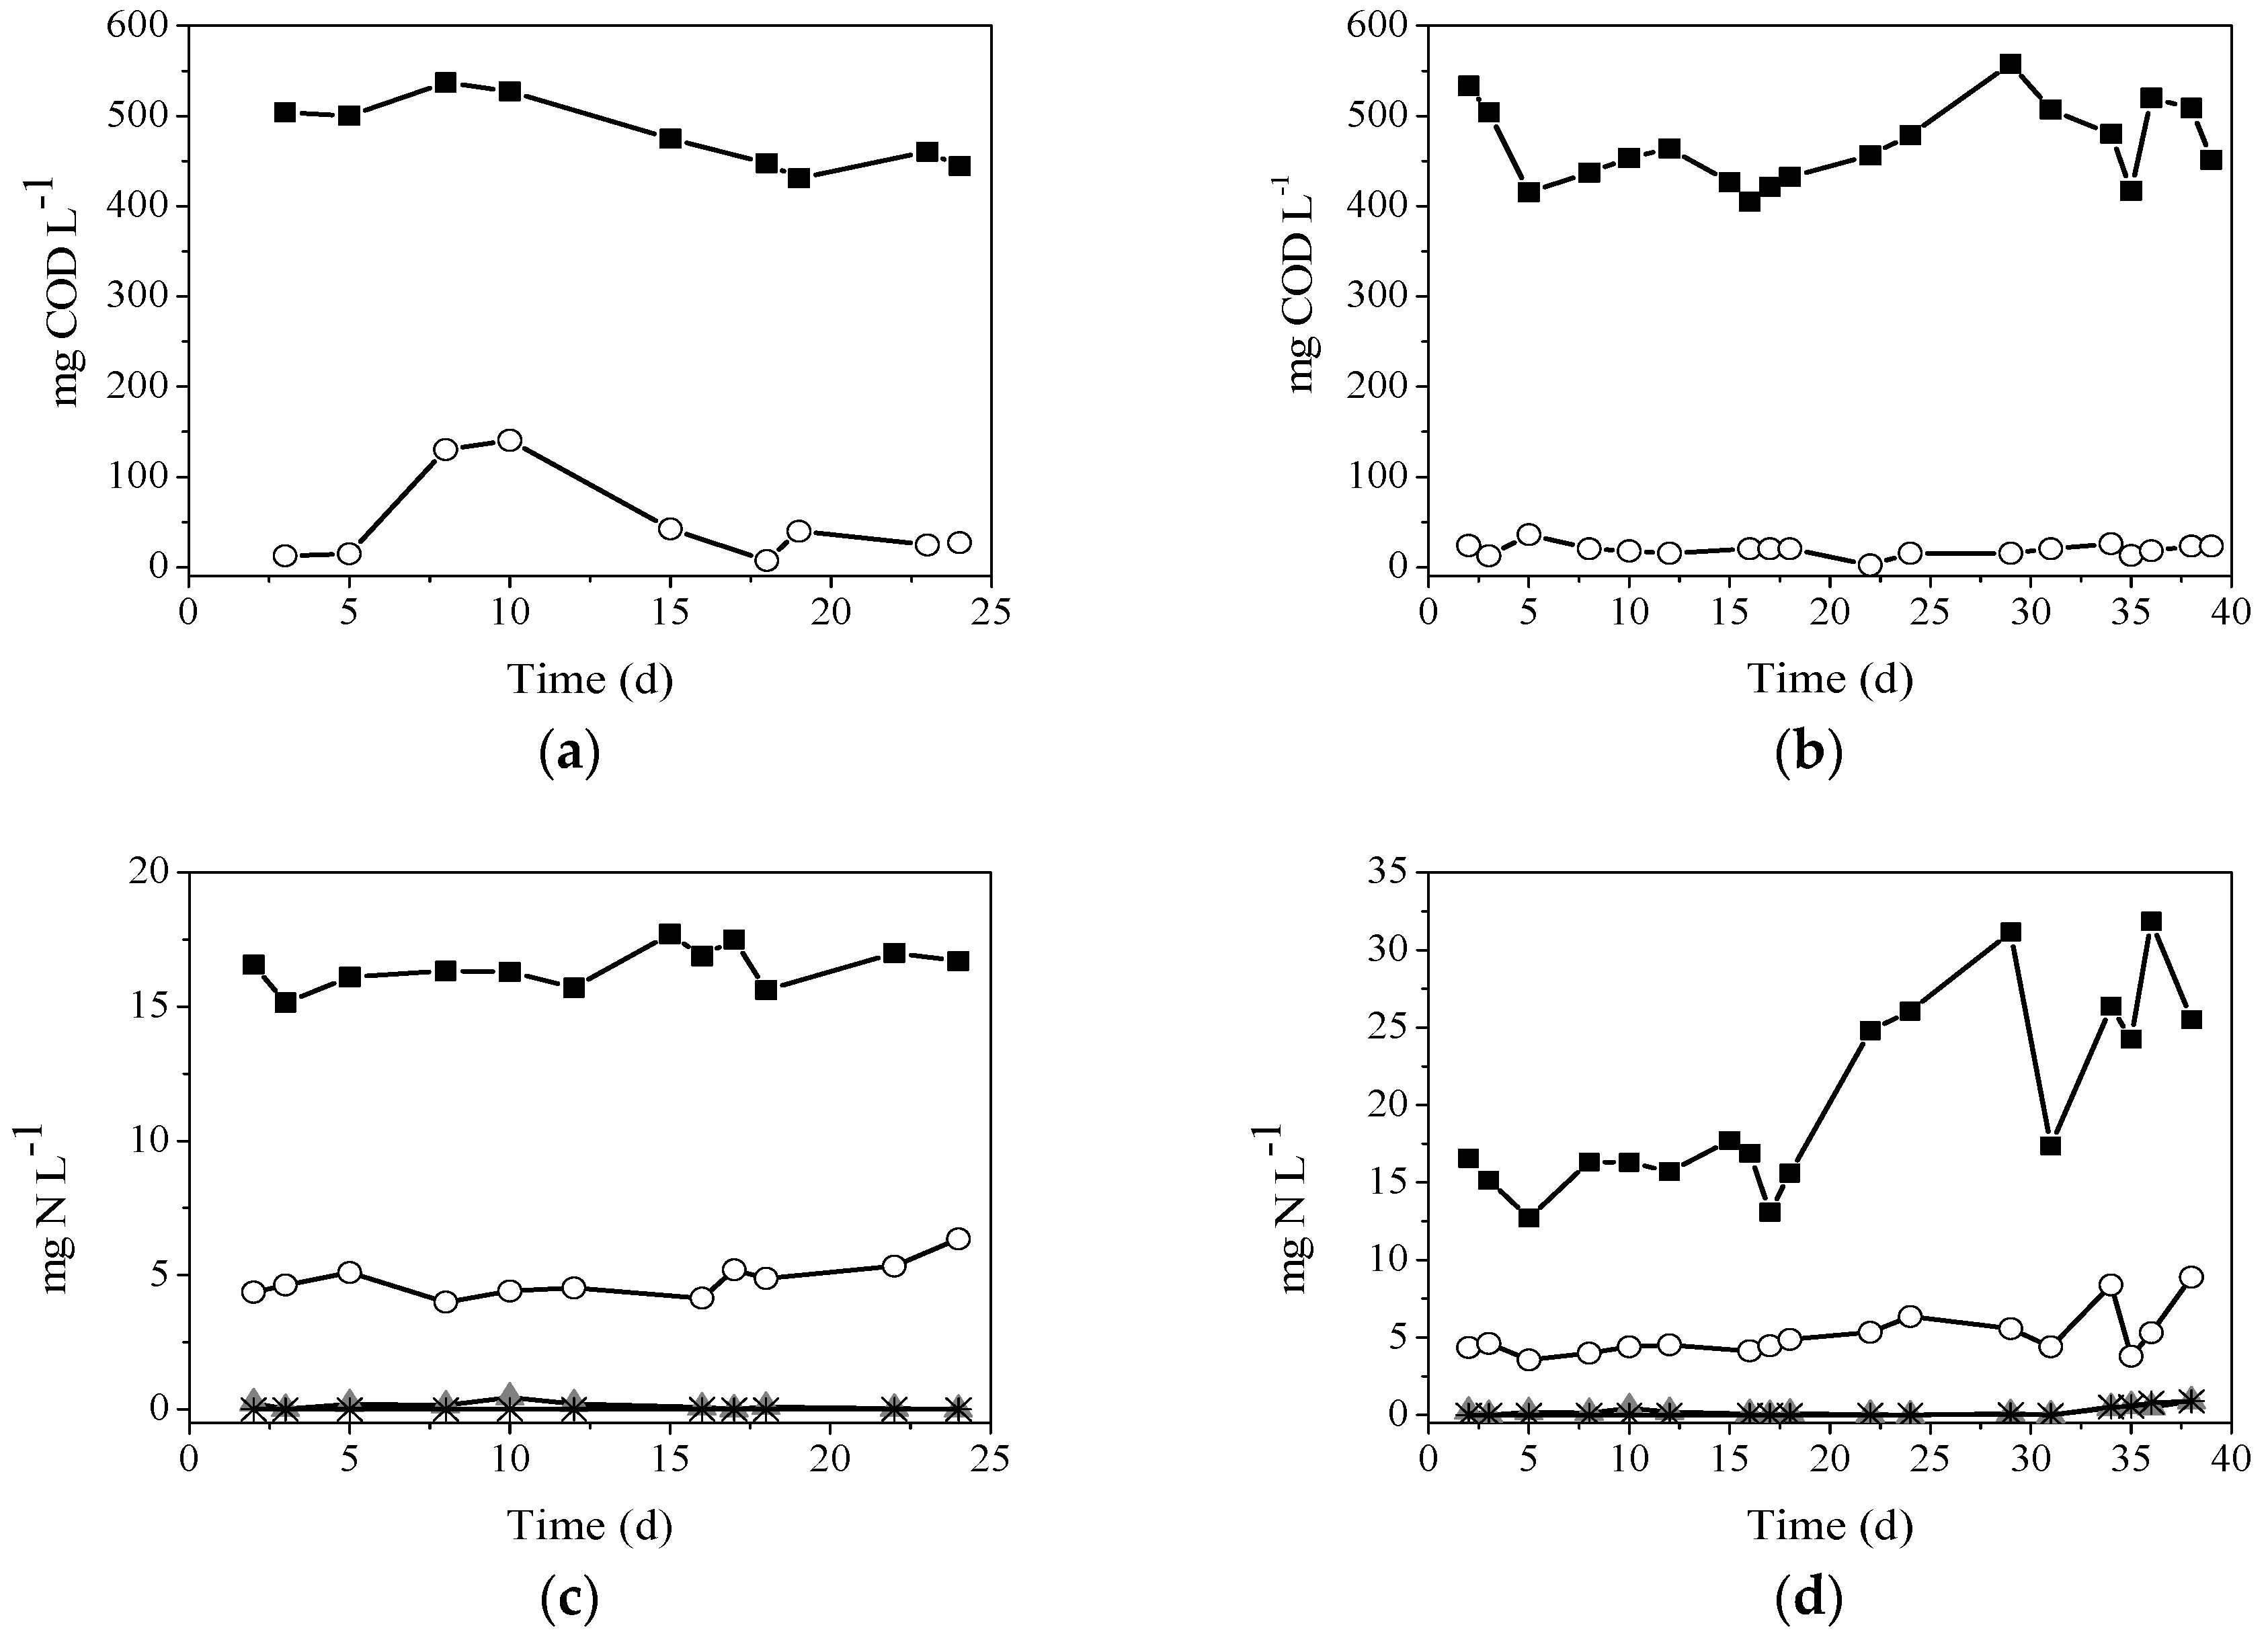
2.2. Organic Matter and Nitrogen Removal with Different Type of Inoculum

In SBR I, the COD removal was maintained around 96% except beween days 8–12 of operation when punctual values around 140 mg COD L−1 were measured in the effluent due to the wash-out of biomass (Figure 4a). For SBR II, a similar COD removal efficiency (97%) was observed during whole operational period (Figure 4b). Nitrite and nitrate were detected only at low concentrations in both reactors (Figure 4c,d), nitrogen being removed mainly by biomass assimilation (Table 1). The low development of the nitrification process could be attributed to the biomass wash-out episodes observed in both reactors, which would cause the solids retention times to be lower than those needed to develop nitrifying biomass [23].

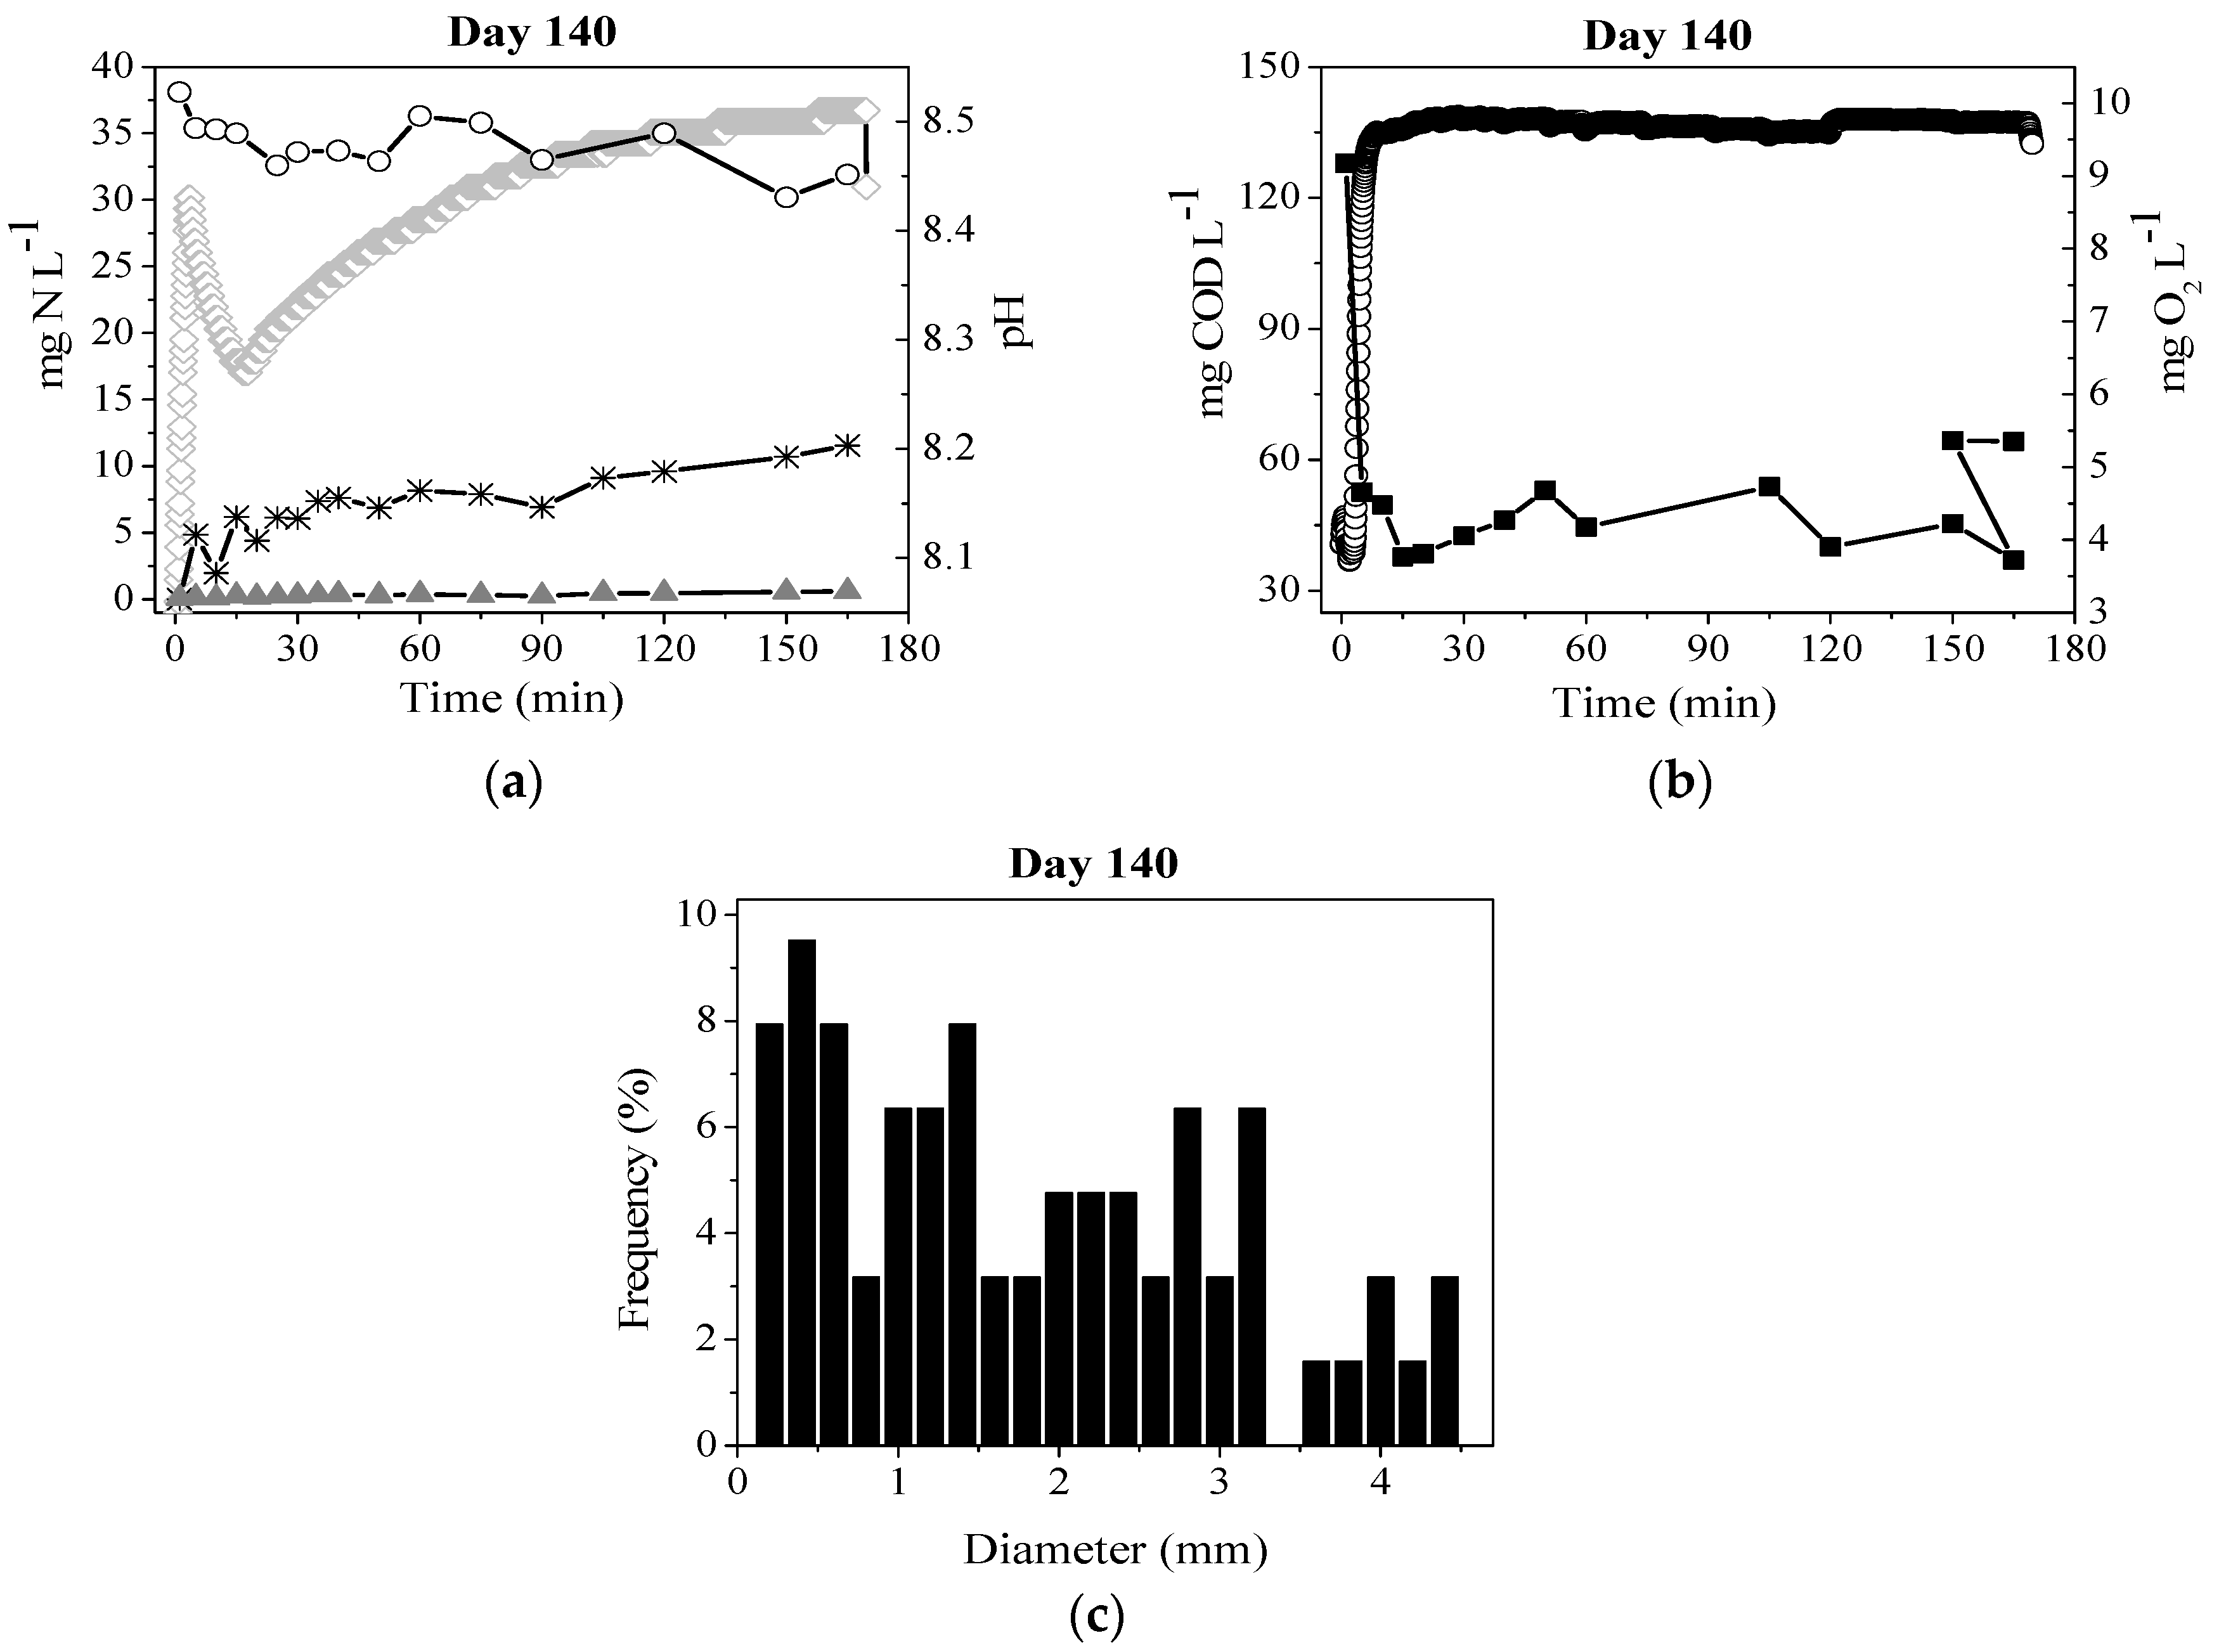
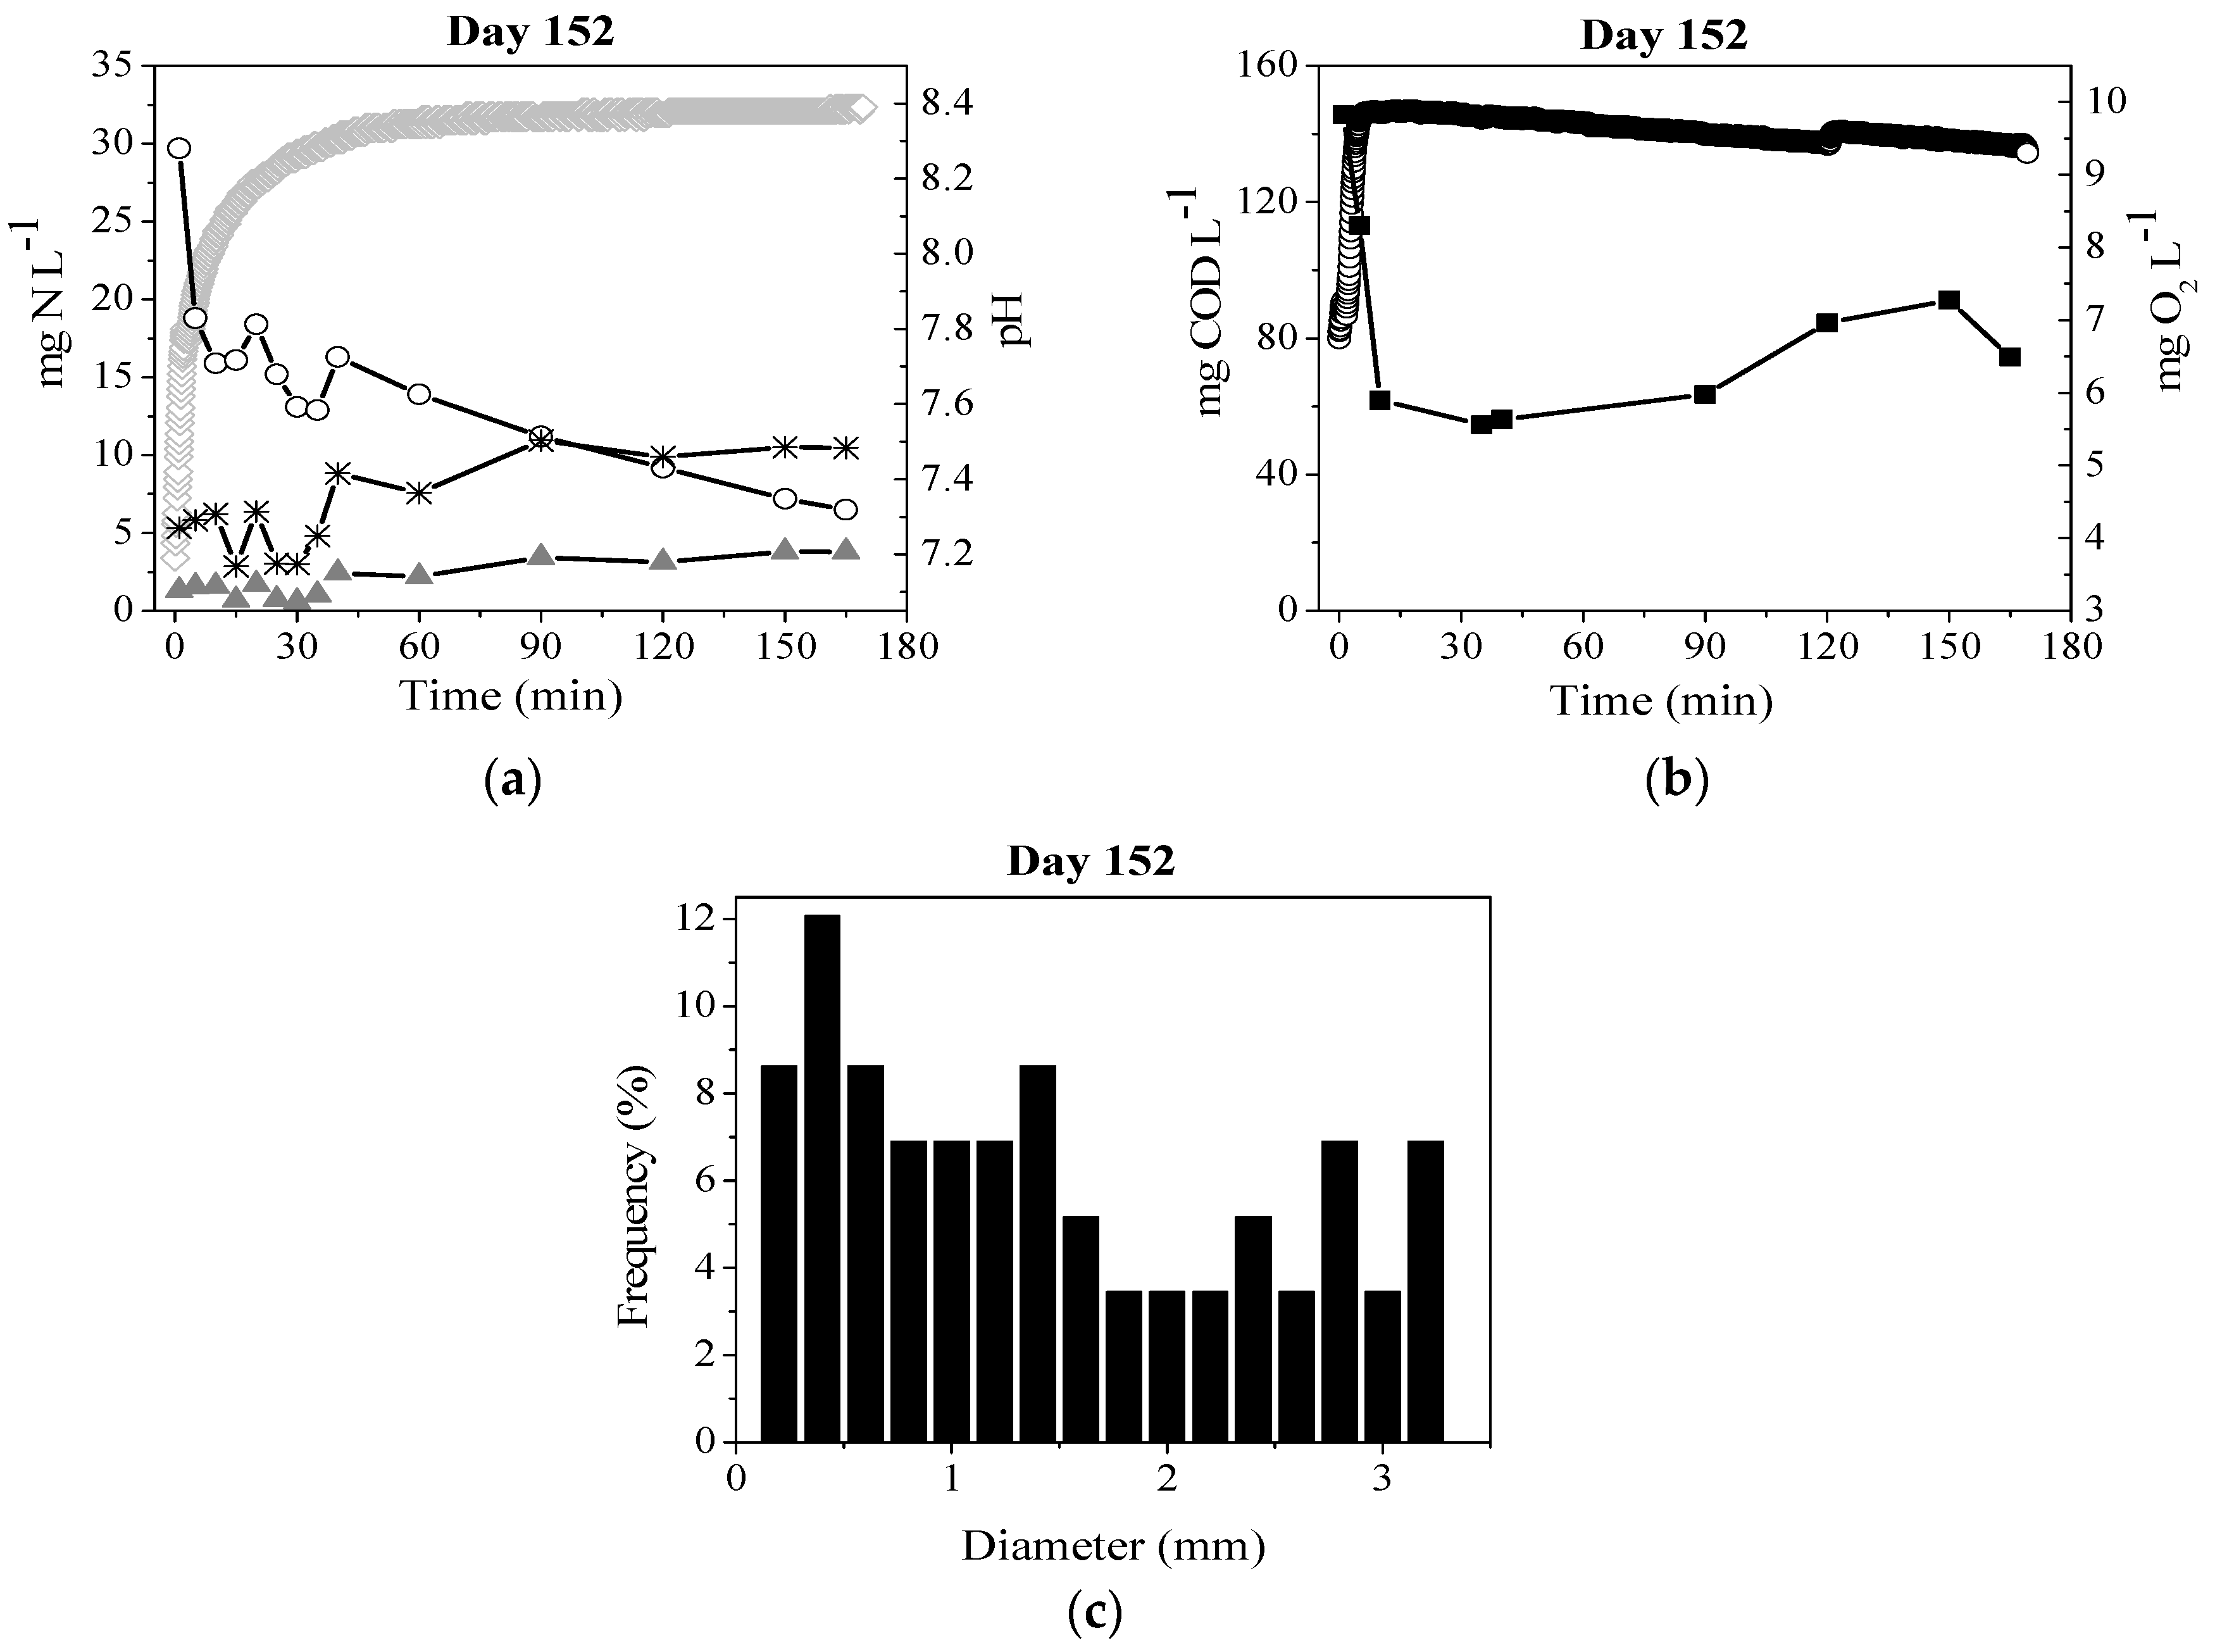
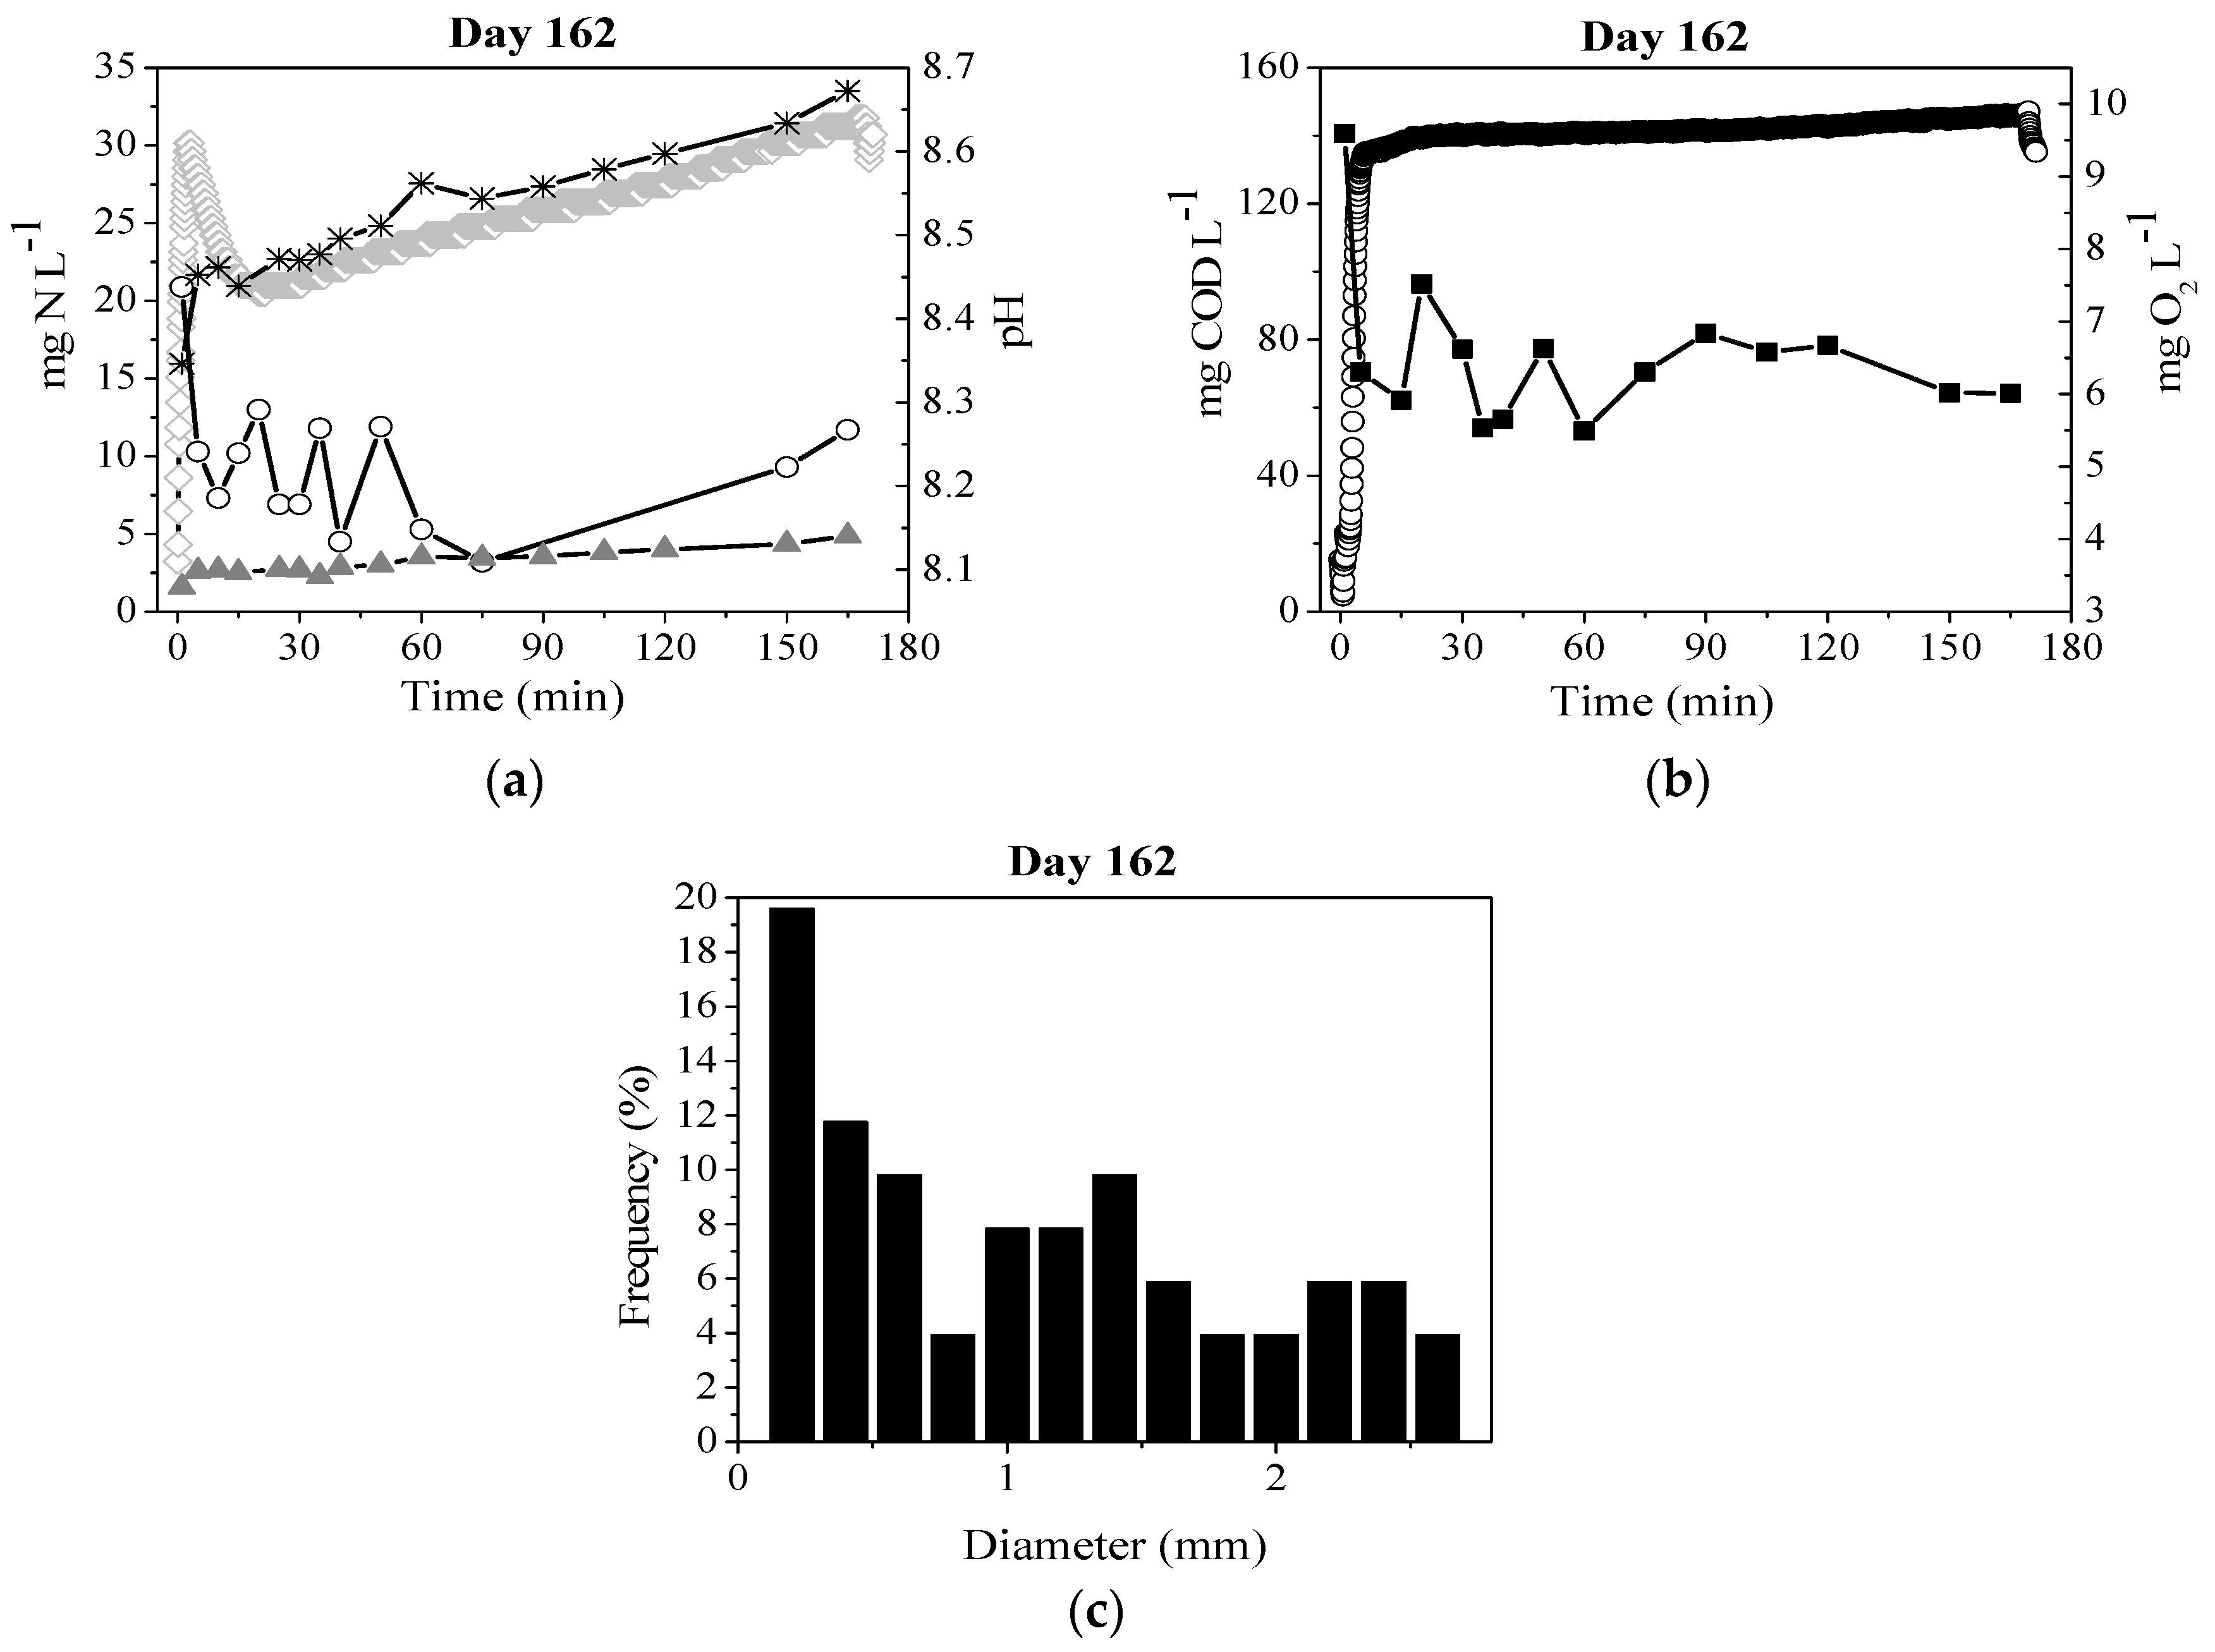
2.3. Effects of Aeration Flowrates

A SBR reactor containing mature granules (SBR III) was operated at three different aeration flowrates to study their effect on the granules performance. For this propose, oxygen, COD, ammonia, nitrite and nitrate concentrations, and pH profiles were tracked along the cycle for each aeration rate applied (Figure 5, Figure 6 and Figure 7). From these profiles, COD and ammonia consumption rates and also the generation rates of nitrite and nitrate were calculated (Table 2).
The biodegradable COD was consumed in the first several minutes (less than 15 min) of the aeration phase, which is known as the ‘feast period’. During this period, the DO concentration was low due to the organic matter oxidation. Then, the DO concentration increased near to the saturation level, because the low ammonia oxidation rate and the fraction of non-biodegradable COD remained unchanged. This phase is known as the ‘famine period’. Ammonia was oxidized during the whole cycle, consequently the concentrations of nitrate and nitrite increased inside the reactor.
COD and ammonia consumption rates tended to increase as a higher upflow air velocity was applied. This can be mainly attributed to the increase of the aerobic fraction of the granules, which promoted higher specific activities of the overall biomass. The higher aerobic fraction and higher DO concentration were a consequence of the average granule diameter decrease (Figure 5, Figure 6 and Figure 7).
The size of the aerobic granules is given a balance between biomass growth and detachment rates. In this case, the biomass growth rate should be constant since the applied OLR is constant but the detachment rates should get bigger due to the increase of the shear forces provoked by the flowrate increase. This fact would explain the drop of the average granules diameter with the increase of the aeration flowrate as it was already observed by Tay et al. [18].
However, higher COD and ammonia consumption rates do not imply higher nitrogen removal. As can be observed in Table 3, with the increase of the upflow gas velocity from 1.26 to 1.40 cm s−1 the nitrogen removal percentage decreased from 55.0% to 48.9%. This fact could be explained by the increase of the aerobic fraction as a consequence of the average granule diameter reduction. Therefore, the granules’ anoxic zone decreased, causing a negative impact on denitrification process. A similar effect was found when granules with a constant diameter are operated at different dissolved oxygen levels [24,25]. The anoxic volume of granules relatively decreased at high DO levels, decreasing their capacity for denitrification. Isanta et al. [25] found there is an optimum value for the DO level which allows maintaining a compromise between denitrification and nitrification and COD removal capacities and obtaining a maximum nitrogen removal percentage. In the present work, the shear stress caused by the aeration flowrate can be used to control the granules size and, therefore, to optimize the nitrogen removal capacity of the reactor.

3. Materials and Methods

3.1. Reactors Setups and Operational Strategies

To study the influence of the inoculum type two sequencing batch reactors (SBR I and SBR II) with total and working volumes of 2.7 L and 1.8, respectively, were operated at room temperature (20–25 °C). The SBRs had a height of 480 mm and a inner diameter of 85 mm. The aeration was supplied at the bottom of the reactors by an air diffuser to provide the oxygen necessary and maintain the agitation inside the SBRs. To add the feeding and discharge of the effluent, two peristaltic pumps were used. The volume exchange ratio and the hydraulic retention time (HRT) were of 50% and 0.25 days, respectively.
The operational cycles in the reactors were of 3 h distributed as: 3 min to feed, 171 min to aerate, 1 min to settle, and 5 min for effluent discharge. A programmable logic controller was used to monitor the different operational phases. The SBRs were fed with a simulated wastewater containing (g L−1): 7.1 NaAc·3H2O, 0.64 NH4Cl, 0.12 K2HPO4, 0.29 MgSO4, 0.47 CaCl2·2H2O, 0.63 KCl, and 1 mL L−1 of a trace solution (Smolders et al. [26]). The applied organic (OLR) and nitrogen (NLR) loading rates for both reactors were around 2.0 g COD (L·d)−1 and 0.1 g N (L·d)−1, respectively.
For SBR I the inoculum used was 0.5 L of activated sludge (Figure 8a) from the urban wastewater treatment plant of Santiago de Compostela (42°52′11″ N 8°35′55″ W), while SBR II was inoculated with 0.2 L of mature aerobic granules (Figure 8b) collected from a lab scale reactor [23].
To study the influence of the aeration flowrate applied another SBR (SBR III, total volume of 9 L) was operated at room temperature (20–25 °C). This reactor had a height and a inner diameter of 1900 and 90 mm, respectively. The simultaneous aeration and agitation was by using an air diffuser. To add the feeding and discharge of the effluent, two peristaltic pumps were used. The volume exchange ratio and the HRT were of 50% and 0.25 days, respectively. The operational cycles of SBR III were of 3 h comprising: 1 min of feeding, 169 min of aeration, 10 min of settling, and 1 min of effluent discharge. A programmable logic controller was used to monitor the length of the phases. The aeration flowrate was step wisely increased along the operational period in order to obtain aerations rates of 1.04, 1.26, and 1.4 cm s−1.
SBR III was fed with municipal wastewater which was supplemented with acetate to have an inlet COD concentration around 200 mg COD L−1 (Table 4). The applied OLR and NLR were around 2.0 g COD (L·d)−1 and 0.1 g N (L·d)−1, respectively.
The SBR III inoculum consisted in activated sludge from the municipal wastewater treatment plant of Florianópolis, Santa Catarina, Brazil (27°33′13.08″ S 48°26′15.42″ O) [9]. To evaluate the performance of SBR III, we tracked COD, ammonia, nitrite, nitrate, and DO concentrations, as well as pH at an operational cycle for different operational days. Nitrogen balances were performed according to Mosquera-Corral et al. [27] to know the nitrogen removal mechanism.

3.2. Analytical Methods

The pH values and DO, nitrite, nitrate, ammonia, total suspended solids (TSS), volatile suspended solids (VSS), and sludge volumetric index (SVI) were determined according to Standard Methods (APHA, 2005). Chemical oxygen demand (COD) concentrations were determined by the modified Standard Method [28]. DO concentration was measured with a multi-parameter electrode (YSI 6820, YSI, Yellow Springs, Ohio 45387-1107 USA). The settling velocity was determined by measuring the time taken for an individual aggregate to go over a certain height in a measuring cylinder. The granule size and morphology were measured by image analysis procedure [29], considering a sample of more than 200 granules and using a microscope ZEISS 2000-C provided with a light source KL 200. Biomass density in terms of g VSS Lgranules−1, was determined by the methodology of Beun et al. [3] using dextran blue.

4. Conclusions

No clear differences were observed between the start-up and performance of aerobic granular systems inoculated with activated sludge or with mature aerobic granules. The properties of the granules obtained were similar in terms of SVI (52–58 mL (g TSS)−1), density (24–29 g VSS Lgranule−1) and VSS/TSS ratio (0.60–0.65). The organic matter removal and ammonia oxidation efficiencies were good (97% and 70%, respectively). However, the total nitrogen removal efficiency (around 30%) was low and mainly by assimilation.
The increase of the aeration flowrate caused the decrease of the average granule diameter. This fact increased the aerobic fraction of granules and, therefore, their COD and ammonia oxidation rates. However, an excessive aerobic fraction could compromise the denitrification activity, decreasing the nitrogen removal capacity.

Acknowledgments

This work was funded by the Brazilian National Research and Development Council (CNPq): process number-556157/2006-0 and Spanish Government (NOVEDAR Consolider project CSD2007-00055).

Author Contributions

José Luis Campos and Anuska Mosquera-Corral conceived and designed the experiments; Mariele K. Jungles performed the experiments; Ramón Méndez and Rejane H.R. Costa analyzed the data; Ramón Méndez contributed reagents/materials/analysis tools; Ángeles Val del Río and Mariele K. Jungles wrote the paper.

Conflicts of Interest

The authors declare no conflict of interest.

References

  1. Etterer, T.; Wilderer, P.A. Generation and properties of aerobic granular sludge. Water Sci. Technol. 2001, 43, 19–26. [Google Scholar] [PubMed]
  2. Yuan, X.; Gao, D.; Liang, H. Reactivation characteristics of stored aerobic granular sludge using different operational strategies. Appl. Microbiol. Biotechnol. 2012, 94, 1365–1374. [Google Scholar] [CrossRef] [PubMed]
  3. Beun, J.J.; Hendriks, A.; van Loosdrecht, M.C.M.; Morgenroth, E.; Wilderer, P.A.; Heijnen, J.J. Aerobic granulation in a sequencing batch reactor. Water Res. 1999, 33, 2283–2290. [Google Scholar] [CrossRef]
  4. Wang, Q.; Du, G.C.; Chen, J. Aerobic granular sludge cultivated under the selective pressure as a driving force. Process Biochem. 2004, 39, 557–563. [Google Scholar] [CrossRef]
  5. Chen, Y.; Jiang, W.; Liang, D.T.; Tay, J.H. Biodegradation and kinetics of aerobic granules under high organic loading rates in sequencing batch reactor. Appl. Microbiol. Biotechnol. 2008, 79, 301–308. [Google Scholar] [CrossRef] [PubMed]
  6. Campos, J.L.; Figueroa, M.; Mosquera-Corral, A.; Mendez, R. Aerobic sludge granulation: State-of-the-art. Int. J. Environ. Eng. 2009, 1, 136–151. [Google Scholar] [CrossRef]
  7. Song, Z.; Pan, Y.; Zhang, K.; Ren, N.; Wang, A. Effect of seed sludge on characteristics and microbial community of aerobic granular sludge. J. Environ. Sci. 2010, 22, 1312–1318. [Google Scholar] [CrossRef]
  8. del Río, A.V.; Figueroa, M.; Arrojo, B.; Mosquera-Corral, A.; Campos, J.L.; García-Torriello, G.; Méndez, R. Aerobic granular SBR systems applied to the treatment of industrial effluents. J. Environ. Manag. 2012, 95 (Suppl.), S88–S92. [Google Scholar] [CrossRef] [PubMed]
  9. Jungles, M.K.; Campos, J.L.; Costa, R.H.R. Sequencing batch reactor operation for treating wastewater with aerobic granular sludge. Braz. J. Chem. Eng. 2014, 31, 27–33. [Google Scholar] [CrossRef]
  10. Morales, N.; Figueroa, M.; Fra-Vázquez, A.; del Río, A.V.; Campos, J.L.; Mosquera-Corral, A.; Méndez, R. Operation of an aerobic granular pilot scale SBR plant to treat swine slurry. Process Biochem. 2013, 48, 1216–1221. [Google Scholar] [CrossRef]
  11. Derlon, N.; Wagner, J.; da Costa, R.H.R.; Morgenroth, E. Formation of aerobic granules for the treatment of real and low-strength municipal wastewater using a sequencing batch reactor operated at constant volume. Water Res. 2016, 105, 341–350. [Google Scholar] [CrossRef] [PubMed]
  12. Pronk, M.; de Kreuk, M.K.; de Bruin, B.; Kamminga, P.; Kleerebezem, R.; van Loosdrecht, M.C.M. Full scale performance of the aerobic granular sludge process for sewage treatment. Water Res. 2015, 84, 207–217. [Google Scholar] [CrossRef] [PubMed]
  13. Xu, H.-C.; He, P.-J.; Wang, G.-Z.; Yu, G.-H.; Shao, L.-M. Enhanced storage stability of aerobic granules seeded with pellets. Bioresour. Technol. 2010, 101, 8031–8037. [Google Scholar] [CrossRef] [PubMed]
  14. Pijuan, M.; Werner, U.; Yuan, Z. Reducing the startup time of aerobic granular sludge reactors through seeding floccular sludge with crushed aerobic granules. Water Res. 2011, 45, 5075–5083. [Google Scholar] [CrossRef] [PubMed]
  15. Verawaty, M.; Pijuan, M.; Yuan, Z.; Bond, P.L. Determining the mechanisms for aerobic granulation from mixed seed of floccular and crushed granules in activated sludge wastewater treatment. Water Res. 2012, 46, 761–771. [Google Scholar] [CrossRef] [PubMed]
  16. Xu, H.; He, P.; Wang, G.; Shao, L. Effects of activated sludge flocs and pellets seeds on aerobic granule properties. J. Environ. Sci. 2011, 23, 537–544. [Google Scholar] [CrossRef]
  17. Liu, Y.-Q.; Tay, J.-H. Variable aeration in sequencing batch reactor with aerobic granular sludge. J. Biotechnol. 2006, 124, 338–346. [Google Scholar] [CrossRef] [PubMed]
  18. Tay, J.H.; Liu, Q.S.; Liu, Y. The effect of upflow air velocity on the structure of aerobic granules cultivated in a sequencing batch reactor. Water Sci. Technol. 2004, 49, 35–40. [Google Scholar] [PubMed]
  19. McSwain, B.S.; Irvine, R.L.; Wilderer, P.A. Effect of intermittent feeding on aerobic granule structure. Water Sci. Technol. 2004, 49, 19–25. [Google Scholar] [PubMed]
  20. Tay, J.H.; Liu, Q.S.; Liu, Y. The effects of shear force on the formation, structure and metabolism of aerobic granules. Appl. Microbiol. Biotechnol. 2001, 57, 227–233. [Google Scholar] [PubMed]
  21. Gao, D.-W.; Liu, L.; Liang, H. Influence of aeration intensity on mature aerobic granules in sequencing batch reactor. Appl. Microbiol. Biotechnol. 2013, 97, 4213–4219. [Google Scholar] [CrossRef] [PubMed]
  22. Qin, L.; Liu, Y.; Tay, J.-H. Effect of settling time on aerobic granulation in sequencing batch reactor. Biochem. Eng. J. 2004, 21, 47–52. [Google Scholar] [CrossRef]
  23. del Río, A.V.; Morales, N.; Figueroa, M.; Mosquera-Corral, A.; Campos, J.L.; Mendez, R. Effect of Coagulant-Flocculant Reagents on Aerobic Granular Biomass. J. Chem. Technol. Biotechnol. 2012, 87, 908–913. [Google Scholar] [CrossRef]
  24. Mosquera-Corral, A.; de Kreuk, M.K.; Heijnen, J.J.; van Loosdrecht, M.C.M. Effects of oxygen concentration on N-removal in an aerobic granular sludge reactor. Water Res. 2005, 39, 2676–2686. [Google Scholar] [CrossRef] [PubMed]
  25. Isanta, E.; Suárez-Ojeda, M.E.; del Río, Á.V.; Morales, N.; Pérez, J.; Carrera, J. Long term operation of a granular sequencing batch reactor at pilot scale treating a low-strength wastewater. Chem. Eng. J. 2012, 198–199, 163–170. [Google Scholar] [CrossRef]
  26. Smolders, G.J.F.; van Loosdrecht, M.C.M.; Heijnen, J.J. A metabolic model for the biological phosphorus removal process. Water Sci. Technol. 1995, 31, 79–93. [Google Scholar] [CrossRef]
  27. Mosquera-Corral, A.; Vázquez, J.R.; Arrojo, B.; Campos, J.L.; Méndez, R. Nitrifying granular sludge in a Sequencing Batch Reactor. In Aerobic granular sludge, Water and Environmental Management Series; IWA Publishing: Munich, Germany, 2005; pp. 63–70. [Google Scholar]
  28. Soto, M.; Veiga, M.C.; Mendez, R.; Lema, J.M. Semi-micro COD determination method for high-salinity wastewater. Environ. Technol. Lett. 1989, 10, 541–548. [Google Scholar] [CrossRef]
  29. Tijhuis, L.; Vanbenthum, W.A.J.; Vanloosdrecht, M.C.M.; Heijnen, J.J. Solids retention time in spherical biofilms in a biofilm airlift suspension reactor. Biotechnol. Bioeng. 1994, 44, 867–879. [Google Scholar] [CrossRef] [PubMed]
Figure 1. Images of biomass at different operational days: (a) SBR I (10 days); (b) SBR I (18 days); (c) SBR II (9 days); (d) SBR II (18 days). The bar represents 2 mm.
Processes 05 00041 g001
Figure 2. Average diameter of biomass in SBR I (○) and SBR II (■).
Processes 05 00041 g002
Figure 3. Total suspend solids (TSS) and Volatile suspend solids (VSS) in the reactors and effluent concentrations: (○) TSS reactor; (▲) VSS reactor; (■) TSS effluent; (*) VSS effluent. (a) SBR I and (b) SBR II.
Processes 05 00041 g003
Figure 4. (a,b) COD concentrations in the influent (■) and effluent (○) in SBR I and SBR II, respectively. (c,d) Influent NH4+-N concentrations (■), effluent NH4+-N (○), NO2-N (*), and NO3-N (▲) in SBR I and SBR II, respectively.
Processes 05 00041 g004
Figure 5. Cycle profile on day 140 with aeration rate of 1.04 cm s−1. (a) Nitrogen compounds concentrations and pH: N-NH4+ (○), N-NO2 (*), N-NO3 (▲), and pH (◊); (b) O2 concentration (○) and soluble COD (■); (c) Granule size distribution.
Processes 05 00041 g005
Figure 6. Cycle prolile on day 152 with aeration rate of 1.26 cm s−1. (a) Nitrogen compound concentrations and pH: N-NH4+ (○), N-NO2 (*), N-NO3 (▲), and pH (◊); (b) O2 concentration (○) and soluble COD (■); (c) Granule size distribution.
Processes 05 00041 g006
Figure 7. Cycle profile on day 162 with aeration rate of 1.4 cm s−1. (a) Nitrogen compound concentrations and pH: N-NH4+ (○), N-NO2 (*), N-NO3 (▲), and pH (◊); (b) O2 concentration (○) and soluble COD (■); (c) Granule size distribution.
Processes 05 00041 g007
Figure 8. (a) Inoculum by activated sludge in SBR I. The bar represents 50 μm. (b) Inoculum by aerobic granules in SBR II. The bar represents 2 mm.
Processes 05 00041 g008
Table 1. Nitrogen removal efficiencies in SBR I and SBR II.
ParameterSBR ISBR II
NH+4 oxidation (%)74.470.4
TN removal (%)33.430.4
Nassimilated (%) a93.182.2
Ndenitrifed (%) a6.917.8
a Calculated as the percentage with regard to TN removal.
Table 2. Specific activity rates in SBR III operated with three different upflow gas velocities.
CycleUpflow gas Velocity (cm s−1)Specific Activities (g g −1 VSS d−1)Granule Diameter (mm)
Day CODN-NH4+N-NO2N-NO3
1401.042.770.220.070.0032.4
1521.262.660.340.090.021.9
1621.403.350.350.120.021.5
Table 3. Nitrogen removal efficiencies in SBR III operated with three different upflow gas velocities.
ParameterAeration Rate 1.04 (cm s−1) Day 140Aeration Rate 1.26 (cm s−1) Day 152 Aeration Rate 1.40 (cm s−1) Day 162
TN removal (%)18.455.048.9
Nassimilated (%) a10044.556.4
Ndenitrifed (%) a055.543.6
a Calculated as the percentage with regard to TN removal.
Table 4. Municipal wastewater composition and synthetic medium.
CompoundsConcentration g L−1
Synthetic medium
CH3COONa3H2O2.000
Municipal wastewater
NH4+0.040
PO4−30.014
NaCl0.080
SO42−0.012
Adapted from Jungles et al. (2014).

