Mechanical-Damage Behavior of Mortars Reinforced with Recycled Polypropylene Fibers
by
 , and
, and
Gerardo Araya-Letelier
1,*, 
Pablo Maturana
1,
Miguel Carrasco
2 ,
,
Federico Carlos Antico
3 and
María Soledad Gómez
1 1
Escuela de Construcción Civil, Pontificia Universidad Católica de Chile, Avenida Vicuña Mackenna 4860, Macul, Santiago 7820436, Chile
2
Facultad de Ingeniería y Ciencias, Universidad Adolfo Ibáñez, Avenida Diagonal Las Torres 2640, Peñalolén, Santiago 7941169, Chile
3
Facultad de Ingeniería y Ciencias, Universidad Adolfo Ibáñez, Avenida Padre Hurtado 750, Viña del Mar, Viña del Mar 2581907, Chile
*
Author to whom correspondence should be addressed.
Sustainability 2019, 11(8), 2200; https://doi.org/10.3390/su11082200
Submission received: 7 March 2019
/
Revised: 5 April 2019
/
Accepted: 5 April 2019
/
Published: 12 April 2019
(This article belongs to the Special Issue Sustainability in Civil Engineering: from Sustainable Materials to Sustainable Structures)
Abstract
:Commercial polypropylene fibers are incorporated as reinforcement of cement-based materials to improve their mechanical and damage performances related to properties such as tensile and flexural strength, toughness, spalling and impact resistance, delay formation of cracks and reducing crack widths. Yet, the production of these polypropylene fibers generates economic costs and environmental impacts and, therefore, the use of alternative and more sustainable fibers has become more popular in the research materials community. This paper addresses the characterization of recycled polypropylene fibers (RPFs) obtained from discarded domestic plastic sweeps, whose morphological, physical and mechanical properties are provided in order to assess their implementation as fiber-reinforcement in cement-based mortars. An experimental program addressing the incorporation of RPFs on the mechanical-damage performance of mortars, including a sensitivity analysis on the volumes and lengths of fiber, is developed. Using analysis of variance, this paper shows that RPFs statistically enhance flexural toughness and impact strength for high dosages and long fiber lengths. On the contrary, the latter properties are not statistically modified by the incorporation of low dosages and short lengths of RPFs, but still in these cases the incorporation of RPFs in mortars have the positive environmental impact of waste encapsulation. In the case of average compressive and flexural strength of mortars, these properties are not statistically modified when adding RPFs.
1. Introduction
Cement-based materials (e.g., mortar and concrete) present advantages such as good compressive strength, fire resistance and durability [1], but they are also characterized by limited tensile strength and fracture toughness, and early-age cracking [2,3]. Additionally, as the cement industry contributes 5% to 7% to global anthropogenic CO2 emissions [4], cement-based materials also generate significant environmental impacts derived from their production. Production of mortar and concrete faces new challenges nowadays, in addition to the requirement of high strength of the past decades, which are focused on the extension of life span by reducing its porosity and controlling crack growth. The latter challenges can be tackled valorizing waste from other industries following the concepts of sustainability and circular economy [5].
Reinforcing fibers can be incorporated to enhance the limited tension strength, fracture performance and early-age cracking, among other properties, of cement-based materials and the level of these improvements depends on different fiber factors (e.g., length, aspect ratio, roughness, strength, and Young’s modulus) as well as matrix factors (e.g., aggregate size, strength and Young’s modulus) [3]. Most of the industrialized reinforcing fibers, specifically designed to reinforce cement-based materials, are made of steel, polypropylene, and glass, and their successful impact improving the mechanical-damage performance of cement-based materials has been studied and it is well known [6,7,8,9,10,11,12,13]. However, the production of industrialized fibers has economic and environmental impacts. In particular, the polypropylene production represents approximately 20% of the total plastic production of the European Community in 2018 and, currently, polypropylene presents the largest consumption growing rates among plastics [14]. In terms of fibers, the production of polypropylene fibers reached approximately 6 million metric tons in 2010 [15] and as 79% of the total worldwide plastic production ends up in landfill or disposed in our environment [16], most of these 6 million metric tons of polypropylene fiber will not be recycled, affecting our environment.
Combining the significant environmental impacts of cement-based materials and the impacts derived from the production of industrialized fibers, it is easy to understand why the use of alternative and more environmentally friendly fibers have attracted more attention in the research materials community [17,18] that is moving towards a more sustainable construction industry. Recently, there have been studies addressing the use of fibers from vegetal origin (e.g., [19,20]), animal origin (e.g., [21]), and waste-based plastic origin (e.g., [22]) in cement-based materials. Particularly, to the best of the authors’ knowledge, there have been few studies analyzing the incorporation of waste-based polypropylene fibers in cement-based materials. Bendjillali et al. [23] evaluated the compressive and flexural strength and the shrinkage behavior of mortars exposed to three different curing conditions and reinforced with waste-based polypropylene fibers from the production of sweeps and brushes and the results indicated a small increment in strength due to fiber addition in mortars exposed to hot-dry environments and a large reduction of shrinkage in fiber-reinforced mortars exposed to hot-dry environments (compared to plain mortars). Bendjillali et al. [24] addressed the characterization of the morphological and mechanical properties of waste-based polypropylene fibers and this study also evaluated the impact of these fibers on the shrinkage, and compressive and flexural strength of cement-based mortars finding that shrinkage can be reduced up to 50% with the incorporation of fibers while the overall mechanical behavior was not affected. Bendjillali and Chemrouk [25] studied the implementation of these waste-based polypropylene fibers as a secondary reinforcement in steel-bar reinforced concrete specimens finding a small increment in compressive and flexural strength and a reduction in the number and dimension of cracks. Pacheco-Torgal et al. [26] presented an extensive literature review addressing the use of recycled plastic in concrete, including recycled polypropylene fibers manufactured from industrial plastic waste, whose manufacturing process, chemical properties and mechanical properties were studied. Although these research efforts have contributed to the characterization and incorporation of these waste-based polypropylene fibers into cement-based materials, there are still important waste-based polypropylene fiber properties (e.g., roughness) and fiber-reinforced cement-based material fracture properties (e.g., flexural toughness) that need to be studied. As a result of the latter, the concept of circular economy can be incorporated if polypropylene fibers are recovered from waste.
The novelty of this paper resides in characterizing recycled polypropylene fibers (RPFs) obtained from used and discarded sweeps and addressing some of the most relevant benefits (e.g., increment of flexural toughness and impact strength) and potential disadvantages (e.g., reduction of compressive strength) of adding these RPFs to cement-based mortars. In particular, the objectives of this study are: (i) to characterize the most relevant morphological properties of these RPFs; (ii) to assess the influence of these RPFs on the mechanical properties of mortars; (iii) to assess the influence of these RPFs on the fracture behavior of mortars; and (iv) to perform a sensitivity analysis on the impact of volumes and lengths of RPFs on the aforementioned mechanical-damage properties of mortars. The study of the latter properties allows to explore the real potential of the incorporation of these RPFs either enhancing the performance of cement-based materials and/or reducing environmental impacts derived from the production of new reinforcing fibers and the encapsulation of these waste-based fibers.
2. Materials and Methods
2.1. Mortar Materials
The constituent materials used for the confection of the fiber-reinforced mortars used in this study were cement, sand, water, plasticizer and RPFs (that were obtained from used and discarded sweeps). Table 1 provides the main materials’ properties used in the preparation of the mortar mixes (except for RPFs whose materials properties are provided later in this paper). It is important to note that the use of plasticizer was implemented to provide a uniform distribution of the reinforcing fibers in order to avoid the formation of clusters that can reduced the mechanical properties of mortars.
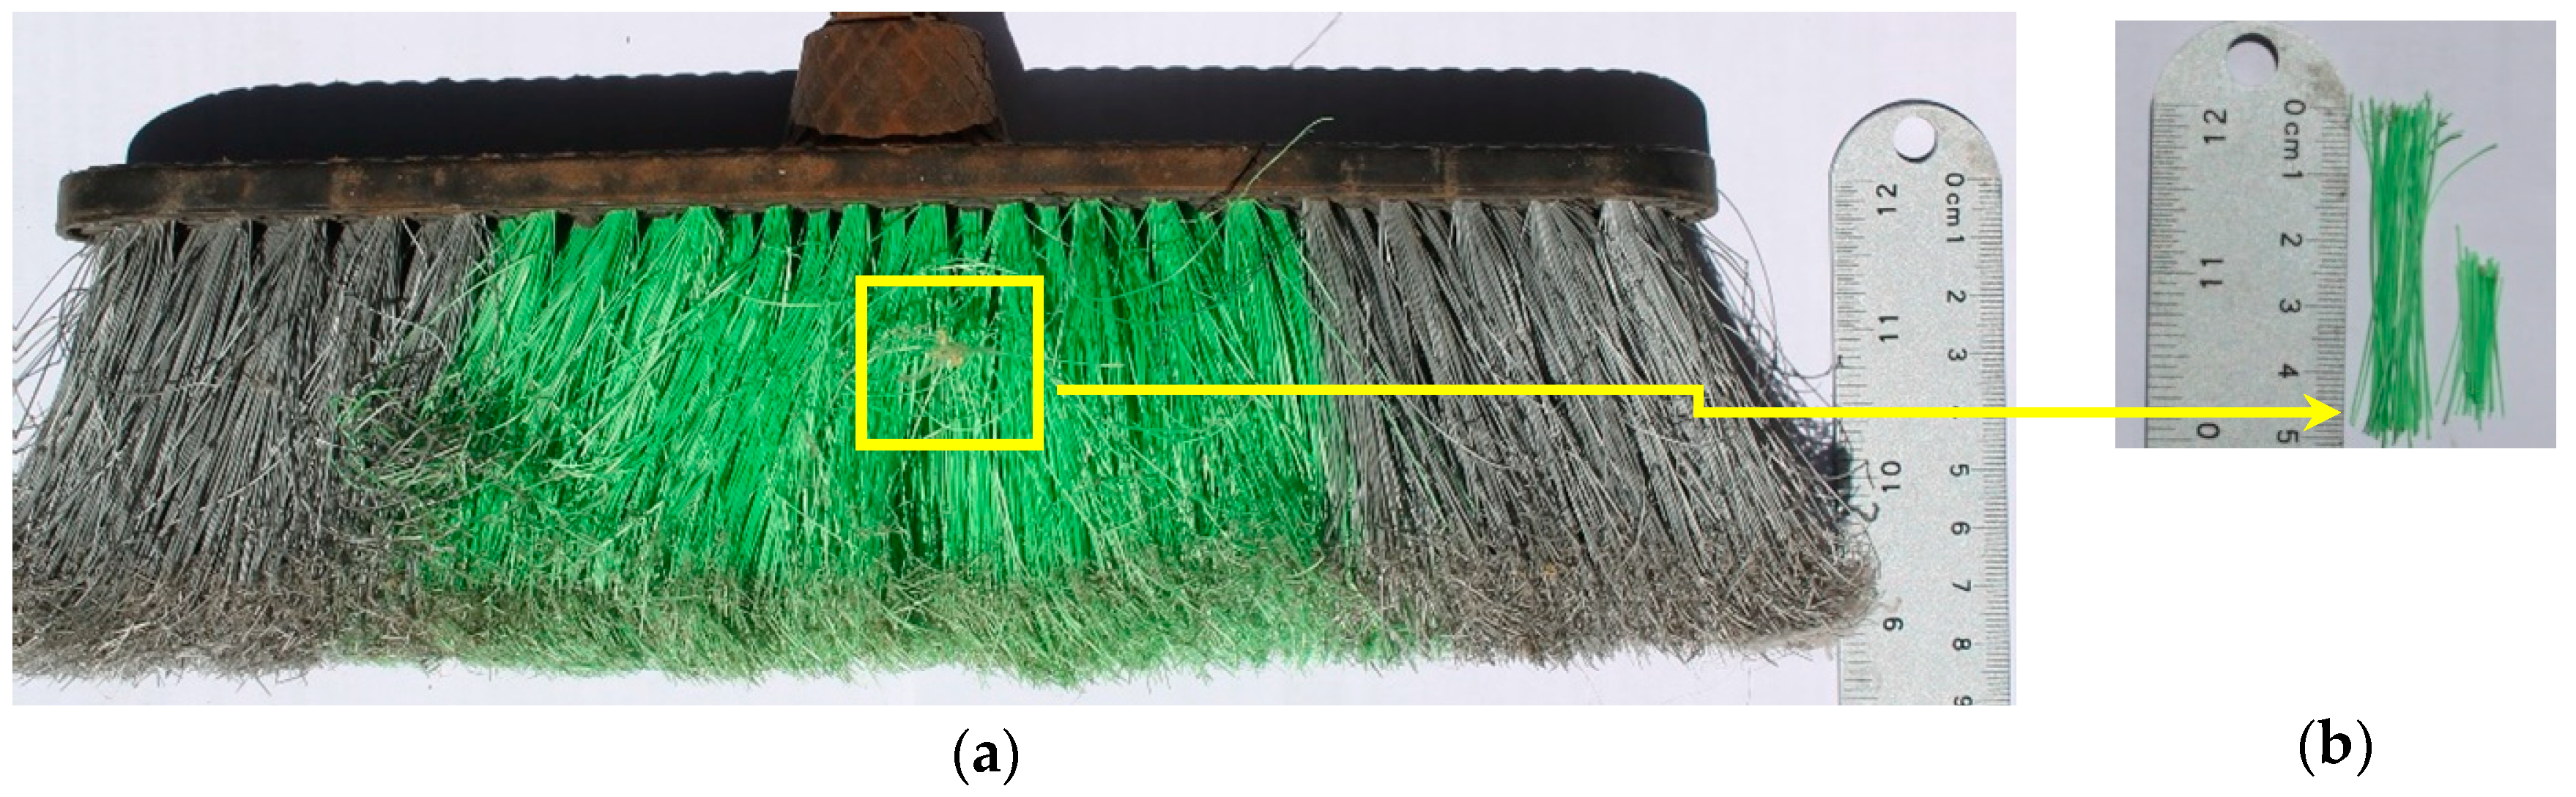
Figure 1a shows one of the used and discarded domestic sweeps collected by this study to obtain RPFs. In general, the infill sweeps’ fibers were 70 mm long, and the bottom 10 to 30 mm of the fibers were usually damaged due to usage. Therefore, it was decided to cut and discard the bottom parts and the remaining parts of the fibers were cut to obtain 20 and 50 mm long RPFs and washed to remove dirt and, as shown in Figure 1b.
Table 2 provides the main properties of the RPFs used in this paper and obtained from previous studies (e.g., [23,24]). Since the values presented in Table 2 are average values and the variability in those properties might be significant due to the recycled nature and possible degradation of the fibers addressed in this paper, further research needs to be performed evaluating the dispersion of the physical and mechanical properties of these RPFs and comparing those properties to virgin fibers to assess possible degradation. Complementary morphological properties, such as surface roughness, as well as corroboration of diameter dimensions and aspect ratios are provided later in this study for these RPFs.
2.2. Mortar Mix Proportions
The materials introduced in Table 1 and 2 were used to prepared five different mortar mixes (one plain mortar mix, used as control, and four mortar mixes reinforced with different dosages and/or lengths of RPFs). The dosages of RPFs used in this study were 0 (plain mortar), 2 and 8 kg/m3 of mortar and the RPFs’ lengths were 0 (plain mortar), 20 and 50 mm. Table 3 provides the material proportions used in each mortar mix as well as the mortar mix identification (ID) code, where the first number indicates the dosage and the second number indicates the length of the RPFs (e.g., M0-0, indicates 0 kg/m3 and 0 mm length of RPFs, therefore, plain mortar). Dosages of commercially available polypropylene fibers usually vary between 4 and 9 kg/m3 in weight and between 0.4% and 1% in volume [27]. This study selected dosages ranging from 2 to 8 kg/m3, which is similar to the range suggested for commercially available polypropylene fibers and equivalent to the range suggested in a previous study [18] addressing the effectiveness of a new natural fiber that morphologically was similar to the RPFs presented in this study.
2.3. Mortar Specimen Preparation
Table 4 presents the main information of the specimens confectioned for each mortar mix defined in Table 3. It is important to highlight that the number of specimens prepared for each mortar mix and for each test was relatively large (six specimens) in order to perform reliable analysis of variance (ANOVA) tests to evaluate the statistical significance of the incorporation of these RPFs on the mechanical-damage behavior of mortar mixes.
In terms of mortar preparation, the following mechanical mixing procedure was implemented. First, fibers, cement and sand were mixed in a sealed (to avoid loss of cement and sand) mechanical mixer for 3 min. Then, water and plasticizer were added and another 3 min of mixing were performed. Finally, the mixes were left for 3 min without mixing and this resting time was followed by a final 2 min mixing. After mixing, compaction was implemented placing the molds of the specimens on a vibration table and filling the specimens with mortar. Immediately after confection, the specimens were sealed and cured in laboratory condition at 22 °C for 24 h. Finally, 24 h after confection, the specimens were demolded and immersed under water at 22 °C to cure them until testing at 28 days.
2.4. Morphological Properties of RPFs
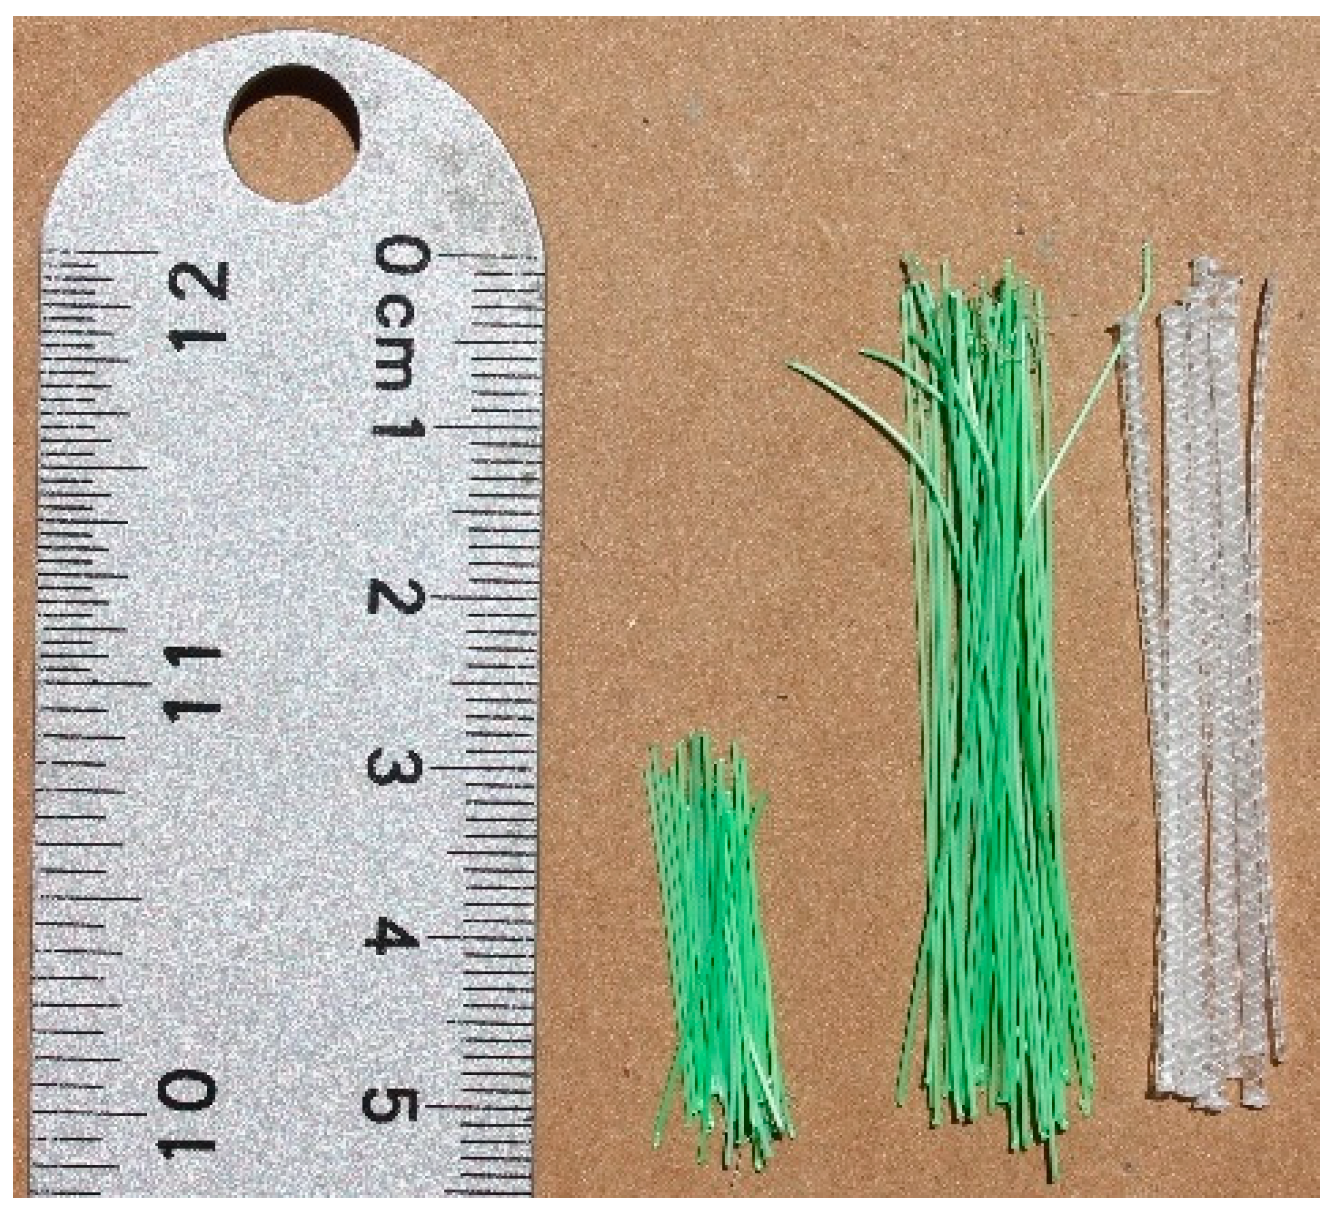
Morphological properties such as surface roughness and fiber diameter of RPFs were determined using microscopy analysis over a sample of 50 RPFs. Surface roughness is an important morphological property that helps to understand the mechanical bonding interaction that generates load transfer between the RPFs and the mortar matrix. The estimation of surface roughness was obtained in accordance with the standard DIN 4766 [28]. Since it was evident that the surface roughness of the RPFs was lower than the surface roughness of commercially available polypropylene fibers specially designed to reinforced cement-based materials, this study also estimated the surface roughness of one commercial polypropylene fiber (“SikaFiber®Force PP-48” [27] macro synthetic polypropylene fibers, which satisfied the standard ASTM C1116 [29]) and compared that value to the surface roughness obtained for RPFs. Figure 2 shows a photograph of the RPFs obtained in this study and the SikaFiber®Force PP-48 fibers used as comparison in terms of surface roughness. Regarding diameter measurements, these measurements were taken at the mid-section of the RPFs.
2.5. Compressive Strength
The compressive strength of each mortar mix was assessed using a force-based loading protocol (1.0 MPa/s), following the standard BS-EN 12390-3 [30], and the individual compressive strength () values of each cube specimen were calculated using Equation (1):
where and are the maximum load at failure and the cross-sectional area of the specimen on which the force acts, respectively. For each mortar mix, average (AV), standard deviation (SD) and coefficient of variation (COV) values of were calculated.
2.6. Flexural Strength and Flexural Toughness Indices
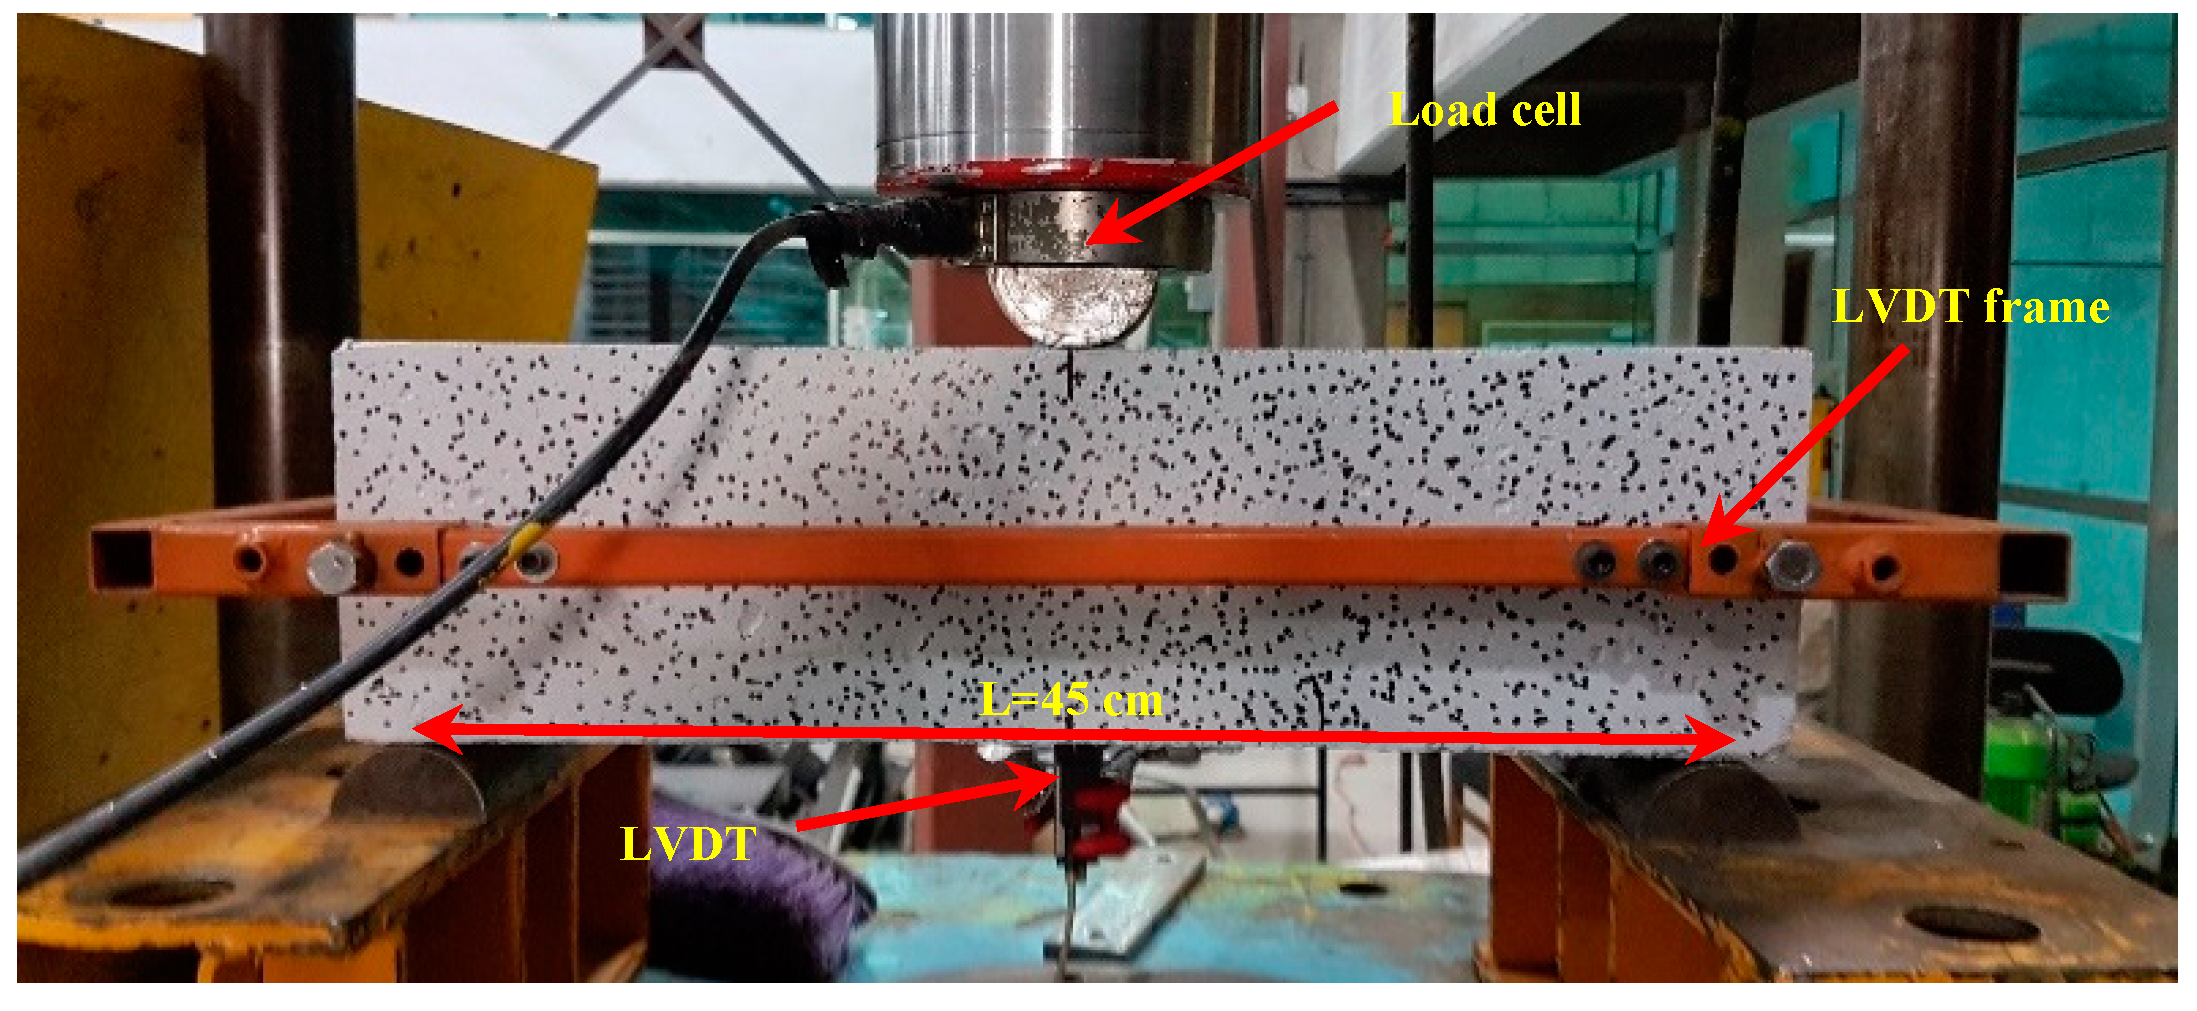
The flexural experimental setup of this study was a three-point bending test with a span of 450 mm between supports and a displacement-controlled loading protocol of 1 mm/min, whose loads were measured using a load cell. A linear variable differential transducer (LVDT), supported by a steel frame, was located at the midspan section of the prism specimens to measure midspan deflections that. The deformations measured with LVDTs were complemented by digital image correlation (DIC) implemented using the open source software Ncorr [31] as seen in Figure 3. To provide accurate DIC results, there should be a calibration in terms of the initial measurements of the dimensions of the specimen before loading that need to be captured by the camera to calibrate the subsequent total deformations as well as the normalized deformations (strains). This setup was very similar to the flexural experimental setup used previously by Araya-Letelier et al. [32,33,34] to assess the flexural behavior of adobe mixes reinforced with natural and synthetic fibers. The individual flexural strength () values of each prism specimen were estimated using Equation (2).
where is the maximum load at failure, L is the span between supports (450 mm), B (150 mm) is the width at the fracture section of the prism specimen and H (150 mm) is the depth at the fracture section of the prism specimen. For each mortar mix, values of AV, SD, and COV of were calculated.
For cement-based materials, flexural toughness provides an indication of fracture energy absorption capacity [35] and the incorporation of fibers is expected to impact flexural toughness [32,33,36]. Consequently, this study evaluated the flexural toughness indices of each mortar mix according to the standard ASTM C1018 [37]. Flexural toughness indices were calculated as the area under the bending-force versus midspan-displacement curve up to a specified value of the midspan-displacement, which was normalized by the area under the bending-force versus midspan-displacement curve up to the value of the midspan-displacement where the first crack (δ) occurred. Flexural toughness indices I5, I10, and I 20 were calculated using the midspan-displacement corresponding to 3δ, 5.5δ and 10.5δ, respectively. It is important to note that the minimum value of any toughness index is 1.0, which indicates a brittle failure-mode where the specimen collapses immediately after the formation of the first crack. Therefore, the behavior of the material can change from brittle to quasi-brittle as the values of toughness indices increase due to the addition of fibers. For each mortar mix, values of AV and SD of toughness indices were calculated from each individual bending load versus midspan-displacement curve of each mortar mix.
2.7. Impact Strength
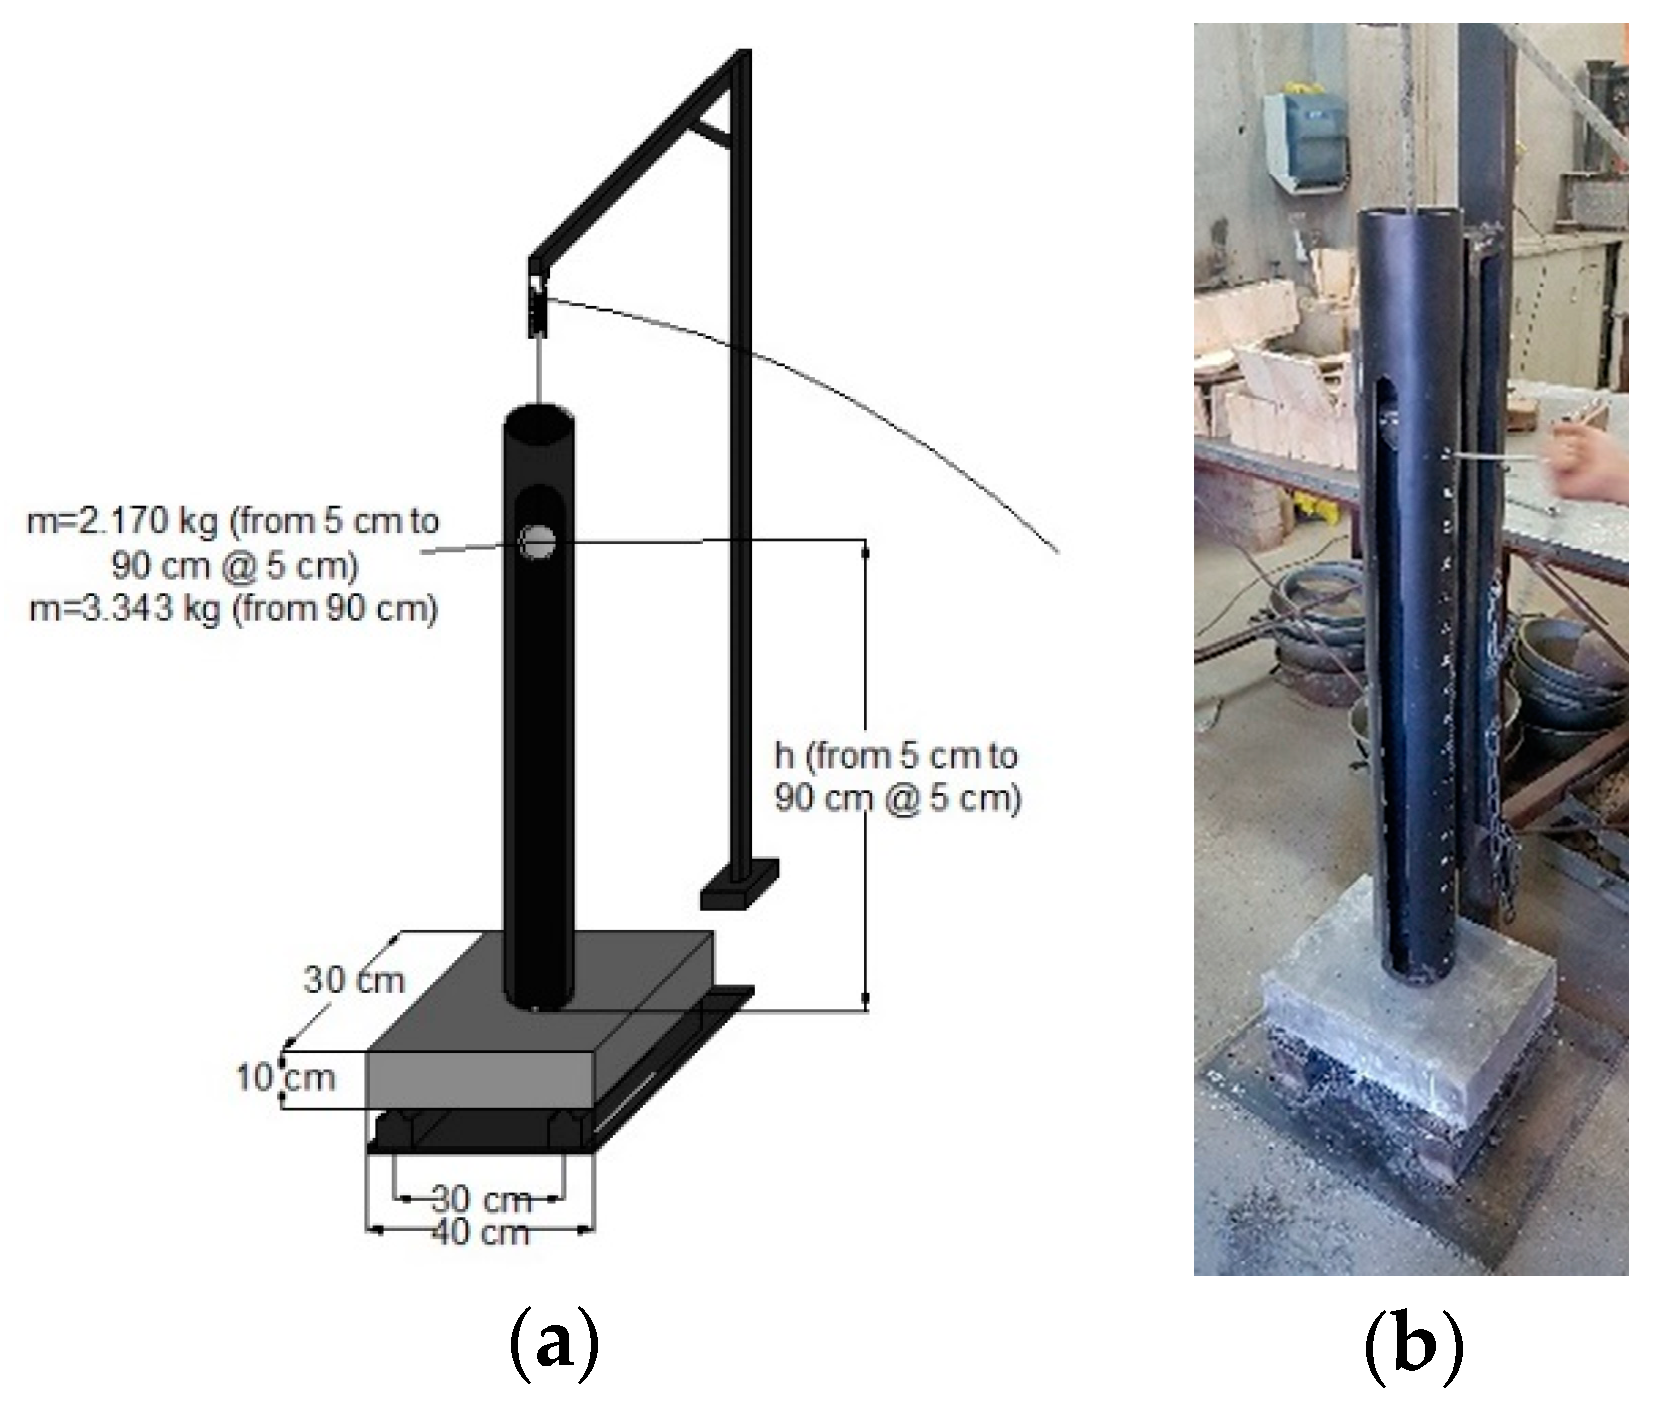
Since fracture toughness of mortars is expected to be enhanced with incorporation of fibers [38], several studies (e.g., [17,18,19]) have suggested the implementation of the impact test to assess the impact strength of cement-based mortars to absorb damage. This study used an experimental setup that consists of a metallic supporting base for the slab specimens (30 cm distance between supports) and a metallic projectile that was thrown at the center of the slab specimens at increasing height levels (from 5 to 90 cm every 5 cm). The mass of the metallic projectile was 2.170 kg for heights ranging from 5 to 90 cm and then, after the first drop at 90 cm, the consecutive drops were executed using a 3.343 kg metallic projectile (see Figure 4). The drops required to generate both the first crack as well as the collapse of each slab specimen were counted. The impact energy per blow () was estimated using Equation (3).
where represents the mass of the metallic projectiles (either 2.170 or 3.343 kg), g is the constant of gravitational acceleration (9.81 m/s2) and h represents the varying height at which the projectile was thrown (from 5 to 90 cm every 5 cm). For each mortar mix, values of AV, SD, and COV of the cumulative impact energy at first crack and at collapse were calculated.
2.8. Analysis of Variance of Experimental Results
The analysis of variance (ANOVA) was used in this study to evaluate the statistical significance of the effect of the incorporation of RPFs on the mechanical-damage performance of mortars. First, the one-way ANOVA test was implemented to assess the existence of differences among the AV behavior within the five mortar mixes (M0-0, M2-20, M2-50, M8-20, and M8-50) under a specific experimental test (e.g., flexural strength).
The one-way ANOVA compared the null hypothesis, H0, which states that the AV performance of all mortar mixes are equivalent (i.e., the addition of RPFs did not have an effect over the specific experimental performance under study), against the alternative hypothesis, HA, which indicates that at least one AV performance is different, under a specific significance level, typically 5% as implemented in this study and in several previous experimental studies (e.g., [33,39]).
If the one-way ANOVA test rejected H0, pair-wise single-factor ANOVA tests were applied to identify individually if each fiber-reinforced mortar performed, on average, different from the plain mortar mix under a specific test.
These ANOVA tests calculate a critical F value (Fcr) that is a function of the number of groups under study (e.g., five mortars for one-way ANOVA tests), the significance level (5% in this paper) and the number of values obtained for each group under study (six specimens were tested for each mortar mix at each specific test).
For each ANOVA test, a statistic value of f (fst) was calculated based on the experimental results and compared to Fcr. If fst was less than Fcr, this meant that the differences among the AV performance of the five mortars under a specific experimental performance were not statistically significant for the one-way ANOVA test or that the differences among the AV performance of two specific mortars were not statistically significant for the pair-wise ANOVA test.
ANOVA tests consider that sample AV values might be different among them due to two possibilities: (i) sample AV values come from different populations (called treatments that in this paper would be the incorporation of RPFs); and (ii) sample AV values come from the same population and the differences are explained by chance and/or sampling error. The implementation of the ANOVA tests demands the calculation of sums of squares (SS), means of squares (MS) and degrees of freedom (DF) for the treatment and the error, and all these values are informed for each ANOVA test implemented in this paper. The p-values (i.e., the probability of finding the observed, or even more extreme, results when H0 is true) of each ANOVA test are also provided. For more information about the ANOVA tests see [40].
3. Results and Discussion
3.1. Morphological Properties of RPFs
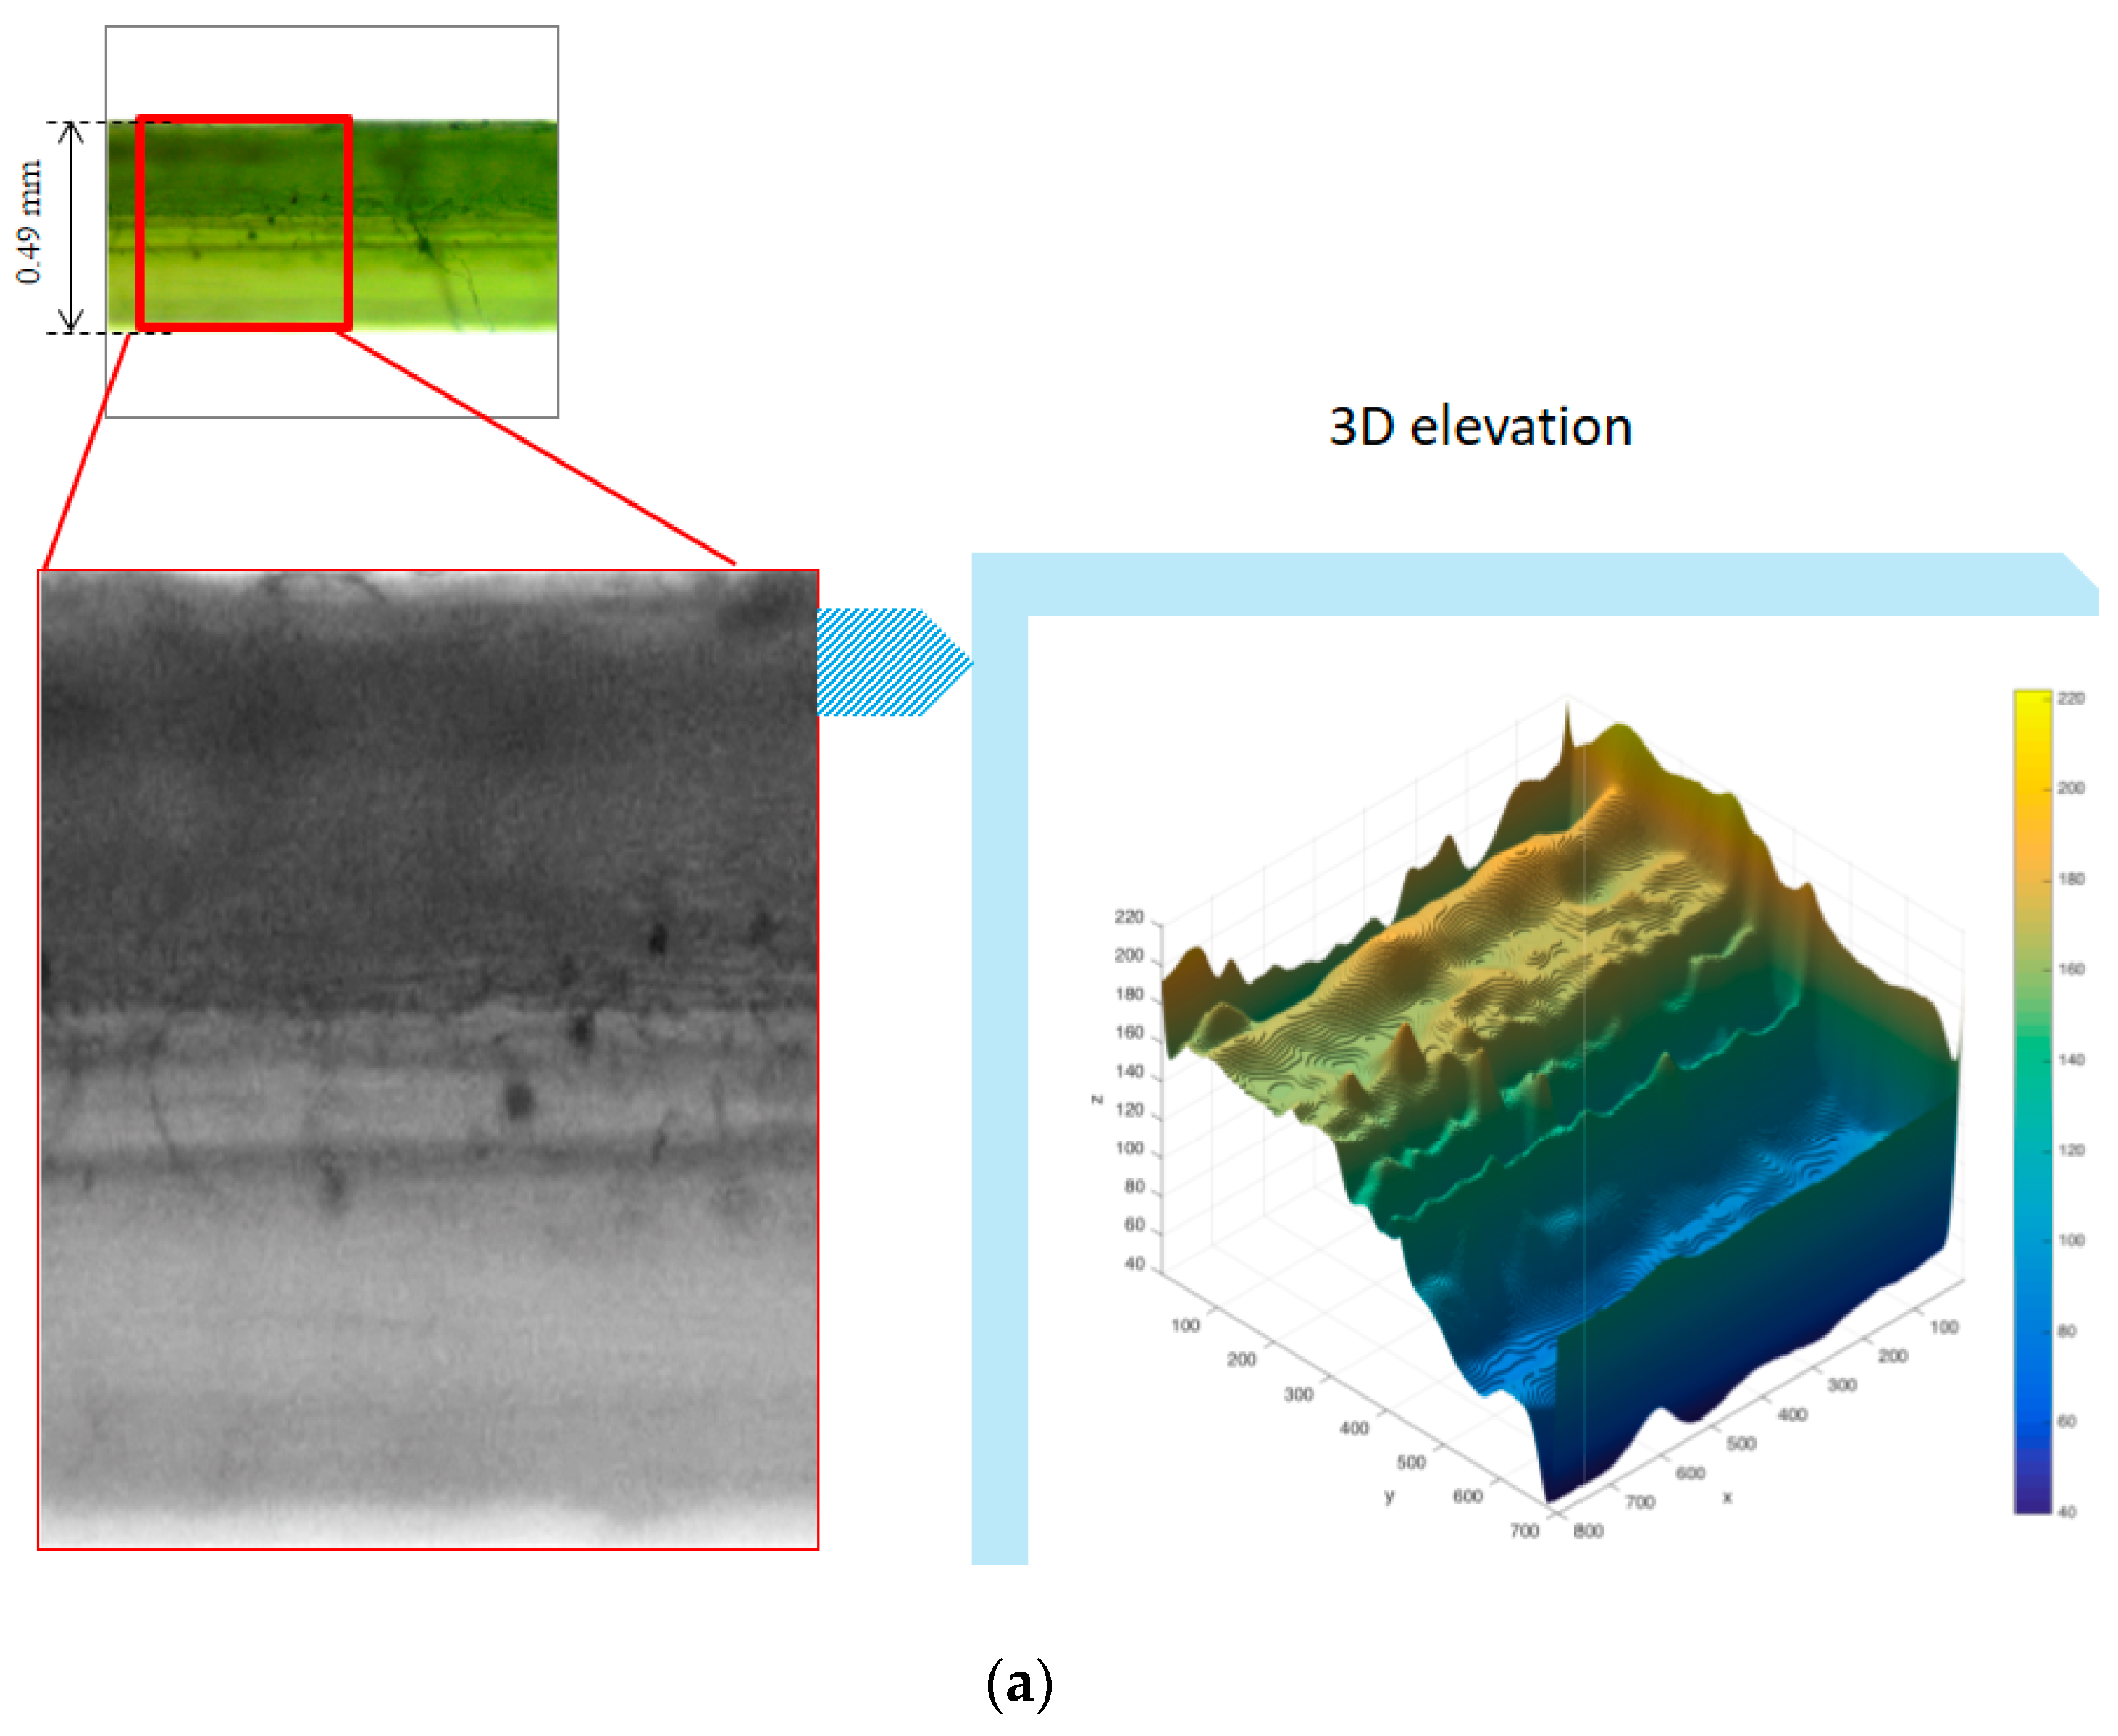
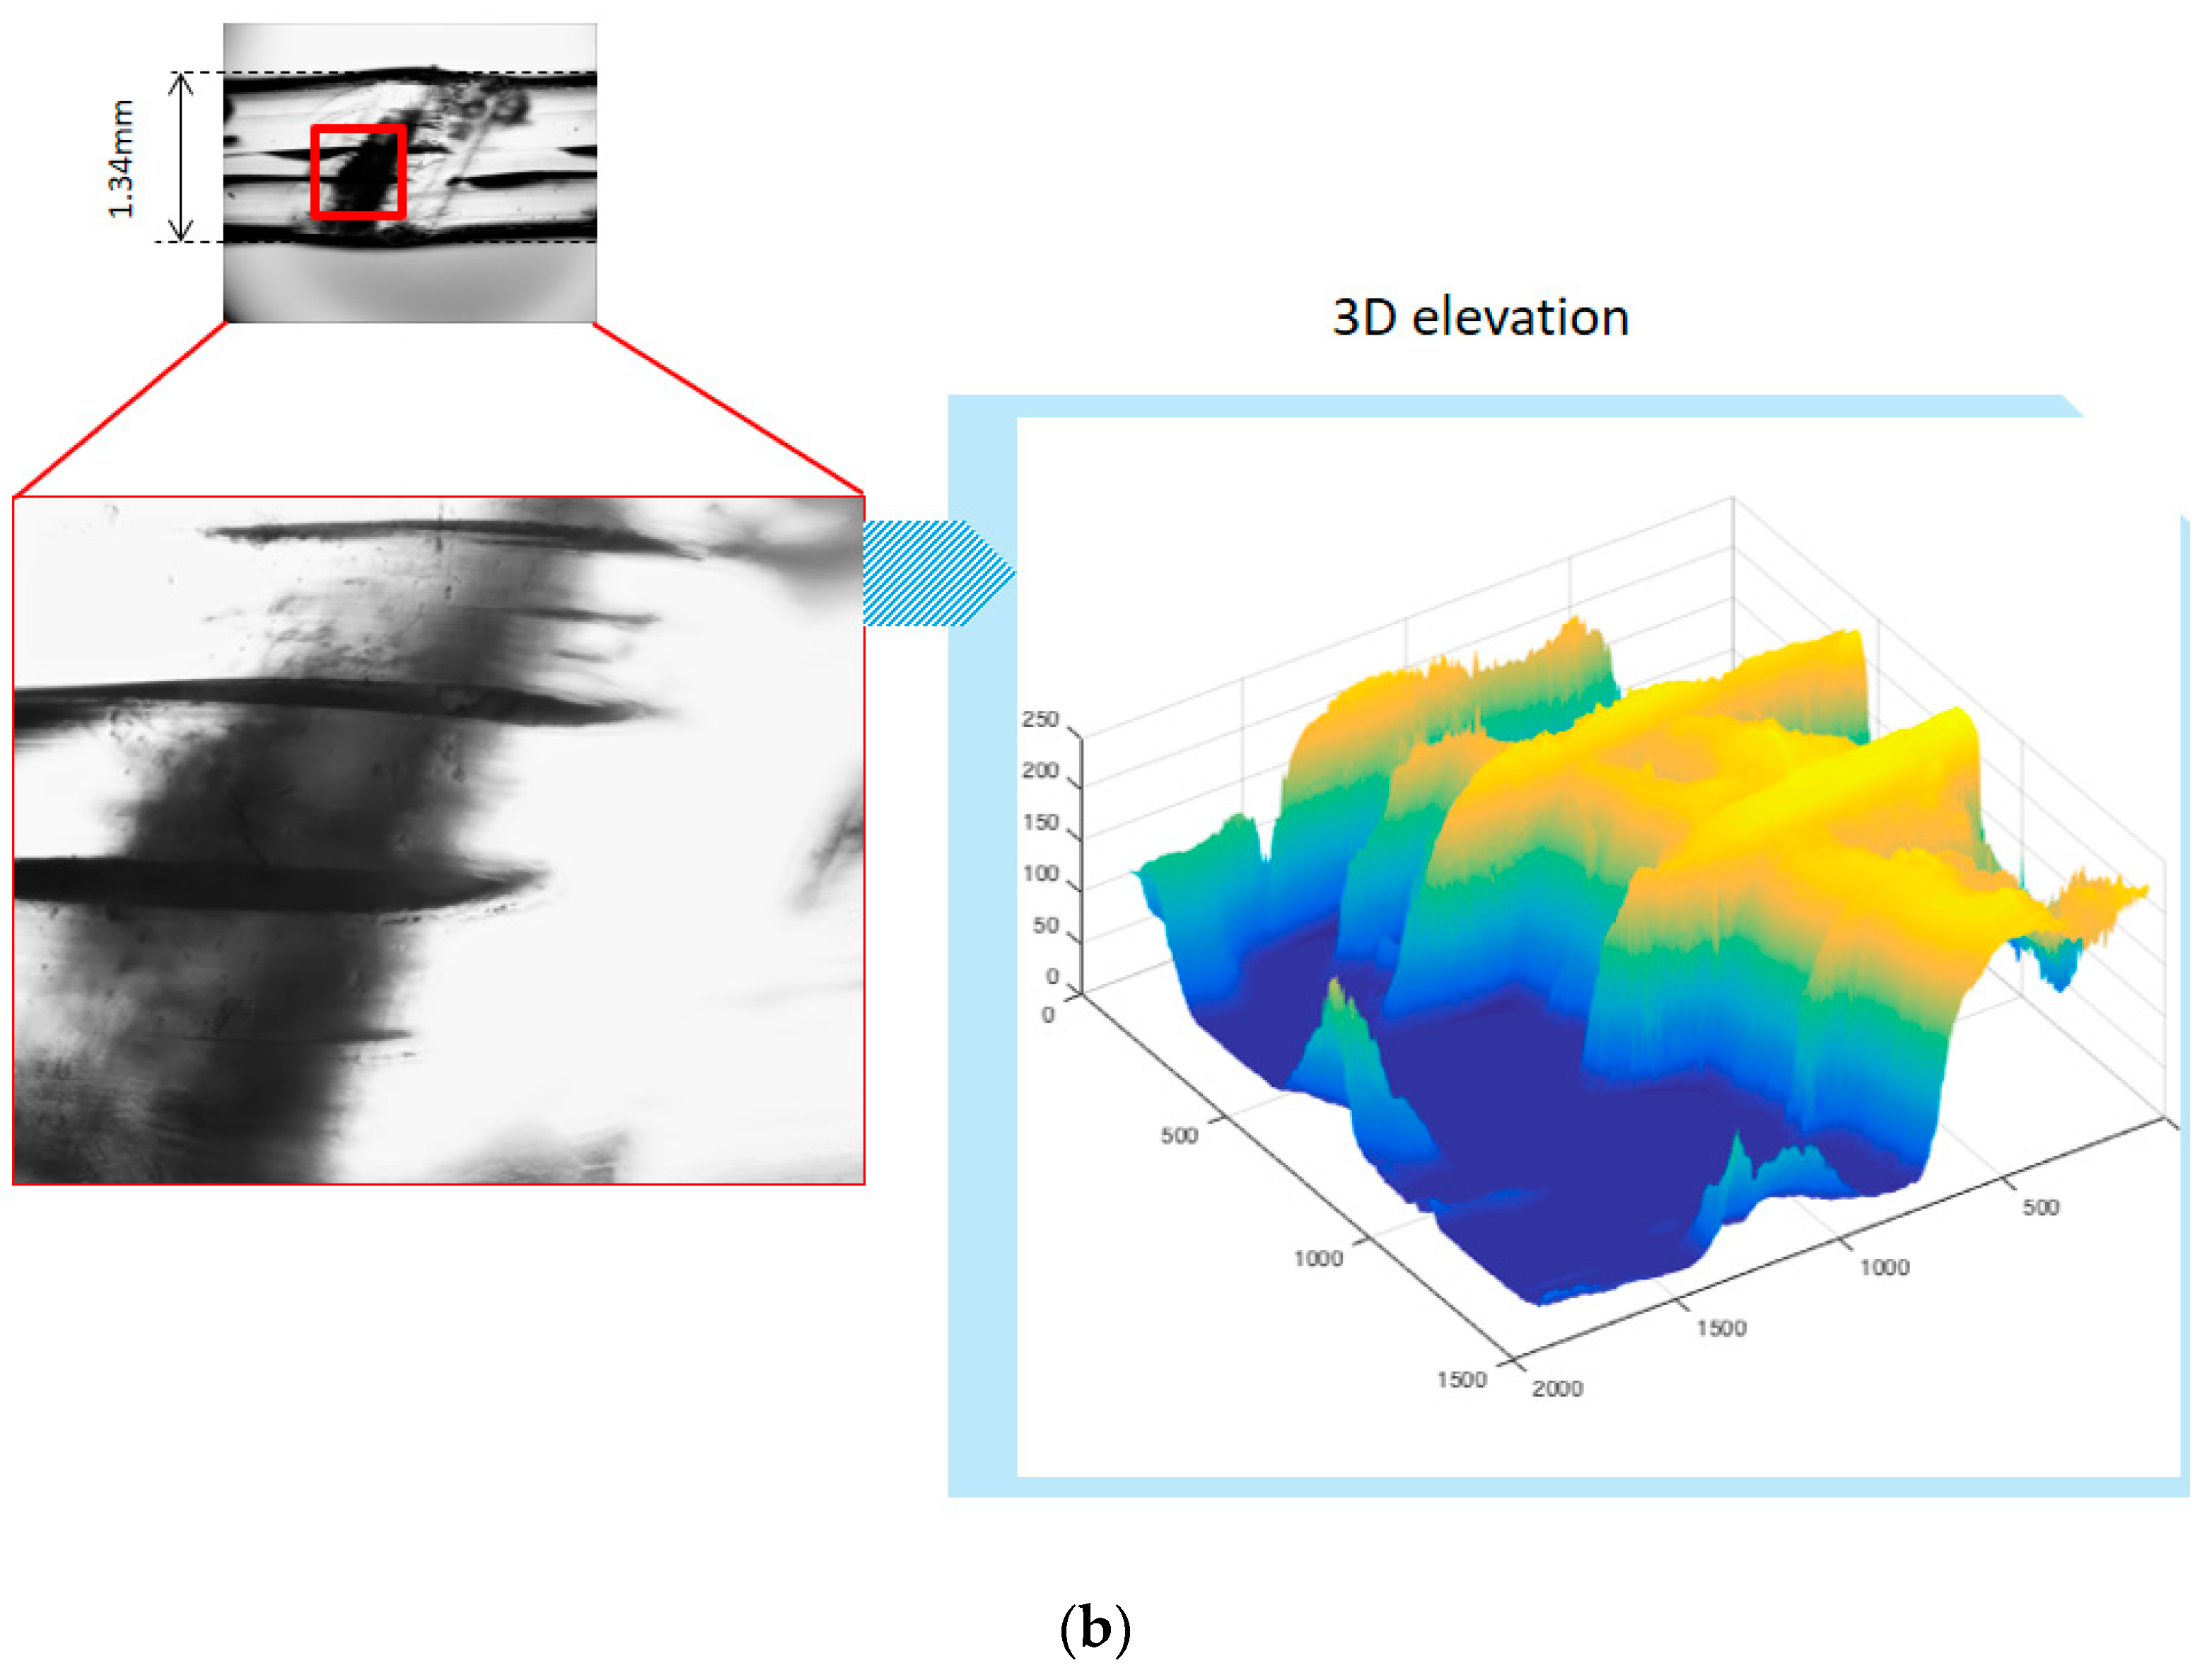
This study used a sample of 50 RPFs to assess diameters and surface roughness of RPF. Figure 5a shows a typical RPF (0.49 mm diameter), its microscopy and its 3D evaluation of its surface implemented at the mid-section. The AV value of the surface roughness of the RPFs reached 0.80 μm, a value corresponding to a roughness level N6 in the standard DIN4766 [28]. Figure 5b shows a typical Sika Fiber®Force PP-48 fiber (1.34 mm diameter), its microscopy and its 3D evaluation of its surface implemented at the mid-section. As expected, the AV roughness value of the Sika Fiber®Force PP-48 fibers was 0.2 mm, a value exceeding the maximum roughness value of 50 μm (N12) established by the standard DIN4766. This was a significant difference in roughness since the roughness of the commercial polypropylene fiber is 250 times the roughness of the RPF.
As load-displacement interaction between fibers and composite materials are influenced by mechanical and chemical bonding [41], the pull-out behavior of these RPFs would be inferior compared to commercially available polypropylene fibers (e.g., Sika Fiber®Force PP-48) that present larger roughness values since they are designed specifically as reinforcement fibers. As the roughness of the RPFs was approximately 250 times smaller than the roughness of the Sika Fiber®Force PP-48 used in this study as a roughness control, this provided initial insights that the required aspect ratio to generate an adequate load transfer between the matrix and the fiber should be larger. Therefore, this study selected one short length (e.g., 20 mm) and one long length (e.g., 50 mm), leading to a small and large aspect ratio, respectively, in order to capture two extreme behaviors of the fiber addition due to its inclusion.
With respect to diameter measurements, RPFs reached and AV value of 0.45 mm that resulted in aspect ratios of 44 and 111 for 20 mm long RPFs and 50 mm long RPFs, respectively.
3.2. Compressive Strength
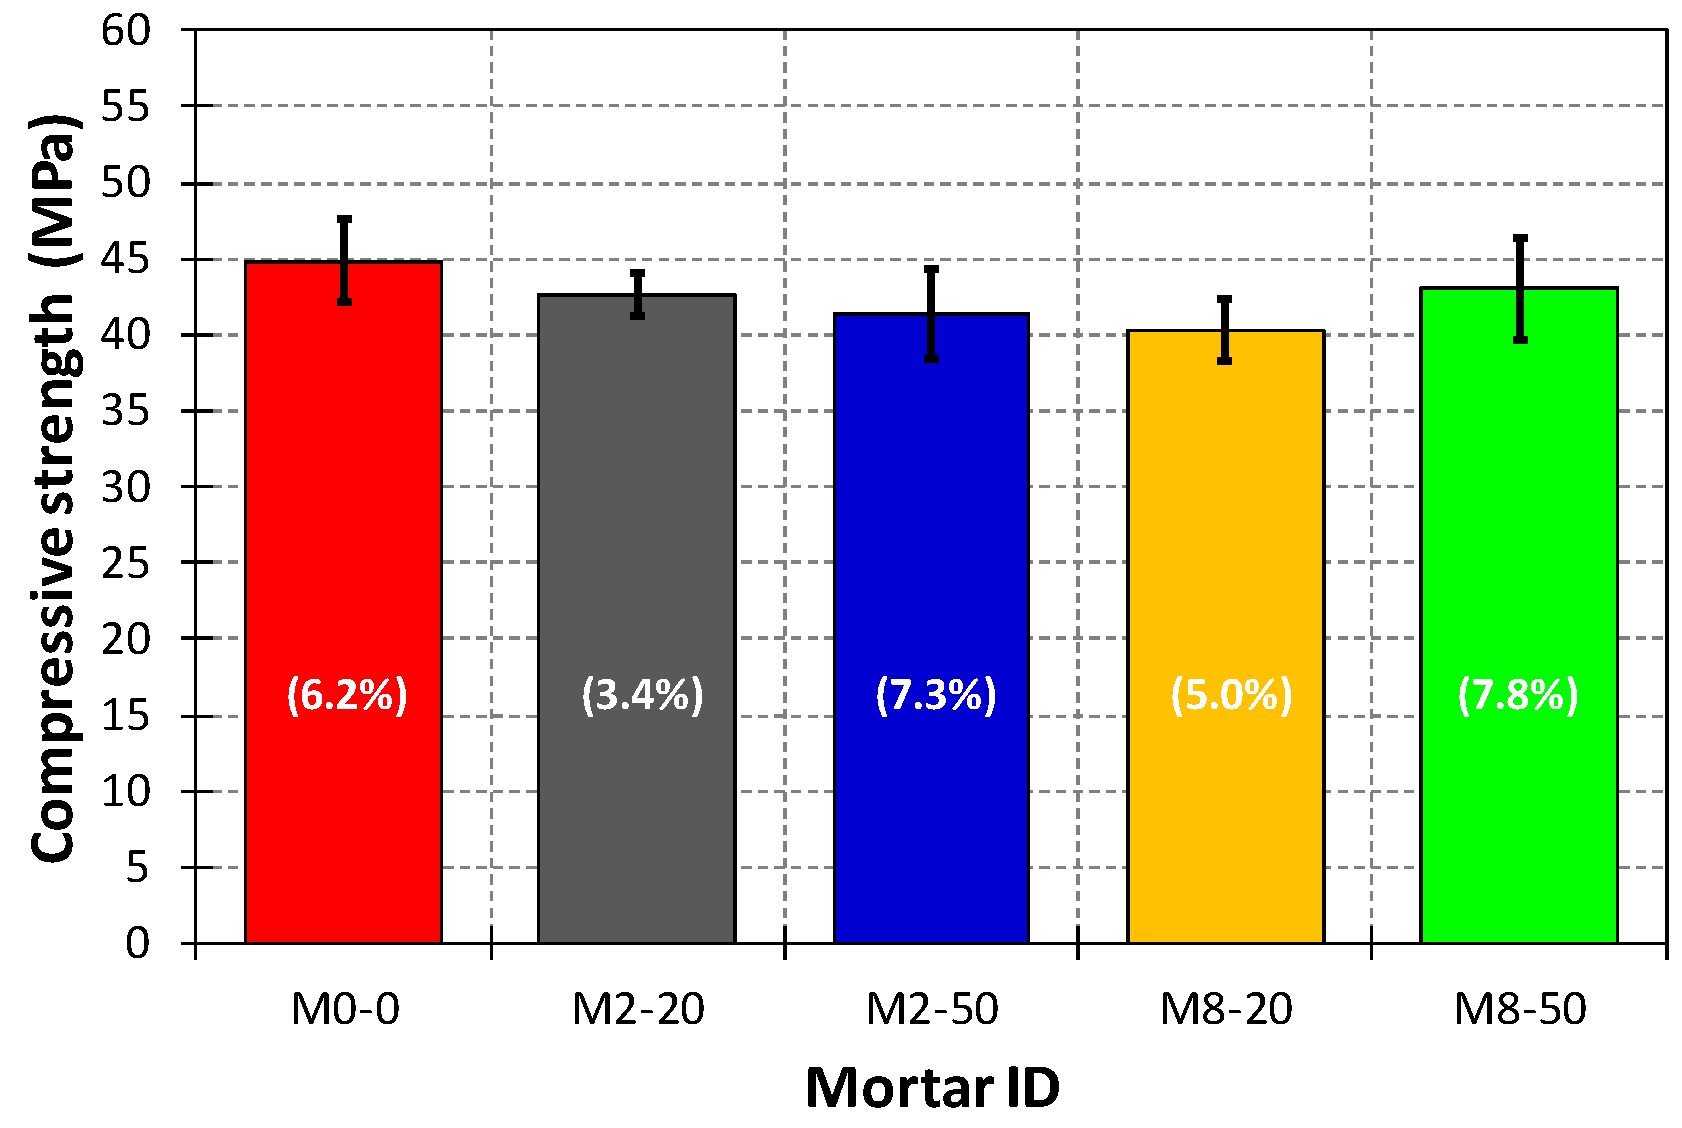
As seen in Figure 6, AV (bars), SD (error bars) and COV (percentages in each bar) values of the compressive strengths of each mortar tested ranged from 40.3 MPa (M8-20) to 44.9 MPa (M0-0), from 1.5 MPa (M2-20) to 3.4 MPa (M8-50), and from 3.4% (M2-20) to 7.8% (M8-50), respectively.
From the one-way ANOVA test of Table 5 it was observed that AV compressive strength was not statistically affected by the incorporation of RPFs, consistent with Bendjillali et al. [24]. The resulting p-value indicates that for a slightly larger significance level (e.g., 6%) the ANOVA test would have rejected the hypothesis that all the AV compressive strength performances were equal. However, the relatively large sample size used for each mortar mix (reduced epistemic uncertainty) further supports the result of the ANOVA test.
3.3. Flexural Strength and Toughness Indices
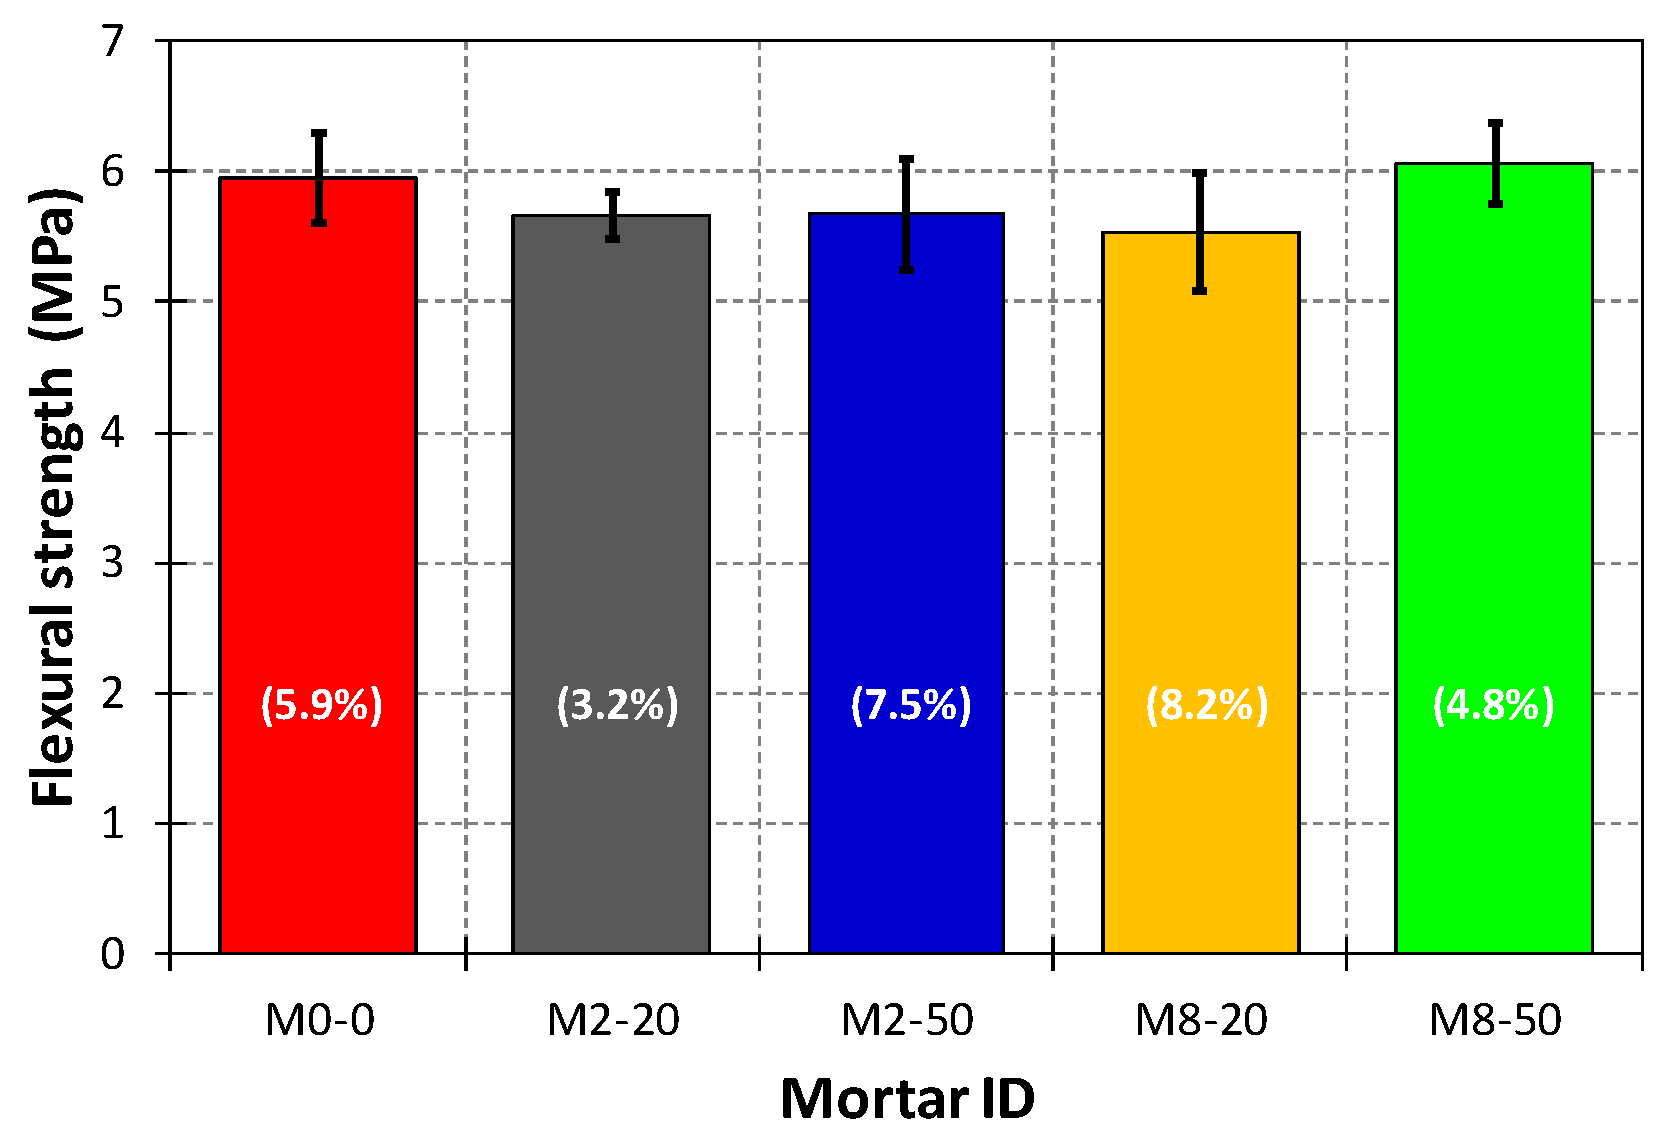
Figure 7 shows AV (bars), SD (error bars) and COV (percentages in each bar) values of the flexural strengths of each mortar tested, and these values ranged from 5.5 MPa (M8-20) to 6.1 MPa (M8-50), from 0.2 MPa (M2-20) to 0.5 MPa (M8-20), and from 3.2% (M2-20) to 8.2% (M8-20), respectively.
From the one-way ANOVA test of Table 6 it can be seen that AV flexural strength was not statistically affected by the incorporation of RPFs, also consistent with Bendjillali et al. [24]. The resulting p-value and the relatively large sample size used for each mortar mix (six prism specimens per each mortar mix) further support the result of the ANOVA test.
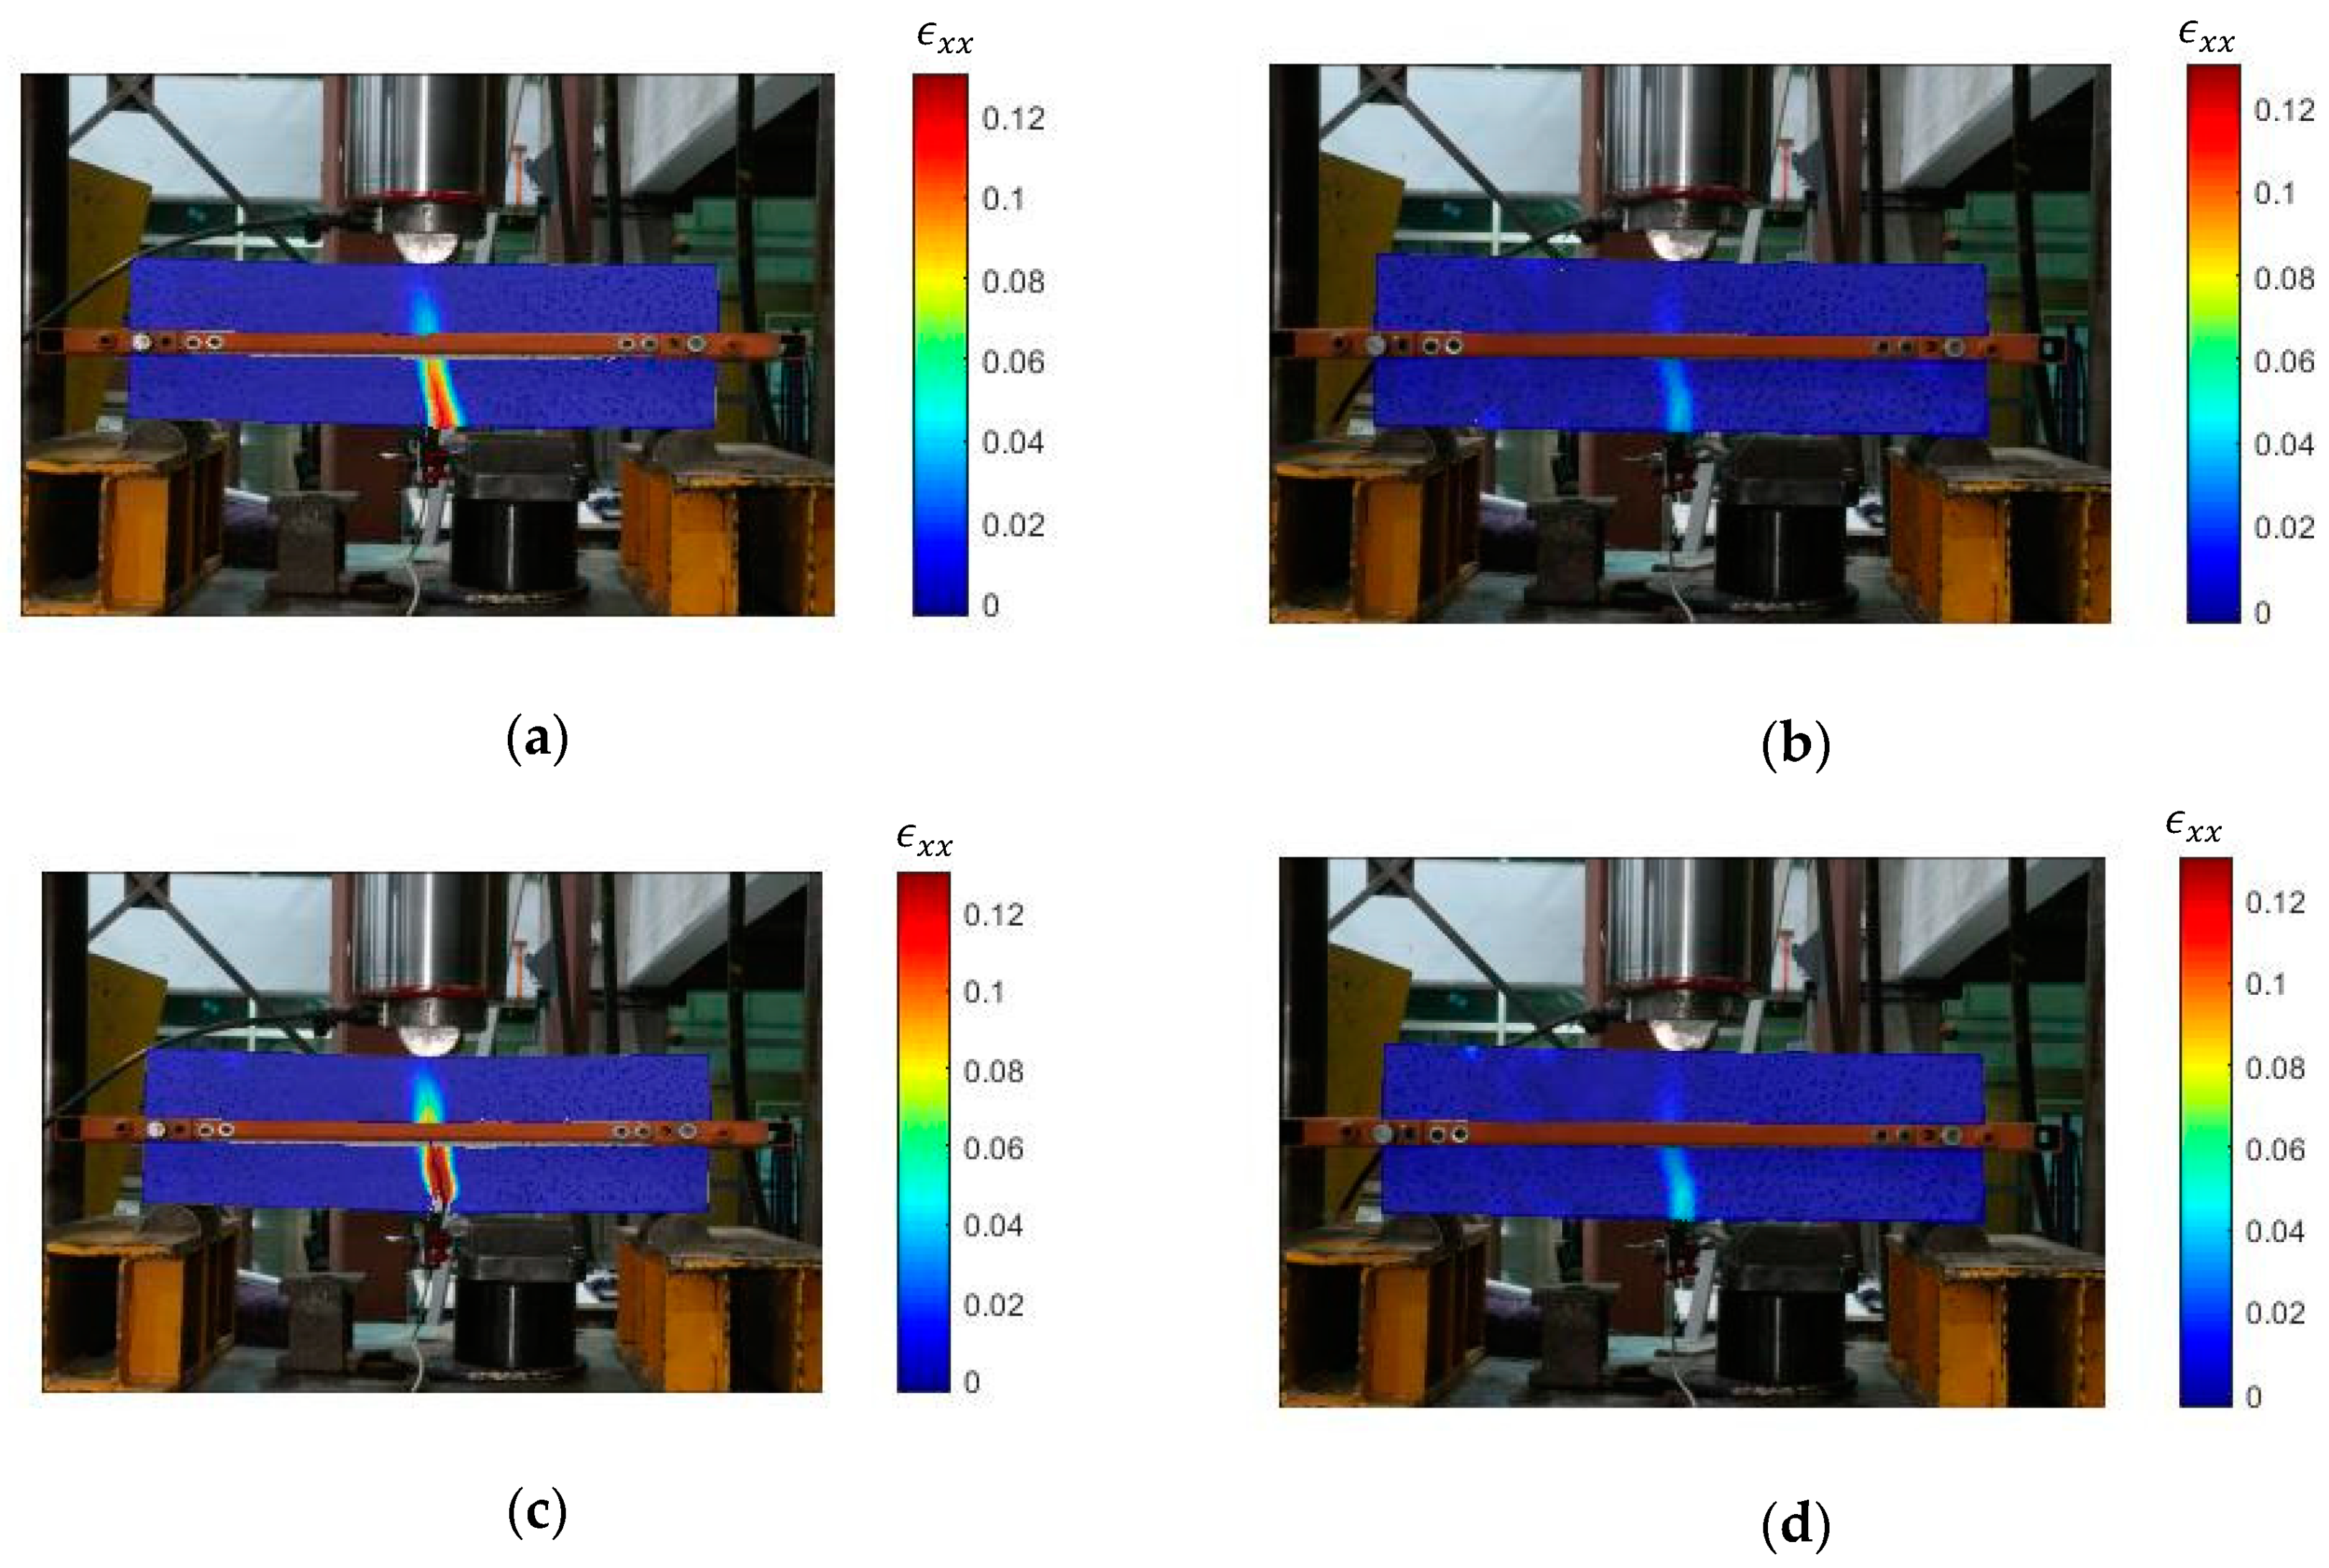
Figure 8 provides the results of the DIC analysis for prism specimens of mortar mixes M0-0 and M8-50. Figure 8a,b shows the resulting axial horizontal strains () obtained immediately at the occurrence of the first crack in M0-0 and M8-50, respectively, and it is evident that values in the cracking area were much larger in M0-0 compared to M8-50. The latter behavior evidenced that the fiber-reinforced prism (M8-50) was able to sustain a remaining fraction of the peak load, whereas the unreinforced beam was unable to sustain almost any load after cracking. Figure 8c,d shows the resulting values obtained immediately after the occurrence of the first crack (approximately 4 s after images of Figure 8a,b in M0-0 and M8-50, respectively). From Figure 8c,d it can be observed the wide crack propagation and opening of M0-0 (leading to its collapse), whereas the crack propagation and opening of M8-50 was very small and the beam could still sustain around 20% of its peak load. Results of DIC for the remaining mortar mixes are not presented in this paper since the fracture behavior of those mixes was very similar (brittle behavior) to the behavior of M0-0 as confirmed by the load-midspan displacement curves shown in Figure 9 and discussed later in this paper. The DIC images confirm that addition of RPFs contribute to reduce the crack mouth opening displacement of mortar under bending. Regardless of the latter, the RPFs cannot delay crack onset and propagation as observed in Figure 8.
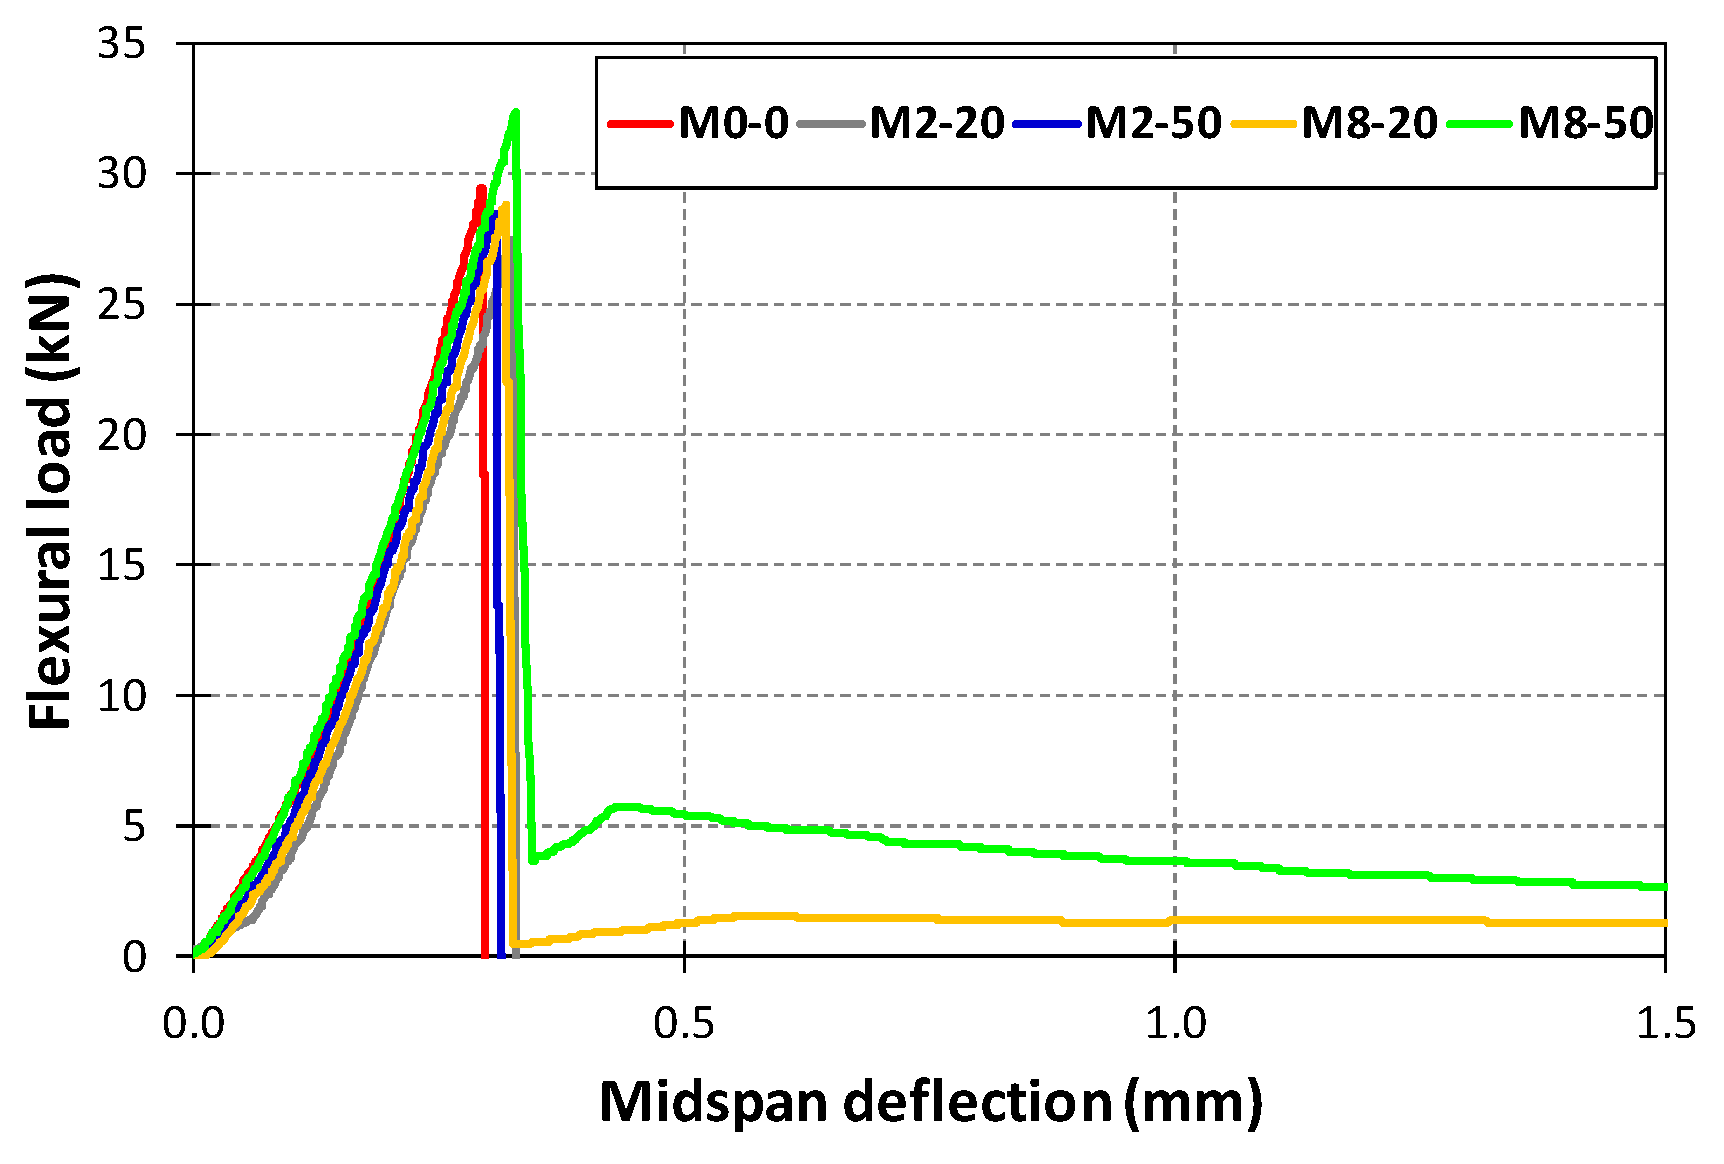
Figure 9 presents representative flexural-load versus midspan-deflection curves for each mortar mix and similar performances were obtained for the remaining five prism specimens tested for each mortar mix. Figure 9 shows that for all mortar mixes there was a linear increasing behavior of the flexural load until reaching its peak and then an abrupt load-drop occurred due to the generation of cracking at the bottom of the specimens. For mortar mixes M0-0, M2-20, and M2-50, the specimens were no longer able to sustain any residual load after the occurrence of the cracking, whereas in the case of mortar mixes M8-20 and M8-50 the specimens were able to sustain some residual load (e.g., approximately 20% of its peak in the case of M8-50) and larger displacements after the crack occurrence and abrupt load-drop. The displacement where the first crack occurred varied between 0.26 and 0.33 mm and fiber-reinforced specimens showed a slightly larger displacement at cracking compared to unreinforced specimens. For mortar mix M0-0 the collapse failure corresponded to a brittle failure of the mortar matrix where tension loads were not sustained at the bottom of the prism specimens after the occurrence of a major crack. In the case of mortar mixes M2-20 and M2-50, although these mixes correspond to fiber-reinforced prism specimens, as characterized in this paper, the roughness of the RPFs was low, and, consequently, the mechanical bonding between the RPFs and the mortar matrix was also low. Therefore, when the major crack occurred the tension load was transferred to the fibers at the bottom of the specimens, but probably the fiber length (M2-20) and the fiber dosage (M2-50) were not enough to totally transfer the load, fiber was pulled out of the mortar matrix and the specimens exhibited a brittle collapse failure as they were unreinforced. The previous analyses are aligned with what has been detected on fiber reinforced concrete (FRC) with low fiber dosages (e.g., volumes of fiber <0.5%) where the ultimate flexural strength coincided with the first cracking strength and the flexural load-deflection curve descended immediately [42].
In the case of mortar mix M8-20, the larger fiber dosage allowed a larger number of fibers crossing the crack at the bottom of the specimen (compared to M2-20 and M2-50) and, thus, some residual tension load could be transferred from the cracked matrix to the fibers. Finally, in the case of mortar mix M8-50, the larger fiber dosage and longer fibers also allowed a larger number of fibers crossing the crack at the bottom of the specimen (compared to M2-20 and M2-50), but these fibers were also longer (compared to M8-20), leading to a larger fiber aspect ratio. Therefore, more residual tension load (compared to M8-20) was transferred from the cracked matrix to the fibers. The previous analyses are also consistently aligned with FRC with volumes of fiber >0.5% [42], where some load can be transferred to the fibers after the failure of the matrix.
The previous analyses can be complemented with the quantitative information provided by the flexural toughness indices, whose statistic information is provided in Table 7. As expected after analyzing the brittle failure modes of M0-0, M2-20 and M2-50, their values of I5, I10 and I20 were approximately 1.0. In the case of mortar mixes M8-20 and M8-50, the incorporation of fibers had a positive impact on the flexural toughness indices, I5, I10 and I20, where the increment in length (from 20 to 50 mm) showed the larger impact increasing toughness for fiber dosage of 8 kg/m3. Regardless of the latter, the values of flexural toughness indices for mortar mixes M8-20 and M8-50 represent only a residual toughness considering that the flexural post peak load reaches only up to 20% of the peak load (M8-50).
3.4. Impact Strength
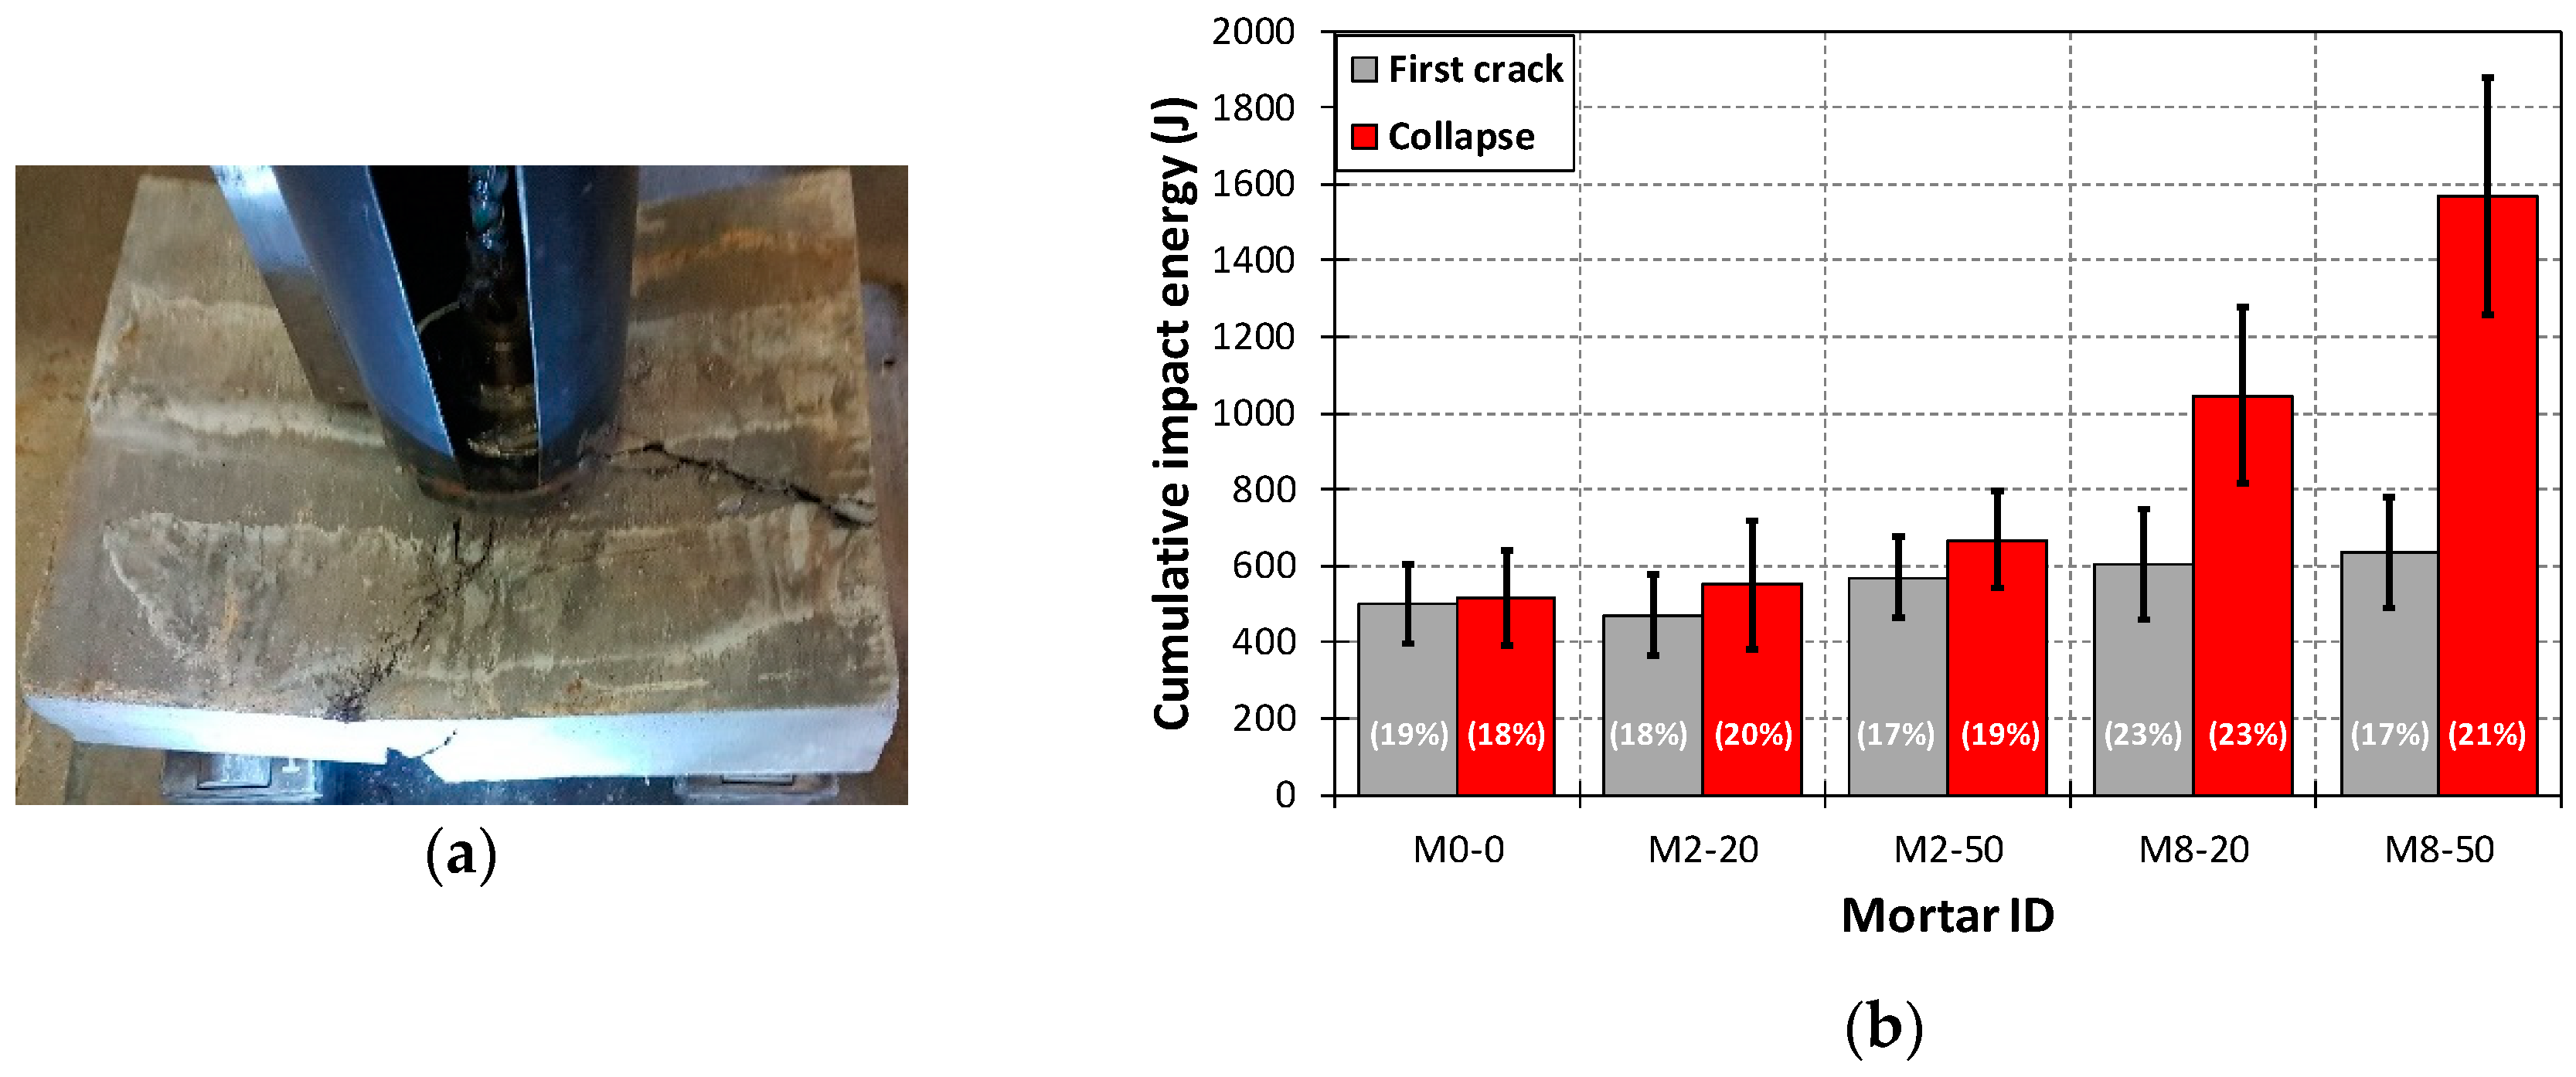
Figure 10a shows a picture of a mortar mix M8-50 slab specimen tested under impact strength and it can be seen how the parts of slab were still held together even when the damage was fully developed from the impact zone to the edges of the specimen. Addition of these fibers allowed the slab to sustain more impact energy after the occurrence of the first crack and before the final collapse of the slab due to the addition of RPFs. On the contrary, unreinforced slab specimens (M0-0) showed a brittle failure since the first crack, in general, coincided with the collapse of the specimens.
Figure 10b shows AV (bars), SD (error bars) and COV (percentages in each bar) values of the impact strengths (at first crack and at collapse) of each mortar tested. In the case of impact cumulative energy at first crack, the AV, SD and COV results ranged from 472 J (M2-20) to 634 J (M8-50), from 86 J (M2-20) to 139 J (M8-20), and from 17% (M2-60) to 23% (M8-20), respectively. In the case of impact cumulative impact energy at collapse (impact strength), the AV, SD and COV results range from 516 J (M0-0) to 1568 J (M8-50), from 91 J (M0-0) to 322 J (M8-50), and from 18% (M0-0) to 23% (M8-20), respectively. The increment in AV cumulative impact energy at collapse (compared to mortar mix M0-0) range from 7% (M2-20) to 204% (M8-50).
As shown in Figure 10b, it can be observed that (i) there was no statistical change in the AV cumulative impact energy at first crack while (ii) there were statistical changes in the AV cumulative impact energy at collapse for the fiber-reinforced mortar mixes with higher fiber content (M8-20 and M8-50). The former (i) is an indication that before crack occurs, the matrix withstands the impact load with little contribution from the fibers. On the contrary, the latter (ii) indicates that after crack occurs, fibers are responsible to withstand the impact load, especially on mortars with the largest fiber content. Specifically, for the mortars with the largest fiber content, AV cumulative impact energy at collapse increased proportional to fiber length. The described behavior before and after the crack occurs in the impact test was consistent with the flexural response before (no contribution from the fibers) and after the crack forms (load transfer throughout the fibers) depicted in Figure 9. Statistically significant changes in the AV impact strengths at collapse were already addressed using 8 kg of pig hair fibers per m3 of mortar by Araya Letelier et al. [18]. The pig fibers where 30 mm long and the same order of magnitude fiber diameter and of AV roughness as RPF [18].
The effectiveness of RPF in the impact strength of mortars depends on the tensile strength of the fiber but also on the interface strength between the matrix and the fiber as stated in a previous work [39]. Antico et al. showed that the load capacity of fibers can be maximized when fiber surface roughness is maximized also [43]. RPFs presented low roughness compared to commercial fibers (roughness of Sika Fiber®Force PP-48 fibers are more than two orders of magnitude of roughness of RPFs), it is possible that if roughness of RPFs could be improved less fiber content and more effect of fiber length could be expected to achieve similar performance to the one reported in this work.
The latter findings were further analyzed implementing ANOVA tests (see Table 8). It can be seen that AV impact strengths at the occurrence of the first crack were not statically affected by the incorporation of RPFs (see first crack-one way ANOVA test in Table 8). The latter result can be explained by the fact that the impact strength at first crack depends mostly on the matrix behavior, which is brittle for all the mixes. In the case of the cumulative impact energy at collapse, there was a statistically significant difference between AV values (see collapse-one way ANOVA test in Table 8). To further investigate the statistically significant differences of AV impact strengths at collapse, pair-wise tests were implemented for each reinforced mortar against the plain mortar and mortar mixes M2-50, M8-20 and M8-50 showed significant statistically differences that were ratified by the p-values obtained for those pair-wise tests.
4. Comments and Conclusions
This paper addressed the characterization of recycled polypropylene fibers (RPFs) obtained from discarded plastic sweeps, and then evaluated the use of these RPFs as fiber reinforcement in cement-based mortars. The impact of these RPFs on the mechanical-damage mortars’ behavior was assessed comparing the performance of plain mortar specimens against the performance of RPF-reinforced mortar specimens with different fiber dosages (2 and 8 kg/m3 of mortar) and different fiber lengths (20 and 50 mm) in terms of compressive strength, flexural strength and toughness, and impact strength. The following comments and conclusions can be drawn.
- Morphologically, RPFs presented low surface roughness values that were, on average, 250 times smaller than the average surface roughness value of a commercial polypropylene macro fiber specially designed to reinforce cement-based materials. Consequently, the interface strength between mortar and RPFs is expected to be lower than commercial polypropylene fibers specifically designed as fiber reinforcement. Increasing roughness of RPFs could be a path to achieve improved toughness and crack control using these fibers.
- Plain and fiber-reinforced mortar mixes presented a brittle failure mode of the matrix (sudden drop of load) under flexural testing. After peak load, plain mortar mixes as well as mortar mixes with small fiber dosages (2 kg/m3) exhibited a similar behavior where the specimens were no longer able to sustain any residual load and they collapsed immediately. Only in the case of mortar mixes with larger fiber dosages (8 kg/m3) the specimens were able to sustain some residual load and larger displacements before collapse. The latter was reflected in their values of flexural toughness indices, and those residual loads and increments in displacements were larger for specimens with 50 mm fiber length.
- In terms of impact strength, there was no statistically significant difference in the average cumulative impact energy value at the occurrence of the first crack among the mortar mixes, which confirms that the occurrence of the first crack depends mostly on the brittle behavior of the mortar matrix. In terms of average cumulative impact energy values at collapse, there was a statistically significant difference between the average performances of 8 kg/m3 fiber-reinforced mortar mixes compared to plain mortar. More work needs to be done in terms of fiber length sensitivity as changes of impact strength were observed as result of fiber length changes in mortars with 8 kg/m3 of RPF. The incorporation of these RPFs were able to distribute the damage across the specimens allowing increments of average impact strength up to 204%.
This paper recommends the use of long fiber lengths (e.g., 50 mm) and large fiber dosages (e.g., 8 kg/m3) to effectively achieve a load transfer between the RPFs and the matrix and, consequently, to enhance the fracture performance of mortars in terms of flexural toughness and impact strength, without affecting the mechanical performance of mortars. In the case of short RPFs (e.g., 20 mm), their incorporation still generates environmental benefits since these waste-based short fibers can be encapsulated, reducing the disposal of this waste in landfill, without impacting the overall mechanical-damage performance of mortar mixes.
Author Contributions
Conceptualization, G.A.-L., P.M. and F.C.A.; Formal analysis, G.A.-L., P.M., M.C. and F.C.A.; Investigation, G.A.-L. and M.C.; Methodology, G.A.-L., F.C.A. and M.S.G.; Project administration, G.A.-L.; Software, G.A.-L.; Supervision, G.A.-L.; Writing—original draft, G.A.-L. and F.C.A.; Writing—review & editing, P.M., M.C., F.C.A. and M.S.G.
Funding
This research was partially funded by Pontificia Universidad Católica de Chile, Programa de inserción académica, PIA 3581-050-81.
Acknowledgments
The authors acknowledge the support of Ursula Reidel (Sika S.A. Chile) in the execution of part of this experimental plan and the assistance of the undergraduate students Camila Aravena, Sabine Kunze, Francisca Díaz, Diego Anríquez, Alejandro D’ardaillon and the technical stuff of the Faculty of Engineering at the Pontificia Universidad Católica de Chile in the specimen confection and execution of the experimental plan. Additionally, Sika S.A. Chile, for donating some of the materials used in this study and for facilitating its laboratory facilities for part of the experimental work presented.
Conflicts of Interest
The authors declare no conflict of interest.
References
- Solas, A.; Giani, R. Tecnología del Hormigón Avanzada, 2nd ed.; Ediciones UC: Santiago, Chile, 2014; ISBN 1000000004595. [Google Scholar]
- Antico, F.C.; De La Varga, I.; Esmaeeli, H.S.; Nantung, T.E.; Zavattieri, P.D.; Weiss, W.J. Using accelerated pavement testing to examine traffic opening criteria for concrete pavements. Constr. Build. Mat. 2015, 96, 86–95. [Google Scholar] [CrossRef]
- Mindess, S.; Young, J.F.; Darwin, D. Concrete, 2nd ed.; Prentice Hall: Upper Saddle River, NJ, USA, 2002; ISBN 0-13-064632-6. [Google Scholar]
- Barcelo, L.; Kline, J.; Walenta, G.; Gartner, E. Cement and carbon emissions. Mat. Struct. 2014, 47, 1055–1065. [Google Scholar] [CrossRef]
- Geissdoerfer, M.; Savaget, P.; Bocken, N.M.P.; Hultink, E.J. The Circular Economy—A new sustainability paradigm? J. Clean. Prod. 2017, 143, 757–768. [Google Scholar] [CrossRef]
- Gopalaratnam, V.S.; Shah, S.P. Tensile failure of steel fiber-reinforced mortar. J. Eng. Mech. 1987, 113, 635–652. [Google Scholar] [CrossRef]
- Grzybowski, M.; Shah, S.P. Shrinkage cracking of fiber reinforced concrete. Mat. J. 1990, 87, 138–148. [Google Scholar]
- Olivito, R.S.; Zuccarello, F.A. An experimental study on the tensile strength of steel fiber reinforced concrete. Compos. Part B Eng. 2010, 41, 246–255. [Google Scholar] [CrossRef]
- Firmo, J.P.; Correia, J.R.; Bisby, L.A. Fire behaviour of FRP-strengthened reinforced concrete structural elements: A state-of-the-art review. Compos. Part B Eng. 2015, 80, 198–216. [Google Scholar] [CrossRef]
- Shin, K.; Jang, K.; Choi, Y.; Lee, S. Flexural Behavior of HPFRCC Members with Inhomogeneous Material Properties. Materials 2015, 8, 1934–1950. [Google Scholar] [CrossRef] [Green Version]
- Song, W.; Yin, J. Hybrid effect evaluation of steel fiber and carbon fiber on the performance of the fiber reinforced concrete. Materials 2016, 9, 704. [Google Scholar] [CrossRef]
- Feng, J.; Sun, W.; Zhai, H.; Wang, L.; Dong, H.; Wu, Q. Experimental Study on Hybrid Effect Evaluation of Fiber Reinforced Concrete Subjected to Drop. Materials 2018, 11, 2563. [Google Scholar] [CrossRef]
- Zhou, Y.; Xiao, Y.; Gu, A.; Lu, Z. Dispersion, Workability and Mechanical Properties of Different Steel-Microfiber-Reinforced Concretes with Low Fiber Content. Sustainability 2018, 10, 2335. [Google Scholar] [CrossRef]
- European Commission. A European Strategy for Plastics in a Circular Economy; European Commission: Brussels, Belgium, 2018. [Google Scholar]
- Yang Qin, M. Global fibres overview. In Proceedings of the Synthetic Fibres Raw Materials Committee Meeting at APIC, Pattaya, Thailand, 16 May 2014. [Google Scholar]
- Geyer, R.; Jambeck, J.R.; Law, K.L. Production, use, and fate of all plastics ever made. Sci. Adv. 2017, 3, e1700782. [Google Scholar] [CrossRef]
- Araya-Letelier, G.; Antico, F.C.; Parra, P.; Carrasco, M. Fiber-Reinforced Mortar Incorporating Pig Hair. Adv. Eng. Forum 2017, 21, 219–225. [Google Scholar] [CrossRef]
- Araya-Letelier, G.; Antico, F.C.; Carrasco, M.; Rojas, P.; García-herrera, C.M. Effectiveness of new natural fibers on damage-mechanical performance of mortar. Constr. Build. Mat. 2017, 152, 672–682. [Google Scholar] [CrossRef]
- Ramakrishna, G.; Sundararajan, T. Impact strength of a few natural fibre reinforced cement mortar slabs: A comparative study. Cem. Concr. Compos. 2005, 27, 547–553. [Google Scholar] [CrossRef]
- Shon, C.-S.; Mukashev, T.; Lee, D.; Zhang, D.; Kim, J. Can Common Reed Fiber Become an Effective Construction Material? Physical, Mechanical, and Thermal Properties of Mortar Mixture Containing Common Reed Fiber. Sustainability 2019, 11, 903. [Google Scholar] [CrossRef]
- Araya-Letelier, G.; Antico, F.C.; Urzua, J.; Bravo, R. Physical-mechanical characterization of fiber-reinforced mortar incorporating pig hair. In Proceedings of the 2nd International Conference on Bio-based Building Materials & 1st Conference on ECOlogical valorisation of GRAnular and FIbrous materials, Clermont-Ferrand, France, 21–23 June 2017. [Google Scholar]
- Koo, B.; Kim, J.J.; Kim, S.; Mun, S. Material and Structural Performance Evaluations of Hwangtoh Admixtures and Recycled PET Fiber-Added Eco-Friendly Concrete for CO2 Emission Reduction. Materials 2014, 7, 5959–5981. [Google Scholar] [CrossRef]
- Bendjillali, K.; Chemrouk, M.; Goual, M.S. Behaviour of polypropylene fibre mortars conserved in different environments. Eur. J. Environ. Civil Eng. 2013, 17, 687–699. [Google Scholar] [CrossRef]
- Bendjillali, K.; Chemrouk, M.; Boulekbache, B. Performances of cementitious mortars containing recycled synthetic fibres under hot-dry climate. Eur. J. Environ. Civil Eng. 2017, 8189, 1–13. [Google Scholar] [CrossRef]
- Bendjillali, K.; Chemrouk, M. Study of the reinforcement of structure members by polypropylene fibres waste. MATEC Web Conf. 2018, 149, 01022. [Google Scholar] [CrossRef]
- Pacheco-Torgal, F.; Khatib, J.; Colangelo, F.; Tuladhar, R. (Eds.) Use of Recycled Plastics in Eco-Efficient Concrete; Woodhead Publishing: Cambridge, UK, 2018. [Google Scholar]
- Sika Chile, S.A. SikaFiber(R) Force PP-48; P.T. Sika Chile: Santiago, Chile, 2014. (In Spanish) [Google Scholar]
- German Institute for Standardization. Surface Roughness Associated with Types of Manufacturing Methods—Attainable Arithmetical Mean Value of Peak-to-Valley Height; DIN 4766-81; DIN: Berlin, Germany, 1981. [Google Scholar]
- ASTM International. Standard Specification for Fiber-Reinforced Concrete; ASTM C1116/C1116M-10a; ASTM International: West Conshohocken, PA, USA, 2015. [Google Scholar]
- BS EN 12390-3 Testing Hardened Concrete: Compressive Strength of Test Specimens; 17/30360096 DC; BSI: London, UK, 2009.
- Ncorr v1.2 Open Source 2D-DIC Matlab Software; Georgia Institute of Technology: Atlanta, GA, USA, 2014.
- Araya-Letelier, G.; Concha-Riedel, J.; Antico, F.C.; Valdés, C.; Cáceres, G. Influence of Natural Fiber Dosage and Length on Adobe Mixes Damage-Mechanical Behavior. Constr. Build. Mat. 2018, 174, 645–655. [Google Scholar] [CrossRef]
- Araya-Letelier, G.; Concha-Riedel, J.; Antico, F.C.; Sandoval, C. Experimental mechanical-damage assessment of earthen mixes reinforced with micro polypropylene fibers. Constr. Build. Mat. 2019, 198, 762–776. [Google Scholar] [CrossRef]
- Araya-Letelier, G.; Antico, F.C.; Concha-Riedel, J.; Glade, A.; Wiener, M.J. Effectiveness of Polypropylene Fibers on Impact and Shrinkage Cracking Behavior of Adobe Mixes. In Earthen Dwellings and Structures Effectiveness; Reddy, B.V.V., Mani, M., Walker, P., Eds.; Springer: Singapore, 2019; ISBN 978-981-13-5883-8. [Google Scholar]
- Pereira de Oliveira, L.A.; Castro-Gomes, J.P. Physical and mechanical behaviour of recycled PET fibre reinforced mortar. Constr. Build. Mat. 2011, 25, 1712–1717. [Google Scholar] [CrossRef]
- Concha-Riedel, J.; Araya-Letelier, G.; Antico, F.C.; Reidel, U.; Glade, A. Influence of Jute Fibers to Improve Flexural Toughness, Impact Resistance and Drying Shrinkage Cracking in Adobe Mixes. In Earthen Dwellings and Structures; Reddy, B.V.V., Mani, M., Walker, P., Eds.; Springer: Singapore, 2019; ISBN 978-981-13-5883-8. [Google Scholar]
- American Society for Testing and Materials. Standard Test Method for Flexural Toughness and First-Crack Strength of Fiber-Reinforced Concrete (Using Beam with Third-Point Loading) (Withdrawn 2006); ASTM C1018-97; ASTM International: West Conshohocken, PA, USA, 1997. [Google Scholar]
- Fantilli, A.P.; Sicardi, S.; Dotti, F. The use of wool as fiber-reinforcement in cement-based mortar. Constr. Build. Mat. 2017, 139, 562–569. [Google Scholar] [CrossRef]
- Araya-Letelier, G. Design of Building Structural Systems and Enhanced Partition Walls to Improve Life Cycle Costs Associated with Risk of Earthquake Damage. Ph.D. Thesis, Stanford University, Stanford, CA, USA, 2014. [Google Scholar]
- Devore, J.L. Probability and Statistics for Engineering and the Sciences; Cengage Learning: Boston, MA, USA, 2011; ISBN 978-0-495-38223-2. [Google Scholar]
- Antico, F.C.; Zavattieri, P.; Hector, L., Jr.; Mance, A.; Rodgers, W.-R.; Okonski, D.A. Adhesion of nickel–titanium shape memory alloy wires to thermoplastic materials: Theory and experiments. Smart Mat. Struct. 2012, 21, 035022. [Google Scholar] [CrossRef]
- Zia, P.; Ahmad, S.; Leming, M. High-Performance Concretes: A State-Of-Art Report (1989–1994); FHWA-RD-97-030; Federal Highway Administration: Washington, DC, USA, 1997.
- Antico, F.C.; Zavattieri, P.D.; Hector, L.G., Jr.; Mance, A.; Rodgers, W.R.; Okonski, D.A. Adhesion of Nickel-Titanium Shape Memory Alloy Wires to Polymeric Materials: Theory and Experiment. Suppl. Proc. Mat. Prop. Charact. Model. 2012, 2, 563–576. [Google Scholar]
Figure 1.
(a) Used and discarded domestic sweep; and (b) 50 and 20 mm long recycled polypropylene fibers (RPFs) obtained.
Figure 1.
(a) Used and discarded domestic sweep; and (b) 50 and 20 mm long recycled polypropylene fibers (RPFs) obtained.

Figure 2.
RPFs used in this study and Sika Fiber®Force PP-48 fibers.

Figure 3.
Flexural strength test setup.

Figure 4.
Impact strength test setup: (a) drawing; and (b) actual slab being tested.

Figure 5.
Morphological analysis including photography, microscopy and 3D surface elevation of: (a) RPFs; and (b) Sika Fiber®Force PP-48.
Figure 5.
Morphological analysis including photography, microscopy and 3D surface elevation of: (a) RPFs; and (b) Sika Fiber®Force PP-48.


Figure 6.
Compressive strength average (AV), standard deviation (SD), and coefficient of variation (COV) values for each mortar mix.
Figure 6.
Compressive strength average (AV), standard deviation (SD), and coefficient of variation (COV) values for each mortar mix.

Figure 7.
Flexural strength AV, SD, and COV values for each mortar mix.

Figure 8.
Digital image correlation (DIC) strain evaluation of flexural performance: (a) M0-0 at cracking; (b) M8-50 at cracking; (c) M0-0 immediately after cracking; and (d) M8-50 immediately after cracking.
Figure 8.
Digital image correlation (DIC) strain evaluation of flexural performance: (a) M0-0 at cracking; (b) M8-50 at cracking; (c) M0-0 immediately after cracking; and (d) M8-50 immediately after cracking.

Figure 9.
Representative flexural-load versus midspan-deflection curves for each mortar mix.

Figure 10.
Impact strength: (a) mortar mix M8-50 slab specimen showing damage distribution; and (b) cumulative impact energy for each mortar mix.
Figure 10.
Impact strength: (a) mortar mix M8-50 slab specimen showing damage distribution; and (b) cumulative impact energy for each mortar mix.


Table 1.
Materials’ properties of mortars.
| Materials | Properties | ||
|---|---|---|---|
| Cement | Portland Cement (High Strength) | ||
| Blaine fineness: 355 (m2/kg) Density: 3.2 (g/cm3) | |||
| Sand | Type (a) | Type (b) | |
| Density (g/cm3): | 2.63 | 2.53 | |
| Water absorption (%): | 2.55 | 2.37 | |
| Fineness modulus (dimensionless): | 2.65 | 1.17 | |
| Water | Potable | ||
| Plasticizer | Type: Lignosulphonate based. Density: 1.15 (g/cm3) | ||
Table 2.
Properties of recycled polypropylene plastic fiber.
| Diameter (mm) | Density (g/cm3) | Water Absorption (%) | Tensile Strength (MPa) | Young’s Modulus (GPa) | Elongation to Break (%) |
|---|---|---|---|---|---|
| 0.38 to 0.51 | 0.99 | 0 | 250 | 5 | 55 |
Table 3.
Material proportions of mortar mixes.
| Mortar Mix ID# | W/C 1 | Cement (kg/m3) | Water (kg/m3) | Sand 2 (kg/m3) | P 3 (kg/m3) | Fiber (kg/m3) | Fiber (mm) | |
|---|---|---|---|---|---|---|---|---|
| (a) | (b) | |||||||
| M0-0 | 0.55 | 450 | 247.5 | 168.5 | 1330.5 | 3.15 | 0 | 0 |
| M2-20 | 2 | 20 | ||||||
| M2-50 | 2 | 50 | ||||||
| M8-20 | 8 | 20 | ||||||
| M8-50 | 8 | 50 | ||||||
1 Water-cement ratio; 2 In saturated surface dry condition; 3 Plasticizer (0.7% in weight of cement).
Table 4.
Specification of specimens.
| Name | Dimensions (mm) | Test | Specimens for Each Mortar Mix |
|---|---|---|---|
| Cube | 150 × 150 × 150 | Compressive strength (28 days) | 6 |
| Prism | 150 × 150 × 500 | Flexural strength and toughness (28 days) | 6 |
| Slab | 100 × 300 × 400 | Impact strength (28 days) | 6 |
Table 5.
Analysis of variance (ANOVA) test (5% significance level) for compressive strength at 28 days.
Table 5.
Analysis of variance (ANOVA) test (5% significance level) for compressive strength at 28 days.
| Test | Source | DF | SS | MS | fst | Fcr | p-Value | Statistically Significant? |
|---|---|---|---|---|---|---|---|---|
| All mortar mixes (one way ANOVA) | Treatment (RPF) | 4 | 72.80 | 18.20 | 2.66 | 2.76 | 0.056 | Not |
| Error | 25 | 171.07 | 6.84 |
Table 6.
ANOVA test (5% significance level) for flexural strength at 28 days.
| Test | Source | DF | SS | MS | fst | Fcr | p-Value | Statistically Significant? |
|---|---|---|---|---|---|---|---|---|
| All mortar mixes (one way ANOVA) | Treatment (RPF) | 4 | 1.16 | 0.29 | 2.27 | 2.76 | 0.090 | Not |
| Error | 25 | 3.19 | 0.13 |
Table 7.
Flexural toughness indices for each mortar mix.
| ID | I5 | I10 | I20 | |||
|---|---|---|---|---|---|---|
| AV | SD | AV | SD | AV | SD | |
| M0-0 | 1.00 | 0.00 | 1.00 | 0.00 | 1.00 | 0.00 |
| M2-20 | 1.00 | 0.00 | 1.00 | 0.00 | 1.00 | 0.00 |
| M2-50 | 1.03 | 0.03 | 1.03 | 0.03 | 1.03 | 0.03 |
| M8-20 | 1.23 | 0.11 | 1.62 | 0.21 | 1.76 | 0.25 |
| M8-50 | 1.86 | 0.19 | 2.63 | 0.38 | 2.96 | 0.44 |
Table 8.
ANOVA test (5% significance level) for impact strength at 28 days.
| Test | Source | DF | SS | MS | fst | Fcr | p-Value | Statistically Significant? |
|---|---|---|---|---|---|---|---|---|
| All mortar mixes (first crack-one way ANOVA) | Treatment (RPF) | 4 | 1.1 × 10⁵ | 2.8 × 10⁴ | 2.53 | 2.76 | 0.0658 | Not |
| Error | 25 | 2.8 × 10⁵ | 1.1 × 10⁴ | |||||
| All mortar mixes (collapse-one way ANOVA) | Treatment (RPF) | 4 | 4.7 × 10⁶ | 1.2 × 10⁶ | 30.23 | 2.76 | <1 × 10⁻⁵ | Yes |
| Error | 25 | 9.8 × 10⁵ | 3.9 × 10⁴ | |||||
| M0-0 versus M2-20 (collapse-pair wise ANOVA) | Treatment (RPF) | 1 | 3.5 × 10³ | 3.5 × 10³ | 0.36 | 4.96 | 0.564 | Not |
| Error | 10 | 1.0 × 10⁵ | 1.0 × 10⁴ | |||||
| M0-0 versus M2-50 (collapse-pair wise ANOVA) | Treatment (RPF) | 1 | 7.0 × 10⁴ | 7.0 × 10⁴ | 5.94 | 4.96 | 0.035 | Yes |
| Error | 10 | 1.2 × 10⁵ | 1.2 × 10⁴ | |||||
| M0-0 versus M8-20 (collapse-pair wise ANOVA) | Treatment (RPF) | 1 | 8.5 × 10⁵ | 8.5 × 10⁵ | 26.37 | 4.96 | <4 × 10⁻⁴ | Yes |
| Error | 10 | 3.2 × 10⁵ | 3.2 × 10⁴ | |||||
| M0-0 versus M8-50 (collapse-pair wise ANOVA) | Treatment (RPF) | 1 | 3.3 × 10⁶ | 3.3 × 10⁶ | 59.14 | 4.96 | <2 × 10⁻⁵ | Yes |
| Error | 10 | 5.6 × 10⁵ | 5.6 × 10⁴ |
© 2019 by the authors. Licensee MDPI, Basel, Switzerland. This article is an open access article distributed under the terms and conditions of the Creative Commons Attribution (CC BY) license (http://creativecommons.org/licenses/by/4.0/).
Share and Cite
MDPI and ACS Style
Araya-Letelier, G.; Maturana, P.; Carrasco, M.; Antico, F.C.; Gómez, M.S. Mechanical-Damage Behavior of Mortars Reinforced with Recycled Polypropylene Fibers. Sustainability 2019, 11, 2200. https://doi.org/10.3390/su11082200
AMA Style
Araya-Letelier G, Maturana P, Carrasco M, Antico FC, Gómez MS. Mechanical-Damage Behavior of Mortars Reinforced with Recycled Polypropylene Fibers. Sustainability. 2019; 11(8):2200. https://doi.org/10.3390/su11082200
Chicago/Turabian StyleAraya-Letelier, Gerardo, Pablo Maturana, Miguel Carrasco, Federico Carlos Antico, and María Soledad Gómez. 2019. "Mechanical-Damage Behavior of Mortars Reinforced with Recycled Polypropylene Fibers" Sustainability 11, no. 8: 2200. https://doi.org/10.3390/su11082200
Note that from the first issue of 2016, this journal uses article numbers instead of page numbers. See further details here.